american electric power service corporation · american electric power: this report is provided...
TRANSCRIPT

Mountaineer Commercial Scale Carbon Capture and Storage (CCS) Project
CO2 Storage Report Page 1 of 61
Project No.: PRO 004
Recipient: American Electric Power Service Corporation
Project: Mountaineer Commercial Scale Carbon Capture and Storage (CCS) Project
Date: November 22, 2011
Prepared By: Indrajit Bhattacharya, PhD.

Mountaineer Commercial Scale Carbon Capture and Storage (CCS) Project
CO2 Storage Report Page 2 of 61 Disclaimers
US Department of Energy: This report was prepared as an account of work sponsored by an agency of the United States Government. Neither the United States Government nor any agency thereof, nor any of their employees, makes any warranty, express or implied, or assumes any legal liability or responsibility for the accuracy, completeness, or usefulness of any information, apparatus, product, or process disclosed, or represents that its use would not infringe privately owned rights. Reference herein to any specific commercial product, process, or service by trade name, trademark, manufacturer, or otherwise does not necessarily constitute or imply its endorsement, recommendation, or favoring by the United States Government or any agency thereof. The views and opinions of authors expressed herein do not necessarily state or reflect those of the United States Government or any agency thereof.
American Electric Power: This report is provided “as-is” and with no warranties, express or implied, whatsoever for the use or the accuracy of the information contained therein. Use of the report and the information found therein is at the sole risk of the recipient. American Electric Power Company, its affiliates and subsidiaries, shall not be liable in any way for the accuracy of any information contained in the report, including but not limited to, any errors or omissions in any information content; or for any loss or damage of any kind incurred as the result of the use of any of the information.
Acknowledgement
This material is based upon work supported by the US Department of Energy Award Number DE-FE0002673.

Mountaineer Commercial Scale Carbon Capture and Storage (CCS) Project
CO2 Storage Report Page 3 of 61 Table of Contents
List of Tables.......................................................................................................... 4 List of Figures ........................................................................................................ 5 Executive Summary................................................................................................ 6 1.0 Introduction and Project Overview .................................................................. 7
1.1 Background................................................................................................... 7 1.2 Project Scope................................................................................................ 9
2.0 Discussion of Conceptual CO2 Storage System Design for MT CCS II .............. 10 2.1 Regional Geology ........................................................................................ 10 2.2 Description of Local Geology....................................................................... 11
2.2.1 2D Seismic Study.................................................................................. 15 2.2.2 Borrow Area Characterization Well....................................................... 17
(i) Drilling timeline..................................................................................... 18 (ii) Equipment, Fluids and Drill Bits............................................................ 20 (iii) Casing, cementing and wellhead ......................................................... 21 (iv) Logging ............................................................................................... 23 (v) Coring................................................................................................... 26 (vi) Integration of log and core.................................................................. 28
2.2.3 Hydrological well testing ...................................................................... 30 (i) Phase-I ................................................................................................. 30 (ii) Phase-II ............................................................................................... 32
2.2.4 Planned Additional Geophysical Data.................................................... 36 (i) Jordan Tract Characterization Well ....................................................... 36 (ii) 3D Seismic Survey................................................................................ 36
2.3 Reservoir Modeling ..................................................................................... 37 2.3.1 Reservoir Model Description ................................................................. 37 2.3.2 Projected CO2 Footprint ........................................................................ 39
2.4 Planned Injection and Monitoring Wells...................................................... 42 2.4.1 Injection and Monitoring Well Design................................................... 43 2.4.2 Methods & and Materials of construction.............................................. 49
(i) Casing Design and Construction ............................................................ 49 (ii) Well Cementing .................................................................................... 50
2.4.3 Controls Logic and Philosophy .............................................................. 51 (i) CO2 Pump and Pipeline Control.............................................................. 51 (ii) WMMS Operation.................................................................................. 52
2.4.4 Monitoring Verification and Accounting (MVA) Plans............................ 53 2.4.5 Operation Plan...................................................................................... 55
2.5 Project Hurdles and Risks ........................................................................... 55 2.5.1 Regulatory and Communication Issues................................................. 56 2.5.2 Interaction with Oil and Gas Commission ............................................. 57 2.5.3 Title Searches....................................................................................... 57 2.5.4 Coal Owners and Coal Operator Waiver ................................................ 57 2.5.5 Permit-specific Requirements............................................................... 57 2.5.6 Well Abandonment and Relocation ....................................................... 58 2.5.7 Site Safety Plans................................................................................... 58 2.5.8 Storm Water Permitting........................................................................ 58 2.5.9 Environmental Permitting..................................................................... 58
3.0 Conclusions .................................................................................................... 59 4.0 References ..................................................................................................... 61

Mountaineer Commercial Scale Carbon Capture and Storage (CCS) Project
CO2 Storage Report Page 4 of 61
List of Tables
Page Table 1.1: The PVF wells and their completion formation 8 Table 1.2: The PVF final sequestered CO2 volumes 9 Table 1.3: The Geologic Advisory Team 10 Table 2.1: Daily drilling log for BA-02 19 Table 2.2: Drill bits used for drilling BA-02 21 Table 2.3: The tubing and casing specs for BA-02 22 Table 2.4: Conventional cores collected from BA-02 well 27 Table 2.5: Injection volumes into each of the two copper ridge zones 40 Table 2.6: Estimated plume size radius and the pressure perturbation front for 5
years to total injection of 3.75MMT of CO2 at each site(assumes 2 injection sites)
41
Table 2.7: Number of planned deep wells for the MT CCS II project 43 Table 2.8: MT CCS II project timeline 54 Table 2.9: Geologic monitoring plan for MT CCS II 55
Mountaineer Commercial Scale Carbon Capture and Storage (CCS) Project
CO2 Storage Report Page 5 of 61
List of Figures
Page Figure 1.1: Schematics of the location of the injection and monitoring wells for PVF 8 Figure 2.1: Regional geologic structure near the Mountaineer site 11 Figure 2.2: The Stratigraphic column of the Mountaineer region 12 Figure 2.3: Site location for pipeline and injection wells for the CSP project 14 Figure 2.4: Geographic location of 2D seismic lines 15 Figure 2.5: Rose Run top from 2010 seismic data 16 Figure 2.6: Copper Ridge top from 2010 seismic data 16 Figure 2.7: Instantaneous phase attribute for one of the 2D seismic lines from 2003 17 Figure 2.8: Drill rig and the associated tools/supplies at the Borrow Area 18 Figure 2.9: BA-02 well depth vs. time during drilling 20 Figure 2.10: Detailed lithologic column for BA-02 well and the as-built well design. 23 Figure 2.11: Density-porosity crossplot for Lower Copper Ridge, 8,351 - 8,368 ft. 26 Figure 2.12: Photograph of Copper Ridge core showing the presence of extensive vugs. 27 Figure 2.13: CT scan of a core sample from BA-02 showing the presence of vugs. 28 Figure 2.14: Example of integration of core mapping on triple combo log. 29 Figure 2.15: Service Rig at BA-02 with frac tanks and tubing stacked on derrick. 30 Figure 2.16: Composite figure showing the results of flowmeter logging in BA-02. 31 Figure 2.17: Temperature logging (before and after dynamic flowmeter survey) in open
borehole section of BA-02. 32
Figure 2.18: BA-02 transmissivity profile in the open borehole section 34 Figure 2.19: BA-02 permeability-thickness product profile in the open borehole section 35 Figure 2.20: Outline of the planned 3D seismic survey area 37 Figure 2.21: Model Geometry 38 Figure 2.22: Injection well bottom hole pressure buildup, 2‐site 1‐well injection scenario,
reference case v/s conservative case, (a) Copper Ridge 2 (b) Copper Ridge 1. 40
Figure 2.23: (a) Cross section of pressure front in Copper Ridge after injection for 5 years (b) Cross section of CO2 plume in the Copper Ridge after 5 years of injection
41
Figure 2.24: Location of CO2 injection wells, monitoring wells, outline of AEP property and the estimated plume size
42
Figure 2.25: Injection well with injection in two zones of the Copper Ridge formation. 44 Figure 2.26: Dual zone, deep monitoring well in the Copper Ridge formation. 45 Figure 2.27: Single zone, deep monitoring well in the Copper Ridge formation. 46 Figure 2.28: Intermediate monitoring well in the Clinton Sandstone 47 Figure 2.29: Intermediate monitoring well in the Berea Sandstone. 48

Mountaineer Commercial Scale Carbon Capture and Storage (CCS) Project
CO2 Storage Report Page 6 of 61 Executive Summary
American Electric Power (AEP) has been actively involved in the development of carbon capture and sequestration (CCS) technology over the past eight years. AEP’s early work with CCS began in 2003 in the Ohio River Valley CO2 Storage Project. Additionally, AEP’s Mountaineer power plant in New Haven, West Virginia hosted two CCS projects which include the Product Validation Facility (PVF) and the Mountaineer Commercial Scale Project (MT CCS II), facility. The PVF project was a 20MW equivalent ammonia-based post combustion CO2 capture and sequestration facility and the CSP is a planned scale-up of the same technologies for a 235MW equivalent coal fired unit. There is substantial overlap with respect to the storage aspect between these two projects, however this report is primarily focused on the storage aspects of MT CCS II. Some of the broad findings and technical details captured from the previous projects are being shared in this report but further details are out of the scope of this project and cannot be shared.
The MT CCS II project has been divided into four phases, Phase I – Front-end Engineering and Design, Phase II – Detailed Design, Phase III – Construction, and Phase IV – Operations; the MT CCS II project has recently completed Phase I. As a part of Phase I of MT CCS II, a geologic characterization well was drilled at Borrow Area which is approximately 2 miles southwest from the Mountaineer plant. Also, two 2D seismic lines were purchased, processed and analyzed. The characterization well at the Borrow Area and the two additional 2D seismic lines were essential in the characterization of the local geology.
Prior to completing the Borrow Area characterization well, a geologic model for MT CCS II was generated based on the geologic knowledge gained from the PVF project and data from five deep wells of the PVF project (two injection wells and three deep monitoring wells). This geologic model was used as an input for a reservoir simulation model and multiple simulations were generated for a CO2 injection rate of 1.5-million metric tonnes/year (the target capture rate of MT CCS II). The target reservoir for injection is the lower copper ridge formation at a depth of approximately 8,100ft. The simulation results provided an estimate of CO2 footprint, the extent of the pressure perturbation field, the expected injection pressures, and the CO2 saturation in the reservoir (along with other parameters). Based on these reservoir simulations, it was decided that two injection wells (two sites with one well at each location with an approximately 7 miles distance between the two sites) will be adequate to safely inject 1.5 million metric tonnes of CO2 each year for a period of five years.
Phase I of the MT CCS II project also provided a plan, estimate, and schedule for:
a 3D seismic survey construction of the injection and monitoring wells monitoring, verification and accounting (MVA) system for the planned CO2 injection
and storage.
The estimated number of deep monitoring wells (and the well construction) was determined based upon interpretation of Underground Injection Control (UIC) guidelines set fourth by the U.S. Environmental Protection Agency (EPA) and also on the storage Contractor, Battelle’s, suggested MVA strategy. An independent geologic advisory team was formed which provided review, guidance and oversight for all the geologic aspects for this project. Based on these above mentioned studies and results, the final scope, cost estimate, and schedule for the storage aspect of this project was delivered to the project team and DOE to
Mountaineer Commercial Scale Carbon Capture and Storage (CCS) Project
CO2 Storage Report Page 7 of 61 satisfy the requirements of Phase I. This report summarizes the information obtained in the Phase I scope of the MT CCS II.
1.0 Introduction and Project Overview 1.1 Background
Due to anticipated legislation that would eventually require the reduction of CO2 emissions in the US, AEP decided to take the lead on carbon capture and sequestration (CCS) technology development and demonstration. Mountaineer power plant was chosen as the preferred site for testing this technology. Mountaineer power plant is a 1,300 MW-electric coal fired power plant located at New Haven, West Virginia, operated by Appalachian Power Company (a subsidiary of AEP). The choice of the site for the CCS project was not only driven by geologic feasibility, but also by the availability of a suitable power plant with available land space where the capture, storage, and systems could all be implemented on AEP property. Moreover, this region is home to a large number of AEP’s coal fired power plants which might require CCS retrofit in the future, so an understanding of the geology in the region was desirable and would benefit from a successful demonstration program.
The Mountaineer plant region is not a part of active oil and gas exploration/ production region hence there is a substantial lack of deep subsurface data (both deep well and surface seismic data). A background geologic investigation for sequestration was initiated in 2003 with the drilling of a characterization well and acquisition of two 2D seismic lines near the potential sequestration site at Mountaineer plant. This study was primarily funded by DOE and performed by AEP and Battelle as part of the Ohio River Valley CO2 storage project. Along with this study, a regional scale geologic study was also conducted by the Ohio Geologic Survey with focus on looking at prospective storage reservoirs for CO2 sequestration. The Ohio River Valley project at Mountaineer identified two potential geologic formations for CO2 sequestration including the Rose Run formation, which is a sandstone, and a thin zone in the Copper Ridge (lower copper ridge) formation, which is a carbonate. The geochemical signatures of the brine from these two formations were similar with total dissolved solids (TDS) of greater than 300,000 mg/L. The brine is primarily enriched in chloride-sodium-calcium and depleted in sulfates and carbonates.
In March 2007, AEP signed an agreement with Alstom to build the Product Validation Facility (PVF) for a CCS demonstration at Mountaineer. The PVF captured CO2 from a slip stream of flue gas from the main stack of the Mountaineer power plant using Alstom’s chilled ammonia technology. The flue gas volume of the slip stream for PVF is equivalent to the flue gas generated from a 20 MW coal fired power plant. As part of the sequestration effort, one injection well and three deep monitoring wells were drilled within the power plant property between 2008 and 2009, and the characterization well which was drilled in 2003 was re-worked and transformed into a second injection well. The majority of the sub-surface information in this region was obtained from the five PVF wells and associated operational data. Figure 1.1 shows the schematics of the location of the five PVF wells and Table 1.1 gives the well types and the formation in which they were completed.

Mountaineer Commercial Scale Carbon Capture and Storage (CCS) Project
CO2 Storage Report Page 8 of 61
Name Well Type Completion Formation AEP-1 Injection Copper Ridge
AEP-2 Injection Rose Run
MW-1 Monitoring Rose Run
MW-2 Monitoring Copper Ridge
MW-3 Monitoring Rose Run
Table 1.1: The PVF wells and their completion formation
AEP-2 Rose Run Injection
AEP-1 Copper Ridge Injection
AEP-2 Rose Run Injection
AEP-1 Copper Ridge Injection
Figure 1.1: Schematics of the location of the injection and monitoring wells for PVF.
CO2 injection into these two formations started in November, 2009 and injection ceased at the end of May 2011. The PVF was operational for 18 months and met all the project goals. Table 1.2 gives total CO2 injection volumes into the two formations. Injectivity was excellent for the Copper Ridge dolomite formation and was below expectation for the Rose Run sandstone. This led to the conclusion that the Copper Ridge dolomite was the preferred target reservoir for CO2 sequestration at this location. It should be noted that injection was not continuous for this entire period of operation primarily due to planned outages of the Mountaineer main unit, the CO2 capture unit and the planned well work over activity.

Mountaineer Commercial Scale Carbon Capture and Storage (CCS) Project
CO2 Storage Report Page 9 of 61
Description Total Volume Injected
(Metric Tonnes) CO2 sequestered in Copper Ridge (AEP 1) 27,176.7 CO2 sequestered in Rose Run (AEP 2 ) 10,226.6
Table 1.2: The PVF final sequestered CO2 volumes
Along with the operational data from CO2 injection, other sub-surface data available from the PVF project are geophysical well logs from the 5 deep wells, two 2D surface seismic lines, Rose Run and Copper Ridge brine geochemistry, cross well seismic data (3 sections: AEP1–MW3, AEP2-MW1, AEP2-MW2), geomechanical properties (least stress, fracture initiation pressure, fracture link up pressure, fracture propagation pressure) from 6,000ft – 9,000ft at AEP-1 well, hydrological test data at AEP-1 well before CO2 injection, brine and acid injection data after start of CO2 injection at AEP-1 and AEP-2 (obtained during a planned well workover activity).
1.2 Project Scope
The MT CCS II was initiated in late 2009 as part of the U.S. Department of Energy’s (DOE) Clean Coal Power Initiative (CCPI) Round 3, with the objective to develop a CO2 capture facility capable of capturing 90% of CO2 from a flue gas stream equivalent to the emissions of a 235 MW coal fired power plant, and sequester the captured CO2 in deep saline reservoirs (approximately 1.5 million metric tonne per year). The MT CCS II project is divided into four phases, Phase I – Front-end Engineering and Design, Phase II – Detailed Design, Phase III – Construction, and Phase IV – Operations. Along with completing the conceptual design, one of the primary goals identified in Phase I of the MT CCS II was to develop a refined (±25%) cost estimate for the completing all phases of the MT CCS II project.
As a part of MT CCS II, a geologic advisory team was formed to focus on the storage aspect of the project. This team reviewed the strategies, plans, designs, operations, problems, concerns and results related to the sequestration activities and provided its independent recommendations to AEP. Table 1.3 lists the organizations involved in the team.

Mountaineer Commercial Scale Carbon Capture and Storage (CCS) Project
CO2 Storage Report Page 10 of 61
Table 1.3: The Geologic Advisory Team members and their affiliations.
Organization Participants
Battelle Neeraj Gupta Battelle Rodney Osborne
Battelle Ernest B. Nuckols
RWE Siegfried Vennekate
Lawrence Livermore National Laboratory Julio Friedman
Massachusetts Institute of Technology Ruben Juanes
Ohio State University Jeff Daniels
West Virginia University Doug Patchen
University of Texas (Bureau of Economic Geology)
Susan Hovorka
Ohio Geological Survey Larry Wickstrom
West Virginia Geological and Economic Survey Michael Ed. Hohn
National Energy Technology Laboratory Bob Kleinmann
National Energy Technology Laboratory Michael H. McMillian
CONSOL Energy Dick Winschel (Committee Chair)
Virginia Tech University Michael E. Karmis
Clean Air Task Force L. Bruce Hill
Clean Air Task Force Kurt Waltzer
State of West Virginia Dept. of Commerce, Division of Energy
Jeff Herholdt
Some of the recommendations from the team included a better integration of core, log and geologic depositional setting into the static model, a sensitivity analysis of the reservoir model, installation of passive seismic monitoring for background data, advanced analysis of the available seismic data, etc. Although the advisory team was created for the CSP project, some of their inputs were also directed towards and helpful for the PVF sequestration activities.
2.0 Discussion of Conceptual CO2 Storage System Design for MT CCS II 2.1 Regional Geology
Figure 2.1 shows the regional geologic setting near the Mountaineer power plant. Thick sequences of paleozoic sedimentary rocks form broad basins—the Illinois Basin in the
southwest, Michigan Basin in the North, and Appalachian Basin in the southeast separated by an uplifted Cincinnati Arch region in the Midwestern United States. The study area for this project is located within the Appalachian Basin, where rocks slope toward the southeast. The paleozoic rock layers of this basin comprise of shale, siltstone, limestone,

Mountaineer Commercial Scale Carbon Capture and Storage (CCS) Project
CO2 Storage Report Page 11 of 61 dolomite, and sandstone and the formations are mostly laterally continuous and traceable throughout the region.
Figure 2.1: Regional geologic structure near the Mountaineer site.
The rocks slope toward the southeast and dip towards east-southeast (~100 ft/mile or 20 m/km) and the major geologic structure is the Rome Trough. The Rome Tough is a failed rift valley that runs southwest – northeast approximately 25 miles (40 km) to the southeast of the study area. In this feature, a series of normal faults result in down-dropped blocks of rocks leading into the Rome Trough, where Cambrian rock formations deepen substantially. Earthquake activity in the area is low, and the site is classified as low risk by the United States Geological Survey (USGS) Seismic Hazards Mapping Project.
2.2 Description of Local Geology
Prior to the MT CCS II, little information was available characterizing the local geology. The data obtained in the Ohio River Valley project and PVF served as the basis for beginning to develop the conceptual geologic storage system design for the MT CCS II project. The stratigraphic column of the Mountaineer facility as identified by the Ohio River Valley project and PVF is shown in figure 2.2.

Mountaineer Commercial Scale Carbon Capture and Storage (CCS) Project
CO2 Storage Report Page 12 of 61
Figure 2.2: The Stratigraphic column of the Mountaineer region.
Mountaineer Commercial Scale Carbon Capture and Storage (CCS) Project
CO2 Storage Report Page 13 of 61 When analyzing the stratigraphy for a geologic storage system, two elements must be present. The first element of interest is a storage reservoir. Based on PVF sequestration knowledge, the prospective reservoirs for the MT CCS II sequestration were the Rose Run and the Copper Ridge (with primary importance on lower Copper Ridge formation). The Rose Run formation, which is a regional scale geologic unit, is a low porosity, low permeability sandstone with inter-bedded layers of sandstone and dolomite at this site. The Copper Ridge formation is a tight dolomite with thin streaks of high porosity and permeability due to presence of vugs (essentially lower copper ridge). The secondary porosity in the lower copper ridge (the vugs) is believed to be a result of solution porosity due to hydrothermal activity. Based on PVF sequestration knowledge, the prospective reservoirs for the CSP sequestration were Rose Run and the Copper Ridge (with primary importance on lower Copper Ridge formation). These two formations and few other prospective zones were studied at the characterization well which was drilled as a part of the MT CCS II project. The second element necessary for CO2 storage is a cap/ containment rock. As shown in Figure 2.2, the stratigraphy shows the presence of several shale units (combined thickness >1500ft) as well as dolomite and limestone units (such as the Wells Creek dolomite, the Black River Limestone, the Trenton lime) provide excellent containment or “cap rock” for the Rose Run and Copper Ridge storage reservoirs.
As part of the Phase I geologic characterization study, additional 2D seismic information was obtained and an additional characterization well was drilled to determine how the subsurface stratigraphy changes in the region surrounding the Mountaineer facility.
Initially four sites were chosen from properties owned by AEP near the Mountaineer Power Plant; the four initial sites included Western Sporn, Borrow Area, Eastern Sporn and the Jordan Tract. The choice of these four sites was driven by availability of AEP owned property in the vicinity of the Mountaineer power plant. Parts of the Western Sporn land parcel was identified as wetlands and was ruled out as a prospective injection site for the planned project. The accessibility of Eastern Sporn site was challenging and hence this site was also dropped as a prospective injection location. Finally Borrow Area and Jordan Tract were selected as the preferred sites for CO2 injection due to accessibility and suitable surface conditions. Figure 2.3 shows the location of the Mountaineer plant, the preliminary pipeline layout plan, and the initially selected injection sites (colored in yellow and purple). Note that the planned pipelines mostly followed the electricity transmission corridor which is AEP owned property.

Mountaineer Commercial Scale Carbon Capture and Storage (CCS) Project
CO2 Storage Report Page 14 of 61
Figure 2.3: Site location for pipeline and injection wells for the MT CCS II project.
Mountaineer Commercial Scale Carbon Capture and Storage (CCS) Project
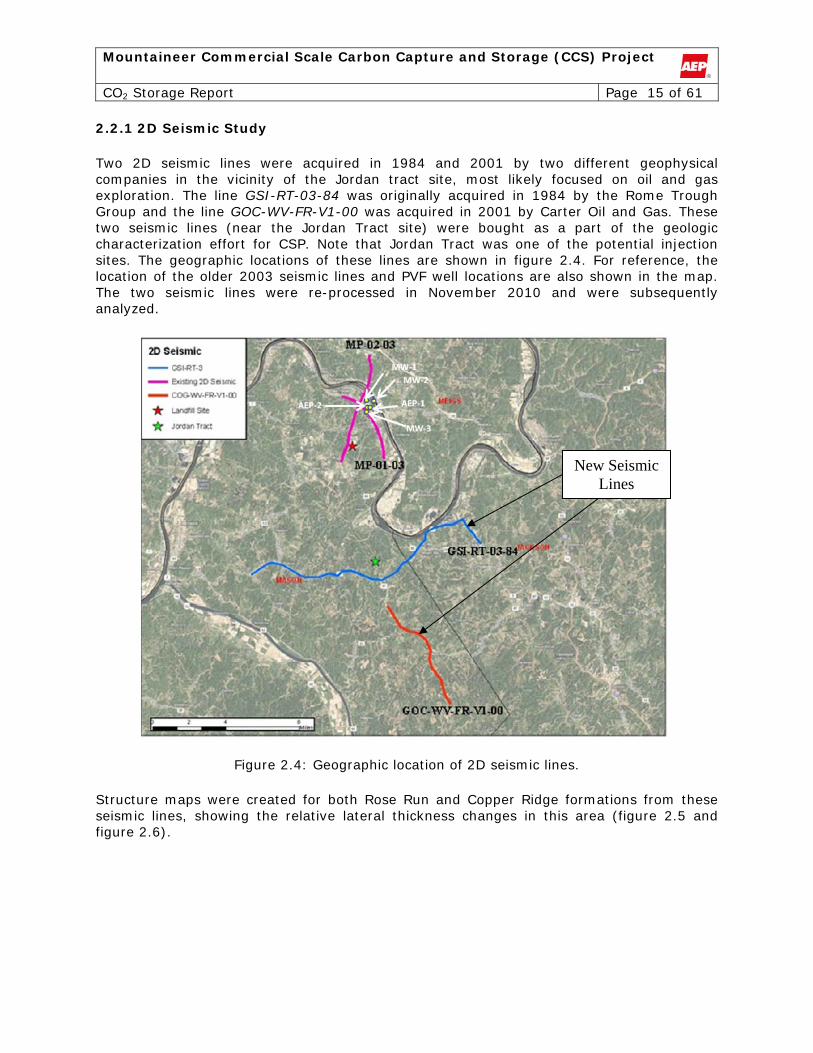
CO2 Storage Report Page 15 of 61 2.2.1 2D Seismic Study
Two 2D seismic lines were acquired in 1984 and 2001 by two different geophysical companies in the vicinity of the Jordan tract site, most likely focused on oil and gas exploration. The line GSI-RT-03-84 was originally acquired in 1984 by the Rome Trough Group and the line GOC-WV-FR-V1-00 was acquired in 2001 by Carter Oil and Gas. These two seismic lines (near the Jordan Tract site) were bought as a part of the geologic characterization effort for CSP. Note that Jordan Tract was one of the potential injection sites. The geographic locations of these lines are shown in figure 2.4. For reference, the location of the older 2003 seismic lines and PVF well locations are also shown in the map. The two seismic lines were re-processed in November 2010 and were subsequently analyzed.
New Seismic Lines
Figure 2.4: Geographic location of 2D seismic lines.
Structure maps were created for both Rose Run and Copper Ridge formations from these seismic lines, showing the relative lateral thickness changes in this area (figure 2.5 and figure 2.6).

Mountaineer Commercial Scale Carbon Capture and Storage (CCS) Project
CO2 Storage Report Page 16 of 61
Figure 2.5: Rose Run top from 2010 seismic data
Figure 2.6: Copper Ridge top from 2010 seismic data
The 2003 seismic data indicated that the rock formations consisted of continuous, flat-lying sedimentary rocks and no geologic structures were found in the sub-surface in this region. The 2010 seismic data also showed very similar behavior with continuous flat sedimentary

Mountaineer Commercial Scale Carbon Capture and Storage (CCS) Project
CO2 Storage Report Page 17 of 61 horizons with out any major geologic structure. The results from the 2010 seismic analysis also indicated lack of faulting within the study area – as observed within the resolution limits of available 2D surface seismic data (+/-100 ft). Structural maps using the 2003 and 2010 surface seismic data indicate that the strata are generally dipping to the southeast, toward the Rome Trough, with the highest point located to the west of the northwestern end of MP-01-03 seismic line. Note that the distinguishing features of the ‘vuggy’ zone of lower copper ridge are beyond the resolution of 2D seismic and cannot be mapped based solely on 2D seismic data.
Other than these standard structural analysis, advanced seismic attribute analysis were also undertaken. Seismic attributes such as relative acoustic impendence, instantaneous phase, instantaneous frequency, envelop etc. for both 2003 and 2010 data were analyzed. For example, figure 2.7 shows the instantaneous phase attribute for a part of the MP-01-03 seismic section which was obtained in 2003. This attribute helps in analyzing the continuity of the horizons and identifies faults/fractures (if present) better than what can be analyzed based on only an amplitude section. These advanced analyses also point to a lack of major fault in this data set and the lateral continuity of the geologic formations. Some of the attribute analysis also suggested a lateral change in the reservoir quality. Reservoir characterization based on seismic data is an on going activity for this project.
Figure 2.7: Instantaneous phase attribute for one of the 2D seismic lines from 2003.
2.2.2 Borrow Area Characterization Well
The Borrow Area characterization well (BA-02), drilled as a part of MT CCS II phase I project is located approximately 2 miles to the south of the Mountaineer plant and the site

Mountaineer Commercial Scale Carbon Capture and Storage (CCS) Project
CO2 Storage Report Page 18 of 61 of the PVF injection operation. This site was selected for characterization because it is AEP-owned property adjacent to the existing landfill which services Mountaineer Plant, it provided easy access for equipment and pipeline routing, and it already had some of the necessary environmental permits in place, hence the drilling activities could be started quickly. Moreover, the site was within a few miles of the PVF well, providing relatively higher confidence of finding the high permeability vugular region of the Copper Ridge formation. Figure 2.8 shows a picture of the drill rig used for drilling the BA-02 well.
Figure 2.8: Drill rig and the associated tools/supplies at the Borrow Area.
(i) Drilling timeline
Drilling activities for BA-02 began mid-December 2010 and were completed mid-March 2011. The drilling activities are tabulated in table 2.1 and a plot of drilling progress (planned vs achieved) over time is shown in figure 2.9. Drilling and characterization activities (occurring during or between drilling) lasted for 88 days. The well was not completed following drilling, but was used for characterization testing beginning with logging and sidewall coring and continuing into hydrologic testing (3/21– 6/3/2011). The well was drilled without any well compromising incident; two to three additional days were used to ensure an adequate cement job on the 13-3/8 inch casing. Of the 88 days spanning drilling the well, 16 were spent on well characterization activities such as logging, coring, and sidewall coring.

Mountaineer Commercial Scale Carbon Capture and Storage (CCS) Project
CO2 Storage Report Page 19 of 61
Date Activity Depth (ft) 12/15/2011 WVDEP Well Work Permit Issued 0 12/15/2010 Rig Up, Whipstock Natural Gas Tophole Rig #24 Spudded Well 136 12/16/2010 Run 26" Casing and Cement (Valley Brook Ready Mix) 136 12/16/2010 Rig Down Whipstock Rig #24 after Casing Cemented 136 12/18/2010 Install Cellar 136 12/19/2010 Rig Up Drill Rig, Whipstock Ohio Rig #1 136 12/22/2010 Drill out Cement and Drill Ahead 185 12/24/2010 Shut down drilling operations for holiday 12-24-10 to 12-26-
10 185
12/27/2010 Drill Ahead on Air at 22 ft/hr 365 12/29/2010 Drill Ahead on Air 17 ft/hr 940 1/1/2011 Pause Drilling Activity for Water Hauling 1,702 1/4/2011 Wait on Drilling Mud Mixing, Mix for 48 hours 1,846 1/8/2011 Resume Drilling on Mud at 2.4 ft/hr. 1,858 1/14/2011 Rig up Wireline for Triple Combo Suite, Oriented Caliper Tools 1,969 1/19/2011 Run 20" Casing 1,969 1/20/2011 Cement in 20" Casing to 2,033 ft 2,033 1/23/2011 Run Cement Bong Log from 2019 to 1,980 ft, bond tool was
too small, but indicated cement from top to bottom 2,033
1/28/2011 Drill Ahead 17-1/2" hole 2,991 1/31/2011 Run 13-3/8" Casing 3,885 2/1/2011 Run Casing with Centralizers, Cement in 13-3/8" 3,885 2/2/2011 Wireline Run: Cement Bong Log and Temperature Survey LTD
to 3,801 ft 3,885
2/3/2011 Remedial Cement ”Grout” Job from Surface 3,885 2/4/2011 Test BOP - Pressure to 800 psi, 30 minutes 3,885 2/8/2011 Drill Ahead 12-1/4" Hole on Air 5,155 2/14/2011 Wireline Run: GR, CN, Zdens, Caliper, Micro Laterlog, Dual
Laterlog, Dipole Sonic, Digital Spectralog, and Imaging Log. 6,702
2/15/2011 Run 9-5/8" Casing and Cement 6,702 2/16/2011 Nipple up, Test BOP 6,872 2/17/2011 Drill ahead 8-1/2” hole 6,872 2/19/2011 Wireline Run: Segmented Cement Bong Log from 6,690 to
3,500 ft, Trenton/Black River Oriented full hole core 6,984
3/1/2011 Drill ahead 8-1/2” hole, Run Mill Tooth Bit and Junk Basket to Clean Borehole
8,335
3/4/2011 Core Copper Ridge Dolomite 8,343 3/11/2011 Core Copper Ridge Complete 8,632 3/13/2011 Drill Ahead to Total Depth at 1:45 hrs 8,875 3/14/2011 Wireline Run: Triple Combo and Sonic Log 8,875 3/15/2011 Rig Up Sidewall Coring Tools, Collect Sidewall Cores 8,875
Table 2.1: Daily drilling log for BA-02.

Mountaineer Commercial Scale Carbon Capture and Storage (CCS) Project
CO2 Storage Report Page 20 of 61
Figure 2.9: BA-02 well depth vs. time during drilling
(ii) Equipment, Fluids and Drill Bits
The AEP BA-02 well was drilled with a top-drive, single derrick drill rig. The Whipstock Natural Gas Ohio #1 Rig is a custom, built-for–purpose, drilling rig with a 300,000 lb. hook-load capacity and depth limit of 12,000 ft with 4-1/2” drill pipe. Associated equipment included one 2,300 cubic feet 850 psi. booster, 18-6 ½ Tyson-Krupp drill collars, one 500 horsepower (HP) mud pump and a 1,000 HP mud pump. Extra air compressors and air boosters were required in addition to the rig supplied equipment for the large diameter hole being drilled including 1,170 cubic feet per minute / 350 psi air compressor, as well as two additional boosters. Multiple 300 to 500 barrel (bbl) tanks were used to support the drilling mud system and storage of fluids. Shale shakers, a gas buster, the mud system platform, and a centrifuge were rented during drilling for the mud/fluid system. Other rentals included pressure control equipment and support equipment for tubular and fluid handling.
Drilling fluid or ‘drilling mud’ refers to any liquid used to remove drill cuttings and/or condition the borehole during drilling. Drilling mud was pumped from the mud pits through the drill string and drill bit, which cleans and cools the drill bit in the process. The mud carries the drill cuttings up the annular space between the drill string and the bore hole to the surface. Cuttings were removed at the shale shakers and the mud returned to the mud pits for recirculation or disposal. Mudloggers inspected formation cuttings produced during drilling and identify which formation is being drilled, approximate depths for the formations’ top and bottom, and the formation’s lithology. The mud was periodically tested and modified to give it properties that optimize and improve drilling efficiency. Note that drilling on air
Mountaineer Commercial Scale Carbon Capture and Storage (CCS) Project
CO2 Storage Report Page 21 of 61 does not require drilling mud in the hole. The portions of the AEP BA-02 well that were drilled on air were ground surface to 1,868 ft and 2,033 to 6,702 ft.
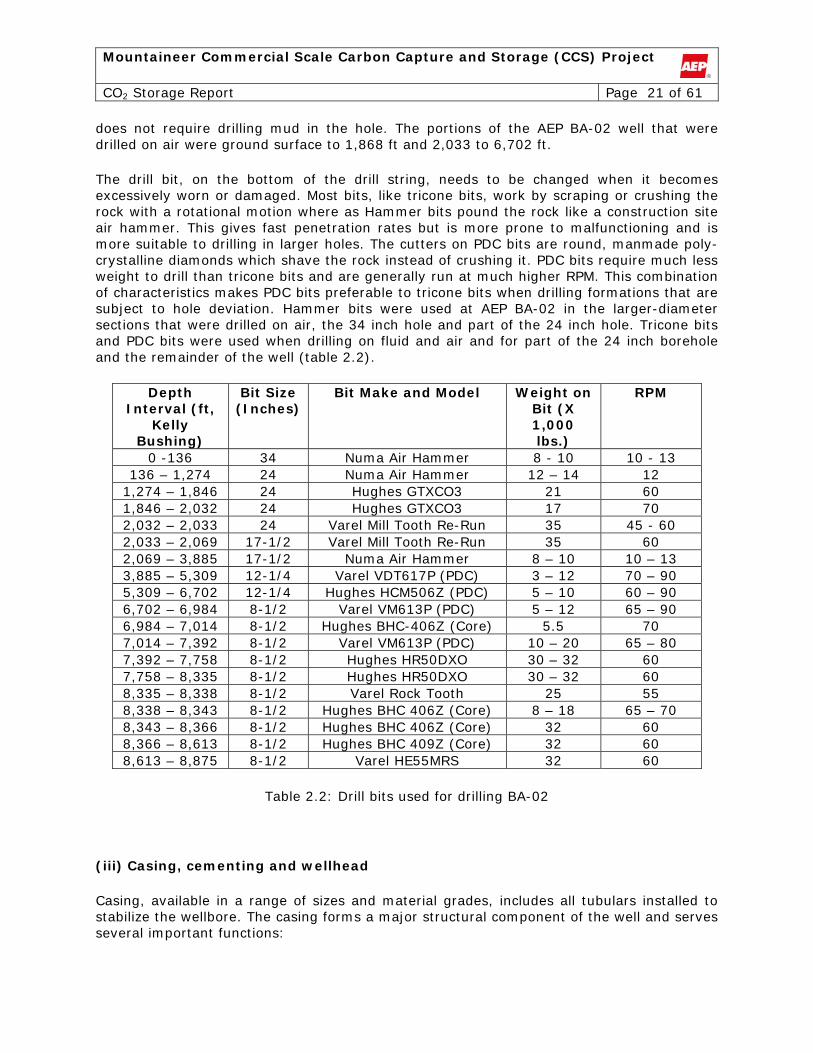
The drill bit, on the bottom of the drill string, needs to be changed when it becomes excessively worn or damaged. Most bits, like tricone bits, work by scraping or crushing the rock with a rotational motion where as Hammer bits pound the rock like a construction site air hammer. This gives fast penetration rates but is more prone to malfunctioning and is more suitable to drilling in larger holes. The cutters on PDC bits are round, manmade poly-crystalline diamonds which shave the rock instead of crushing it. PDC bits require much less weight to drill than tricone bits and are generally run at much higher RPM. This combination of characteristics makes PDC bits preferable to tricone bits when drilling formations that are subject to hole deviation. Hammer bits were used at AEP BA-02 in the larger-diameter sections that were drilled on air, the 34 inch hole and part of the 24 inch hole. Tricone bits and PDC bits were used when drilling on fluid and air and for part of the 24 inch borehole and the remainder of the well (table 2.2).
Depth Interval (ft,
Kelly Bushing)
Bit Size (Inches)
Bit Make and Model Weight on Bit (X 1,000 lbs.)
RPM
0 -136 34 Numa Air Hammer 8 - 10 10 - 13 136 – 1,274 24 Numa Air Hammer 12 – 14 12
1,274 – 1,846 24 Hughes GTXCO3 21 60 1,846 – 2,032 24 Hughes GTXCO3 17 70 2,032 – 2,033 24 Varel Mill Tooth Re-Run 35 45 - 60 2,033 – 2,069 17-1/2 Varel Mill Tooth Re-Run 35 60 2,069 – 3,885 17-1/2 Numa Air Hammer 8 – 10 10 – 13 3,885 – 5,309 12-1/4 Varel VDT617P (PDC) 3 – 12 70 – 90 5,309 – 6,702 12-1/4 Hughes HCM506Z (PDC) 5 – 10 60 – 90 6,702 – 6,984 8-1/2 Varel VM613P (PDC) 5 – 12 65 – 90 6,984 – 7,014 8-1/2 Hughes BHC-406Z (Core) 5.5 70 7,014 – 7,392 8-1/2 Varel VM613P (PDC) 10 – 20 65 – 80 7,392 – 7,758 8-1/2 Hughes HR50DXO 30 – 32 60 7,758 – 8,335 8-1/2 Hughes HR50DXO 30 – 32 60 8,335 – 8,338 8-1/2 Varel Rock Tooth 25 55 8,338 – 8,343 8-1/2 Hughes BHC 406Z (Core) 8 – 18 65 – 70 8,343 – 8,366 8-1/2 Hughes BHC 406Z (Core) 32 60 8,366 – 8,613 8-1/2 Hughes BHC 409Z (Core) 32 60 8,613 – 8,875 8-1/2 Varel HE55MRS 32 60
Table 2.2: Drill bits used for drilling BA-02
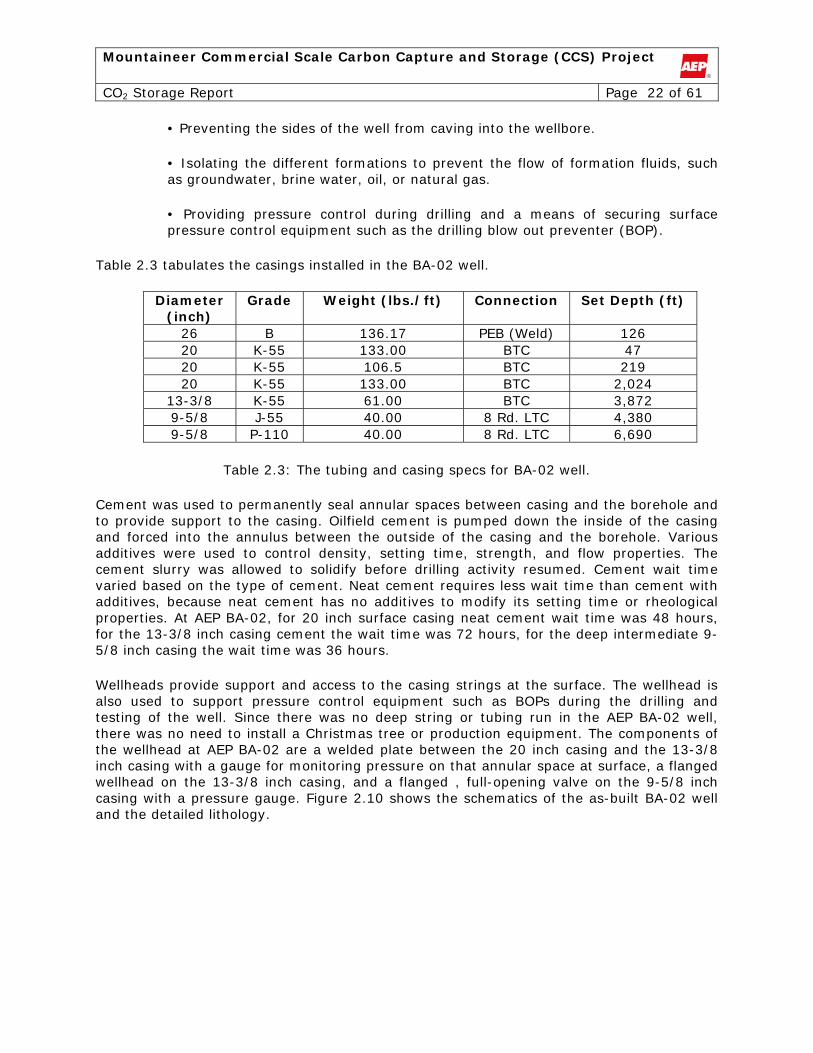
(iii) Casing, cementing and wellhead
Casing, available in a range of sizes and material grades, includes all tubulars installed to stabilize the wellbore. The casing forms a major structural component of the well and serves several important functions:
Mountaineer Commercial Scale Carbon Capture and Storage (CCS) Project
CO2 Storage Report Page 22 of 61
• Preventing the sides of the well from caving into the wellbore.
• Isolating the different formations to prevent the flow of formation fluids, such as groundwater, brine water, oil, or natural gas.
• Providing pressure control during drilling and a means of securing surface pressure control equipment such as the drilling blow out preventer (BOP).
Table 2.3 tabulates the casings installed in the BA-02 well.
Diameter (inch)
Grade Weight (lbs./ft) Connection Set Depth (ft)
26 B 136.17 PEB (Weld) 126 20 K-55 133.00 BTC 47 20 K-55 106.5 BTC 219 20 K-55 133.00 BTC 2,024
13-3/8 K-55 61.00 BTC 3,872 9-5/8 J-55 40.00 8 Rd. LTC 4,380 9-5/8 P-110 40.00 8 Rd. LTC 6,690
Table 2.3: The tubing and casing specs for BA-02 well.
Cement was used to permanently seal annular spaces between casing and the borehole and to provide support to the casing. Oilfield cement is pumped down the inside of the casing and forced into the annulus between the outside of the casing and the borehole. Various additives were used to control density, setting time, strength, and flow properties. The cement slurry was allowed to solidify before drilling activity resumed. Cement wait time varied based on the type of cement. Neat cement requires less wait time than cement with additives, because neat cement has no additives to modify its setting time or rheological properties. At AEP BA-02, for 20 inch surface casing neat cement wait time was 48 hours, for the 13-3/8 inch casing cement the wait time was 72 hours, for the deep intermediate 9-5/8 inch casing the wait time was 36 hours.
Wellheads provide support and access to the casing strings at the surface. The wellhead is also used to support pressure control equipment such as BOPs during the drilling and testing of the well. Since there was no deep string or tubing run in the AEP BA-02 well, there was no need to install a Christmas tree or production equipment. The components of the wellhead at AEP BA-02 are a welded plate between the 20 inch casing and the 13-3/8 inch casing with a gauge for monitoring pressure on that annular space at surface, a flanged wellhead on the 13-3/8 inch casing, and a flanged , full-opening valve on the 9-5/8 inch casing with a pressure gauge. Figure 2.10 shows the schematics of the as-built BA-02 well and the detailed lithology.

Mountaineer Commercial Scale Carbon Capture and Storage (CCS) Project
CO2 Storage Report Page 23 of 61
Figure 2.10: Detailed lithologic column for BA-02 well and the as-built well design.
(iv) Logging
Well log analysis is one of the most common methods for evaluating deep geologic formations. Wireline logging for the AEP BA-02 well was contracted to Baker Atlas, an oilfield service provider that offers a full range of geologic formation evaluation services to characterize reservoir rocks and fluids. It should be noted that the values derived from these logs are not considered absolute. The types of log used at BA-02 are discussed briefly below.

Mountaineer Commercial Scale Carbon Capture and Storage (CCS) Project
CO2 Storage Report Page 24 of 61
Cement Bond Log: This log is generated by a tool that uses the variations in amplitude of an acoustic signal traveling down the casing wall between a transmitter and receiver to determine the quality of cement bond on the exterior casing wall. The ultrasonic cement evaluation is another type of cement bond log, in which the tool emits short bursts of acoustic energy into the borehole, casing, and cement and processes the recorded signal. The tool provides nearly 100% coverage of the borehole and allows for a better assessment of the cement behind the casing.
Triple Combo: This is the most commonly used logging tool for any geophysical logging program. This is a combination of the gamma ray tool, the resistivity tool, and combined density and neutron tools. The gamma ray tool records a log of the total natural radioactivity, measured in American Petroleum Institute (API) units and the measurement can be made in both open hole and through casing. The resistivity tool measures the resistivity of the formation, expressed in ohm-m. The density tool measures the bulk density of the formation, based on the reduction in gamma ray flux between a source and a detector due to Compton scattering. The neutron log refers to a log of porosity based on the effect of the formation on fast neutrons emitted by a source. Porosity is interpreted based on the amount of hydrogen detected by the sensor.
Sonic Logs: This tool emits an acoustical signal into the rocks and measures the travel speed of the wave echoes through the formations. For geologic applications, both compressional (P) and shear (S) wave speed are of interest. The P and S wave velocities can also be used as a basis for other calculations, such as geomechanical properties.
Elemental Spectroscopy: This refers to a log of the yields of different elements in the formation, as measured by capture gamma ray spectroscopy using a pulsed neutron generator. The main purpose of the log is to determine lithology.
Nuclear Magnetic Resonance Permeability (NMR): This tool is designed for sandstone reservoirs where it is assumed that the porosity distribution is more or less regular with respect to size and connectivity. These qualities are less dependable in carbonate reservoirs, which is the reason NMR permeability is not represented as a quantitative tool for carbonate reservoir analysis. The data can be further processed to give the total pore volume (the total porosity) and pore volumes. The most common volumes are the bound fluid and free fluid. A permeability estimate is made using a transform such as the Timur-Coates or SDR permeability transform.
Rotary Sidewall Cores: Sidewall coring is a method in which the core is mechanically drilled from the side of the borehole with a wireline tool. The nearly cylindrical cores that are obtained can be used for most routine core analysis, much like plugs obtained from whole diameter core.
Image Logs: The data provided in image logs allow an assessment of the formation on a very fine scale (1 foot of well length is represented by 1 inch of data). The data can be used for fracture assessment, identification of bedding planes, determination of the introduction of fluid, and determination of vugular porosity. The two types of image logs collected at the AEP BA-02 well are resistivity and acoustic images.
Wireline logging for the AEP BA-02 well was conducted in four portions of the well: at the surface casing total depth (~2,024 ft MD), at the shallow intermediate casing total depth
Mountaineer Commercial Scale Carbon Capture and Storage (CCS) Project
CO2 Storage Report Page 25 of 61 (~3,872 ft MD), at the deep intermediate casing total depth (~6,685 ft MD), and at the final well total depth, which was not cased (see figure 2.10). A summary of wireline logs run is as follows:
(a) No wireline logs were run in the conductor section.
(b) In the surface casing string, a triple combo assembly, which included a spontaneous potential tool and an orientation tool, was run in the open hole section on air. A CBL was run after the 20-inch casing was set.
(c) In the shallow intermediate section, open hole logs were dropped due to time and budget constraints, as well as well bore stability concerns. A CBL was run after the 13 3/8-inch casing was set.
(d) In the deep intermediate section, a triple combo assembly, which included a spontaneous potential tool, a sonic log and an orientation tool were run in the first open hole run after the hole was loaded with fluid. The second open hole logging run included a resistivity and acoustic image log. A CBL was run after the 9 5/8-inch casing was set.
(e) After drilling to the well’s final total depth, four logging runs were completed. The first was a triple combo, with spontaneous potential, a sonic log and orientation, as in the deep intermediate section. The second run was the combined elemental spectroscopy and nuclear magnetic resonance tools. The third run was to drill rotary sidewall cores. In this effort, 73 sidewall cores were attempted and 67 were recovered. The final run was a combined resistivity and acoustic image.
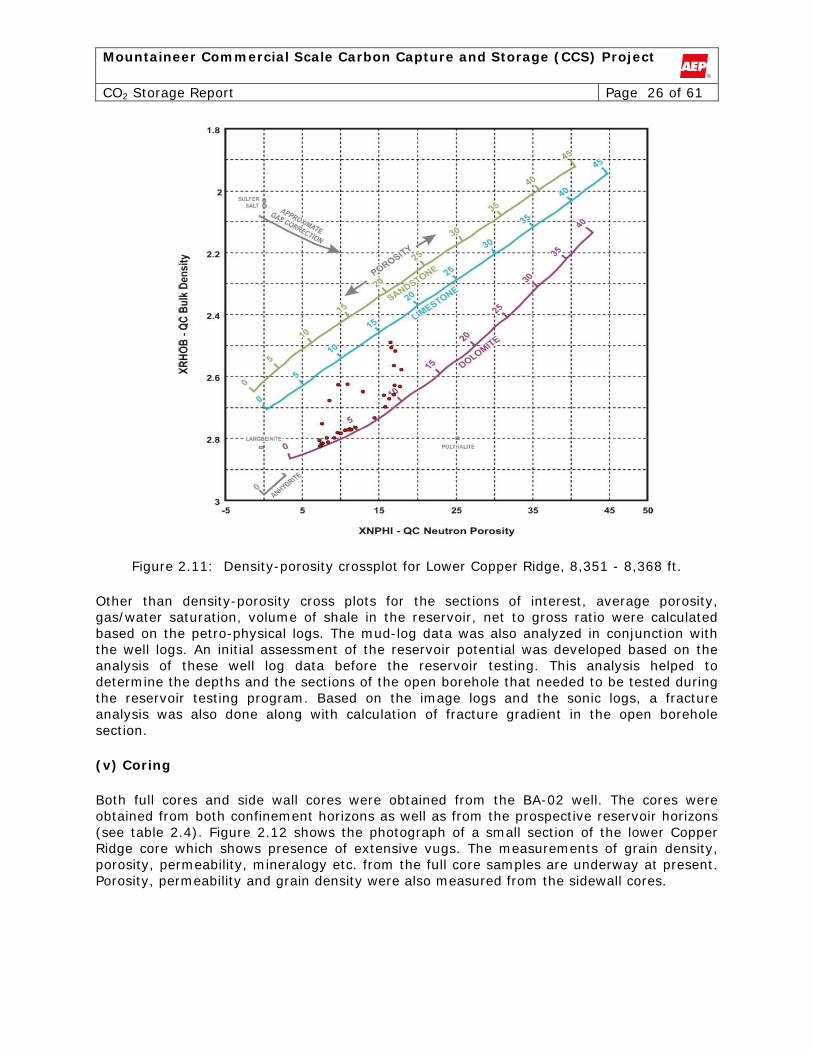
Figure 2.11 shows an example of a crossplot of bulk density and neutron porosity (measured by the logs) for lower Copper Ridge between 8351ft and 8368ft which shows porosity of greater than 10% for quite a few samples. This is the primary target reservoir zone for injection and the high porosity of this zone provides optimistic views for CO2 storage this formation.
Mountaineer Commercial Scale Carbon Capture and Storage (CCS) Project
CO2 Storage Report Page 26 of 61
Figure 2.11: Density-porosity crossplot for Lower Copper Ridge, 8,351 - 8,368 ft.
Other than density-porosity cross plots for the sections of interest, average porosity, gas/water saturation, volume of shale in the reservoir, net to gross ratio were calculated based on the petro-physical logs. The mud-log data was also analyzed in conjunction with the well logs. An initial assessment of the reservoir potential was developed based on the analysis of these well log data before the reservoir testing. This analysis helped to determine the depths and the sections of the open borehole that needed to be tested during the reservoir testing program. Based on the image logs and the sonic logs, a fracture analysis was also done along with calculation of fracture gradient in the open borehole section.
(v) Coring
Both full cores and side wall cores were obtained from the BA-02 well. The cores were obtained from both confinement horizons as well as from the prospective reservoir horizons (see table 2.4). Figure 2.12 shows the photograph of a small section of the lower Copper Ridge core which shows presence of extensive vugs. The measurements of grain density, porosity, permeability, mineralogy etc. from the full core samples are underway at present. Porosity, permeability and grain density were also measured from the sidewall cores.

Mountaineer Commercial Scale Carbon Capture and Storage (CCS) Project
CO2 Storage Report Page 27 of 61
Core Number Depth(ft) Formation Core #1 6,984 -7,013 Black River Limestone (confinement) Core #2 8,345 – 8,328 Basal Copper Ridge “B” Dolomite (confinement) Core #3 8,366 – 8,345 Lower Copper Ridge Dolomite (reservoir) Core #4 8,456 – 8,366 Lower Copper Ridge Dolomite (reservoir) Core #5 8,546 – 8,456 Lower Copper Ridge Dolomite (reservoir) Core #6 8,613 – 8,546 Lower Copper Ridge Dolomite (reservoir)
Table 2.4: Conventional cores collected from BA-02 well.
Figure 2.12: Photograph of Copper Ridge core showing the presence of extensive vugs.
Along with the standard core analysis, CT scans of the copper ridge cores were also done and figure 2.13 shows an example of the CT scan for a section of BA-02 core. Some of the other advanced analysis like relative permeability measurements is planned for Phase-II of the project.

Mountaineer Commercial Scale Carbon Capture and Storage (CCS) Project
CO2 Storage Report Page 28 of 61
Figure 2.13: CT scan of a core sample from BA-02 showing the presence of vugs.
(vi) Integration of log and core
Core data are generally assumed to be the baseline data to which other petrophysical data should be compared. Core to log transformations provide a better means of analyzing rock properties than relying solely on core or logs. Core to log depth control is essential for yielding proper results as well as considering the differences in spatial resolution. Additionally, core data are more likely to be irregularly sampled as compared to the logs, so some interpolation and filtering will be necessary. Some examples of core to log integrations are:
• Core gamma to wireline gamma. • Lab calculated saturations to wireline calculated saturations for wireline
resistivity • Lab calculated electronic properties a, m, n for use in Archie’s Equation for
water saturation • Lab calculated porosity values compared to neutron porosity, density porosity,
NMR porosity and acoustic porosity • Lab calculated permeability compared to NMR permeability • Porosity to permeability transforms • Whole core descriptions and core photos can be tied to image logs for aid in
determining depositional environments.
Mountaineer Commercial Scale Carbon Capture and Storage (CCS) Project
CO2 Storage Report Page 29 of 61
• Thin section mineralogy and X-ray diffraction data can be used to calibrate elemental spectroscopy tools.
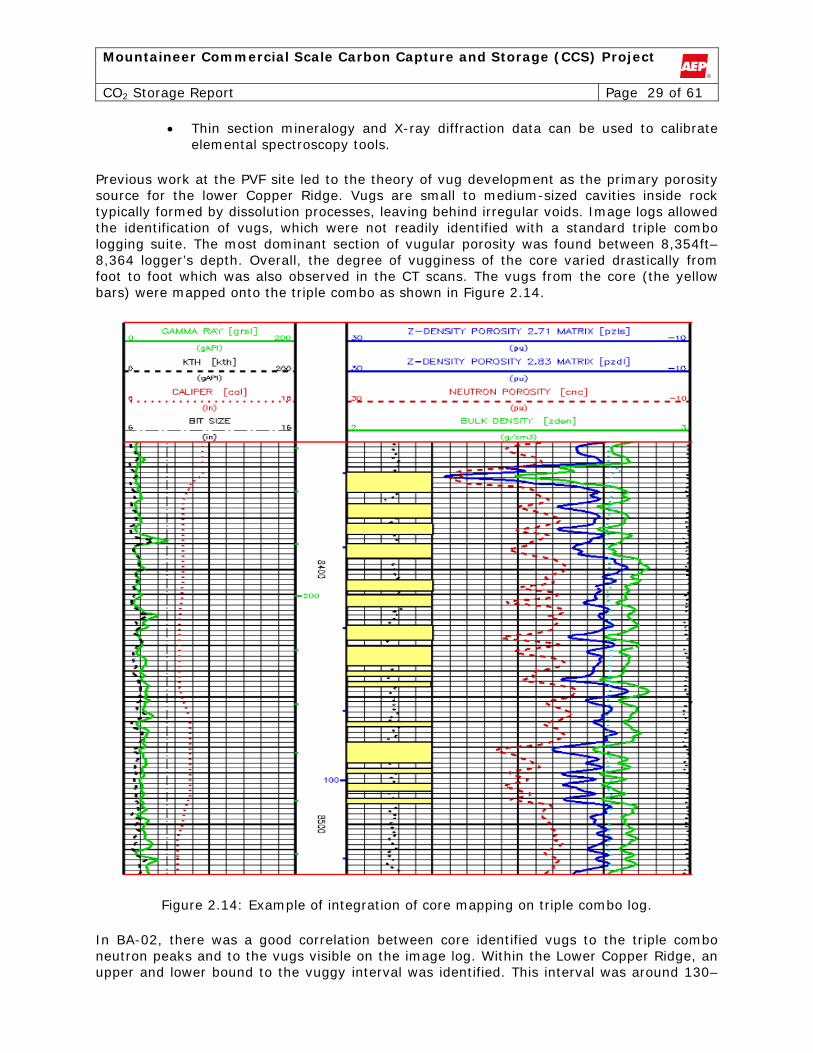
Previous work at the PVF site led to the theory of vug development as the primary porosity source for the lower Copper Ridge. Vugs are small to medium-sized cavities inside rock typically formed by dissolution processes, leaving behind irregular voids. Image logs allowed the identification of vugs, which were not readily identified with a standard triple combo logging suite. The most dominant section of vugular porosity was found between 8,354ft–8,364 logger’s depth. Overall, the degree of vugginess of the core varied drastically from foot to foot which was also observed in the CT scans. The vugs from the core (the yellow bars) were mapped onto the triple combo as shown in Figure 2.14.
Figure 2.14: Example of integration of core mapping on triple combo log.
In BA-02, there was a good correlation between core identified vugs to the triple combo neutron peaks and to the vugs visible on the image log. Within the Lower Copper Ridge, an upper and lower bound to the vuggy interval was identified. This interval was around 130–

Mountaineer Commercial Scale Carbon Capture and Storage (CCS) Project
CO2 Storage Report Page 30 of 61 140 ft in total thickness, which correlates well with the current depositional model. It should be noted that vugs are not present everywhere throughout this larger interval. This analysis allows the identification of the vuggy intervals by the triple combo only which, in the future, could potentially yield prospecting tool for vugs via seismic (by tying logs to seismics) without having to immediately drill more wells.
2.2.3 Hydrological well testing
As a part of the geologic characterization process, a series of detailed hydrologic test were conducted in the open borehole section of BA-02 well. The open borehole section in BA-02 extends from a depth of 6,690 ft to 8,875 ft and encompasses several geologic formations ranging in age from Cambrian (Nolichucky, Copper Ridge, Rose Run, Lower Beekmantown) to Ordovician (Upper Beekmantown Formation, St. Peter, Wells Creek, Lower Chazy, Gull River, Black River). Figure 2.15 shows a picture of the service rig and the frac tanks which were used for the hydrologic testing. The hydrologic testing was done in two phases, Phase-I from April 4-7 and Phase-II from May 1-26.
Figure 2.15: Service Rig at BA-02 with frac tanks and tubing stacked on derrick.
(i) Phase-I
Phase-I of the hydrological tests comprised of flowmeter logging and fluid temperature logging in the open borehole section. Flowmeter logging is a relatively quick method to identify zones of fluid inflow or outflow. Both static and dynamic flowmeter surveys were run in BA-02 well. A mechanical spinner meter was used as the flowmeter in this test in which the revolutions per minute of the spinner meter can be used to calculate the flow rate when the borehole diameter is known. Static survey was used to determine open borehole flow under natural gradient conditions and to correct the dynamic flowmeter surveys. The

Mountaineer Commercial Scale Carbon Capture and Storage (CCS) Project
CO2 Storage Report Page 31 of 61 dynamic flowmeter logging surveys were conducted at constant injection rates of 2, 4 and 6 barrels/minute respectively. It should be noted that the maximum injection rate was constrained by a regulatory-imposed permit limit on surface injection pressure of 1,300 psi hence the injection rates could not be increased higher than 6 barrels/minute. Figure 2.16 shows the results of the dynamic flowmeter logging.
Figure 2.16: Composite figure showing the results of flowmeter logging in BA-02.
The amount of downward flow decreases where a thief zone is present that takes some of the injected fluid and these zones are indicated by a shift to the left in the flow curve. Along with the flowmeter data, temperature data was also obtained for identifying potential fluid inflow zones. Figure 2.17 shows the temperature in the open borehole section before and after the dynamic flowmeter survey (time difference of 17 hours in-between surveys). Zones that show decrease in temperature (cooling) is due to the invasion of cooler injection brine and are potential reservoir horizons. Note that both flowmeter survey and the repeat temperature survey correlate well and show change at similar depths in the well bore.

Mountaineer Commercial Scale Carbon Capture and Storage (CCS) Project
CO2 Storage Report Page 32 of 61
Figure 2.17: Temperature logging (before and after dynamic flowmeter survey) in open borehole section of BA-02.
Based on the flowmeter and fluid-temperature logging survey, three candidate reservoir zones of primary significance were identified for testing in Phase-II of the hydrologic testing. These zones are:
(a) A zone within the B Zone of the Beekmantown dolomite between approximate depths of 7,660 and 7,840 ft.
(b) A zone within the Rose Run sandstone between approximate depths of 7,910 and 8,070 ft
(c) A zone within the lower part of the Copper Ridge dolomite between approximate depths of 8,320 and 8,510 ft.
(ii) Phase-II
The Phase II testing involved isolating each test zone using an inflatable packer system then conducting two types of tests: a slug/drill-stem test (DST) and a constant rate injection test. The slug/DST is a short-term test usually on the order of 2 to 6 hours. Both a withdrawal slug test and an injection slug test was performed once the test zone is isolated with inflatable open borehole packers. These tests provide estimates of hydrologic

Mountaineer Commercial Scale Carbon Capture and Storage (CCS) Project
CO2 Storage Report Page 33 of 61 properties in the region near the wellbore such as permeability-thickness product (k*h), storativity (S), and borehole skin effects (sk).
In a constant rate test, fluid is injected into or withdrawn from a well with injection or discharge regulated at a uniform rate. The pressure response within the test zone is monitored during the active injection or withdrawal phase and during the subsequent recovery phase following termination of injection or pumping. The analysis of the drawdown and recovery pressure response provides a means for estimating hydrologic properties of the test interval as well as for discerning formational and non-formational flow conditions (e.g., wellbore storage, skin effects, presence of boundaries and leakage). Typically, the test duration is on the order of 1 to 2 days. Multiple slug/DST tests, including both injection and withdrawal tests, were conducted within each test zone to provide corroborative information. Figure 2.18 and 2.19 shows the best estimates of transmissivity and permeability thickness product for the open borehole section of BA-02 well.

Mountaineer Commercial Scale Carbon Capture and Storage (CCS) Project
CO2 Storage Report Page 34 of 61
Figure 2.18: BA-02 transmissivity profile in the open borehole section.

Mountaineer Commercial Scale Carbon Capture and Storage (CCS) Project
CO2 Storage Report Page 35 of 61
Figure 2.19: BA-02 permeability-thickness product profile in the open borehole section.
The primary results of the Phase II testing are quantitative estimates of key reservoir parameters for each of the discrete depth intervals that were tested. Transmissivity of the three primary test zones is as follows (from highest to lowest)
(a) 37.6 ft2/d (permeability-thickness product of 13,926 mD-ft) for the 190-ft section of the Lower Copper Ridge between 8,320 and 8,510 ft.
(b) 2.9 ft2/d (permeability-thickness product of 1,074 mD-ft) for the 178-ft section of Beekmantown B Formation between 7,660 and 7,838 ft.
(c) 0.81 ft2/d (permeability-thickness product of 300 mD-ft) for the 158-ft section of the Rose Run Formation between 7,918 and 8,076 ft.

Mountaineer Commercial Scale Carbon Capture and Storage (CCS) Project
CO2 Storage Report Page 36 of 61 The 365 ft section of Lower Copper Ridge below a depth of 8,510 ft was determined to have negligible transmissivity of 0.058 ft2/d (permeability-thickness product of 21 mD-ft). Storativity values for the three primary test zones fall within a narrow range from 1.570E-05 to 8.32E-03. The composite section between 6,690 ft and 7,550 ft has a low transmissivity of 0.03 ft2/d (permeability-thickness product of 11 mD-ft). This indicates a lack of additional potential injection zones within the section from 6,690 to 7,550 ft.
The 2,185 ft section of open borehole that was evaluated, the Lower Copper Ridge Formation between 8,320 ft and 8,510 ft shows to be a zone of significant injection potential. The actual thickness of the transmissive zone within the 190-ft tested interval is can be determined based on the well logs from the BA-02 well. The other secondary zone zones include the Beekmantown B and the Rose Run Formation, although the injectivity potential of these zones is significantly lower than that of the Lower Copper Ridge. The geologic formations overlying the Beekmantown B (i.e., above 7,550 ft) and Lower Copper Ridge below a depth of 8,510 ft are best characterized as non-reservoir type formations.
2.2.4 Planned Additional Geophysical Data
In Phase II, the project will obtain additional geophysical data, including data from drilling a characterization well at the Jordan Tract site, and obtaining a 3D seismic dataset.
(i) Jordan Tract Characterization Well
The MT CCS II project planned to drill a characterization well at Jordan Tract during Phase I of the project, however due to delays in drilling of Borrow Area and resultant schedule considerations, this activity was postponed until Phase II of the project.
The Jordan Tract area is approximately 11 miles south of the Mountaineer plant and the PVF operations. One of the biggest uncertainties of this entire project is the spatial distribution of the lower copper ridge vugular porosity in this region. Although the PVF operation area shows the presence of the vugular porosity in the lower copper ridge formation, the presence or absence of this vugular porosity is still unknown at the Jordan Tract region. Hence it’s of primary importance to drill a characterization well at this site.
(ii) 3D Seismic Survey
In addition to completing the characterization well at the Jordan Tract site, a 3D seismic dataset will be obtained during Phase II. Information obtained from the 3D seismic will be analyzed along with the characterization well data to tie up the seismic data for time to depth conversion. In conjunction with the planned 3D seismic, a VSP survey at the Jordan tract region is also planned for in Phase II. Figure 2.20 shows the outline of one of the preliminary planned area for a 3D seismic survey. This survey area gives reasonably full coverage over the entire predicted CO2 footprint in the sub-surface. It should be noted that the older 2D lines also will fall within this survey area and hence can be compared with higher resolution newer data.

Mountaineer Commercial Scale Carbon Capture and Storage (CCS) Project
CO2 Storage Report Page 37 of 61
Figure 2.20: Outline of the planned 3D seismic survey area.
2.3 Reservoir Modeling
Placement of injection wells was decided primarily by locations which were currently owned by AEP and created minimal right-of-way interferences for pipelines and access to the sites (see section 2.1). The estimated number of injection wells and the deep monitoring wells were decided based on the simulations of the reservoir model. The model was run with a total injection target of 1.5 million metric tonnes/year, which is the planned CO2 capture volume from a 235MW slip stream of flue gas from the Mountaineer power plant.
2.3.1 Reservoir Model Description
The STOMP (Subsurface Transport Over Multiple Phases) multiphase flow and transport modeling code, which was developed at Battelle Pacific Northwest Laboratory, was used for the numerical reservoir modeling (White and Oostrom, 2000). The STOMP model has different modules for handling various combinations of fluid, energy and mass transfer in the subsurface. The STOMP-WCS (water, CO2 and salt) model was used for simulating the injection of supercritical CO2 into the deep saline aquifers at Mountaineer. STOMP can model the fate and transport of three components (water, CO2, salt) distributed over two phases (gas – supercritical CO2, water vapor; and aqueous – liquid water, dissolved CO2, dissolved salt). STOMP requires a basic geologic framework as an input for the simulation of the injected CO2.
The development of the geological framework model was done in the following three step process. First, a framework was developed by the mapping of regional stratigraphy and structure based on seismic data, well logs and cores. Second, the reservoir architecture was identified using a sequence stratigraphy methodology based on core and log data. And
Jordan Tract Jordan Tract

Mountaineer Commercial Scale Carbon Capture and Storage (CCS) Project
CO2 Storage Report Page 38 of 61 finally, the framework was populated with lateral and vertical reservoir properties based on the integration of geologic, seismic and engineering data.
A full 3D model for the injection sites (Borrow Area and Jordan Tract) could not be built due to the lack of any site-specific geologic characterization data. All of the above mentioned geologic and reservoir properties were derived from the Ohio River Valley project and the PVF project, and the assumption was made that the geologic framework and 2-D radially-symmetric model developed for the PVF project could be applied at each of the sites.
The corresponding model geometry, based on the ‘average’ conditions is shown schematically in Figure 2.21. The model extended ~1000 ft vertically from the middle of the Beekmantown formation to the top of the Nolichucky Shale (see figure 2.2 for stratigraphic units) and radial outwards to a distance of ~20 miles. This boundary distance was set to eliminate any boundary effects after 5 years of injection. The model included 57 vertical layers that range in thickness from 5.5 ft to 38 ft. The radial discretization increased geometrically in radius from 0.45 ft adjacent to the wellbore to the outer boundary radius of 12400 ft. Because the dip is relatively small (~100ft/mile), the effect of dipping bed was not considered in the modeling. For the simulations, the injection pressures were kept well below the fracture limits of the formations (formation fracture pressure ~6200psi and model simulation limits ~5200psi). The fracture pressures were derived from mini-frac tests and detailed geo-mechanical analysis conducted at AEP-1 well as apart of the Ohio river valley project (Lucier et al., 2006).
Figure 2.21: Model Geometry.

Mountaineer Commercial Scale Carbon Capture and Storage (CCS) Project
CO2 Storage Report Page 39 of 61 Permeability assignment for the model layers was based upon either well-test data or log derived porosity-permeability transforms. Well-test data was used for the three reservoir zones shown in Figure 2.21 and porosity-permeability transforms were used for all other layers. Data from multiple pressure falloff tests of the Rose Run and the upper Copper Ridge reservoirs were analyzed using standard reservoir engineering techniques. Based on the convergence of the late-time data, the permeability-thickness was calculated to be approximately 30,000md-ft for Copper Ridge. Based on the convergence of the late-time data, the permeability-thickness was calculated to be approximately 300md-ft for Rose Run. Additionally, relative permeability curves for Copper Ridge carbonate were obtained from Bennion and Bachu (2010), and relative permeability measurements for Rose Run formation were obtained from earlier study of PVF injection simulations (Bacon, 2009).
Based on the analysis of PVF data, it was found that the lower part of Copper Ridge formation provided two prospective zones suitable for injection. The primary Copper Ridge zone (termed in the model as Copper Ridge 1) has permeability close to ‘1 Darcy’ while the secondary zone has permeability close to ‘40 mDarcy’ (Copper Ridge 2). The Copper Ridge 2 zone is overlain by the Copper Ridge 1 zone.
2.3.2 Projected CO2 Footprint
The dynamic reservoir model simulations were run for various injection scenarios. These can be divided into three groups as follows.
(Scenario a)
(1) 3-well injection case where each single well injects into Rose Run, Copper Ridge1 & Copper Ridge2 independently.
(2) 2-well injection case where each single well injects into Copper Ridge1 & Copper Ridge2 independently.
(3) 1-well injection case where the well injects into at both Copper Ridge1 & Copper Ridge2.
(Scenario b)
(1) The 2-site scenario with 750 MT/yr/site injection in the Borrow area & the Jordan tract.
(2) The 3-site scenario with 500 MT/yr/site injection in the Borrow area, the Eastern Sporn & the Jordan Tract.
(Scenario c)
(1) The reference case with assumption of geologic framework developed from PVF wells is directly applicable to Borrow area and the Jordan tract.
(2) The conservative case, where permeabilities are reduced by a factor of 2 to account for potential reduction in reservoir quality in the Borrow area and Jordan tract

Mountaineer Commercial Scale Carbon Capture and Storage (CCS) Project
CO2 Storage Report Page 40 of 61 These preliminary modeling results showed that two injection sites will be adequate to sequester the total 1.5 million MT/year CO2 injection. Each injection site will have a single injection well completed in the Copper Ridge formation and the injection will be both into Copper Ridge1 and Copper Ridge2 zones. Because the higher permeability Copper Ridge1 overlies the lower permeability Copper Ridge2 Zone, majority of CO2 will enter the Copper Ridge1 zone. Figure 2.22 (a) and (b) shows the injection pressure buildup (bottom hole pressure) for the scenario described above for Copper Ridge 2 and Copper Ridge 1 for 5 years. Table 2.5 tabulates the volumes of CO2 being sequestered into each of the two zones both for reference case and conservative case.
Injection Reservoir Reference Case
Injection Rate (MT/year)
Conservative Case
Injection Rate (MT/year) Copper Ridge 1 715,000 (95%) 714,000 (95%) Copper Ridge 2 35,000 (5%) 36,000 (5%)
Table 2.5: Injection volumes into each of the two copper ridge zones.
Figure 2.22: Injection well bottom hole pressure buildup, 2 site 1 well injection scenario, reference case v/s conservative case, (a) Copper Ridge 2 (b) Copper Ridge 1.
The regular spikes in pressure is indicative of the situation when one of the injection wells will be shut down for maintenance and the other well has to accommodate the entire flow volume. Cross sections illustrating the pressure front and CO2 plume at the end of 5 years of injection are shown in Figure 2.23. The estimated plume size and pressure affected area (truncated at 1psi) for each injection well at the end of 5 years of injection is given in Table 2.6.

Mountaineer Commercial Scale Carbon Capture and Storage (CCS) Project
CO2 Storage Report Page 41 of 61
(a) (b)
Figure 2.23: (a) Cross section of pressure front in Copper Ridge after injection for 5 years (b) Cross section of CO2 plume in the Copper Ridge after 5 years of injection.
Assuming 2 injection sites Injection Zone CO2 Radius (ft) Pressure Front (ft)
Copper Ridge-1 and 2 10,700 70,000
Table 2.6: Estimated plume size radius and the pressure perturbation front for 5 years to total injection of 3.75MMT of CO2 at each site (assumes two injection sites).
Out of these three modeled scenarios, the difference between 1 injection wells into each three formations (Copper Ridge 1 ,2 and Rose Run) compared to 1 injection well for both zones in Copper Ridge results in an increase of only ~1,200 ft of plume radius. Hence, assuming that accessibility of pore space will not be a major obstacle, one injection well at each site (total two sites) was considered to be the basis for design and the cost estimate. Each of the injection well will have a dual completion, injecting into Copper Ridge 1 primarily and secondarily into the Copper Ridge2.

Mountaineer Commercial Scale Carbon Capture and Storage (CCS) Project
CO2 Storage Report Page 42 of 61 2.4 Planned Injection and Monitoring Wells
Based on the reservoir model simulations, the MT CCS II project developed a proposed layout of injection wells and monitoring wells during the Phase I effort. Furthermore, based upon the recently issued Underground Injection Control (UIC) Class VI guidelines, the project developed a proposed monitoring plan and layout. Figure 2.24 shows the boundary of the Mountaineer power plant, the three AEP owned properties identified for the installation of the injection and the monitoring wells and the boundary of the modeled CO2 footprint. Table 2.7 gives the types and number of wells planned to be drilled as a part of MT CCS II (this does not include shallow groundwater monitoring wells or microseismic monitoring wells). The yellow circle shows the extent of the modeled CO2 plume for 5 year injection, the yellow triangles represents injection well (1 at each site), the red triangles represents deep monitoring well, green and black triangles represents intermediate monitoring wells. Note that the intermediate monitoring wells are assumed requirements based on the new UIC guidelines provided by the US-EPA for CO2 sequestration (see section 2.3.4 for MVA).
Figure 2.24: Location of CO2 injection wells, monitoring wells, outline of AEP property & the estimated plume size.

Mountaineer Commercial Scale Carbon Capture and Storage (CCS) Project
CO2 Storage Report Page 43 of 61
Types of Wells Number Injection 2
Deep Monitoring 9 Intermediate Monitoring 4
Characterization 2
Table 2.7: Number of planned deep wells for the MT CCS II project.
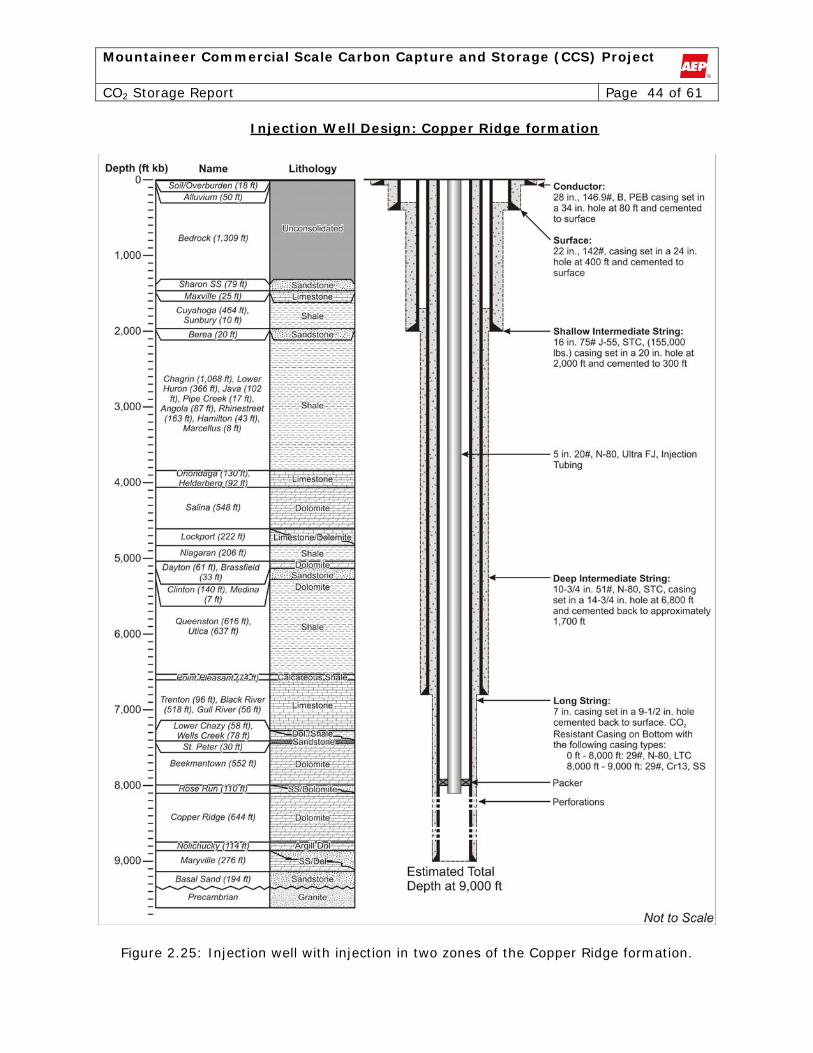
2.4.1 Injection and Monitoring Well Design
The injection and monitoring well design for the CSP Project are based on experience of the previous deep wells which were drilled in this area. Detailed well designs for the two deep saline formation injection wells (Figure 2.24) and several monitoring wells (Figures 2.25 to 2.28) planned for the CCS II program, along with the corresponding lithology are provided below. Intermediate monitoring wells, one penetrating the Berea Sandstone and one penetrating the Clinton Sandstone formations will be drilled at each of the two injection well drill sites. Deep monitoring wells will be drilled to penetrate the injection zone(s) at distances of approximately 2,500 ft and 11,000 ft from the injection well. The deep monitoring well which is approximately 2,500ft from the injection well, is expected to provide the early evidence of CO2 breakthrough. It is necessary to observe the CO2 breakthrough on one of the monitoring wells for calibration of the model results. Each deep monitoring well will be designed to monitor a single zone. For dual zone monitoring, larger diameter bore holes and casing strings are required to accommodate equipment for monitoring two zones of injection in case this type of monitoring are required.
Mountaineer Commercial Scale Carbon Capture and Storage (CCS) Project
CO2 Storage Report Page 44 of 61
Injection Well Design: Copper Ridge formation
Figure 2.25: Injection well with injection in two zones of the Copper Ridge formation.

Mountaineer Commercial Scale Carbon Capture and Storage (CCS) Project
CO2 Storage Report Page 45 of 61
Dual Zone, Deep Monitoring Well Design
Figure 2.26: Dual zone, deep monitoring well in the Copper Ridge formation.

Mountaineer Commercial Scale Carbon Capture and Storage (CCS) Project
CO2 Storage Report Page 46 of 61
Single zone, Deep Monitoring Well Design
Figure 2.27: Single zone, deep monitoring well in the Copper Ridge formation.

Mountaineer Commercial Scale Carbon Capture and Storage (CCS) Project
CO2 Storage Report Page 47 of 61
Intermediate Monitoring Well Design
Figure 2.28: Intermediate monitoring well in the Clinton Sandstone

Mountaineer Commercial Scale Carbon Capture and Storage (CCS) Project
CO2 Storage Report Page 48 of 61
Intermediate Monitoring Well Design
Figure 2.29: Intermediate monitoring well in the Berea Sandstone.

Mountaineer Commercial Scale Carbon Capture and Storage (CCS) Project
CO2 Storage Report Page 49 of 61 2.4.2 Methods & and Materials of construction
All casing strings and cement slurries for casing extending into the injection formation will be CO2 resistant and these casing and tubing strings meet or exceed API specifications. There are no major differences in materials between injection wells and monitoring wells except for those strings that penetrate the injection zone which are required to be CO2 resistant and have CO2 resistant cement as well.
(i) Casing Design and Construction
As shown in the well design figures above, several types of materials are used. Following are the proposed casing design and construction specifications for the MT CCS II injection and monitoring wells. Although these designs and specifications were carefully engineered, actual casing grades, weights and setting depths can change based on actual well conditions and availability (see section 2.3.1 for reference).
(a) Conductor Casing
The conductor casing is the first casing to be inserted into the well bore hole, and is set through the unconsolidated soils, sands and gravels and into the bedrock to keep the unconsolidated zones stable while the hole is drilled to deeper depths. It is planned to set conductor casing, regardless of well design, at approximately 80 ft. 24” and 26” pipes manufactured for natural gas pipeline service meet all of the specification requirements necessary for use as conductor casing for the wells. The ends of the casing are plain with a machined bevel for butt-welding. The casing will be lowered into the hole one joint at a time and welded together on the rig floor by a certified welder. The conductor casing will be cemented back to the surface by grouting with 3500 psi ready mix cement.
(b) Surface Casing
Following the conductor casing, the surface casing is installed to protect the fresh water aquifers from contamination during the drilling, injection and monitoring processes. It is planned to set surface casing, regardless of well design, to approximately 400 ft. A guide shoe will be installed on the bottom joint of the surface casing to help guide the casing into the hole to the desired setting depth. Casing centralizers will be installed to maintain casing stand-off from the bore hole to ensure a good sheath of cement around the entire diameter of the casing. Each threaded connection will be coated with API approved, high pressure modified thread compound. Each threaded connection will be made up to the API recommended torque with power tongs. The surface casing will be cemented from the 400 ft depth back to the surface.
(c) Shallow Intermediate Casing
The shallow intermediate casing will be run through the Berea sandstone formation to seal off any natural gas, oil and water so that the next section of the well can be drilled on air. It is planned to set shallow intermediate casing, regardless of well design, at approximately 2,000 ft. A casing guide shoe will be installed on the bottom joint of shallow intermediate casing to help guide the casing into the hole to the desired setting depth. Casing centralizers will be installed to maintain casing stand-off from the bore hole to ensure a good sheath of cement around the entire diameter of the casing. Each threaded connection will be coated with API approved, high pressure modified thread compound, and will be made up to the recommended torque with power tongs. The shallow intermediate casing will

Mountaineer Commercial Scale Carbon Capture and Storage (CCS) Project
CO2 Storage Report Page 50 of 61 be cemented back to approximately 300ft from the surface. Note that shallow intermediate chasing will not be run for the intermediate Berea monitoring well.
(d) Deep Intermediate Casing
The deep intermediate casing will be run through the Queenston/Utica shale section so that the well can be drilled to total depth without fear of deteriorating well bore conditions (e.g. sloughing, lost circulation and/or cave-ins). The deep intermediate casing will be run on the deep monitoring wells and the injection wells to a depth of approximately 6,800 ft. Casing centralizers will be installed to maintain casing stand-off from the bore hole to ensure a good sheath of cement around the entire diameter of the casing. Each threaded connection will be coated with API approved, high pressure modified thread compound and made up to the recommended torque with power tongs. The deep intermediate casing will be cemented back to approximately 3300 ft. or 300 ft. inside the shallow intermediate casing. Deep intermediate casing will not be run on the intermediate Berea monitoring wells or the intermediate Clinton monitoring wells.
(e) Longstring Casing
The longstring casing is the deepest casing to be installed on the wells. The longstring is set through the zone(s) of interest, cemented and then perforated across the zone(s) of interest to establish communication with the zone(s) for injection or monitoring purposes. The longstring setting depth will vary depending upon the purpose of the well. The bottom ~1,000 ft of the longstring casing of the injection well will be a CO2 corrosion-resistant stainless steel. A guide/float shoe will be installed on the bottom joint of longstring casing to help guide the casing in the hole to the desired setting depth. The float acts as a positive seal once cement is placed in the well bore to reduce the chance of the cement “u-tubing” due to the differential pressure. Casing centralizers will be installed to maintain casing stand-off from the bore hole to ensure a good sheath of cement around the entire diameter of the casing. Longstring casing on the injection wells will be cemented by circulating cement back to the surface in one or more stages. Each threaded connection will be coated with API approved, high pressure modified thread compound and made up to the recommended torque with power tongs.
(ii) Well Cementing
Oilfield cement, for cementing the well casings in place, will be delivered to the well site as dry bulk in pneumatic trucks. The dry bulk will be mixed with the proper type and amount of dry additives at the cementing service company’s dry bulk mixing facility.
Once on location, it will be transported to the mix/pump truck via compressed air and mixed with the proper amount of water. The cement slurry density will be monitored with densitometers and when it reaches the correct slurry density, it will be transferred to high pressure pumps and pumped down the casing. The cement will be pumped out the bottom of the casing and up the casing annulus until it reaches the desired height in the annulus. Mixing rates and displacement rates will vary from well to well depending upon pump pressure, casing depth, cement type and volume, and thickening time. The most common oilfield cement used in the Appalachian basin is standard Portland Class A. Additives are determined as a percent of weight of the dry bulk cement or of the weight of the mix water, depending upon the additive. Cement thickening times and compressive strengths are obtained through laboratory testing. Most of the common cement blends have published
Mountaineer Commercial Scale Carbon Capture and Storage (CCS) Project
CO2 Storage Report Page 51 of 61 thickening times and compressive strengths but less common, custom cement blends require laboratory testing on an individual basis.
Although these schedules and specifications were carefully engineered, actual casing setting depths, cement types, additives and volumes can change based on actual well conditions.
2.4.3 Controls Logic and Philosophy
The MT CCS II system will be controlled by Mountaineer’s Distributed Control System (DCS) located inside the plant boundaries of the Mountaineer plant. The DCS performs all of the monitoring and control of the CCS processes with the exception of complex equipment (e.g., CO2 Compressor) which is controlled by dedicated local programmable logics logic controllers (PLC). For complex equipment the DCS performs high level control functions and serves as the operator interface to operate and monitor the equipment.
Each injection well is instrumented, monitored, and controlled by the Well Maintenance and Monitoring System (WMMS) located at each well site. The WMMS is a PLC that communicates with the DCS back at the plant via a fiber optic data link. To minimize the potential for security breaches in the CCS control system, communication between the well site and the DCS will be constrained to primarily monitoring signals. A minimal number of signals will be sent from the DCS to the WWMS to coordinate the injection wells with the performance of the chilled ammonia process (CAP) at the Mountaineer plant.
The WMMS provides protection features at the well site that are independent of the DCS. Each injection well has two (2) motor operated isolation valves and one (1) flow control valve with an Electro-hydraulic Control (EHC) operator. These valves are controlled by the WMMS during operation. The CO2 pump is controlled by a Variable Frequency Drive (VFD). The VFD receives a signal from the DCS to adjust speed of the pump to maintain the desired flow into the injection well(s).
(i) CO2 Pump and Pipeline Control
Preliminary control logic and DCS integration for CO2 transport and injection is described below. This information was developed as a basis for the Phase I conceptual design, and would likely be further investigated and optimized further in Phase II (detailed engineering and design) when detailed controls logic, alarms, interlock protection schemes, and communications protocols are developed.
The CO2 pump will be operated by the DCS. The DCS provides Operator Interface Terminals (OIT) to start and stop the CO2 transport pump, and graphic displays providing process information. The operator determines a flow set point for the CO2 product exiting the Mountaineer plant through the transport pipeline. This set point will be determined based on injection well pressure and CAP CO2 production, as well as on the number of injection wells in service. The DCS will control the pump VFD which will adjust pump speed to maintain the required pipeline flow.
The DCS also monitors the liquid CO2 drum level. This level signal provides a bias to the flow control loop to adjust the pump speed up or down as required to maintain a predetermined level in the drum. The drum level bias will not be active during startup and shutdown.

Mountaineer Commercial Scale Carbon Capture and Storage (CCS) Project
CO2 Storage Report Page 52 of 61 The operator determines a flow set point for the CO2 to be injected into the well. The DCS will send a signal to the well site WMMS based on this value. The flow set point will be used by the WMMS as the set point for the injection well control valve. Flow control at the injection well site will be closed loop using feedback from the injection well flow monitor to determine deviation from the set point received from the DCS. In the event that communication from the DCS is lost, the WMMS will maintain the control valve flow at the last received set point provided the injection well continues to operate within the normal operating parameters allowed by the WMMS.
If only one well is being used for CO2 injection, the set point for the injection well control valve will be chosen to drive the control valve full open. This will allow the VFD driven CO2 pump to perform all control required. If more than one well is being used, a flow set point will be set for one injection well control valve and the control valve for the second well will set to the full open position. In this configuration, flow to the first well will be controlled by the flow set point in the WMMS and the balance of the CO2 to the second well will be controlled by the output from the CO2 pump.
The DCS will send a shutdown signal to the WMMS when the operator determines that injection is no longer required and initiates a shutdown sequence, or in the event of an emergency CAP shutdown. Upon receipt of the shutdown signal, the MWWS will close the flow control and isolation valves to stop the injection of CO2.
The DCS will also monitor process conditions, alarm Operations personnel as necessary of abnormal operating conditions related to the transport and storage systems, and initiate CO2 pump shutdown as required to prevent pump damage.
(ii) WMMS Operation
The MT CCS II WMMS hardware and software will be similar in design to the hardware and software used on the PVF project. A single processor Allen Bradley (Rockwell Automation) ControlLogix PLC with type 1756 I/O modules and a local human-machine -interface (HMI) will be used for each well site. The PLC and instrumentation will be powered by an uninterruptable power supply (UPS) sized to run for 24 hours in the event of a power outage with the intent of providing uninterrupted data until a portable generator can be brought on line at the well site. Redundant power supplies will be used for the processor and for direct current (DC) instrument power. The PLC will be networked to the Mountaineer Plant control room via fiber optic Ethernet. The local HMI will communicate with the PLC and be used for diagnostics and trouble-shooting.
The WMMS system will automatically control accumulator level and tank operation to provide pressure control of the annular fluid. Annular fluid is brine used to fill in the annual space between the injection tube and the long string casing. The UIC rule requires the annual fluid must be maintained at a higher pressure than the injection pressure. Maximum pressure will be controlled by bleeding off the annular fluid through a back-pressure control valve. Various pressure increments will cycle the pumps on and off. Control room operators will monitor operation data and receive alarms from the well site PLC. The nitrogen side of the accumulator will be filled and adjusted to reach the maximum operating pressure at 50% full. Nitrogen is used to control any leaks in the system, which are unexpected. Thus, the need for backup nitrogen cylinders will be minimized.

Mountaineer Commercial Scale Carbon Capture and Storage (CCS) Project
CO2 Storage Report Page 53 of 61 Pending further review during the detailed design process, the alarm conditions for the WMMS are listed below. More than one alarm point may be used for each category: low fluid annular pressure, low fluid annular temperature, low accumulator level, high accumulator level, low storage tank level, high injection point pressure, pump fault, valve fault, and/ or low nitrogen pressure.
The WMMS will be designed for fail-safe operation whereas a loss of power or control signal to critical valves will cause the valves to close. Default I/O states will be programmed into the PLC and will be set to fault in a safe position in the event of a processor fault or if the controller is offline. A PLC interlock will automatically close the wellhead valves if (a) Annular fluid pressure drops below the allowable limit (injection pressure + 50 psig), or (b) Injection pressure exceeds the allowable limit (TBD - dependent on geological characteristics).
2.4.4 Monitoring Verification and Accounting (MVA) Plans
The specific testing and monitoring requirements for the MT CCS project are not known at this time because an Underground Injection Control (UIC) permit has not yet been issued for the project. Therefore, it was assumed that testing and monitoring requirements for the commercial-scale project will be similar to those for the PVF project. The PVF project was authorized by West Virginia Department of Environmental Protection (WVDEP) Underground Injection Control (UIC) Permit No. 1189-08-53, as a Class V (experimental) permit. The Class V permit stipulates testing and monitoring requirements to verify that the experimental geologic sequestration project is operating as permitted and is not endangering underground sources of drinking water (USDW).
It was also assumed that the testing and monitoring requirements in the new Geologic Sequestration (GS) Rule will apply. The U.S. EPA, in December 2010, issued the GS Rule, which establishes a new class of injection well, Class VI, for wells that will be used to inject CO2 into deep geologic formations for long-term storage (sequestration). The GS rule sets minimum federal technical criteria for Class VI wells for the purpose of protecting USDWs and mandates comprehensive monitoring of all aspects of well integrity, CO2 injection and storage, and groundwater quality during the injection operation and the post-injection site care period. A Class VI UIC permit will be sought for the commercial-scale project; therefore, testing and monitoring requirements in the new GS Rule were considered in developing the testing and monitoring plan, scope of work and cost estimate.
Another driver for monitoring requirements is the Mandatory Reporting of Greenhouse Gases Rule (MRR) (74 FR 56260), which requires that all facilities that inject CO2 for the purpose of long-term geologic sequestration to report basic information on CO2 injected underground and imposes additional monitoring to quantify CO2 emissions to the atmosphere.
The Mountaineer CCS II project has completed Phase I – site characterization and preliminary design, in September 2011 (Table 2.8). A testing and monitoring program for the GS facility begins before the start of the active injection phase (Phase III) and continues through the post-injection and site closure phase. The scope of the Mountaineer CCS II project includes four phases that extend through 5 years of active injection once the facility is constructed and operational (Table 2.8).

Mountaineer Commercial Scale Carbon Capture and Storage (CCS) Project
CO2 Storage Report Page 54 of 61 Phase Purpose Duration Dates
I Site Characterization &
Preliminary Design 15 mos June, 2010 thru Sept, 2011
II Detailed Design 15 mos Oct, 2011 thru Dec, 2012 III Construction 32 mos Jan, 2013 thru Aug, 2015 IV Operation 5 yrs Sept, 2015 thru Aug, 2020 a. Post Injection Tbd Tbd
Table 2.8: MT CCS II project timeline
An anticipated monitoring schedule for a project having a 5-year active injection period is presented in Table 2.9. The schedule and types of monitoring options, other than those required under the UIC permit, are subject to modification based on several factors, including field observations, site logistics, budgets, and potential lessons-learned at this site and others. Pre-injection monitoring is required to characterize baseline conditions that could be affected by the injected CO2. The duration and complexity of pre-injection monitoring varies by monitoring method. For some of the monitoring techniques (e.g., PNC logging), a single sampling event (or survey) will be sufficient to characterize pre-injection conditions. For others, such as USDW groundwater monitoring, the baseline sampling program includes multiple sampling events across seasons to characterize variability in the target analytical parameters that will be monitored.
Based on PVF experience, the primary monitoring technique for plume detection and management will be pressure monitoring (at injection wells and deep monitoring wells). Geochemical sampling at the deep wells is expected to provide the field evidence of CO2 break through in the well. Most of the available geophysical monitoring techniques (such as cross well seismic or repeat surface seismic) will not be feasible at this site because the reservoirs are thin and cannot be resolved by seismic data.
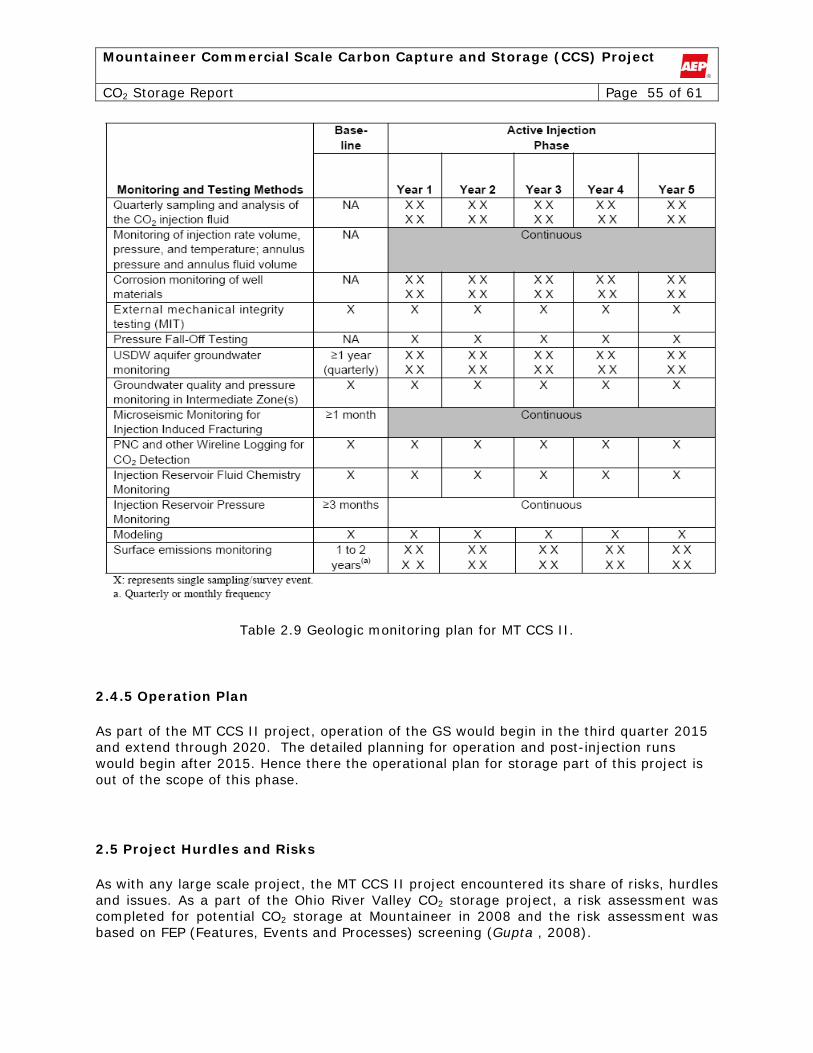
Mountaineer Commercial Scale Carbon Capture and Storage (CCS) Project
CO2 Storage Report Page 55 of 61
Table 2.9 Geologic monitoring plan for MT CCS II.
2.4.5 Operation Plan
As part of the MT CCS II project, operation of the GS would begin in the third quarter 2015 and extend through 2020. The detailed planning for operation and post-injection runs would begin after 2015. Hence there the operational plan for storage part of this project is out of the scope of this phase.
2.5 Project Hurdles and Risks
As with any large scale project, the MT CCS II project encountered its share of risks, hurdles and issues. As a part of the Ohio River Valley CO2 storage project, a risk assessment was completed for potential CO2 storage at Mountaineer in 2008 and the risk assessment was based on FEP (Features, Events and Processes) screening (Gupta , 2008).
Mountaineer Commercial Scale Carbon Capture and Storage (CCS) Project
CO2 Storage Report Page 56 of 61 Early in MT CCS II, risks and opportunities were identified at the project level, involving representatives of the integrated project team (e.g. AEP, Alstom, Battelle and WorleyParsons). Risks were qualitatively ranked for probability of occurrence, impact and severity. Depending on the severity of an unmanaged risk, action plans and/or best practices were identified or developed for their management with the goal of reducing the severity of the risk in its managed state. The integrated project team would meet on a quarterly basis to add to the risk register developed for the project and/or to update the status of previously identified risks or opportunities, including their actions and/or best practices for risk mitigation.
Specific to the drilling of characterization well BA-02, the project team relied on the expertise of Battelle and their sub-contractors to manage drilling specific operational risks. With the completion and close-out of Phase I, Battelle captured its lessons learned and shared them with the entire integrated project team.
The following information documents a select number of these issues and provides some “lessons learned” and guidance on how to better proceed with future projects. The information discussed in this section is augmented in the Lessons Learned report prepared for Global CCS Institute. The Lessons Learned report also lists a number of technical lessons learned by AEP and Battelle from experiences associated with the drilling of injection and monitoring wells for the PVF. Note that some of these issues will be specific to the permit agency and their rules and regulations. Some of the site specific issues (for example dealing with coal mines operators) might not be applicable everywhere.
2.5.1 Regulatory and Communication Issues
As part of the MT CCS II project, a series of well work permits from the State of West Virginia Department of Environmental Protection (WVDEP) Office of Oil and Gas were required (note – since no injection wells were drilled for the project, no Underground Injection Control (UIC) permits were not required during Phase I). While this is a well established and long standing program within the state; the project team ran into several obstacles related to preparing the permit applications and obtaining the permits.
It is essential to communicate effectively and develop a working relationship with regulatory personnel at the WVDEP Oil and Gas Office (and others as needed) early in the process. CO2 injection and monitoring wells are not “business as usual” for most regulators. Based on experience with other CO2 projects, increased cooperation makes the permitting process much easier. WVDEP Oil and Gas management was clear in stating a preference for being consulted in the very early stages of the permitting process. In addition to meetings and other verbal communication, an early site visit with staff from the Office of Oil and Gas would be beneficial.
Additionally, understanding exactly what the regulators want can be a challenge. Contact with agency personnel can take time as they are often busy with other projects/tasks. Planning for adequate time up front for these types of delays and difficulties is important. Wells not being installed for a typical use are likely to held to a higher standard of care, and processes that may be considered routine for “typical wells” can take more time to complete, attracting greater attention and critique. This should be accounted for in the original project plan.

Mountaineer Commercial Scale Carbon Capture and Storage (CCS) Project
CO2 Storage Report Page 57 of 61 Verification that the surveyor has recent experience with preparing plats for oil and gas permits is essential. A surveying company more familiar and experienced with meeting oil and gas permit requirements should be able to recognize when the requested work diverges from current oil and gas plat requirements and can save the project time and money.
2.5.2 Interaction with Oil and Gas Commission
Since the CO2 injection and monitoring wells are not "for the extraction of oil and gas", they do not come within the jurisdiction of the Oil and Gas Conservation Commission (WV OGCC). (Note: That the WV OGCC is not part of WVDEP, but rather a totally separate organization than the WVDEP Office of Oil and Gas.) This point should be established and made clear in the application letter to avoid any confusion regarding the purpose of the well and the appropriate agency jurisdictions. While WV OGCC handles releases of hydrocarbons to the atmosphere under their jurisdiction, the Commission agreed in writing that incidental releases, such as drilling a deep well for injection or monitoring of CO2, do not fall under Commission jurisdiction (this could be different in other states/countries).
2.5.3 Title Searches
Title searches to determine property and mineral rights ownership should be done during the site selection process. Mineral rights can be passed down from family member to family member, often leading to multiple owners. In addition, corporate mineral right ownership issues can often delay a project, particularly if the owner has filed a map with the office of Miners Health, Safety and Training or filed a declaration with the clerk of the County Commission.
2.5.4 Coal Owners and Coal Operator Waiver
With regards to the filing of a well work permit, there is no requirement to provide notice of the filing of a well work permit application to coal operators or owners, unless they have filed either a map with the office of Miners' Health, Safety and Training or filed a declaration with the clerk of the County Commission. If the map or declaration have not been filed, it is recommended that the two questions on the form related to coal owners or lessees (WW2-A) be answered with the words “there are no coal interests with declarations.”
If the owner has filed a map with the office of Miners Health, Safety and Training or filed a declaration with the clerk of the County Commission, a coal operator waiver must be obtained by the operator, owner, or lessee. It has been AEP’s experience that operators, owners, or lessees may be less than agreeable to sign such waivers.
2.5.5 Permit-specific Requirements
Well plat mylars must be of a scale that is compatible with agency USGS maps. The agency literally overlays the mylar over a USGS map to determine the location of the wells. Plats

Mountaineer Commercial Scale Carbon Capture and Storage (CCS) Project
CO2 Storage Report Page 58 of 61 must meet the requirements listed under ’35-4-9, Form and Content of Plats, WVDEP Legislative Rules.
The reclamation plan must be specific and include proposed layout and restoration plan diagrams. The diagrams must indicate access roads, site perimeters and work areas, site drainage, and areas to be restored.
No work what-so-ever, including site preparation, can be done until the well work permit has been issued by the WVDEP and received by the permittee.
2.5.6 Well Abandonment and Relocation
If upon drilling, it is determined that a well must be abandoned and a new well must be drilled at a new location, a well work plugging permit must be obtained prior to plugging the abandoned well and a new well work permit must be obtained for the new well, even if the location of the new well is only 25’ from the former site.
2.5.7 Site Safety Plans
Site Safety plans are typically required to be submitted with the well work permit applications, as part of the agency’s deep well policy. (Note that the commission’s guidelines in this regard are not directly applicable since this is not a deep gas well, and requirements may vary state to state or country to country).
2.5.8 Storm Water Permitting
The requirements of a site storm water permit supersede those of the reclamation plan that is filed with the well work permit.
2.5.9 Environmental Permitting
Pursuant to the National Environmental Policy Act (NEPA), the U.S. Department of Energy (DOE) was required to evaluate potential environmental impacts as part of its decision-making process to determine whether provide financial assistance beyond Phase I of the commercial-scale Mountaineer CCS project. The NEPA evaluation considered all aspects of the proposed project (i.e. CO2 capture, transport, and storage) with a focus on 18 key resource areas: air quality; greenhouse gases; geology; physiography & soils; groundwater; surface water; wetlands & floodplains; biological resources; cultural resources; land use & aesthetics; traffic; noise; materials & waste management; human health & safety; utilities; community services; socioeconomics; and environmental justice.

Mountaineer Commercial Scale Carbon Capture and Storage (CCS) Project
CO2 Storage Report Page 59 of 61 This comprehensive evaluation is collectively referred to an Environmental Impact Statement (EIS). Preparation of the draft EIS required a significant amount of field studies to evaluate biological, cultural, and water resources that may be impacted by the project. The EIS evaluation was a very important part of Phase-I of the project and had to be completed before any construction work can be started. DOE issued a draft EIS for public review on March 11, 2011. A copy of the draft EIS can be found at: www.netl.doe.gov/technologies/coalpower/cctc/EIS/eis_mountaineer_draft.html
3.0 Conclusions
Understanding sub-surface geology is a time consuming and labor intensive process especially in an un-explored region. The Mountaineer plant region in West Virginia is not a part of the conventional oil and gas exploration region and hence there is considerable lack of pre-existing data. Based on the experiences of drilling six deep wells, the associated geologic and geophysical work and the experience from running the CO2 injection operations, AEP has a better understanding of the sub-surface and a CO2 sequestration project.
Data acquired from the Borrow well indicates excellent reservoir potential in the lower Copper Ridge formation. Image log analysis does not indicate large numbers of natural fractures in the Copper Ridge reservoir. It was found that CT scan of whole core can determine with greater precision the presence and depths of vugs within the Copper Ridge dolomite, the connectivity of the vugs and the highly variable nature of the vugs with respect to vertical depth. The geology observed at the BA-02 site is similar compared to the geology at PVF site. Some of the subsurface lessons learned from AEP’s sequestration efforts are (not in order of importance):
• We have identified a new geologic horizon (lower Copper Ridge) for CO2 sequestration which was previously not a known to be a prospective geologic horizon for CO2 storage.
• The deeper sandstone units in this region (greater than 5000ft) do not show high potential for large scale CO2 sequestration, although these sand units were the target horizons during the initial stage of the PVF project.
• Preliminary simulation results show 1.5 million metric tonnes/year CO2 injection for 5 years can be achieved at Copper Ridge dolomite formation with injection pressure lower than the fracture pressure of the formation.
• Geophysical techniques such as surface seismic have limitations (since the target reservoirs are thin ~30ft surface seismic data cannot resolves these horizons).
• Using un-tested/new/unconventional techniques/technology might result in un-expected complications and delays (e.g. installation of permanent micro-seismic sensors in a monitoring well was extremely difficult and could not be achieved).
• Maintaining annulus pressure higher than injection pressure, which is proposed in the new UIC-VI permit (specific to CO2 sequestration wells), involves maintaining an elaborate WMMS system which requires additional resources and planning.
• Drilling a deep well is always associated with uncertainty and un-expected delays can occur during this process.
• It will be advisable to stick with tools/services available locally and hence planning of characterization/drilling/monitoring should be done accordingly (we have experienced delays for well workover due to unavailability of tools).

Mountaineer Commercial Scale Carbon Capture and Storage (CCS) Project
CO2 Storage Report Page 60 of 61
• Above injection zone/above cap rock monitoring might not be very effective at this site (lack of fluid bearing sand bodies which are in close proximity and above the target reservoir horizons at this site).
• Reservoir tests are crucial during the characterization process. • The emphasis of the subsequent projects should be on obtaining more ‘injection
data’. Results from numerical models need to be calibrated with real data. • The geologic uncertainty will probably mask any other minor uncertainties.
Some of the primary unknowns for this project are the size of the reservoir, spatial distribution of the vugular porosity and the spatial variability of the porosity/permeability distribution. Learning about the sub-surface CO2 storage capabilities at this site is a work in progress and additional data will provide us with a better understanding of the geology and reduce the overall uncertainty and risk of the project.

Mountaineer Commercial Scale Carbon Capture and Storage (CCS) Project
CO2 Storage Report Page 61 of 61 4.0 References
Bacon, D.H., 2009, Simulations of Pilot-Scale Supercritical CO2 Injection at the Mountaineer Site, Letter Report, Battelle Pacific Northwest Division, Richland, WA, 25 pp.
Bennion, D.B. and S. Bachu, 2010, Drainage and imbibition CO2/brine relative permeability curves at reservoir conditions for carbonate formations, paper SPE 134028 presented at SPE Annual Technical Conference and Exhibition, Florence, Italy, 19-22 September.
Draft for Client Review: Reservoir Simulations to Support Mountaineer CCS-II Phase-I Design for the Geological Storage System, Battelle, May 2011.
Draft for Client Review: Mountaineer CCS II Project: Phase I Geologic Characterization, Battelle, July 2011.
Gupta, N., Final Topical Report: The Ohio River Valley CO2 storage Project; AEP Mountaineer Plant West Virginia; Numerical Simulation and Risk Assessment Report, , Battelle Memorial Institute, June 2008.
Lucier, A., Zoback, M.D., Gupta, N., Ramakrishnan, T.S., 2006. Geomechanical aspects of CO2 sequestration in a deep saline reservoir in the Ohio River Valley region. Environ.Geosci. 13, 85–103.
White, M.D. and M. Oostrom, 2000, STOMP: Subsurface Transport Over Multiple Phases, Version 2.0, Theory Guide, PNNL-12030, UC-2010, Pacific Northwest National Laboratory, Richland, WA, 277 pp.