amd cfo commentary slides 14q4
TRANSCRIPT
| AMD FINANCIAL RESULTS | JANUARY 20, 2015 1 1
AMD FOURTH QUARTER AND ANNUAL 2014
FINANCIAL RESULTS
January 20, 2015
| AMD FINANCIAL RESULTS | JANUARY 20, 2015 2 2
CAUTIONARY STATEMENT This document contains forward-looking statements concerning Advanced Micro Devices, Inc. (“AMD” or the “Company”); its financial outlook for the first quarter of 2015 and fiscal 2015, including revenue, gross margin, non-GAAP operating expenses, the total of interest expense, taxes and other expense, inventory and capital expenditures; its ability to non-GAAP profitable at the net income level in 2015; its targeted and optimal cash, cash equivalents and marketable securities balances; its restructuring plan, including expected restructuring charges, related cash payments and related operational savings; its growth opportunities; and its ability to transition its revenue to high-growth markets, which are made pursuant to the safe harbor provisions of the Private Securities Litigation Reform Act of 1995. Forward-looking statements are commonly identified by words such as “believes,” “expects,” “may,” “will,” “should,” “seeks,” “intends,” “plans,” “estimates,” “anticipates,” “projects,” “would” and other terms with similar meaning. Investors are cautioned that the forward-looking statements in this document are based on current beliefs, assumptions and expectations, speak only as of the date of this document and involve risks and uncertainties that could cause actual results to differ materially from current expectations. Risks include that Intel Corporation's pricing, marketing and rebating programs, product bundling, standard setting, new product introductions or other activities may negatively impact AMD’s plans; that AMD will require additional funding and may be unable to raise sufficient capital on favorable terms, or at all; that customers stop buying AMD’s products or materially reduce their operations or demand for AMD’s products; that AMD may be unable to develop, launch and ramp new products and technologies in the volumes that are required by the market at mature yields on a timely basis; that AMD’s third-party foundry suppliers will be unable to transition AMD’s products to advanced manufacturing process technologies in a timely and effective way or to manufacture AMD’s products on a timely basis in sufficient quantities and using competitive process technologies; that AMD will be unable to obtain sufficient manufacturing capacity or components to meet demand for its products or will not fully utilize its projected manufacturing capacity needs at GLOBALFOUNDRIES, Inc. (GF) microprocessor manufacturing facilities; that AMD’s requirements for wafers will be less than the fixed number of wafers that it agreed to purchase from GF or GF encounters problems that significantly reduce the number of functional die it receives from each wafer; that AMD is unable to successfully implement its long-term business strategy; that the completion and impact of the 2014 restructuring plan and AMD”s transformation could adversely affect AMD; that AMD inaccurately estimates the quantity or type of products that its customers will want in the future or will ultimately end up purchasing, resulting in excess or obsolete inventory; that AMD is unable to manage the risks related to the use of its third-party distributors and add-in-board (AIB) partners or offer the appropriate incentives to focus them on the sale of AMD’s products; that AMD may be unable to maintain the level of investment in research and development that is required to remain competitive; that there may be unexpected variations in market growth and demand for AMD’s products and technologies in light of the product mix that it may have available at any particular time; that global business and economic conditions will not improve or will worsen; that PC market conditions will not improve or will worsen; that demand for computers will be lower than currently expected; and the effect of political or economic instability, domestically or internationally, on AMD’s sales or supply chain. Investors are urged to review in detail the risks and uncertainties in AMD's Securities and Exchange Commission filings, including but not limited to the Quarterly Report Form 10-Q for the quarter ended September 27, 2014.
| AMD FINANCIAL RESULTS | JANUARY 20, 2015 3 3
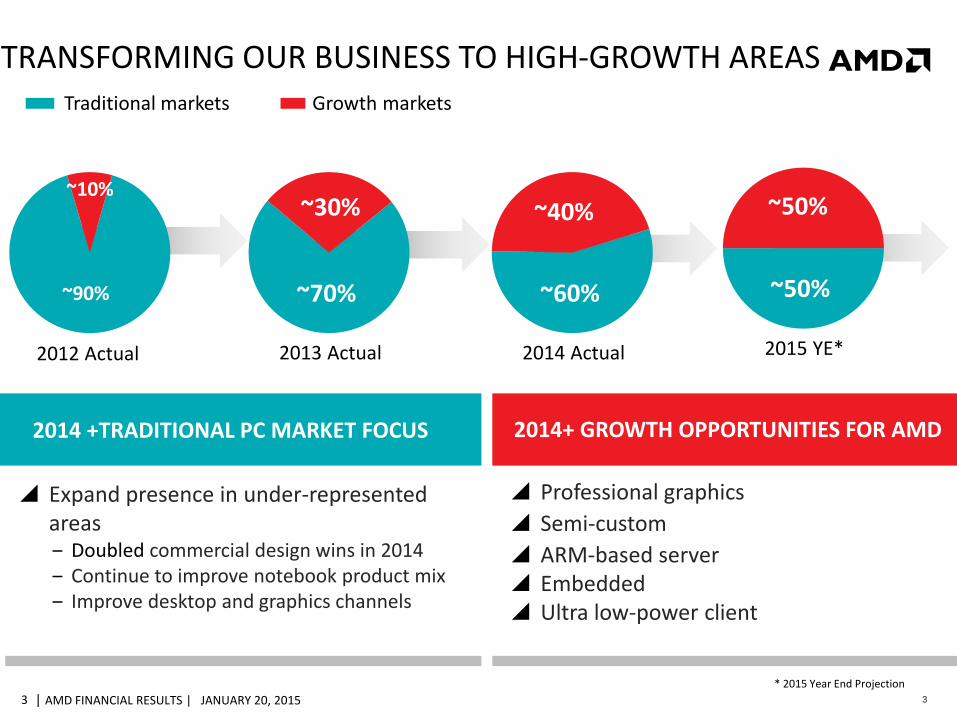
TRANSFORMING OUR BUSINESS TO HIGH-GROWTH AREAS Traditional markets Growth markets
Expand presence in under-represented areas ‒ Doubled commercial design wins in 2014 ‒ Continue to improve notebook product mix ‒ Improve desktop and graphics channels
2014 +TRADITIONAL PC MARKET FOCUS
Professional graphics
Semi-custom
ARM-based server Embedded Ultra low-power client
2014+ GROWTH OPPORTUNITIES FOR AMD
2012 Actual
~90%
~10%
2015 YE*
~50%
~50%
2013 Actual
~70%
~30%
2014 Actual
~60%
~40%
* 2015 Year End Projection
| AMD FINANCIAL RESULTS | JANUARY 20, 2015 4 4
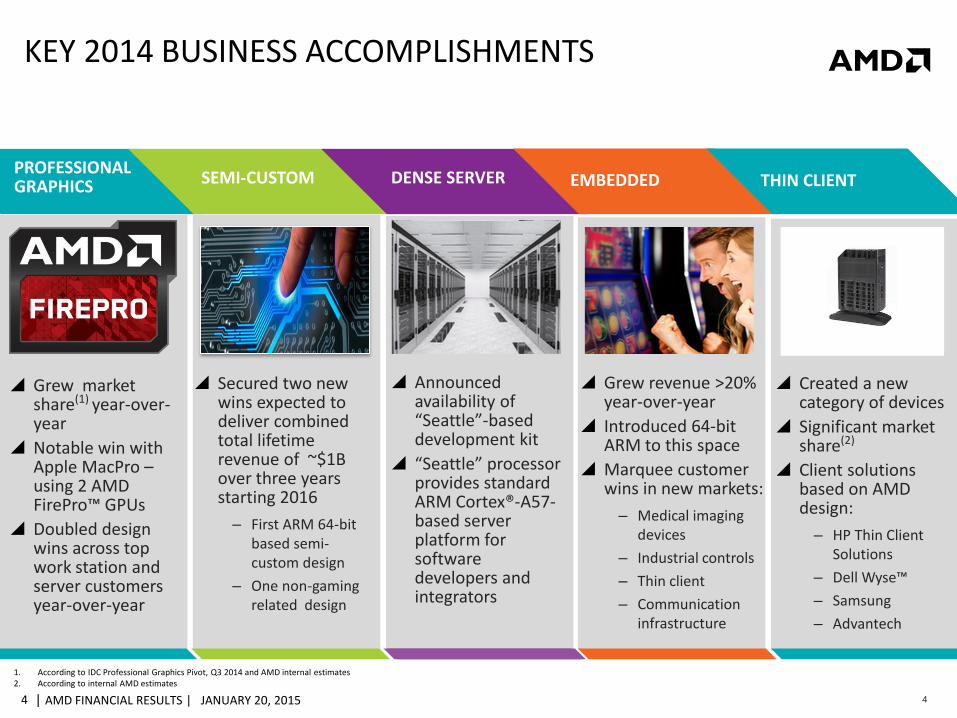
KEY 2014 BUSINESS ACCOMPLISHMENTS
PROFESSIONAL GRAPHICS
Grew market share(1) year-over-year
Notable win with Apple MacPro – using 2 AMD FirePro™ GPUs
Doubled design wins across top work station and server customers year-over-year
SEMI-CUSTOM
Secured two new wins expected to deliver combined total lifetime revenue of ~$1B over three years starting 2016
– First ARM 64-bit based semi-custom design
– One non-gaming related design
DENSE SERVER
Announced availability of “Seattle”-based development kit
“Seattle” processor provides standard ARM Cortex®-A57- based server platform for software developers and integrators
EMBEDDED
Grew revenue >20% year-over-year
Introduced 64-bit ARM to this space
Marquee customer wins in new markets:
– Medical imaging devices
– Industrial controls
– Thin client
– Communication infrastructure
THIN CLIENT
Created a new category of devices
Significant market share(2)
Client solutions based on AMD design:
– HP Thin Client Solutions
– Dell Wyse™
– Samsung
– Advantech
1. According to IDC Professional Graphics Pivot, Q3 2014 and AMD internal estimates 2. According to internal AMD estimates
| AMD FINANCIAL RESULTS | JANUARY 20, 2015 5 5
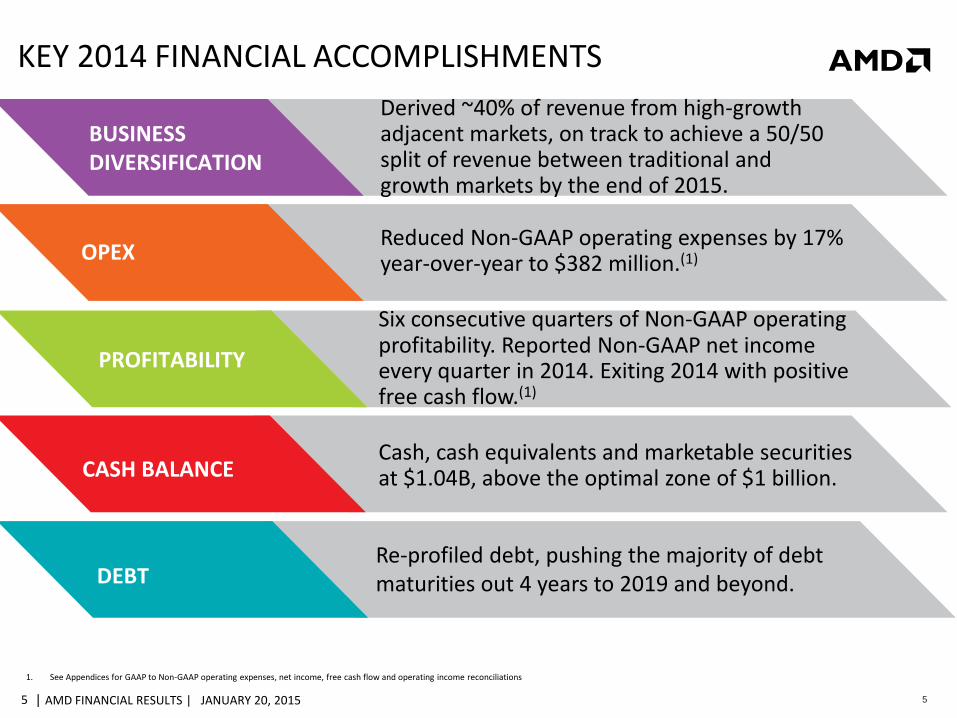
KEY 2014 FINANCIAL ACCOMPLISHMENTS
CASH BALANCE
Cash, cash equivalents and marketable securities at $1.04B, above the optimal zone of $1 billion.
BUSINESS DIVERSIFICATION
Derived ~40% of revenue from high-growth adjacent markets, on track to achieve a 50/50 split of revenue between traditional and growth markets by the end of 2015.
DEBT Re-profiled debt, pushing the majority of debt maturities out 4 years to 2019 and beyond.
1. See Appendices for GAAP to Non-GAAP operating expenses, net income, free cash flow and operating income reconciliations
OPEX Reduced Non-GAAP operating expenses by 17% year-over-year to $382 million.(1)
PROFITABILITY
Six consecutive quarters of Non-GAAP operating profitability. Reported Non-GAAP net income every quarter in 2014. Exiting 2014 with positive free cash flow.(1)
| AMD FINANCIAL RESULTS | JANUARY 20, 2015 6 6
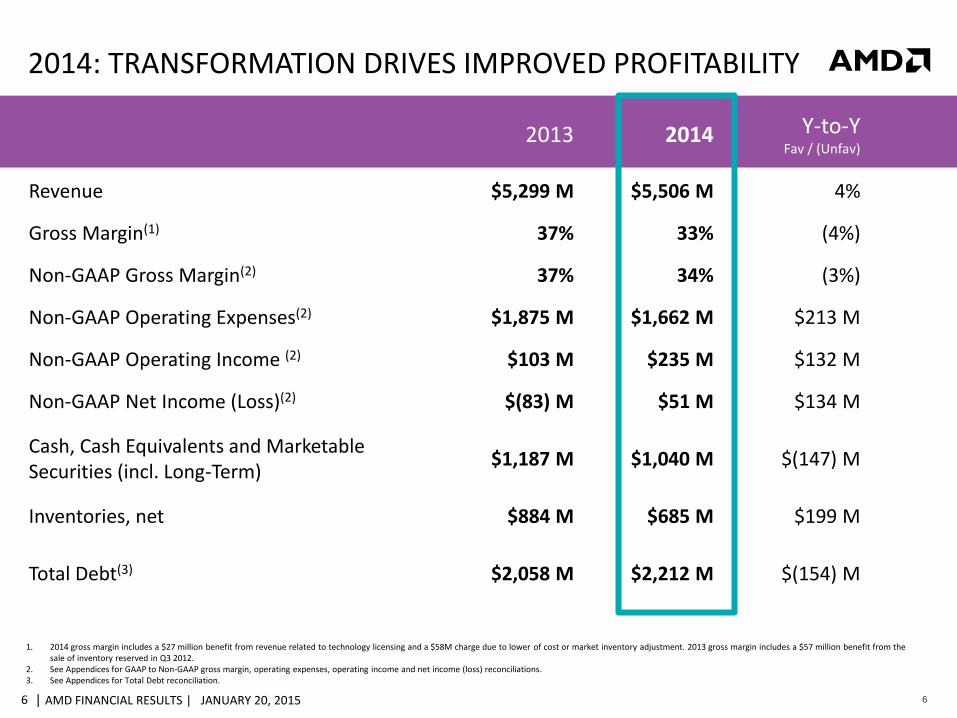
2014: TRANSFORMATION DRIVES IMPROVED PROFITABILITY
1. 2014 gross margin includes a $27 million benefit from revenue related to technology licensing and a $58M charge due to lower of cost or market inventory adjustment. 2013 gross margin includes a $57 million benefit from the sale of inventory reserved in Q3 2012.
2. See Appendices for GAAP to Non-GAAP gross margin, operating expenses, operating income and net income (loss) reconciliations. 3. See Appendices for Total Debt reconciliation.
2013 2014 Y-to-Y Fav / (Unfav)
Revenue $5,299 M $5,506 M 4%
Gross Margin(1) 37% 33% (4%)
Non-GAAP Gross Margin(2) 37% 34% (3%)
Non-GAAP Operating Expenses(2) $1,875 M $1,662 M $213 M
Non-GAAP Operating Income (2) $103 M $235 M $132 M
Non-GAAP Net Income (Loss)(2) $(83) M $51 M $134 M
Cash, Cash Equivalents and Marketable Securities (incl. Long-Term)
$1,187 M $1,040 M $(147) M
Inventories, net $884 M $685 M $199 M
Total Debt(3) $2,058 M $2,212 M $(154) M
| AMD FINANCIAL RESULTS | JANUARY 20, 2015 7 7
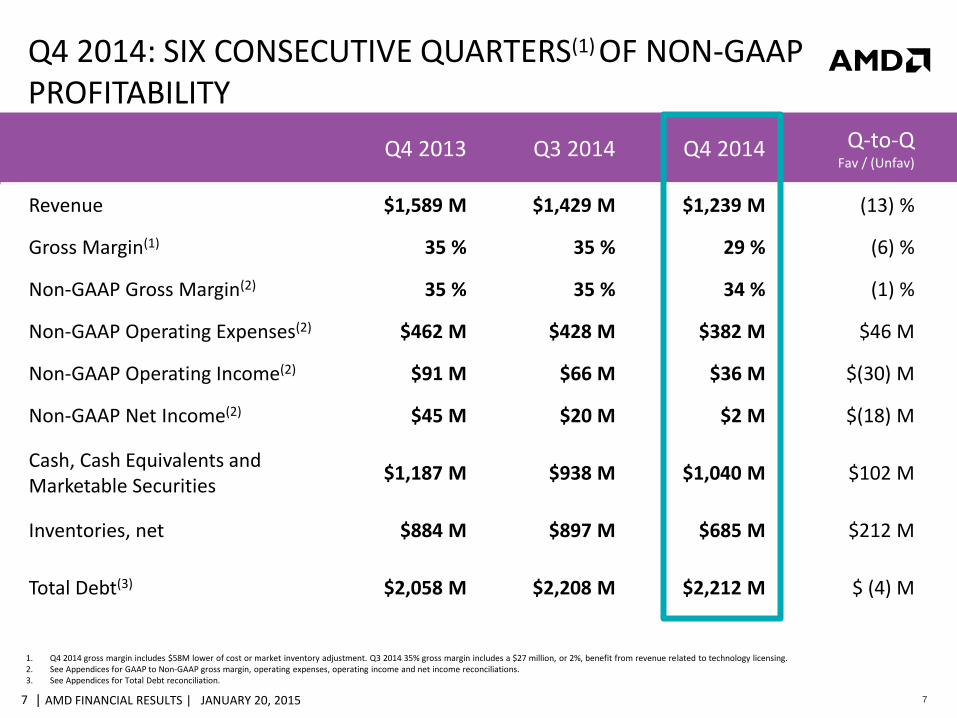
Q4 2014: SIX CONSECUTIVE QUARTERS(1) OF NON-GAAP PROFITABILITY
1. Q4 2014 gross margin includes $58M lower of cost or market inventory adjustment. Q3 2014 35% gross margin includes a $27 million, or 2%, benefit from revenue related to technology licensing. 2. See Appendices for GAAP to Non-GAAP gross margin, operating expenses, operating income and net income reconciliations. 3. See Appendices for Total Debt reconciliation.
Q4 2013 Q3 2014 Q4 2014 Q-to-Q Fav / (Unfav)
Revenue $1,589 M $1,429 M $1,239 M (13) %
Gross Margin(1) 35 % 35 % 29 % (6) %
Non-GAAP Gross Margin(2) 35 % 35 % 34 % (1) %
Non-GAAP Operating Expenses(2) $462 M $428 M $382 M $46 M
Non-GAAP Operating Income(2) $91 M $66 M $36 M $(30) M
Non-GAAP Net Income(2) $45 M $20 M $2 M $(18) M
Cash, Cash Equivalents and Marketable Securities
$1,187 M $938 M $1,040 M $102 M
Inventories, net $884 M $897 M $685 M $212 M
Total Debt(3) $2,058 M $2,208 M $2,212 M $ (4) M
| AMD FINANCIAL RESULTS | JANUARY 20, 2015 8 8
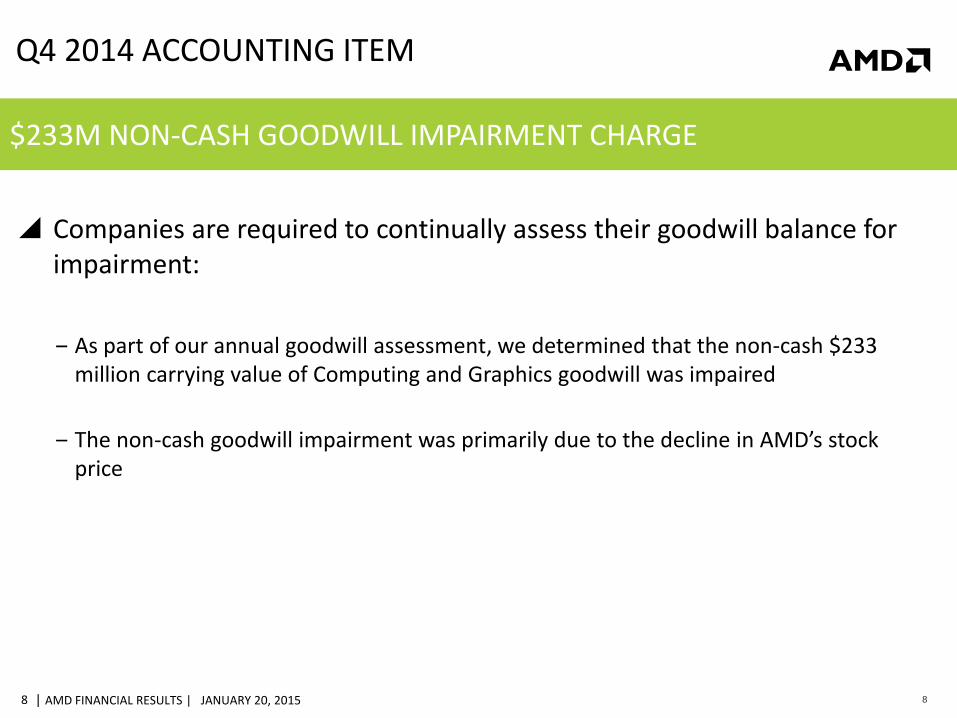
Companies are required to continually assess their goodwill balance for impairment:
‒ As part of our annual goodwill assessment, we determined that the non-cash $233
million carrying value of Computing and Graphics goodwill was impaired
‒ The non-cash goodwill impairment was primarily due to the decline in AMD’s stock price
Q4 2014 ACCOUNTING ITEM
$233M NON-CASH GOODWILL IMPAIRMENT CHARGE
| AMD FINANCIAL RESULTS | JANUARY 20, 2015 9 9
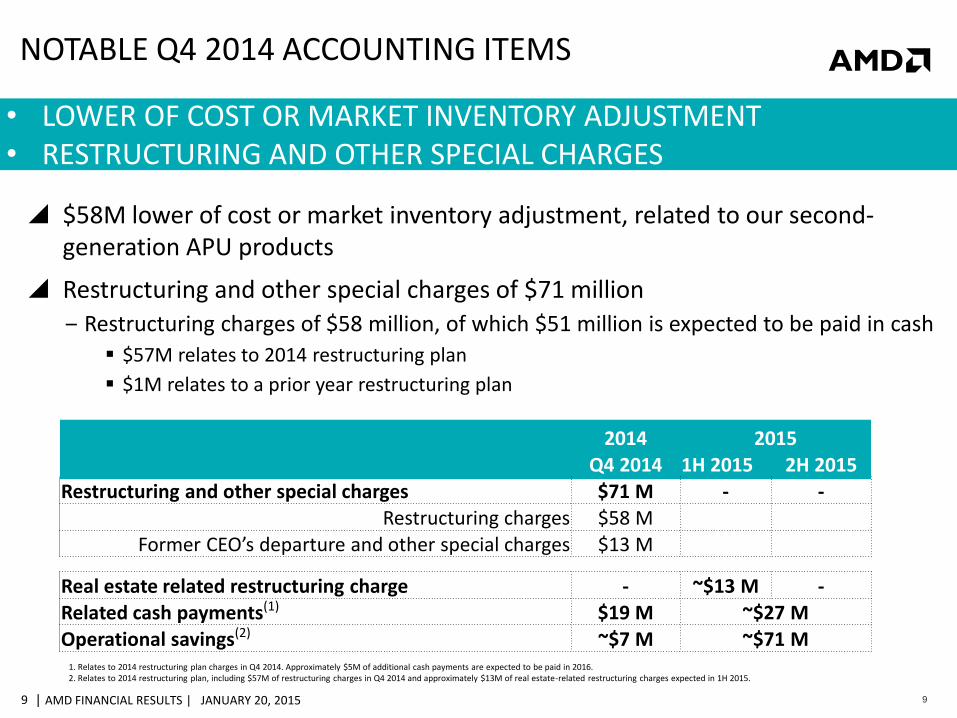
NOTABLE Q4 2014 ACCOUNTING ITEMS
$58M lower of cost or market inventory adjustment, related to our second-generation APU products
Restructuring and other special charges of $71 million
‒ Restructuring charges of $58 million, of which $51 million is expected to be paid in cash
$57M relates to 2014 restructuring plan
$1M relates to a prior year restructuring plan
• LOWER OF COST OR MARKET INVENTORY ADJUSTMENT • RESTRUCTURING AND OTHER SPECIAL CHARGES
2014 2015
Q4 2014 1H 2015 2H 2015
Restructuring and other special charges $71 M - -
Restructuring charges $58 M Former CEO’s departure and other special charges $13 M
Real estate related restructuring charge - ~$13 M - Related cash payments(1) $19 M ~$27 M
Operational savings(2) ~$7 M ~$71 M 1. Relates to 2014 restructuring plan charges in Q4 2014. Approximately $5M of additional cash payments are expected to be paid in 2016. 2. Relates to 2014 restructuring plan, including $57M of restructuring charges in Q4 2014 and approximately $13M of real estate-related restructuring charges expected in 1H 2015.
| AMD FINANCIAL RESULTS | JANUARY 20, 2015 10 10
$592
$557
$516 $506 $491 $479
$443 $462
$421 $431 $428
$382
Q1'12 Q2'12 Q3'12 Q4'12 Q1'13 Q2'13 Q3'13 Q4'13 Q1'14 Q2'14 Q3'14 Q4'14
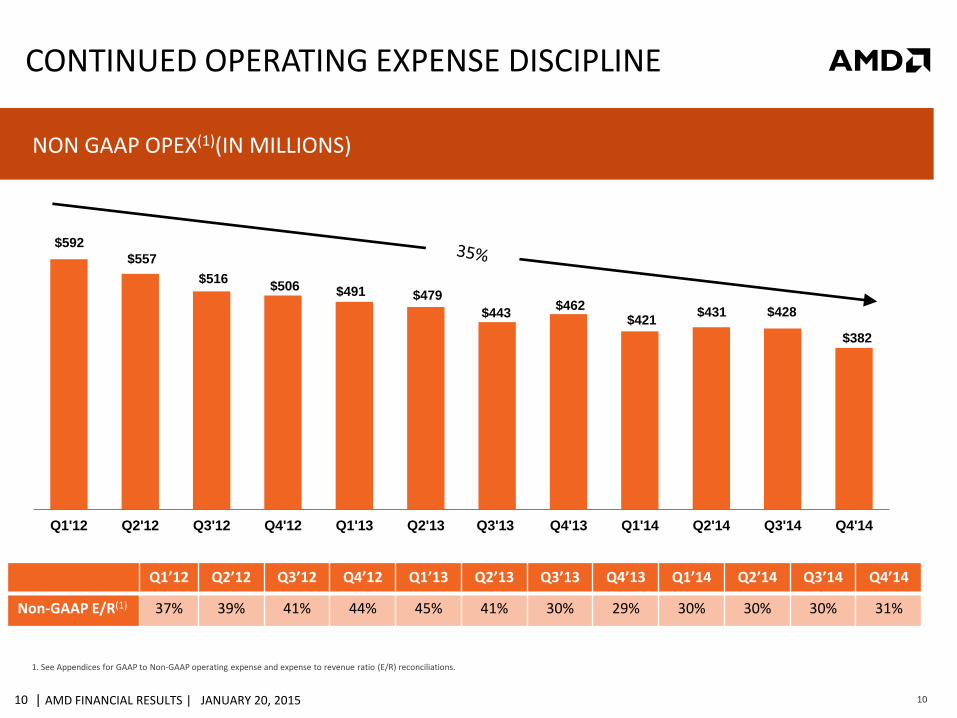
CONTINUED OPERATING EXPENSE DISCIPLINE
NON GAAP OPEX(1)(IN MILLIONS)
1. See Appendices for GAAP to Non-GAAP operating expense and expense to revenue ratio (E/R) reconciliations.
Q1’12 Q2’12 Q3’12 Q4’12 Q1’13 Q2’13 Q3’13 Q4’13 Q1’14 Q2’14 Q3’14 Q4’14
Non-GAAP E/R(1) 37% 39% 41% 44% 45% 41% 30% 29% 30% 30% 30% 31%
| AMD FINANCIAL RESULTS | JANUARY 20, 2015 11 11
Q4 2013 Q3 2014 Q4 2014 2013 2014 Q-to-Q
Fav / (Unfav)
Y-toY Fav/
(Unfav)
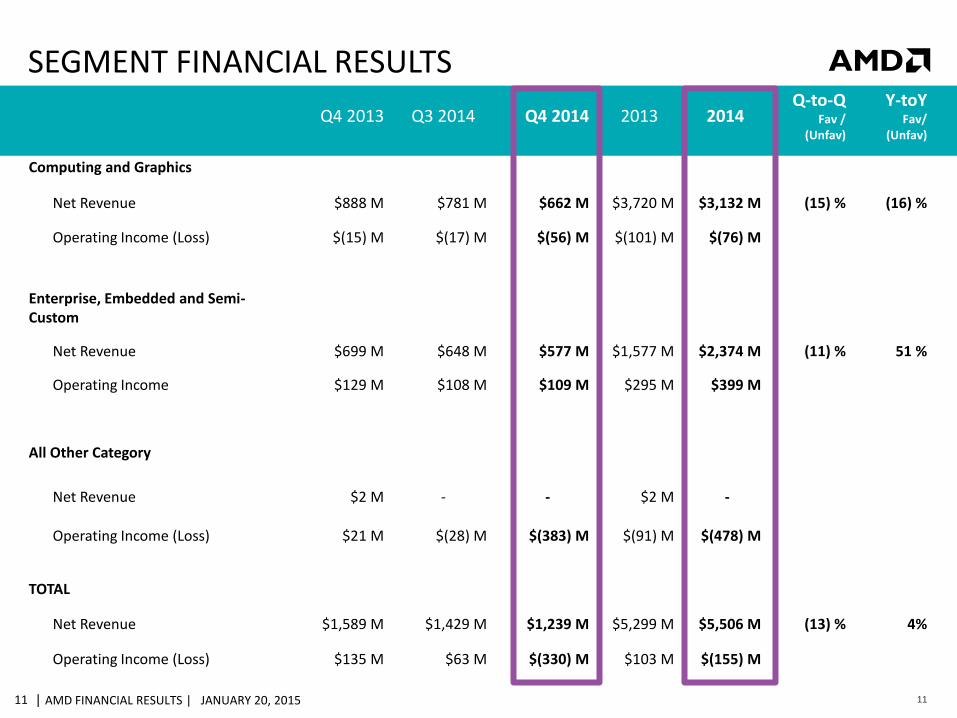
Computing and Graphics
Net Revenue $888 M $781 M $662 M $3,720 M $3,132 M (15) % (16) %
Operating Income (Loss) $(15) M $(17) M $(56) M $(101) M $(76) M
Enterprise, Embedded and Semi-Custom
Net Revenue $699 M $648 M $577 M $1,577 M $2,374 M (11) % 51 %
Operating Income $129 M $108 M $109 M $295 M $399 M
All Other Category
Net Revenue $2 M - - $2 M -
Operating Income (Loss) $21 M $(28) M $(383) M $(91) M $(478) M
TOTAL
Net Revenue $1,589 M $1,429 M $1,239 M $5,299 M $5,506 M (13) % 4%
Operating Income (Loss) $135 M $63 M $(330) M $103 M $(155) M
SEGMENT FINANCIAL RESULTS
| AMD FINANCIAL RESULTS | JANUARY 20, 2015 12 12
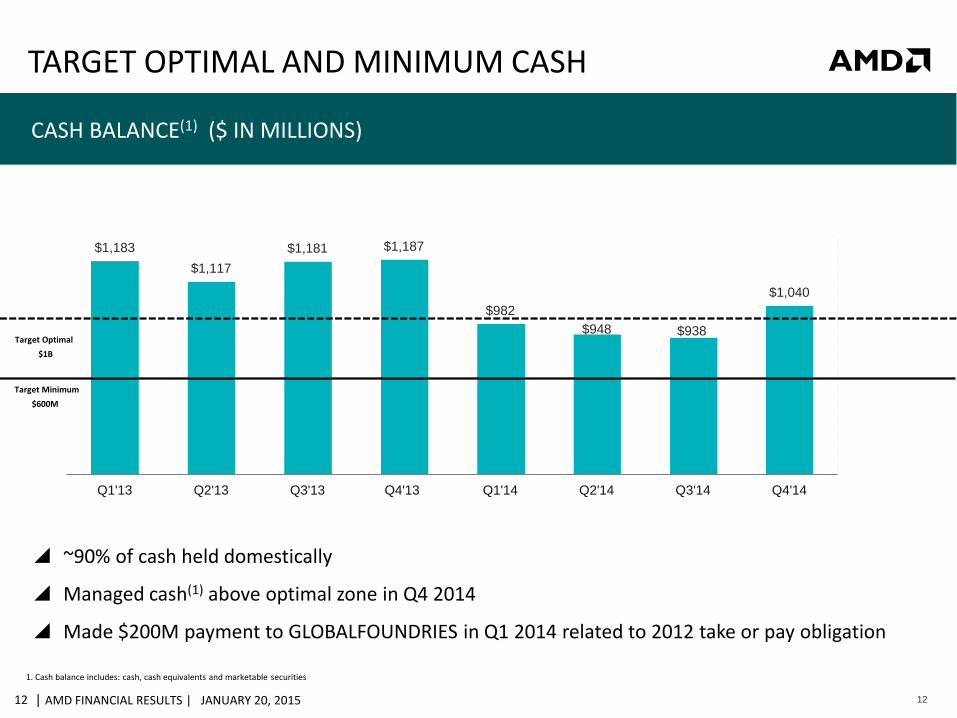
TARGET OPTIMAL AND MINIMUM CASH
1. Cash balance includes: cash, cash equivalents and marketable securities
CASH BALANCE(1) ($ IN MILLIONS)
~90% of cash held domestically
Managed cash(1) above optimal zone in Q4 2014
Made $200M payment to GLOBALFOUNDRIES in Q1 2014 related to 2012 take or pay obligation
$1,183
$1,117
$1,181 $1,187
$982
$948 $938
$1,040
$500
$550
$600
$650
$700
$750
$800
$850
$900
$950
$1,000
$1,050
$1,100
$1,150
$1,200
$1,250
Q1'13 Q2'13 Q3'13 Q4'13 Q1'14 Q2'14 Q3'14 Q4'14
Axis
Tit
le
Target Optimal
$1B
Target Minimum
$600M
| AMD FINANCIAL RESULTS | JANUARY 20, 2015 13 13
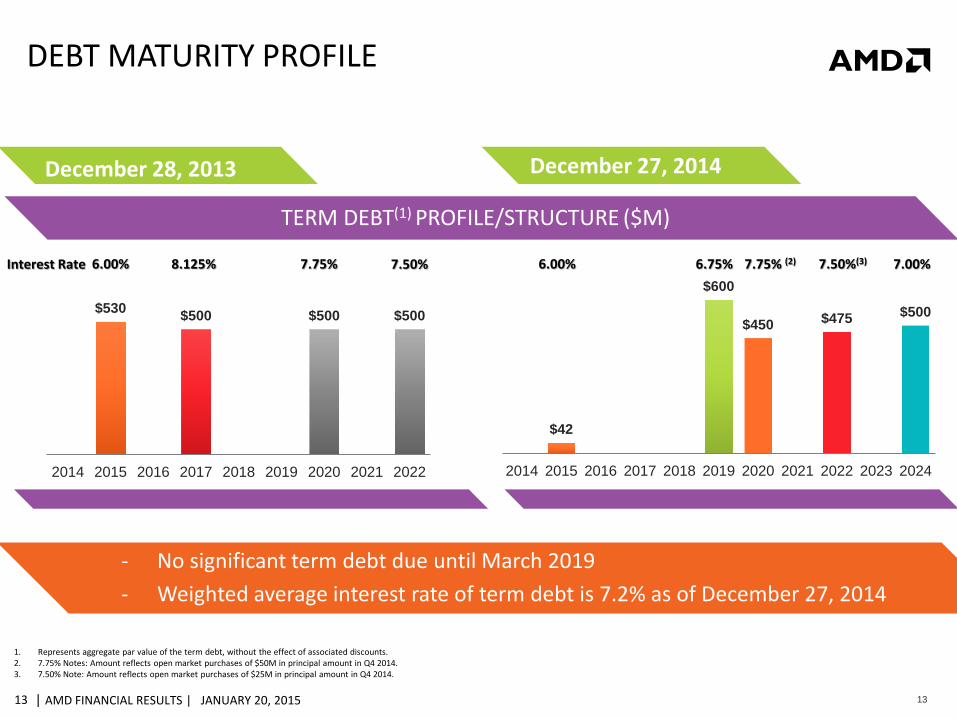
TERM DEBT(1) PROFILE/STRUCTURE ($M)
DEBT MATURITY PROFILE
December 28, 2013
Interest Rate
1. Represents aggregate par value of the term debt, without the effect of associated discounts. 2. 7.75% Notes: Amount reflects open market purchases of $50M in principal amount in Q4 2014. 3. 7.50% Note: Amount reflects open market purchases of $25M in principal amount in Q4 2014.
$530 $500 $500 $500
2014 2015 2016 2017 2018 2019 2020 2021 2022
8.125% 7.75% 7.50% 6.00%
September 27, 2014
$42
$600
$450 $475 $500
2014 2015 2016 2017 2018 2019 2020 2021 2022 2023 2024
7.75% (2) 7.50%(3) 6.00% 6.75% 7.00%
December 27, 2014
- No significant term debt due until March 2019
- Weighted average interest rate of term debt is 7.2% as of December 27, 2014
| AMD FINANCIAL RESULTS | JANUARY 20, 2015 14 14
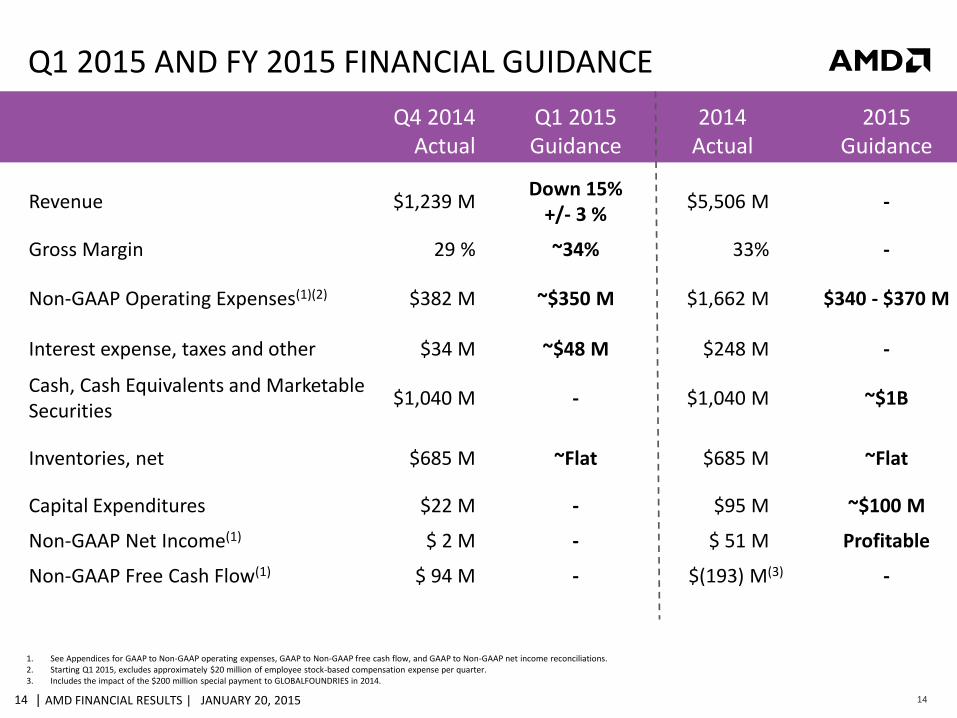
Q1 2015 AND FY 2015 FINANCIAL GUIDANCE
Q4 2014 Actual
Q1 2015 Guidance
2014 Actual
2015 Guidance
Revenue $1,239 M Down 15%
+/- 3 % $5,506 M -
Gross Margin 29 % ~34% 33% -
Non-GAAP Operating Expenses(1)(2) $382 M ~$350 M $1,662 M $340 - $370 M
Interest expense, taxes and other $34 M ~$48 M $248 M -
Cash, Cash Equivalents and Marketable Securities
$1,040 M - $1,040 M ~$1B
Inventories, net $685 M ~Flat $685 M ~Flat
Capital Expenditures $22 M - $95 M ~$100 M
Non-GAAP Net Income(1) $ 2 M - $ 51 M Profitable
Non-GAAP Free Cash Flow(1) $ 94 M - $(193) M(3) -
1. See Appendices for GAAP to Non-GAAP operating expenses, GAAP to Non-GAAP free cash flow, and GAAP to Non-GAAP net income reconciliations. 2. Starting Q1 2015, excludes approximately $20 million of employee stock-based compensation expense per quarter. 3. Includes the impact of the $200 million special payment to GLOBALFOUNDRIES in 2014.
| AMD FINANCIAL RESULTS | JANUARY 20, 2015 15 15
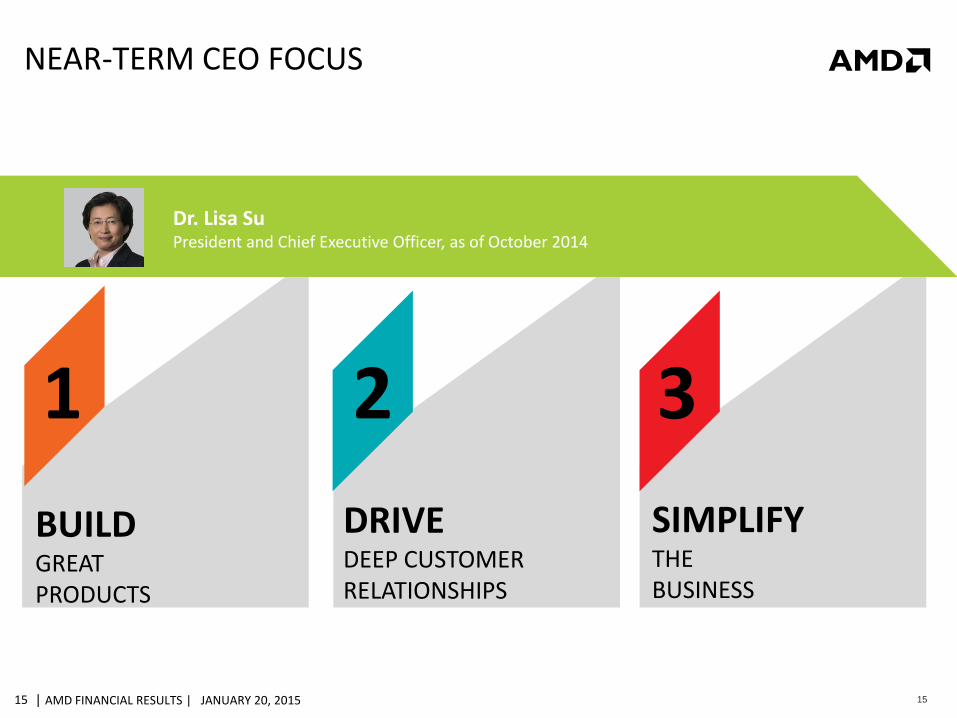
NEAR-TERM CEO FOCUS
1 3 2
SIMPLIFY THE BUSINESS
BUILD GREAT PRODUCTS
DRIVE DEEP CUSTOMER RELATIONSHIPS
Dr. Lisa Su President and Chief Executive Officer, as of October 2014
| AMD FINANCIAL RESULTS | JANUARY 20, 2015 16 16
FOOTNOTES
Non-GAAP Measures:
To supplement the financial results of Advanced Micro Devices, Inc. (“AMD” or the “Company”) presented on a U.S. GAAP (“GAAP”) basis, this commentary contains non-GAAP financial measures, including non-GAAP gross margin, non-GAAP operating expenses, non-GAAP operating income, non-GAAP net income (loss), non-GAAP earnings (loss) per share and non-GAAP free cash flow. These non-GAAP financial measures reflect certain adjustments, and the Company has presented a reconciliation of GAAP to non-GAAP financial measures in the tables below.
| AMD FINANCIAL RESULTS | JANUARY 20, 2015 17 17
INVESTOR RELATIONS CONTACTS
Ruth Cotter Phone: 408-749-3887 Email: [email protected] Liz Morali Phone: 408-749-4567 Email: [email protected] Alina Ostrovsky Phone: 408-749-6688 Email: [email protected]
| AMD FINANCIAL RESULTS | JANUARY 20, 2015 18 18
DISCLAIMER & ATTRIBUTION
The information presented in this document is for informational purposes only and may contain technical inaccuracies, omissions and typographical errors.
The information contained herein is subject to change and may be rendered inaccurate for many reasons, including but not limited to product and roadmap changes, component and motherboard version changes, new model and/or product releases, product differences between differing manufacturers, software changes, BIOS flashes, firmware upgrades, or the like. AMD assumes no obligation to update or otherwise correct or revise this information. However, AMD reserves the right to revise this information and to make changes from time to time to the content hereof without obligation of AMD to notify any person of such revisions or changes.
AMD MAKES NO REPRESENTATIONS OR WARRANTIES WITH RESPECT TO THE CONTENTS HEREOF AND ASSUMES NO RESPONSIBILITY FOR ANY INACCURACIES, ERRORS OR OMISSIONS THAT MAY APPEAR IN THIS INFORMATION.
AMD SPECIFICALLY DISCLAIMS ANY IMPLIED WARRANTIES OF MERCHANTABILITY OR FITNESS FOR ANY PARTICULAR PURPOSE. IN NO EVENT WILL AMD BE LIABLE TO ANY PERSON FOR ANY DIRECT, INDIRECT, SPECIAL OR OTHER CONSEQUENTIAL DAMAGES ARISING FROM THE USE OF ANY INFORMATION CONTAINED HEREIN, EVEN IF AMD IS EXPRESSLY ADVISED OF THE POSSIBILITY OF SUCH DAMAGES.
ATTRIBUTION
© 2015 Advanced Micro Devices, Inc. All rights reserved. AMD, the AMD Arrow logo and combinations thereof are trademarks of Advanced Micro Devices, Inc. in the United States and/or other jurisdictions. SPEC is a registered trademark of the Standard Performance Evaluation Corporation (SPEC). Other names are for informational purposes only and may be trademarks of their respective owners.
| AMD FINANCIAL RESULTS | JANUARY 20, 2015 19 19
APPENDICES
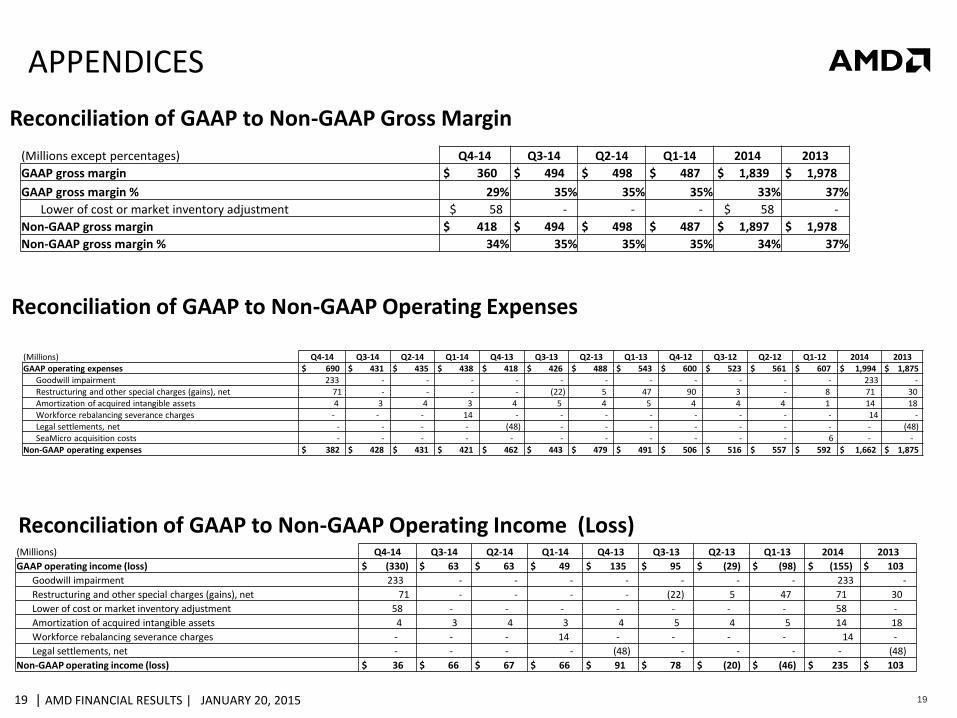
Reconciliation of GAAP to Non-GAAP Operating Expenses
Reconciliation of GAAP to Non-GAAP Operating Income (Loss)
Reconciliation of GAAP to Non-GAAP Gross Margin
(Millions except percentages) Q4-14 Q3-14 Q2-14 Q1-14 2014 2013
GAAP gross margin $ 360 $ 494 $ 498 $ 487 $ 1,839 $ 1,978
GAAP gross margin % 29% 35% 35% 35% 33% 37%
Lower of cost or market inventory adjustment $ 58 - - - $ 58 -
Non-GAAP gross margin $ 418 $ 494 $ 498 $ 487 $ 1,897 $ 1,978
Non-GAAP gross margin % 34% 35% 35% 35% 34% 37%
(Millions) Q4-14 Q3-14 Q2-14 Q1-14 Q4-13 Q3-13 Q2-13 Q1-13 Q4-12 Q3-12 Q2-12 Q1-12 2014 2013
GAAP operating expenses $ 690 $ 431 $ 435 $ 438 $ 418 $ 426 $ 488 $ 543 $ 600 $ 523 $ 561 $ 607 $ 1,994 $ 1,875
Goodwill impairment 233 - - - - - - - - - - - 233 -
Restructuring and other special charges (gains), net 71 - - - - (22) 5 47 90 3 - 8 71 30
Amortization of acquired intangible assets 4 3 4 3 4 5 4 5 4 4 4 1 14 18
Workforce rebalancing severance charges - - - 14 - - - - - - - - 14 -
Legal settlements, net - - - - (48) - - - - - - - - (48)
SeaMicro acquisition costs - - - - - - - - - - - 6 - -
Non-GAAP operating expenses $ 382 $ 428 $ 431 $ 421 $ 462 $ 443 $ 479 $ 491 $ 506 $ 516 $ 557 $ 592 $ 1,662 $ 1,875
(Millions) Q4-14 Q3-14 Q2-14 Q1-14 Q4-13 Q3-13 Q2-13 Q1-13 2014 2013
GAAP operating income (loss) $ (330) $ 63 $ 63 $ 49 $ 135 $ 95 $ (29) $ (98) $ (155) $ 103
Goodwill impairment 233 - - - - - - - 233 -
Restructuring and other special charges (gains), net 71 - - - - (22) 5 47 71 30
Lower of cost or market inventory adjustment 58 - - - - - - - 58 -
Amortization of acquired intangible assets 4 3 4 3 4 5 4 5 14 18
Workforce rebalancing severance charges - - - 14 - - - - 14 -
Legal settlements, net - - - - (48) - - - - (48)
Non-GAAP operating income (loss) $ 36 $ 66 $ 67 $ 66 $ 91 $ 78 $ (20) $ (46) $ 235 $ 103
| AMD FINANCIAL RESULTS | JANUARY 20, 2015 20 20
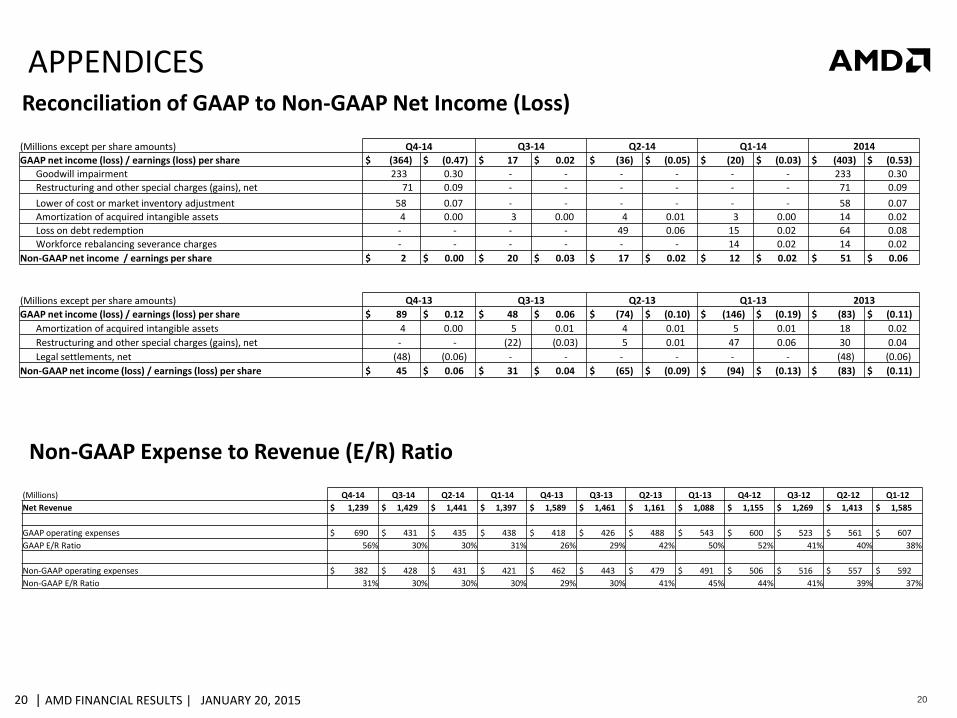
APPENDICES Reconciliation of GAAP to Non-GAAP Net Income (Loss)
Non-GAAP Expense to Revenue (E/R) Ratio
(Millions) Q4-14 Q3-14 Q2-14 Q1-14 Q4-13 Q3-13 Q2-13 Q1-13 Q4-12 Q3-12 Q2-12 Q1-12
Net Revenue $ 1,239 $ 1,429 $ 1,441 $ 1,397 $ 1,589 $ 1,461 $ 1,161 $ 1,088 $ 1,155 $ 1,269 $ 1,413 $ 1,585
GAAP operating expenses $ 690 $ 431 $ 435 $ 438 $ 418 $ 426 $ 488 $ 543 $ 600 $ 523 $ 561 $ 607
GAAP E/R Ratio 56% 30% 30% 31% 26% 29% 42% 50% 52% 41% 40% 38%
Non-GAAP operating expenses $ 382 $ 428 $ 431 $ 421 $ 462 $ 443 $ 479 $ 491 $ 506 $ 516 $ 557 $ 592
Non-GAAP E/R Ratio 31% 30% 30% 30% 29% 30% 41% 45% 44% 41% 39% 37%
(Millions except per share amounts) Q4-14 Q3-14 Q2-14 Q1-14 2014
GAAP net income (loss) / earnings (loss) per share $ (364) $ (0.47) $ 17 $ 0.02 $ (36) $ (0.05) $ (20) $ (0.03) $ (403) $ (0.53)
Goodwill impairment 233 0.30 - - - - - - 233 0.30
Restructuring and other special charges (gains), net 71 0.09 - - - - - - 71 0.09
Lower of cost or market inventory adjustment 58 0.07 - - - - - - 58 0.07
Amortization of acquired intangible assets 4 0.00 3 0.00 4 0.01 3 0.00 14 0.02
Loss on debt redemption - - - - 49 0.06 15 0.02 64 0.08
Workforce rebalancing severance charges - - - - - - 14 0.02 14 0.02
Non-GAAP net income / earnings per share $ 2 $ 0.00 $ 20 $ 0.03 $ 17 $ 0.02 $ 12 $ 0.02 $ 51 $ 0.06
(Millions except per share amounts) Q4-13 Q3-13 Q2-13 Q1-13 2013
GAAP net income (loss) / earnings (loss) per share $ 89 $ 0.12 $ 48 $ 0.06 $ (74) $ (0.10) $ (146) $ (0.19) $ (83) $ (0.11)
Amortization of acquired intangible assets 4 0.00 5 0.01 4 0.01 5 0.01 18 0.02
Restructuring and other special charges (gains), net - - (22) (0.03) 5 0.01 47 0.06 30 0.04
Legal settlements, net (48) (0.06) - - - - - - (48) (0.06)
Non-GAAP net income (loss) / earnings (loss) per share $ 45 $ 0.06 $ 31 $ 0.04 $ (65) $ (0.09) $ (94) $ (0.13) $ (83) $ (0.11)
| AMD FINANCIAL RESULTS | JANUARY 20, 2015 21 21
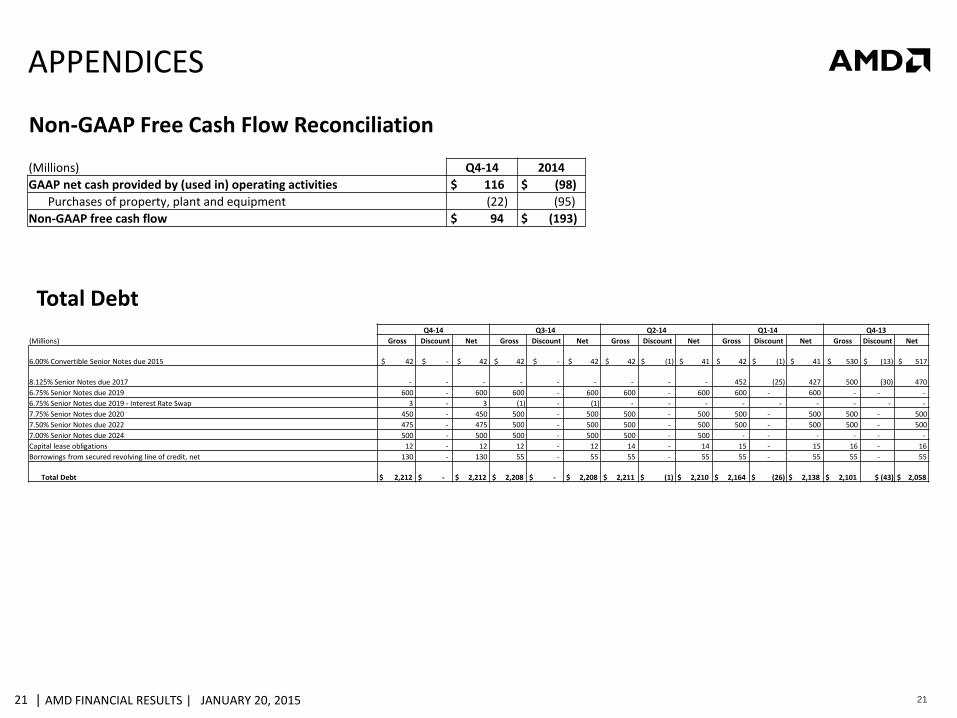
APPENDICES
Total Debt
Non-GAAP Free Cash Flow Reconciliation
(Millions) Q4-14 2014
GAAP net cash provided by (used in) operating activities $ 116 $ (98)
Purchases of property, plant and equipment (22) (95)
Non-GAAP free cash flow $ 94 $ (193)
Q4-14 Q3-14 Q2-14 Q1-14 Q4-13
(Millions) Gross Discount Net Gross Discount Net Gross Discount Net Gross Discount Net Gross Discount Net
6.00% Convertible Senior Notes due 2015 $ 42 $ - $ 42 $ 42 $ - $ 42 $ 42 $ (1) $ 41 $ 42 $ (1) $ 41 $ 530 $ (13) $ 517
8.125% Senior Notes due 2017 - - - - - - - - - 452 (25) 427 500 (30) 470
6.75% Senior Notes due 2019 600 - 600 600 - 600 600 - 600 600 - 600 - - -
6.75% Senior Notes due 2019 - Interest Rate Swap 3 - 3 (1) - (1) - - - - - - - - -
7.75% Senior Notes due 2020 450 - 450 500 - 500 500 - 500 500 - 500 500 - 500
7.50% Senior Notes due 2022 475 - 475 500 - 500 500 - 500 500 - 500 500 - 500
7.00% Senior Notes due 2024 500 - 500 500 - 500 500 - 500 - - - - - -
Capital lease obligations 12 - 12 12 - 12 14 - 14 15 - 15 16 - 16
Borrowings from secured revolving line of credit, net 130 - 130 55 - 55 55 - 55 55 - 55 55 - 55
Total Debt $ 2,212 $ - $ 2,212 $ 2,208 $ - $ 2,208 $ 2,211 $ (1) $ 2,210 $ 2,164 $ (26) $ 2,138 $ 2,101 $ (43) $ 2,058