ambient air monitoring report - wilpinjong coal wilpinjong gases review r2.docx iii ambient air...
TRANSCRIPT
REPORT
AMBIENT AIR MONITORING REPORT -
WILPINJONG COAL
Wilpinjong Coal Mine
Job No: 7983
22 July 2013

7983 Wilpinjong Gases Review R2.docx ii
Ambient Air Monitoring Report - Wilpinjong Coal
Wilpinjong Coal Mine | Job Number 7983
PROJECT TITLE: Ambient Air Monitoring Report - Wilpinjong Coal
JOB NUMBER: 7983
PREPARED FOR: Wilpinjong Coal Mine
DISCLAIMER & COPYRIGHT: This report is subject to the copyright statement
located at www.pacific-environment.com © Pacific
Environment Operations Pty Ltd ABN 86 127 101 642
DOCUMENT CONTROL
VERSION DATE PREPARED BY REVIEWED BY
D1 04.07.2013 J. Cox/C. Isley D. Roddis/WCM
D2 10.07.2013 J. Cox/C. Isley D. Roddis
FINAL R1 12.07.2013 J. Cox/C. Isley D. Roddis/WCM
FINAL R1 22.07.2013 J. Cox/C. Isley D. Roddis/WCM
Pacific Environment Operations Pty ABN 86 127 101 642
BRISBANE
Level 1, 59 Melbourne Street, South Brisbane Qld 4101
PO Box 3306, South Brisbane Qld 4101
Ph: +61 7 3004 6400
Fax: +61 7 3844 5858
Unit 1, 22 Varley Street
Yeerongpilly, Qld 4105
Ph: +61 7 3004 6460
ADELAIDE
35 Edward Street, Norwood SA 5067
PO Box 3187, Norwood SA 5067
Ph: +61 8 8332 0960
Fax: +61 7 3844 5858
SYDNEY Suite 1, Level 1, 146 Arthur Street
North Sydney, NSW 2060
Ph: +61 2 9870 0900
Fax: +61 2 9870 0999
MELBOURNE
Suite 62, 63 Turner Street, Port Melbourne Vic 3207
PO Box 23293, Docklands Vic 8012
Ph: +61 3 9681 8551
Fax: +61 3 9646 3408
PERTH
Level 1, Suite 3
34 Queen Street, Perth WA 6000
Ph: +61 8 9481 4961
Fax: +61 7 3844 5858

7983 Wilpinjong Gases Review R2.docx iii
Ambient Air Monitoring Report - Wilpinjong Coal
Wilpinjong Coal Mine | Job Number 7983
EXECUTIVE SUMMARY
As a result of community concern related to odour from spontaneous combustion, Wilpinjong Coal
Mine (WCM) has measured ambient concentrations of the following pollutants that can be released
during spontaneous combustion events.
Oxides of Nitrogen (NOx)
Sulfur Dioxide (SO2)
Hydrogen Sulfide (H2S)
Polycyclic Aromatic Hydrocarbons (PAHs)
Volatile Organic Compounds (VOCs).
Monitoring was completed at two locations (Wollar Village and Cooks Gap) between March and June
2013. The air quality monitoring was completed by Ecotech and ALS.
This report provides a discussion on the causes of spontaneous combustion and the pollutants released
from spontaneous combustion events together with an overview of the health effects of the pollutants
measured and current ambient concentrations in NSW. It presents the air quality criteria against which
the measured concentrations have been compared, and an analysis of the monitoring data and
comparison with Australian air quality criteria.
All measured concentrations of nitrogen dioxide, polycyclic aromatic hydrocarbons, and volatile
organic compounds were significantly below the relevant assessment criteria.
With the exception of one ten-minute period, which is likely to be related to equipment malfunction, all
SO2 concentrations are also below relevant assessment criteria.
Whilst the H2S concentrations are all below the relevant ambient air quality criteria, there are occasions
when a complaint coincided with higher H2S concentrations, which could explain some of the odour
complaints received.
Whilst it is difficult to determine the source of these pollutants on the basis of the prevailing wind
directions, it is apparent from the data that the WCM is not indicated as the primary source of any
pollutant.
Given the low concentrations of all pollutants measured, and that there is no clear indication the WCM
is the primary source of any of them, it is difficult to make any recommendations for ongoing
monitoring. Fence-line monitoring of H2S concentrations could be used as early detection measure
that a spontaneous combustion event is occurring, however, there are currently no known applications
of monitoring of this type in the mining industry.
7983 Wilpinjong Gases Review R2.docx iv
Ambient Air Monitoring Report - Wilpinjong Coal
Wilpinjong Coal Mine | Job Number 7983
CONTENTS
1 INTRODUCTION 1
2 SPONTANEOUS COMBUSTION 1 2.1 Introduction 1 2.2 Air pollutants from spontaneous combustion 1 2.3 Air pollutants – human health aspects 2
2.3.1 Oxides of Nitrogen 2 2.3.2 Sulfur dioxide 2 2.3.3 Hydrogen sulfide 3 2.3.4 Volatile organic compounds (VOCs) 3 2.3.5 Polycyclic aromatic hydrocarbons (PAHs) 4
2.4 Ambient Air Quality Standards 4
3 MONITORING COMPLETED, RESULTS, AND ANALYSIS 6 3.1 Study Area 6 3.2 Monitoring methods 7 3.3 Data analysis 8
3.3.1 Wind directions 8 3.5 Monitored Pollutant Concentrations 11
3.5.1 Introduction 11 3.5.2 Nitrogen dioxide (NO2) 11 3.5.3 Sulfur dioxide (SO2) 13 3.5.4 Hydrogen sulfide (H2S) 14 3.5.5 Volatile organic compounds 16 3.5.6 Polycyclic aromatic hydrocarbons (PAHs) 19
3.6 Pollution Roses 22
4 CONCLUSIONS AND FUTURE MONITORING 24
5 REFERENCES 25
Appendix A: Wollar BTX Instrument Problems - Ecotech letter
Appendix B: Ecotech credentials
Appendix C: Ecotech Monitoring Report
Appendix D: ALS Summa Canister Monitoring Report
Appendix E: ALS PAH Monitoring Report
TABLES
Table 2-1: Assessment criteria 5
Table 3-1: Pollutants measured at each air monitoring site 6
Table 3-2: Summary of data collection and analysis methods – Ecotech 7
Table 3-3: Summary of data collection and analysis methods - ALS 7
Table 3-4: Measured concentrations compared with assessment criteria 11
Table 3-5: Summary of complaints received during monitoring campaign 14
Table 3-6: Summa canister VOC results (ppb) 16
Table 3-7: Summary of PAH results (g/filter paper) 20
Table 3-8: PAH as benzo[a]pyrene equivalents (g/m3) 21

7983 Wilpinjong Gases Review R2.docx v
Ambient Air Monitoring Report - Wilpinjong Coal
Wilpinjong Coal Mine | Job Number 7983
FIGURES
Figure 3-1: Study area 6
Figure 3-2: How to read wind roses 8
Figure 3-3: Windroses 9
Figure 3-4: Terrain in the vicinity of WCM and the monitoring locations 10
Figure 3-5: 1-hour average NO2 concentrations (ppm) 12
Figure 3-6: 10-minute average SO2 concentrations (ppm) 13
Figure 3-7: 1-hour average H2S concentrations - Wollar (ppm) 15
Figure 3-8: 1-hour average H2S concentrations – Cooks Gap (ppm) 15
Figure 3-9: 5-minute average benzene concentrations (ppb) 17
Figure 3-10: 5-minute average toluene concentrations (ppb) 18
Figure 3-11: 5-minute average xylene concentrations (ppb) 18
Figure 3-12: How to read pollution roses 22
Figure 3-13: Pollution roses for each pollutant 23

7983 Wilpinjong Gases Review R2.docx 1
Ambient Air Monitoring Report - Wilpinjong Coal
Wilpinjong Coal Mine | Job Number 7983
1 INTRODUCTION
As a result of community concern related to odour from spontaneous combustion, Wilpinjong Coal
Mine (WCM) implemented a monitoring program to measure the ambient concentrations of a range of
pollutants at two locations (Wollar Village and Cooks Gap) between March and June 2013.
This report presents the following:
a discussion on the causes of spontaneous combustion and the pollutants released from
spontaneous combustion events (see Section 2.2)
an overview of health effects of the pollutants measured and current ambient concentrations
in NSW (see Section 2.3)
the air quality criteria against which the measured concentrations have been compared
(Section 2.3.5)
an assessment of the monitoring data and comparison of measured concentrations with
Australian air quality criteria (see Section 3)
conclusions (see Section 4)
2 SPONTANEOUS COMBUSTION
2.1 Introduction
Spontaneous combustion is a type of combustion which occurs without an external heat source. Coal
can ignite spontaneously when exposed to oxygen which causes it to react and heat up when there is
insufficient ventilation for cooling. In open-cut coal mines, such as the WCM, self-heating can occur in
the waste material and raw coal stockpiles. The WCM has developed a Spontaneous Combustion
Management Plan which details the controls to be implemented for the management of spontaneous
combustion at the site.
2.2 Air pollutants from spontaneous combustion
Whilst there has been a substantial amount of research completed on the prevention and control of
spontaneous combustion, and the release of greenhouse gases (that is, carbon dioxide (CO2) and
methane (CH4)), there is limited information on other air pollutants that are emitted (Carras et. al., 2005;
Day, 2008).
A review of the literature has identified the following air pollutants may result from spontaneous
combustion:
Particulates
Carbon Monoxide (CO)
Oxides of Nitrogen (NOx)
Sulfur Dioxide (SO2)
Hydrogen Sulfide (H2S)
Polycyclic Aromatic Hydrocarbons (PAHs)
Volatile Organic Compounds (VOCs).
The monitoring completed on behalf of the WCM has measured all the pollutants listed above, except
particulates and CO. A detailed description and analysis of the monitoring completed is provided in
Section 3.
Since open-cut mining is itself a source of particulate emissions, it would be difficult, if not impossible, to
isolate particulate emissions generated as result of spontaneous combustion from other particulate
emissions generated by the mining activities.
7983 Wilpinjong Gases Review R2.docx 2
Ambient Air Monitoring Report - Wilpinjong Coal
Wilpinjong Coal Mine | Job Number 7983
Emissions of CO are not considered to be a significant concern in the ambient air of what is effectively
a rural air shed. Thus in this instance it is not considered a significant limitation of the monitoring study
that this parameter was not explicitly evaluated.
2.3 Air pollutants – human health aspects
This section provides an overview of each pollutant, the associated human health aspects, and where
available, information on current levels in NSW.
2.3.1 Oxides of Nitrogen
Oxides of nitrogen (NOx) are produced during spontaneous combustion and are comprised mainly of
nitric oxide (NO) and nitrogen dioxide (NO2). NO is much less harmful to humans than NO2 and is not
generally considered an air quality problem at the concentrations normally found in Australia. In open-
cut mining, such as the WCM, there is also potential for NO2 to form as a result of the oxidation of
ammonium nitrate during blasting. A recent report published by ACARP(Australian Coal Association
Research Program) measured NO2 concentrations in the ambient air near the fence line of a large
open-cut coal mine in the Hunter Valley between April 2011 and October 2012 (Day et. al. 2013). The
report concluded that most of the NO2 present in ambient air at the monitoring locations appeared to
be derived from sources other than blasting, with vehicle operation within the mine apparently a major
source along with other significant sources from outside the mine e.g. power stations, traffic on nearby
roads, and railways.
NO2 is the regulated oxide of nitrogen in NSW and effects of exposure to NO2 include irritation of the
lungs and lower resistance to respiratory infections such as influenza. The effects of short-term exposure
are still unclear, however, continued or frequent exposure to concentrations that are typically much
higher than those normally found in the ambient air may cause increased incidence of acute respiratory
illness in children. Concern with NO is related to its transformation to NO2 and its role in the formation of
photochemical smog.
The NSW State of the Environment report 2012 (NSW EPA, 2012) states that measured concentrations
have not exceeded the 1-hour-average standard since 1998; from 2002–2007 the highest 1-hour value
recorded in Sydney was only 75% of the standard. Over this period, maximum concentrations were
lower still in the Illawarra and Lower Hunter regions.
2.3.2 Sulfur dioxide
Sulfur dioxide (SO2) belongs to the family of sulfur oxide gases (SOx). These gases are formed when for
instance fuel containing sulfur (mainly coal and oil) is burned (or spontaneously combusts). The major
health concerns associated with exposure to high concentrations of SO2 include effects on breathing,
respiratory illness, alterations in pulmonary defences, and aggravation of existing cardiovascular
disease. SO2 is a major precursor to acid rain, which is associated with the acidification of lakes and
streams, accelerated corrosion of buildings and monuments, and reduced visibility.
Current scientific evidence links short-term exposures to SO2, ranging from 5 minutes to 24 hours, with an
array of adverse respiratory effects including bronchoconstriction and increased asthma
symptoms. These effects are particularly important for asthmatics at elevated ventilation rates (e.g.,
while exercising or playing).
As a result of regulatory efforts, from 1994 to 2011 concentrations of SO2 in NSW have been low, with no
exceedances recorded. Maximum hourly ambient concentrations in Sydney were less than 25% of the
standard. Higher concentrations are observed in the Illawarra and Lower Hunter regions as a result of
industrial emissions, although these are also below the standard (NSW EPA, 2012).

7983 Wilpinjong Gases Review R2.docx 3
Ambient Air Monitoring Report - Wilpinjong Coal
Wilpinjong Coal Mine | Job Number 7983
2.3.3 Hydrogen sulfide
Hydrogen sulphide (H2S) is a flammable, colourless gas with a characteristic odour of rotten eggs. H2S
occurs both naturally and from human processes. It is released from volcanoes, sulfur springs, undersea
vents, swamps, salt marshes, and stagnant bodies of water, and is found in association with crude
petroleum and natural gas. It is also associated with municipal sewers and sewage treatment plants,
landfill gases, manure handling operations, and pulp and paper operations.
H2S odour can be easily detected at concentrations much lower than are harmful to health, with its
smell being easily perceptible at concentrations well below 1 part per million (ppm) in air. The literature
reports a wide range of odour thresholds for H2S (that is the level at which it can be smelt), with the
lowest reported to be at levels of between 0.0005 – 0.01 ppm (Ruth, 1986). Others have reported the
odour threshold to be in the range 0.003 - 0.02 ppm (US EPA, 2003).
The odour increases as the gas becomes more concentrated, with the strong rotten egg smell
recognisable up to 30 ppm. Above this level, the gas is reported to have a sickeningly sweet odour up
to around 100 ppm. However, at concentrations above 100 ppm, a person's ability to detect the gas is
affected by rapid temporary paralysis of the olfactory nerves in the nose, leading to a loss of the sense
of smell. This means that the gas can be present at dangerously high concentrations, with no
perceivable odour.
No measurements of H2S in ambient air in Australia were identified. However, World Health
Organisation, 2003 states that the concentration of hydrogen sulfide in air in unpolluted areas is very
low, between 0.03 g/m3 (0.00002 ppm) and 0.1 g/m3 (0.00007 ppm).
2.3.4 Volatile organic compounds (VOCs)
VOCs are a very large group of compounds that can be found in ambient air. As would be expected
with a very large group of compounds, the potential health effects can vary quite widely. The range of
effects can be from irritation of the skin or the respiratory tract (e.g., wheezing, coughing, difficulty
breathing) to an increased risk of developing cancer with long-term inhalation exposure. The VOCs
measured in real-time as part of this monitoring program were benzene, toluene and xylene (BTX).
Further information on each of these is provided in the following paragraphs. Other VOCs were also
measured using summa canisters.
Benzene
The health effects of benzene depend on how much benzene you have been exposed to, for how
long, and your current state of health. Exposure can result in symptoms such as skin and eye irritations,
drowsiness, dizziness, headaches, and vomiting. Benzene is carcinogenic and long-term exposure at
various levels can affect normal blood production and can be harmful to the immune system. It can
cause Leukaemia (cancer of the tissues that form white blood cells) and has also been linked with birth
defects in animals and humans.
Benzene evaporates very quickly and so the most common exposure is from breathing air containing
benzene. Most people are exposed outdoors to low levels of benzene from tobacco smoke and
vehicle exhaust. Smoking cigarettes and passive smoking, especially indoors, increases the intake of
benzene to higher levels. People living near industries that produce or use benzene, or near busy roads
may also be exposed to higher levels in the surrounding air.
Xylenes
Xylenes may irritate the eyes, nose and throat. They may cause stomach problems, drowsiness, loss of
memory, poor concentration, nausea, vomiting, abdominal pain and incoordination. Xylene will enter
the body if we breathe in contaminated air, or breathe tobacco smoke. It can also be absorbed
through the skin if liquid xylene is in contact with the skin. The most common ways to be exposed to
7983 Wilpinjong Gases Review R2.docx 4
Ambient Air Monitoring Report - Wilpinjong Coal
Wilpinjong Coal Mine | Job Number 7983
xylene are from petrol, automotive exhaust or when using consumer products containing xylene,
especially if there is not good ventilation.
Toluene
Toluene is a colourless, flammable liquid. It occurs naturally in petroleum crude oil. Petroleum crude oil
is by far the largest source of toluene. The most likely way to be exposed to toluene is by smoking or
using consumer products containing toluene (paints, varnish, nail polish, paint cleaners, stain removers,
etc.) especially if there is not good ventilation. Short-term exposure to high levels of toluene results first in
light-headedness and euphoria, followed by dizziness, sleepiness, unconsciousness, and in some cases
death.
2.3.5 Polycyclic aromatic hydrocarbons (PAHs)
Polycyclic aromatic hydrocarbons (PAHs) are a mixture of organic compounds released into the
atmosphere as gases or particles during the incomplete combustion of organic material.
PAHs have a number of sources including:
mobile-cars, trucks, ships and aircraft
industrial-power generation, steelworks, coke ovens, aluminium production, cement kilns, oil
refining and waste incineration
domestic-primarily combustion for heating and cooking, especially solid fuel heaters using
wood and coal
fires-burning of vegetation in agricultural processes and bushfires.
Although many different PAHs have been identified, there is limited published toxicological data on
them. One of the best characterised and most toxic PAH is benzo(a)pyrene, which is generally used as
the indicator PAH.
2.4 Ambient Air Quality Standards
In Australia, ambient air quality standards are set in the National Environment Protection (Ambient Air
Quality) Measure (AAQ NEPM) for CO, nitrogen dioxide (NO2), photochemical oxidants (as ozone),
sulfur dioxide (SO2), lead, and particles (as PM10). Advisory reporting standards are also set for particles
(as PM2.5) (NEPM, 2003). The National Environment Protection (Air Toxics) Measure (Air Toxics NEPM) sets
investigation levels for the VOCs (benzene, toluene, xylenes, formaldehyde) and benzo(a)pyrene (as a
marker for PAHs) (NEPM, 2011). “Investigation level” means the concentration of an air toxic which, if
exceeded, requires an appropriate form of further investigation and evaluation. It is important to note
that ambient air quality monitoring to demonstrate compliance with the NEPM standards/investigation
levels is only required in locations with populations greater than 25,000 people.
In New South Wales, the Environment Protection Authority (NSW EPA) does not specify ambient air
quality standards but sets impact assessment criteria for the assessment of projects (NSW DEC, 2005). For
the purposes of project assessment, NSW EPA has adopted the AAQ NEPM standards but also specifies
impact assessment criteria for a wider range of other pollutants and averaging periods not listed in the
AAQ NEPM. For example, whilst the Air Toxics NEPM sets ambient air quality standards for air toxics, the
standards are set as annual averages. NSW EPA has set impact assessment criteria as 1-hour averages
for these pollutants, based on the EPA Victoria design criteria (Victorian Government Gazette, 2001). For
the purposes of this assessment, reference has also been made to other EPA Victoria design criteria
(Victorian Government Gazette, 2001), as these are set as 3-minute averages and are also set to
protect against both odour and toxic health effects. For hydrogen sulfide, it is not possible to make a
direct comparison of the measured concentrations against the NSW impact assessment criteria as they
are designed for comparison against dispersion modelling outputs, not concentrations in ambient air.
However, New Zealand Ministry for the Environment (NZ MfE) sets an ambient guideline value based on
7983 Wilpinjong Gases Review R2.docx 5
Ambient Air Monitoring Report - Wilpinjong Coal
Wilpinjong Coal Mine | Job Number 7983
hourly average hydrogen sulfide concentrations to prevent odour annoyance and the resulting
impacts on well-being, rather than specific health effects (Ministry for the Environment, 2002).
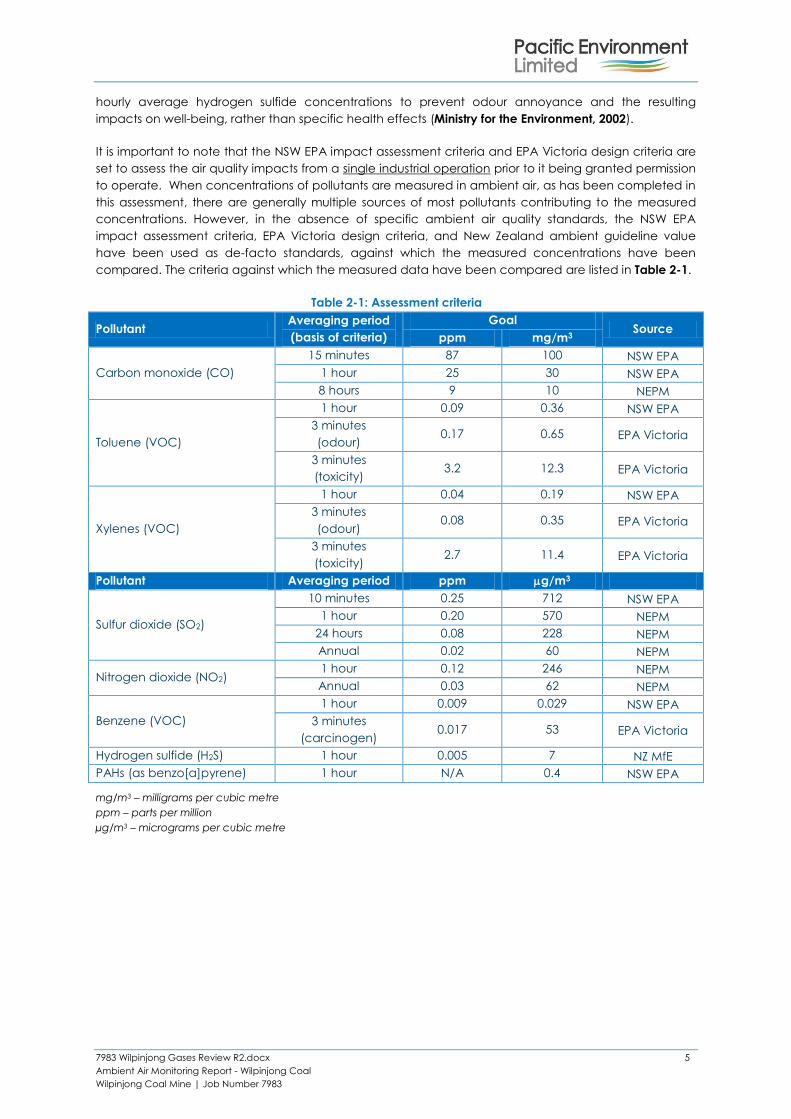
It is important to note that the NSW EPA impact assessment criteria and EPA Victoria design criteria are
set to assess the air quality impacts from a single industrial operation prior to it being granted permission
to operate. When concentrations of pollutants are measured in ambient air, as has been completed in
this assessment, there are generally multiple sources of most pollutants contributing to the measured
concentrations. However, in the absence of specific ambient air quality standards, the NSW EPA
impact assessment criteria, EPA Victoria design criteria, and New Zealand ambient guideline value
have been used as de-facto standards, against which the measured concentrations have been
compared. The criteria against which the measured data have been compared are listed in Table 2-1.
Table 2-1: Assessment criteria
Pollutant Averaging period
(basis of criteria)
Goal Source
ppm mg/m3
Carbon monoxide (CO)
15 minutes 87 100 NSW EPA
1 hour 25 30 NSW EPA
8 hours 9 10 NEPM
Toluene (VOC)
1 hour 0.09 0.36 NSW EPA
3 minutes
(odour) 0.17 0.65 EPA Victoria
3 minutes
(toxicity) 3.2 12.3 EPA Victoria
Xylenes (VOC)
1 hour 0.04 0.19 NSW EPA
3 minutes
(odour) 0.08 0.35 EPA Victoria
3 minutes
(toxicity) 2.7 11.4 EPA Victoria
Pollutant Averaging period ppm g/m3
Sulfur dioxide (SO2)
10 minutes 0.25 712 NSW EPA
1 hour 0.20 570 NEPM
24 hours 0.08 228 NEPM
Annual 0.02 60 NEPM
Nitrogen dioxide (NO2) 1 hour 0.12 246 NEPM
Annual 0.03 62 NEPM
Benzene (VOC)
1 hour 0.009 0.029 NSW EPA
3 minutes
(carcinogen) 0.017 53 EPA Victoria
Hydrogen sulfide (H2S) 1 hour 0.005 7 NZ MfE
PAHs (as benzo[a]pyrene) 1 hour N/A 0.4 NSW EPA
mg/m3 – milligrams per cubic metre
ppm – parts per million
µg/m3 – micrograms per cubic metre

7983 Wilpinjong Gases Review R2.docx 6
Ambient Air Monitoring Report - Wilpinjong Coal
Wilpinjong Coal Mine | Job Number 7983
3 MONITORING COMPLETED, RESULTS, AND ANALYSIS
3.1 Study Area
The study area is shown in Figure 3-1, showing the location of the Wollar Village and Cooks Gap
monitors, along with the meteorological monitoring station on the WCM. The Wollar Village and Cooks
Gap monitors are representative of residential areas near to the WCM.
Figure 3-1: Study area
The pollutants measured at each monitoring location are listed in Table 3-1. Section 3.5.2 to Section
3.5.6 compares the measured concentrations with the relevant assessment criteria. Additional analysis
is presented in Section 3.6 considering both the pollutant concentrations and prevailing wind directions.
Table 3-1: Pollutants measured at each air monitoring site
Pollutant Wollar Village Cooks Gap
Nitric oxide (NO) 1 March 2013 - 23 June 2013 1 March 2013 - 23 June 2013
Nitrogen dioxide (NO2) 1 March 2013 - 23 June 2013 1 March 2013 - 23 June 2013
Sulfur dioxide (SO2) 1 March 2013 - 23 June 2013 1 March 2013 - 23 June 2013
Hydrogen sulfide (H2S) 1 March 2013 - 23 June 2013 1 March 2013 - 23 June 2013
Benzene 17 April 2013 – 19 June 2013* 27 May 2013 - 23 June 2013
Toluene 17 April 2013 – 19 June 2013* 27 May 2013 - 23 June 2013
Xylene 17 April 2013 – 19 June 2013* 27 May 2013 - 23 June 2013
There was a good capture rate on the majority of data, other than the BTX data at Wollar Village, due
to a problem with the first instrument that was installed (see Appendix A for further information).
7983 Wilpinjong Gases Review R2.docx 7
Ambient Air Monitoring Report - Wilpinjong Coal
Wilpinjong Coal Mine | Job Number 7983
3.2 Monitoring methods
The monitoring locations were selected in consultation with NSW EPA. The sampling and analysis for all
pollutants (except PAHs and summa canisters) was completed on behalf of the WCM by Ecotech (see
Appendix B for Ecotech credentials). The analysis of the summa canisters and PAHs was completed by
ALS.
A copy of the analysis report provided to the WCM by Ecotech is provided in Appendix C. An example
of the summa canister analysis report is provided in Appendix D, and an example of a PAH analysis
report is provided in Appendix E.
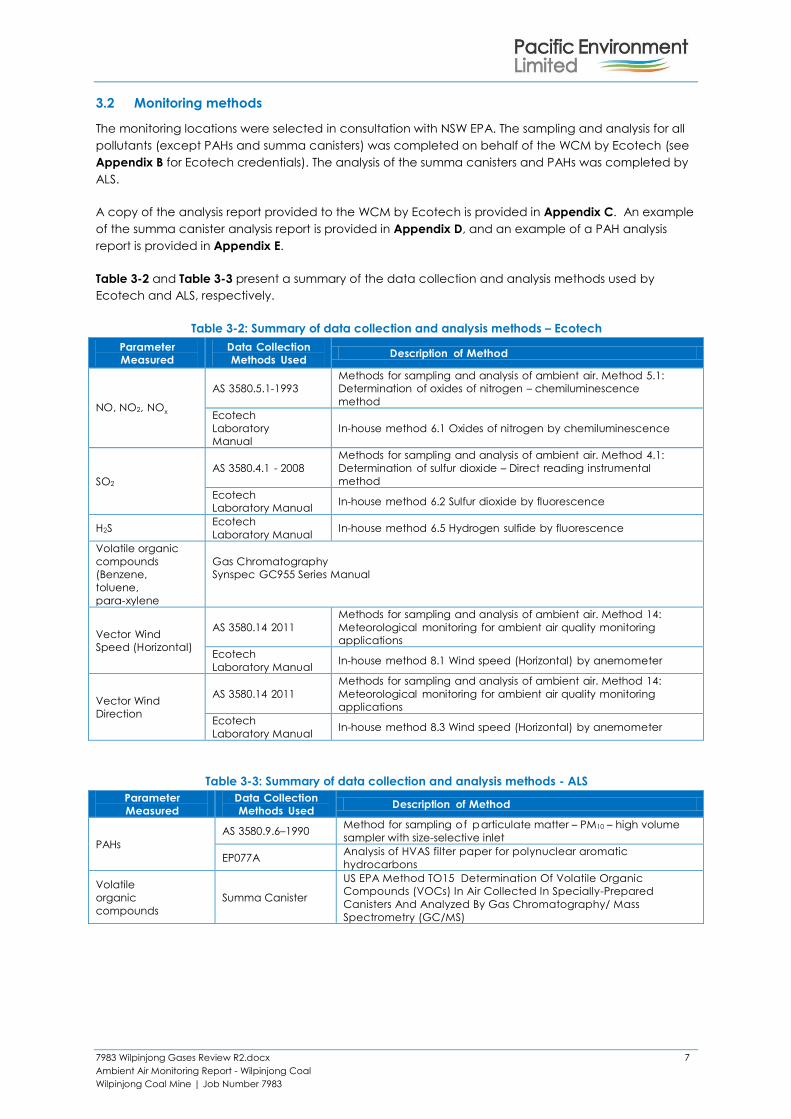
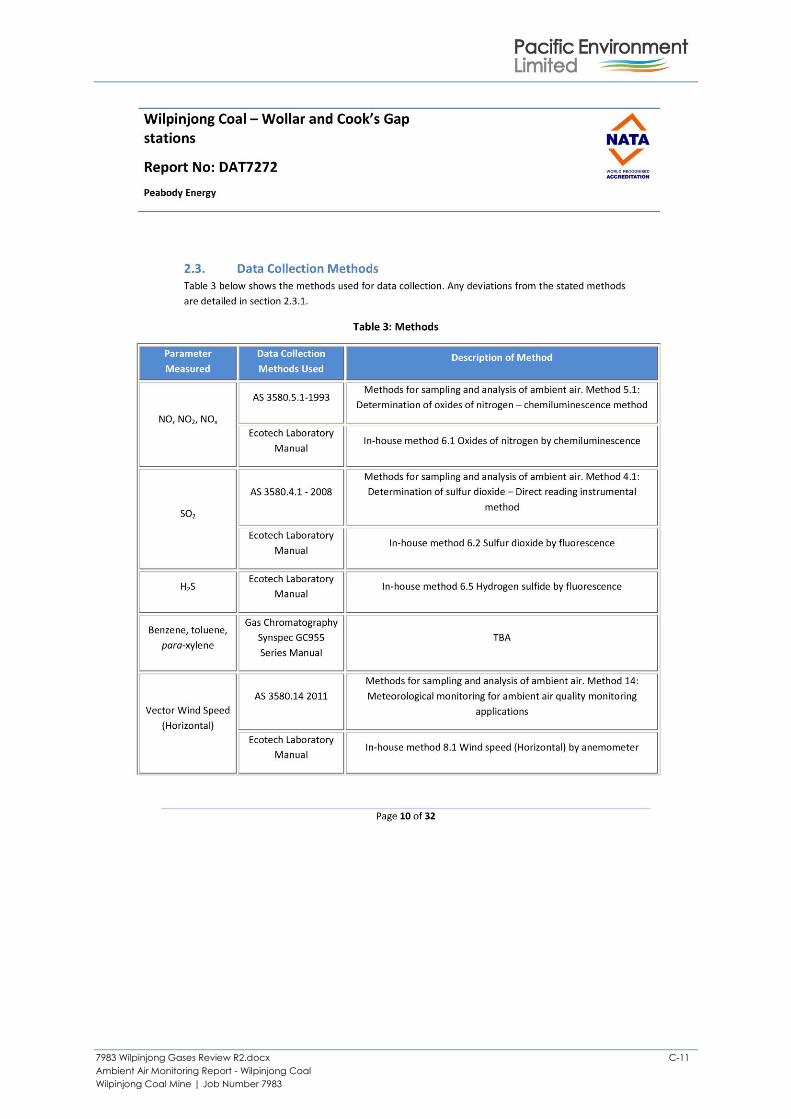
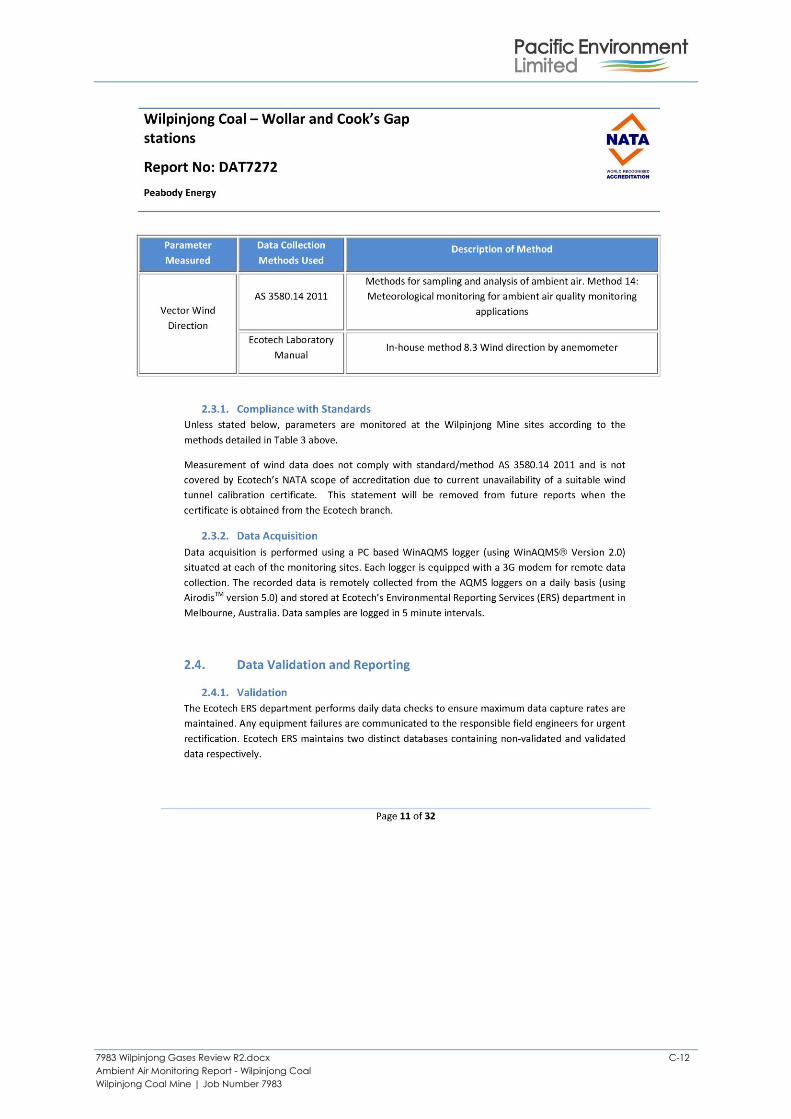
Table 3-2 and Table 3-3 present a summary of the data collection and analysis methods used by
Ecotech and ALS, respectively.
Table 3-2: Summary of data collection and analysis methods – Ecotech
Parameter
Measured
Data Collection
Methods Used Description of Method
NO, NO2, NOx
AS 3580.5.1-1993
Methods for sampling and analysis of ambient air. Method 5.1:
Determination of oxides of nitrogen – chemiluminescence
method
Ecotech
Laboratory
Manual
In-house method 6.1 Oxides of nitrogen by chemiluminescence
SO2
AS 3580.4.1 - 2008
Methods for sampling and analysis of ambient air. Method 4.1:
Determination of sulfur dioxide – Direct reading instrumental
method
Ecotech
Laboratory Manual In-house method 6.2 Sulfur dioxide by fluorescence
H2S Ecotech
Laboratory Manual In-house method 6.5 Hydrogen sulfide by fluorescence
Volatile organic
compounds
(Benzene,
toluene,
para-xylene
Gas Chromatography
Synspec GC955 Series Manual
Vector Wind
Speed (Horizontal)
AS 3580.14 2011
Methods for sampling and analysis of ambient air. Method 14:
Meteorological monitoring for ambient air quality monitoring
applications
Ecotech
Laboratory Manual In-house method 8.1 Wind speed (Horizontal) by anemometer
Vector Wind
Direction
AS 3580.14 2011
Methods for sampling and analysis of ambient air. Method 14:
Meteorological monitoring for ambient air quality monitoring
applications
Ecotech
Laboratory Manual In-house method 8.3 Wind speed (Horizontal) by anemometer
Table 3-3: Summary of data collection and analysis methods - ALS
Parameter
Measured
Data Collection
Methods Used Description of Method
PAHs
AS 3580.9.6–1990 Method for sampling of particulate matter – PM10 – high volume
sampler with size-selective inlet
EP077A Analysis of HVAS filter paper for polynuclear aromatic
hydrocarbons
Volatile
organic
compounds
Summa Canister
US EPA Method TO15 Determination Of Volatile Organic
Compounds (VOCs) In Air Collected In Specially-Prepared
Canisters And Analyzed By Gas Chromatography/ Mass
Spectrometry (GC/MS)
7983 Wilpinjong Gases Review R2.docx 8
Ambient Air Monitoring Report - Wilpinjong Coal
Wilpinjong Coal Mine | Job Number 7983
3.3 Data analysis
3.3.1 Wind directions
Data on wind direction were available at the Cooks Gap and Wollar Village monitors from 16 April
2013 (Cooks Gap) and 3 May 2013 (Wollar Village). As wind direction data were not available for the
entire period due to equipment problems, data from the WCM site meteorological station have also
been used, along with data from a noise monitor located close to the Wollar Village air pollution
monitor.
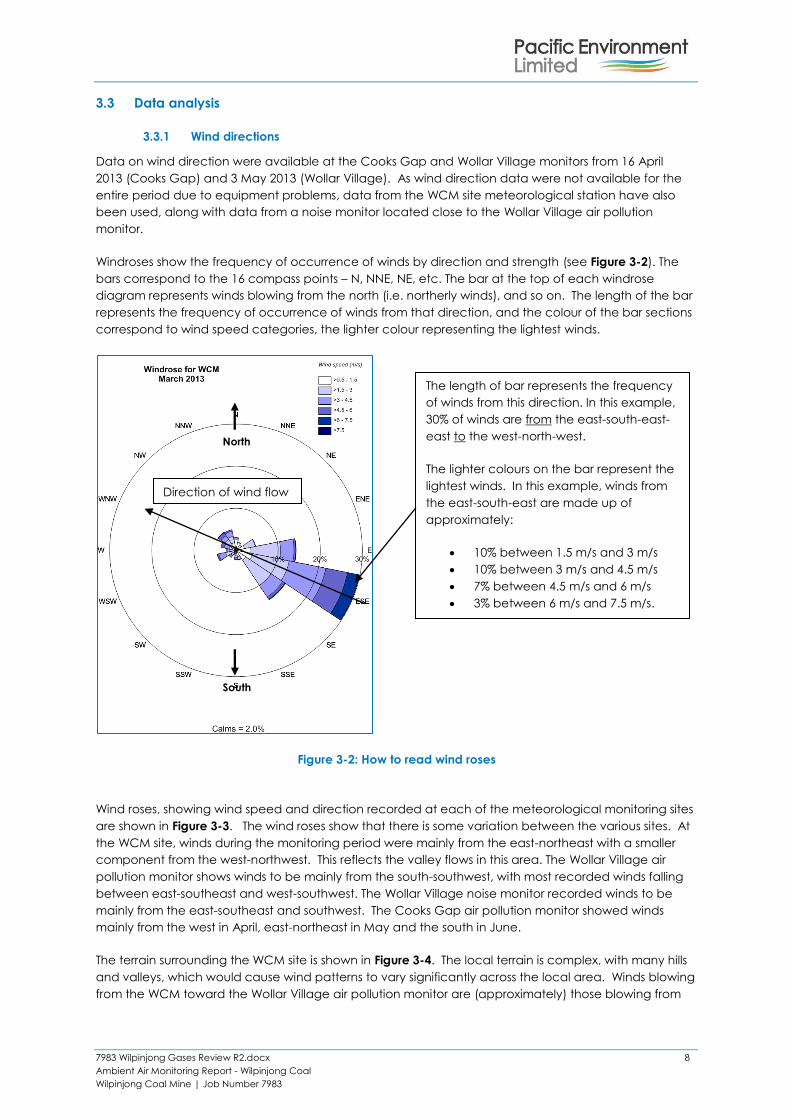
Windroses show the frequency of occurrence of winds by direction and strength (see Figure 3-2). The
bars correspond to the 16 compass points – N, NNE, NE, etc. The bar at the top of each windrose
diagram represents winds blowing from the north (i.e. northerly winds), and so on. The length of the bar
represents the frequency of occurrence of winds from that direction, and the colour of the bar sections
correspond to wind speed categories, the lighter colour representing the lightest winds.
Figure 3-2: How to read wind roses
Wind roses, showing wind speed and direction recorded at each of the meteorological monitoring sites
are shown in Figure 3-3. The wind roses show that there is some variation between the various sites. At
the WCM site, winds during the monitoring period were mainly from the east-northeast with a smaller
component from the west-northwest. This reflects the valley flows in this area. The Wollar Village air
pollution monitor shows winds to be mainly from the south-southwest, with most recorded winds falling
between east-southeast and west-southwest. The Wollar Village noise monitor recorded winds to be
mainly from the east-southeast and southwest. The Cooks Gap air pollution monitor showed winds
mainly from the west in April, east-northeast in May and the south in June.
The terrain surrounding the WCM site is shown in Figure 3-4. The local terrain is complex, with many hills
and valleys, which would cause wind patterns to vary significantly across the local area. Winds blowing
from the WCM toward the Wollar Village air pollution monitor are (approximately) those blowing from
North
South
Direction of wind flow
The length of bar represents the frequency
of winds from this direction. In this example,
30% of winds are from the east-south-east-
east to the west-north-west.
The lighter colours on the bar represent the
lightest winds. In this example, winds from
the east-south-east are made up of
approximately:
10% between 1.5 m/s and 3 m/s
10% between 3 m/s and 4.5 m/s
7% between 4.5 m/s and 6 m/s
3% between 6 m/s and 7.5 m/s.

7983 Wilpinjong Gases Review R2.docx 9
Ambient Air Monitoring Report - Wilpinjong Coal
Wilpinjong Coal Mine | Job Number 7983
the west to north-north west. Winds blowing from the WCM toward the Cooks Gap air pollution monitor
are (approximately) those blowing from the east-northeast to east.
Wilpinjong mine
site (WCM)
Wollar air
pollution monitor
Wollar noise
monitor
Cooks Gap air
pollution monitor
March
Not available due
to equipment
issues
Not available due
to equipment
issues
April
Not available due
to equipment
issues
May
June
Figure 3-3: Windroses

7983 Wilpinjong Gases Review R2.docx 10
Ambient Air Monitoring Report - Wilpinjong Coal
Wilpinjong Coal Mine | Job Number 7983
Figure 3-4: Terrain in the vicinity of WCM and the monitoring locations
7983 Wilpinjong Gases Review R2.docx 11
Ambient Air Monitoring Report - Wilpinjong Coal
Wilpinjong Coal Mine | Job Number 7983
3.5 Monitored Pollutant Concentrations
3.5.1 Introduction
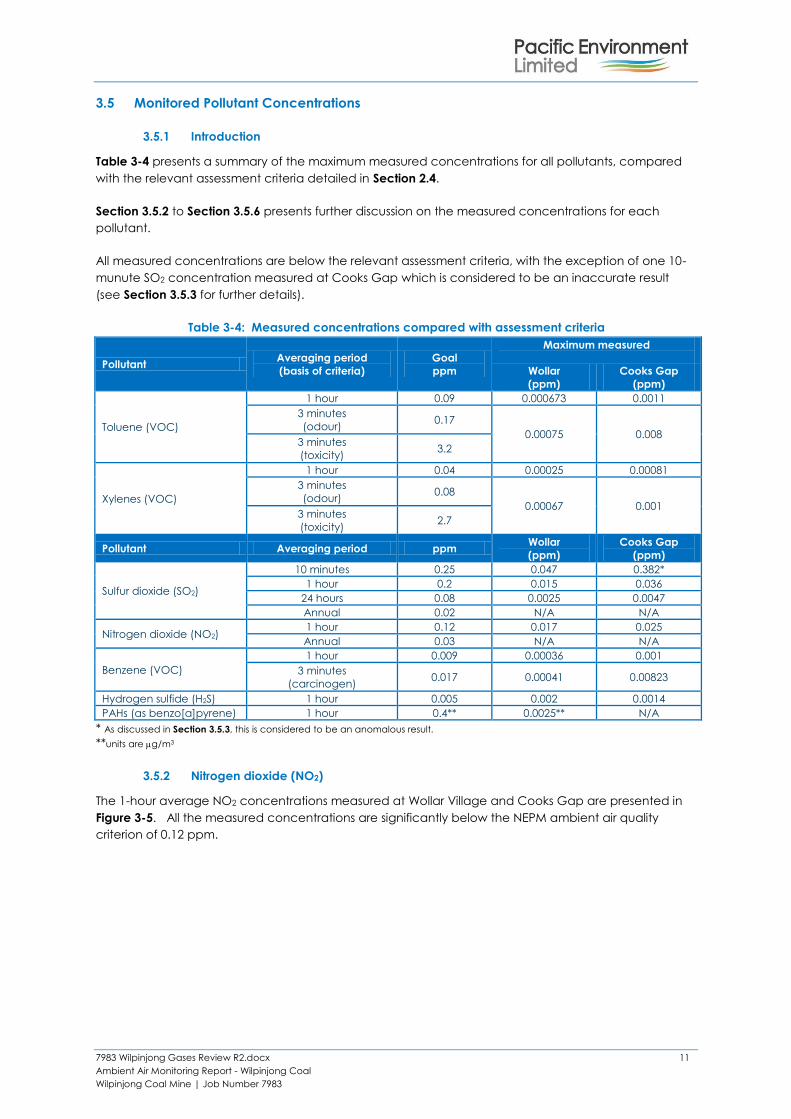
Table 3-4 presents a summary of the maximum measured concentrations for all pollutants, compared
with the relevant assessment criteria detailed in Section 2.4.
Section 3.5.2 to Section 3.5.6 presents further discussion on the measured concentrations for each
pollutant.
All measured concentrations are below the relevant assessment criteria, with the exception of one 10-
munute SO2 concentration measured at Cooks Gap which is considered to be an inaccurate result
(see Section 3.5.3 for further details).
Table 3-4: Measured concentrations compared with assessment criteria
Pollutant Averaging period
(basis of criteria)
Goal
ppm
Maximum measured
Wollar
(ppm)
Cooks Gap
(ppm)
Toluene (VOC)
1 hour 0.09 0.000673 0.0011
3 minutes
(odour) 0.17
0.00075 0.008 3 minutes
(toxicity) 3.2
Xylenes (VOC)
1 hour 0.04 0.00025 0.00081
3 minutes
(odour) 0.08
0.00067 0.001 3 minutes
(toxicity) 2.7
Pollutant Averaging period ppm Wollar
(ppm)
Cooks Gap
(ppm)
Sulfur dioxide (SO2)
10 minutes 0.25 0.047 0.382*
1 hour 0.2 0.015 0.036
24 hours 0.08 0.0025 0.0047
Annual 0.02 N/A N/A
Nitrogen dioxide (NO2) 1 hour 0.12 0.017 0.025
Annual 0.03 N/A N/A
Benzene (VOC)
1 hour 0.009 0.00036 0.001
3 minutes
(carcinogen) 0.017 0.00041 0.00823
Hydrogen sulfide (H2S) 1 hour 0.005 0.002 0.0014
PAHs (as benzo[a]pyrene) 1 hour 0.4** 0.0025** N/A
* As discussed in Section 3.5.3, this is considered to be an anomalous result.
**units are g/m3
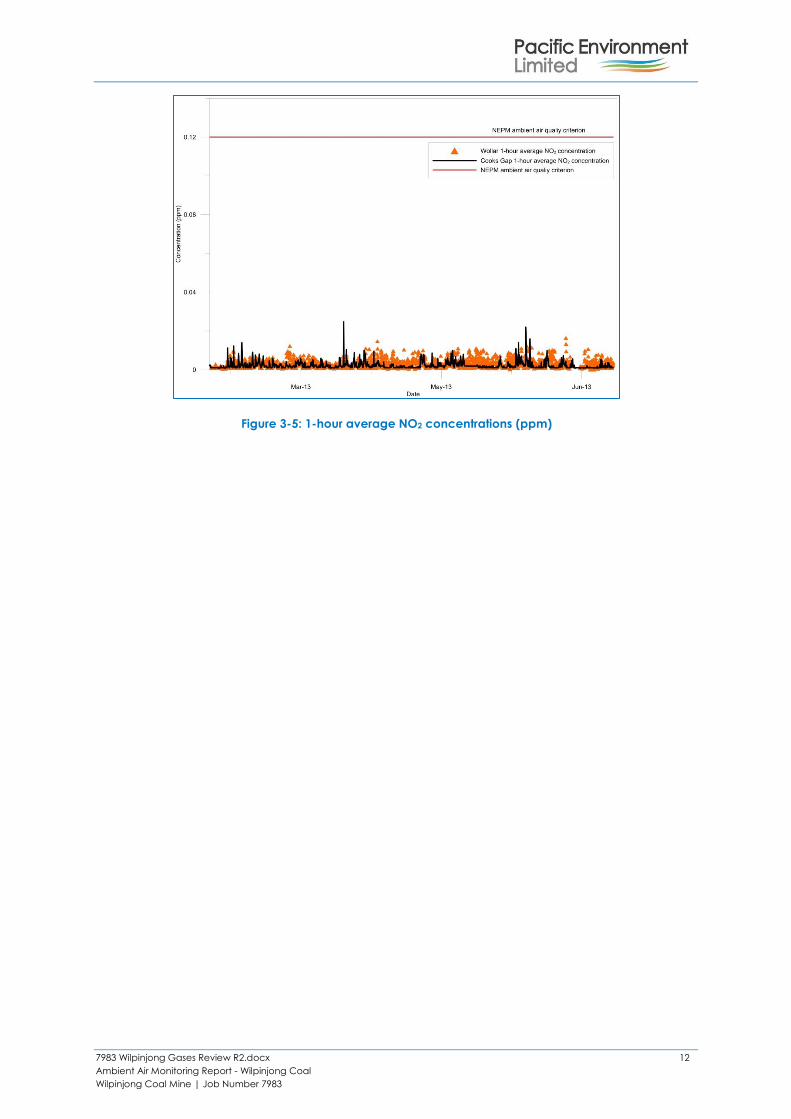
3.5.2 Nitrogen dioxide (NO2)
The 1-hour average NO2 concentrations measured at Wollar Village and Cooks Gap are presented in
Figure 3-5. All the measured concentrations are significantly below the NEPM ambient air quality
criterion of 0.12 ppm.
7983 Wilpinjong Gases Review R2.docx 12
Ambient Air Monitoring Report - Wilpinjong Coal
Wilpinjong Coal Mine | Job Number 7983
Figure 3-5: 1-hour average NO2 concentrations (ppm)
7983 Wilpinjong Gases Review R2.docx 13
Ambient Air Monitoring Report - Wilpinjong Coal
Wilpinjong Coal Mine | Job Number 7983
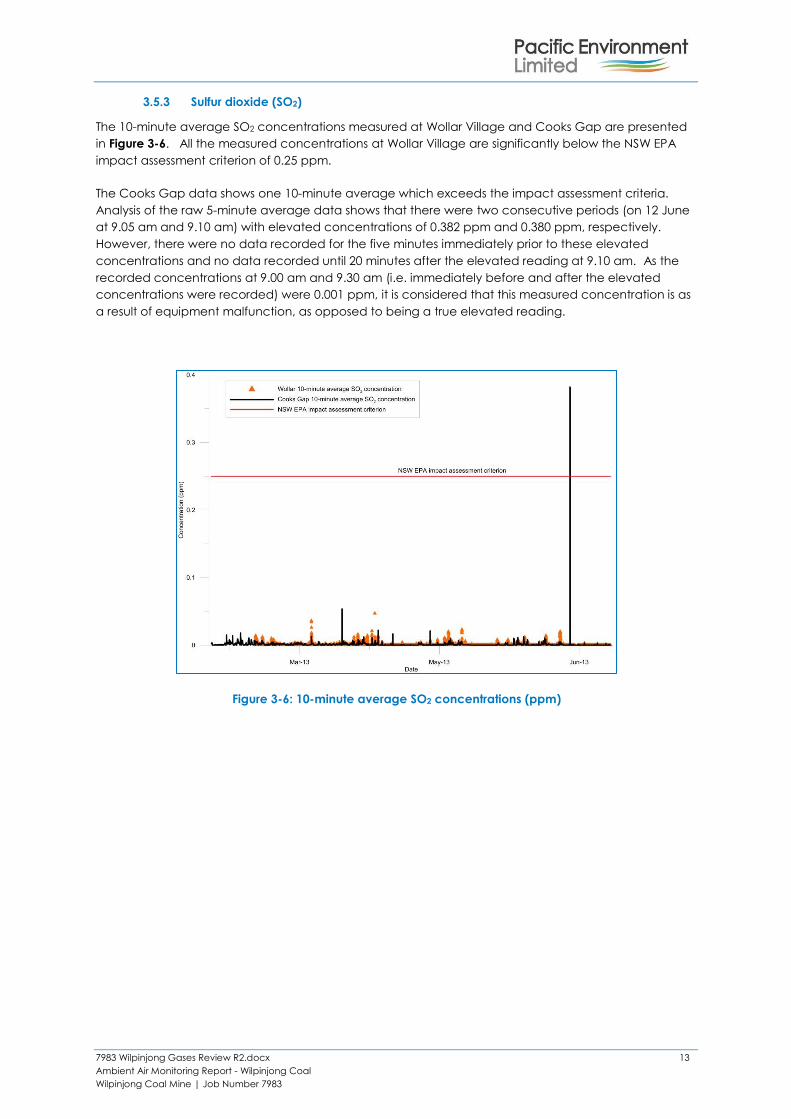
3.5.3 Sulfur dioxide (SO2)
The 10-minute average SO2 concentrations measured at Wollar Village and Cooks Gap are presented
in Figure 3-6. All the measured concentrations at Wollar Village are significantly below the NSW EPA
impact assessment criterion of 0.25 ppm.
The Cooks Gap data shows one 10-minute average which exceeds the impact assessment criteria.
Analysis of the raw 5-minute average data shows that there were two consecutive periods (on 12 June
at 9.05 am and 9.10 am) with elevated concentrations of 0.382 ppm and 0.380 ppm, respectively.
However, there were no data recorded for the five minutes immediately prior to these elevated
concentrations and no data recorded until 20 minutes after the elevated reading at 9.10 am. As the
recorded concentrations at 9.00 am and 9.30 am (i.e. immediately before and after the elevated
concentrations were recorded) were 0.001 ppm, it is considered that this measured concentration is as
a result of equipment malfunction, as opposed to being a true elevated reading.
Figure 3-6: 10-minute average SO2 concentrations (ppm)

7983 Wilpinjong Gases Review R2.docx 14
Ambient Air Monitoring Report - Wilpinjong Coal
Wilpinjong Coal Mine | Job Number 7983
3.5.4 Hydrogen sulfide (H2S)
As discussed in Section 2.3.3, H2S can be smelt at very low concentrations. The characteristic odour of
rotten eggs is the most common complaint related to spontaneous combustion events. Table 3-5
presents a summary of the time and date of each complaint received by the WCM, together with a
description of the complaint received.
Table 3-5: Summary of complaints received during monitoring campaign
Date Location Time Description
14/03/2013 Wollar 8:51 AM Odour
2/04/2013 Wollar 8:36 AM Spon. com. odour
8/04/2013 Wollar 7:54 AM Spon. com. odour
12/04/2013 Wollar 7:58 AM Spon. com. odour
14/04/2013 Wollar 8:24 AM Odour
15/04/2013 Wollar 6:23 AM Sulfur odour
20/04/2013 Wollar 8:13 AM Sulfur odour
22/04/2013 Wollar 8:42 AM Sulfur odour
25/04/2013 Wollar 8:22 AM Sulfur odour
27/04/2013 Wollar 8:03 AM Odour
29/04/2013 Wollar 8:00 AM Sulfur odour
1/05/2013 Wollar 8:34 AM Odour
12/05/2013 Wollar 7:06 PM Sulfur odour
15/05/2013 Wollar 8:34 AM Sulfur odour
17/05/2013 Wollar 8:32 PM Sulfur odour
21/05/2013 Wollar 8:32 AM Sulfur odour
27/05/2013 Wollar 9:00 AM Sulfur odour
30/05/2013 Wollar 9:32 AM Gas smell
5/06/2013 Wollar 8:39 AM Odour
22/06/2013 Wollar 8:30 AM Odour
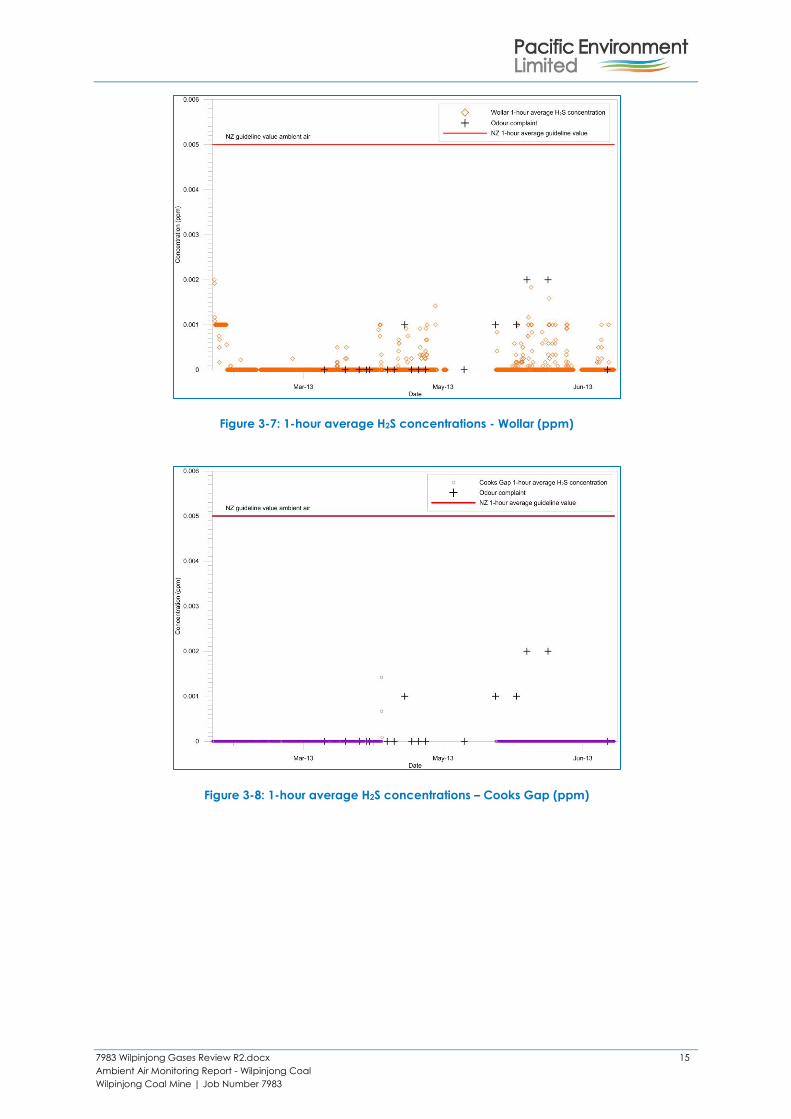
Figure 3-7 and Figure 3-8 show the 1-hour average H2S concentrations for Wollar Village and Cooks
Gap, respectively. The plots also show when complaints regarding odour were received by WCM, and
the average H2S concentrations for the preceding hour.
The 1-hour average concentrations at both Wollar Village and Cooks Gap are significantly below the
NZ MfE guideline value for ambient air.
There are occasions when a complaint coincided with higher H2S concentrations. However the majority
of complaints were received when no H2S was detected by the monitor. It is important to note that
the lowest concentration of H2S that the monitor can record is 0.001 ppm, therefore any concentration
equal to or greater than 0.0005 ppm will be reported as 0.001 ppm, but any concentration lower than
0.0005 ppm (for example, 0.00049 ppm) will be reported as 0 ppm. As discussed in Section 2.3.3, the
odour threshold of H2S has been reported to be as low as 0.0005 ppm, which would have been
recorded as 0.001 ppm. However, due to the level of detection afforded by the monitor, it is possible
concentrations close to the lowest detectable limit of 0.0005 ppm have been measured but recorded
as 0 ppm and that there are members of the local population that are extremely sensitive to H2S odour
at concentrations below the level at which the monitors can detect it, but can be detected by a
human nose.
7983 Wilpinjong Gases Review R2.docx 15
Ambient Air Monitoring Report - Wilpinjong Coal
Wilpinjong Coal Mine | Job Number 7983
Figure 3-7: 1-hour average H2S concentrations - Wollar (ppm)
Figure 3-8: 1-hour average H2S concentrations – Cooks Gap (ppm)

7983 Wilpinjong Gases Review R2.docx 16
Ambient Air Monitoring Report - Wilpinjong Coal
Wilpinjong Coal Mine | Job Number 7983
3.5.5 Volatile organic compounds
Samples of volatile organic compounds were collected and analysed using two different techniques:
Summa canistersa can be used to measure a much wider range of VOCs than field gas
chromatography. A canister was deployed at both sites on 15 and 29 May and exposed for
24-hours.
Field gas chromatography was completed by Ecotech to measure concentrations of benzene,
toluene and xylene every 5-minutes.
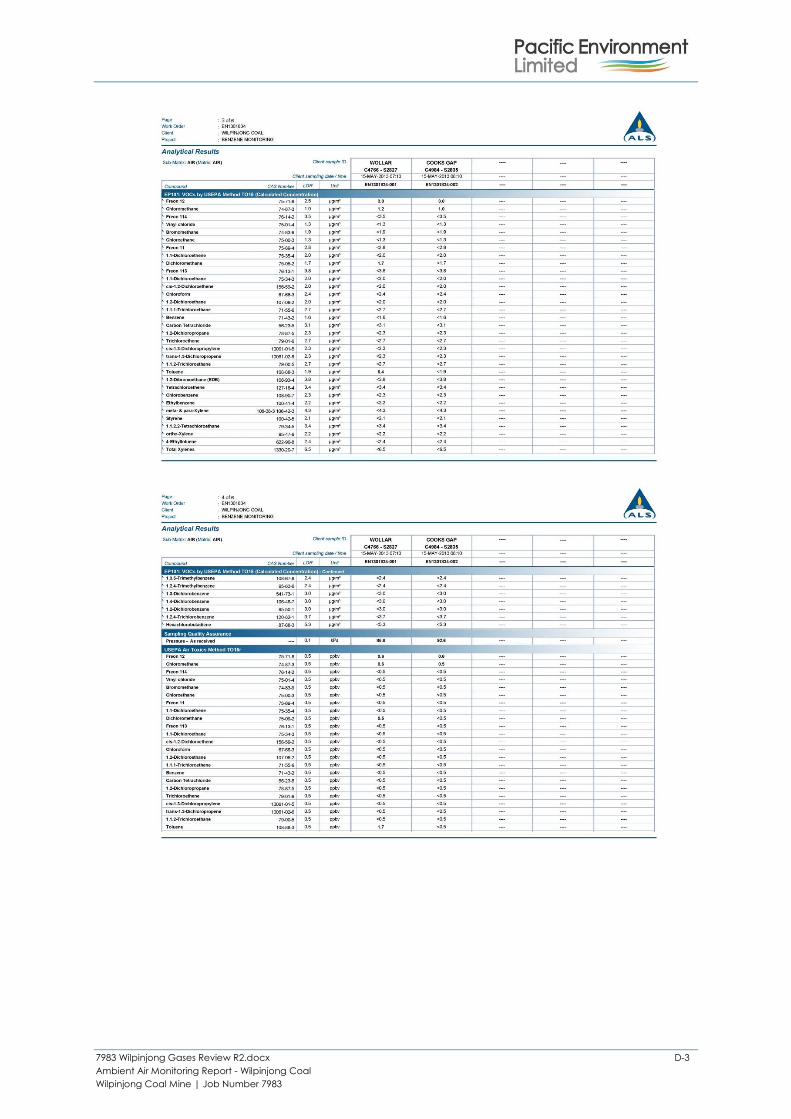
As shown in Table 3-6, the results from the summa canisters were almost all below the Level of
Recognition (LOR). The LOR is the lowest level the monitoring equipment can measure. Concentrations
that were above the LOR are shown shaded.
Section 3.5.5.1 to Section 3.5.5.4 discuss the field gas chromatography results for benzene, toluene and
xylene, and summa canister results for those pollutants where concentrations above the LOR were
recorded.
Table 3-6: Summa canister VOC results (ppb)
Compound
LOR
(ppb)
Wollar Cooks Gap Wollar Cooks Gap
15-May-13 29-May-13
Freon 12 0.5 0.6 0.6 <0.5 <0.5
Chloromethane 0.5 0.6 0.5 0.8 1.1
Freon 114 0.5 <0.5 <0.5 <0.5 <0.5
Vinyl chloride 0.5 <0.5 <0.5 <0.5 <0.5
Bromomethane 0.5 <0.5 <0.5 <0.5 <0.5
Chloroethane 0.5 <0.5 <0.5 <0.5 <0.5
Freon 11 0.5 <0.5 <0.5 <0.5 <0.5
1.1-Dichloroethene 0.5 <0.5 <0.5 <0.5 <0.5
Dichloromethane 0.5 0.5 <0.5 <0.5 <0.5
Freon 113 0.5 <0.5 <0.5 <0.5 <0.5
1.1-Dichloroethane 0.5 <0.5 <0.5 <0.5 <0.5
cis-1.2-Dichloroethene 0.5 <0.5 <0.5 <0.5 <0.5
Chloroform 0.5 <0.5 <0.5 <0.5 <0.5
1.2-Dichloroethane 0.5 <0.5 <0.5 <0.5 <0.5
1.1.1-Trichloroethane 0.5 <0.5 <0.5 <0.5 <0.5
Benzene 0.5 <0.5 <0.5 <0.5 <0.5
Carbon Tetrachloride 0.5 <0.5 <0.5 <0.5 <0.5
1.2-Dichloropropane 0.5 <0.5 <0.5 <0.5 <0.5
Trichloroethene 0.5 <0.5 <0.5 <0.5 <0.5
cis-1.3-Dichloropropylene 0.5 <0.5 <0.5 <0.5 <0.5
trans-1.3-Dichloropropene 0.5 <0.5 <0.5 <0.5 <0.5
1.1.2-Trichloroethane 0.5 <0.5 <0.5 <0.5 <0.5
Toluene 0.5 1.7 <0.5 0.7 0.5
1.2-Dibromoethane (EDB) 0.5 <0.5 <0.5 <0.5 <0.5
Tetrachloroethene 0.5 <0.5 <0.5 <0.5 <0.5
Chlorobenzene 0.5 <0.5 <0.5 <0.5 <0.5
Ethylbenzene 0.5 <0.5 <0.5 <0.5 <0.5
meta- & para-Xylene 1.0 <1.0 <1.0 <1.0 <1.0
Styrene 0.5 <0.5 <0.5 <0.5 <0.5
1.1.2.2-Tetrachloroethane 0.5 <0.5 <0.5 <0.5 <0.5
ortho-Xylene 0.5 <0.5 <0.5 <0.5 <0.5
4-Ethyltoluene 0.5 <0.5 <0.5 <0.5 <0.5
1.3.5-Trimethylbenzene 0.5 <0.5 <0.5 <0.5 <0.5
1.2.4-Trimethylbenzene 0.5 <0.5 <0.5 <0.5 <0.5
1.3-Dichlorobenzene 0.5 <0.5 <0.5 <0.5 <0.5
1.4-Dichlorobenzene 0.5 <0.5 <0.5 <0.5 <0.5
1.2-Dichlorobenzene 0.5 <0.5 <0.5 <0.5 <0.5
1.2.4-Trichlorobenzene 0.5 <0.5 <0.5 <0.5 <0.5
Hexachlorobutadiene 0.5 <0.5 <0.5 <0.5 <0.5
a A Summa canister is a stainless steel container that has had the internal surfaces specially passivated (i.e. the material is treated to
become "passive," so it is less affected by environmental factors such as air or water) using a “Summa” process. This process
combines an electropolishing step with a chemical deactivation step to produce a surface that is nearly chemically inert. A Summa
surface has the appearance of a mirror: bright, shiny and smooth. The degree of chemical inertness of a whole air sample container
is crucial to minimizing reactions with the sample and maximizing recovery of target compounds from the container.

7983 Wilpinjong Gases Review R2.docx 17
Ambient Air Monitoring Report - Wilpinjong Coal
Wilpinjong Coal Mine | Job Number 7983
3.5.5.1 Benzene
Figure 3-9 shows the 5-minute average concentrations of benzene as measured using field gas
chromatography, together with the LOR for the summa canisters. The summa canisters recorded no
benzene concentrations above the LOR.
All the measured concentrations from gas chromatography are significantly below the relevant EPA
Victoria design criterion to protect against the carcinogenic effects of benzene.
Whilst there are some spikes of higher concentrations in the Cooks Gaps data, the highest
concentration of 8.26 ppb (measured at 10.35 am on 18 April 2013) is considered to be an irregularity in
the data. The previous concentration measured was 0.01 ppb at 9am, there are no recorded
concentrations from 9am until the maximum measured at 10.35am. Following this there are no
measured concentrations until 2.35 pm when a value of 0 ppb was recorded. On average, both sites
measure similar concentrations.
Figure 3-9: 5-minute average benzene concentrations (ppb)
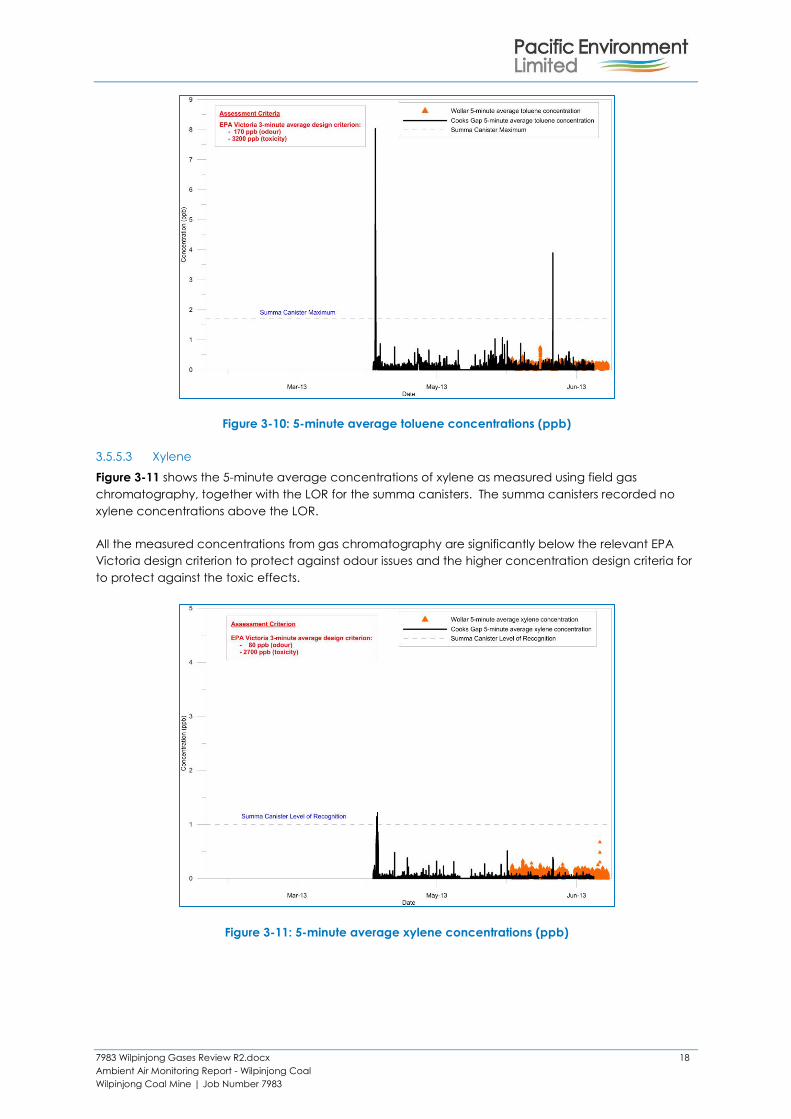
3.5.5.2 Toluene
Figure 3-10 shows the 5-minute average concentrations of toluene as measured using field gas
chromatography, together with the maximum measured concentration from the summa canisters.
The maximum measured toluene concentration was 1.7 ppb on 15 May. Since the summa canisters
are exposed for 24 hours, it is not accurate to make a direct comparison against the air quality
standards, which are based on a 3-minute averaging period. However, all the measured
concentrations from gas chromatography are significantly below the relevant EPA Victoria design
criterion to protect against odour issues and the higher concentration design criteria to protect against
the toxic effects.
7983 Wilpinjong Gases Review R2.docx 18
Ambient Air Monitoring Report - Wilpinjong Coal
Wilpinjong Coal Mine | Job Number 7983
Figure 3-10: 5-minute average toluene concentrations (ppb)
3.5.5.3 Xylene
Figure 3-11 shows the 5-minute average concentrations of xylene as measured using field gas
chromatography, together with the LOR for the summa canisters. The summa canisters recorded no
xylene concentrations above the LOR.
All the measured concentrations from gas chromatography are significantly below the relevant EPA
Victoria design criterion to protect against odour issues and the higher concentration design criteria for
to protect against the toxic effects.
Figure 3-11: 5-minute average xylene concentrations (ppb)

7983 Wilpinjong Gases Review R2.docx 19
Ambient Air Monitoring Report - Wilpinjong Coal
Wilpinjong Coal Mine | Job Number 7983
3.5.5.4 Other VOCs
The only other VOCs that were detected by the summa canisters were Freon-12, Chloromethane,
Dichloromethane.
Freon-12 is a refrigerant and aerosol spray propellant. Manufacturing of Freon-12 was discontinued in
the 1990s due to concerns relating to the ozone layer. Freons remain in the atmosphere for many years
and their presence in air samples is not unusual. The maximum measured concentration was 0.6 ppb on
15 May at both sites, only just above the LOR of 0.5 ppb. There are no air quality standards for Freon-12.
Chloromethane was also once widely used as a refrigerant. The maximum measured concentration
was 1.1 ppb on 29 May at Cooks Gap. NSW EPA sets an impact assessment criterion of 0.9 ppm (900
ppb) for a 1-hour average. Since the summa canisters are exposed for 24 hours, it is not accurate to
make a direct comparison, however, even if all the measured chloromethane had been detected by
the canisters in a single one hour period, it is significantly below the assessment criteria.
Dichloromethane (also known as methylene chloride) is used as a solvent. The maximum measured
concentration was 0.5 ppb on 15 May at Wollar. NSW EPA sets an impact assessment criteria of 0.9
ppm (900 ppb) for a 1-hour average. Since the summa canisters are exposed for 24 hours, it is not
accurate to make a direct comparison, however, even if all the measured dichloromethane had been
detected by the canisters in a single one hour period, it is significantly below the assessment criteria.
Whilst these chloromethane and dichloromethane do have odours associated with them, Freon 12 is an
odourless gas. An odour complaint was received on 15 May, which coincides with the highest
concentration of dichloromethane, however, the odour detection thresholds (that is, the concentration
above which they can be smelt) is significantly higher than the measured concentration. It is therefore
unlikely that these are responsible for odour complaints. The odour thresholds are:
Chloromethane: 10 ppm (10,000 ppb)
Dichloromethane: 250 ppm (250,000 ppb)
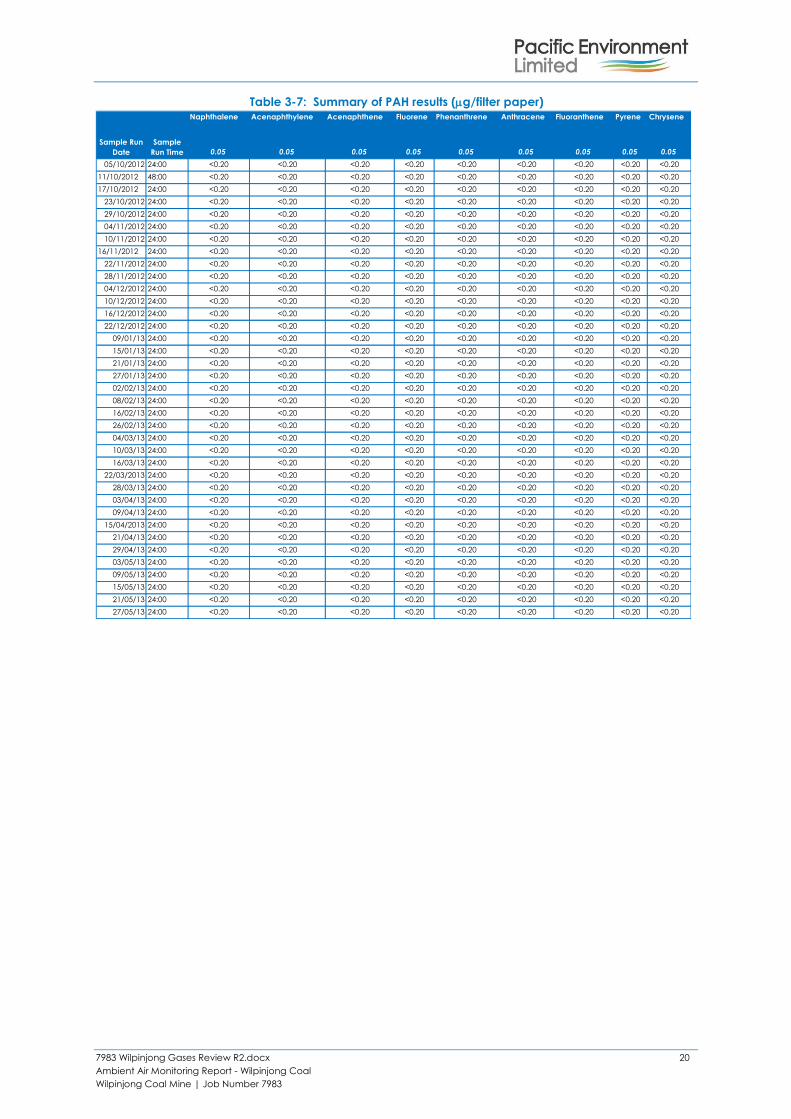
3.5.6 Polycyclic aromatic hydrocarbons (PAHs)
PAH concentrations were determined by ALS by analysing the filter papers from the high volume air
sampler (HVAS) in Wollar. A summary of the results is presented in Table 3-7. The majority of the
samples were below the level of recognition (LOR) of the analysis method. Those that were above the
LOR are shown as shaded.
In order to determine compliance with the NSW EPA impact assessment criterion, the recorded values
of micrograms (g) per filter paper is combined with the flow-rate through the HVAS to determine the
concentration. The concentration of each PAH is then multiplied by a potency equivalency factor
(PEF) and summed to express the total PAH concentration as “benzo[a]pyrene equivalents”. The result
is numerically equivalent to summing up risks attributable to individual PAH in the mixture for
comparison against criterion (see Table 3-8). Based on this analysis, all measured PAH levels are
significantly below the NSW impact assessment criteria.
7983 Wilpinjong Gases Review R2.docx 20
Ambient Air Monitoring Report - Wilpinjong Coal
Wilpinjong Coal Mine | Job Number 7983
Table 3-7: Summary of PAH results (g/filter paper)
Naphthalene Acenaphthylene Acenaphthene Fluorene Phenanthrene Anthracene Fluoranthene Pyrene Chrysene
0.05 0.05 0.05 0.05 0.05 0.05 0.05 0.05 0.05
05/10/2012 24:00 <0.20 <0.20 <0.20 <0.20 <0.20 <0.20 <0.20 <0.20 <0.20
11/10/2012 48:00 <0.20 <0.20 <0.20 <0.20 <0.20 <0.20 <0.20 <0.20 <0.20
17/10/2012 24:00 <0.20 <0.20 <0.20 <0.20 <0.20 <0.20 <0.20 <0.20 <0.20
23/10/2012 24:00 <0.20 <0.20 <0.20 <0.20 <0.20 <0.20 <0.20 <0.20 <0.20
29/10/2012 24:00 <0.20 <0.20 <0.20 <0.20 <0.20 <0.20 <0.20 <0.20 <0.20
04/11/2012 24:00 <0.20 <0.20 <0.20 <0.20 <0.20 <0.20 <0.20 <0.20 <0.20
10/11/2012 24:00 <0.20 <0.20 <0.20 <0.20 <0.20 <0.20 <0.20 <0.20 <0.20
16/11/2012 24:00 <0.20 <0.20 <0.20 <0.20 <0.20 <0.20 <0.20 <0.20 <0.20
22/11/2012 24:00 <0.20 <0.20 <0.20 <0.20 <0.20 <0.20 <0.20 <0.20 <0.20
28/11/2012 24:00 <0.20 <0.20 <0.20 <0.20 <0.20 <0.20 <0.20 <0.20 <0.20
04/12/2012 24:00 <0.20 <0.20 <0.20 <0.20 <0.20 <0.20 <0.20 <0.20 <0.20
10/12/2012 24:00 <0.20 <0.20 <0.20 <0.20 <0.20 <0.20 <0.20 <0.20 <0.20
16/12/2012 24:00 <0.20 <0.20 <0.20 <0.20 <0.20 <0.20 <0.20 <0.20 <0.20
22/12/2012 24:00 <0.20 <0.20 <0.20 <0.20 <0.20 <0.20 <0.20 <0.20 <0.20
09/01/13 24:00 <0.20 <0.20 <0.20 <0.20 <0.20 <0.20 <0.20 <0.20 <0.20
15/01/13 24:00 <0.20 <0.20 <0.20 <0.20 <0.20 <0.20 <0.20 <0.20 <0.20
21/01/13 24:00 <0.20 <0.20 <0.20 <0.20 <0.20 <0.20 <0.20 <0.20 <0.20
27/01/13 24:00 <0.20 <0.20 <0.20 <0.20 <0.20 <0.20 <0.20 <0.20 <0.20
02/02/13 24:00 <0.20 <0.20 <0.20 <0.20 <0.20 <0.20 <0.20 <0.20 <0.20
08/02/13 24:00 <0.20 <0.20 <0.20 <0.20 <0.20 <0.20 <0.20 <0.20 <0.20
16/02/13 24:00 <0.20 <0.20 <0.20 <0.20 <0.20 <0.20 <0.20 <0.20 <0.20
26/02/13 24:00 <0.20 <0.20 <0.20 <0.20 <0.20 <0.20 <0.20 <0.20 <0.20
04/03/13 24:00 <0.20 <0.20 <0.20 <0.20 <0.20 <0.20 <0.20 <0.20 <0.20
10/03/13 24:00 <0.20 <0.20 <0.20 <0.20 <0.20 <0.20 <0.20 <0.20 <0.20
16/03/13 24:00 <0.20 <0.20 <0.20 <0.20 <0.20 <0.20 <0.20 <0.20 <0.20
22/03/2013 24:00 <0.20 <0.20 <0.20 <0.20 <0.20 <0.20 <0.20 <0.20 <0.20
28/03/13 24:00 <0.20 <0.20 <0.20 <0.20 <0.20 <0.20 <0.20 <0.20 <0.20
03/04/13 24:00 <0.20 <0.20 <0.20 <0.20 <0.20 <0.20 <0.20 <0.20 <0.20
09/04/13 24:00 <0.20 <0.20 <0.20 <0.20 <0.20 <0.20 <0.20 <0.20 <0.20
15/04/2013 24:00 <0.20 <0.20 <0.20 <0.20 <0.20 <0.20 <0.20 <0.20 <0.20
21/04/13 24:00 <0.20 <0.20 <0.20 <0.20 <0.20 <0.20 <0.20 <0.20 <0.20
29/04/13 24:00 <0.20 <0.20 <0.20 <0.20 <0.20 <0.20 <0.20 <0.20 <0.20
03/05/13 24:00 <0.20 <0.20 <0.20 <0.20 <0.20 <0.20 <0.20 <0.20 <0.20
09/05/13 24:00 <0.20 <0.20 <0.20 <0.20 <0.20 <0.20 <0.20 <0.20 <0.20
15/05/13 24:00 <0.20 <0.20 <0.20 <0.20 <0.20 <0.20 <0.20 <0.20 <0.20
21/05/13 24:00 <0.20 <0.20 <0.20 <0.20 <0.20 <0.20 <0.20 <0.20 <0.20
27/05/13 24:00 <0.20 <0.20 <0.20 <0.20 <0.20 <0.20 <0.20 <0.20 <0.20
Sample Run
Date
Sample
Run Time

7983 Wilpinjong Gases Review R2.docx 21
Ambient Air Monitoring Report - Wilpinjong Coal
Wilpinjong Coal Mine | Job Number 7983
Table 3-4 continued
Table 3-8: PAH as benzo[a]pyrene equivalents (g/m3)
Date PAH g/filter g/m3 PEF BaP
equivalency
g/m3)
Total BaP equivalent
g/m3)
Criteria = 0.4 g/m3
03/04/13 Benzo(g.h.i)perylene 0.23 0.0002 0.1 0.00002 0.00002
29/04/13
Benzo(a)pyrene 0.21 0.0002 1 0.00020
0.00025 Indeno(1.2.3.cd)pyrene 0.24 0.0002 0.1 0.00002
Benzo(g.h.i)perylene 0.26 0.0003 0.1 0.00003
03/05/13 Benzo(a)anthracene 0.32 0.0003 0.1 0.00003 0.00003
21/05/13 Benzo(a)anthracene 0.43 0.0004 0.1 0.00004 0.00004
27/05/13 Benzo(a)anthracene 0.30 0.0003 0.1 0.00003 0.00003
Benzo(a)anthracene Benzo(b)fluoranthene Benzo(k)fluoranthene Benzo(a)pyrene Indeno(1.2.3.cd)pyrene Dibenzo(a,h)anthracene Benzo(g.h.i)perylene
0.05 0.05 0.05 0.05 0.05 0.05 0.05
05/10/2012 24:00 <0.20 <0.20 <0.20 <0.20 <0.20 <0.20 <0.20
11/10/2012 48:00 <0.20 <0.20 <0.20 <0.20 <0.20 <0.20 <0.20
17/10/2012 24:00 <0.20 <0.20 <0.20 <0.20 <0.20 <0.20 <0.20
23/10/2012 24:00 <0.20 <0.20 <0.20 <0.20 <0.20 <0.20 <0.20
29/10/2012 24:00 <0.20 <0.20 <0.20 <0.20 <0.20 <0.20 <0.20
04/11/2012 24:00 <0.20 <0.20 <0.20 <0.20 <0.20 <0.20 <0.20
10/11/2012 24:00 <0.20 <0.20 <0.20 <0.20 <0.20 <0.20 <0.20
16/11/2012 24:00 <0.20 <0.20 <0.20 <0.20 <0.20 <0.20 <0.20
22/11/2012 24:00 <0.20 <0.20 <0.20 <0.20 <0.20 <0.20 <0.20
28/11/2012 24:00 <0.20 <0.20 <0.20 <0.20 <0.20 <0.20 <0.20
04/12/2012 24:00 <0.20 <0.20 <0.20 <0.20 <0.20 <0.20 <0.20
10/12/2012 24:00 <0.20 <0.20 <0.20 <0.20 <0.20 <0.20 <0.20
16/12/2012 24:00 <0.20 <0.20 <0.20 <0.20 <0.20 <0.20 <0.20
22/12/2012 24:00 <0.20 <0.20 <0.20 <0.20 <0.20 <0.20 <0.20
09/01/13 24:00 <0.20 <0.20 <0.20 <0.20 <0.20 <0.20 <0.20
15/01/13 24:00 <0.20 <0.20 <0.20 <0.20 <0.20 <0.20 <0.20
21/01/13 24:00 <0.20 <0.20 <0.20 <0.20 <0.20 <0.20 <0.20
27/01/13 24:00 <0.20 <0.20 <0.20 <0.20 <0.20 <0.20 <0.20
02/02/13 24:00 <0.20 <0.20 <0.20 <0.20 <0.20 <0.20 <0.20
08/02/13 24:00 <0.20 <0.20 <0.20 <0.20 <0.20 <0.20 <0.20
16/02/13 24:00 <0.20 <0.20 <0.20 <0.20 <0.20 <0.20 <0.20
26/02/13 24:00 <0.20 <0.20 <0.20 <0.20 <0.20 <0.20 <0.20
04/03/13 24:00 <0.20 <0.20 <0.20 <0.20 <0.20 <0.20 <0.20
10/03/13 24:00 <0.20 <0.20 <0.20 <0.20 <0.20 <0.20 <0.20
16/03/13 24:00 <0.20 <0.20 <0.20 <0.20 <0.20 <0.20 <0.20
22/03/2013 24:00 <0.20 <0.20 <0.20 <0.20 <0.20 <0.20 <0.20
28/03/13 24:00 <0.20 <0.20 <0.20 <0.20 <0.20 <0.20 <0.20
03/04/13 24:00 <0.20 <0.20 <0.20 <0.20 0.22 <0.20 0.23
09/04/13 24:00 <0.20 <0.20 <0.20 <0.20 <0.20 <0.20 <0.20
15/04/2013 24:00 <0.20 <0.20 <0.20 <0.20 <0.20 <0.20 <0.20
21/04/13 24:00 <0.20 <0.20 <0.20 <0.20 <0.20 <0.20 <0.20
29/04/13 24:00 <0.20 <0.20 <0.20 0.21 0.24 <0.20 0.26
03/05/13 24:00 <0.20 0.32 <0.20 <0.20 <0.20 <0.20 <0.20
09/05/13 24:00 <0.20 <0.20 <0.20 <0.20 <0.20 <0.20 <0.20
15/05/13 24:00 <0.20 <0.20 <0.20 <0.20 <0.20 <0.20 <0.20
21/05/13 24:00 <0.20 0.43 <0.20 <0.20 <0.20 <0.20 <0.20
27/05/13 24:00 <0.20 0.30 <0.20 <0.20 <0.20 <0.20 <0.20
Level of Recognition (LOR) (µg)Sample Run
Date
Sample
Run Time
7983 Wilpinjong Gases Review R2.docx 22
Ambient Air Monitoring Report - Wilpinjong Coal
Wilpinjong Coal Mine | Job Number 7983
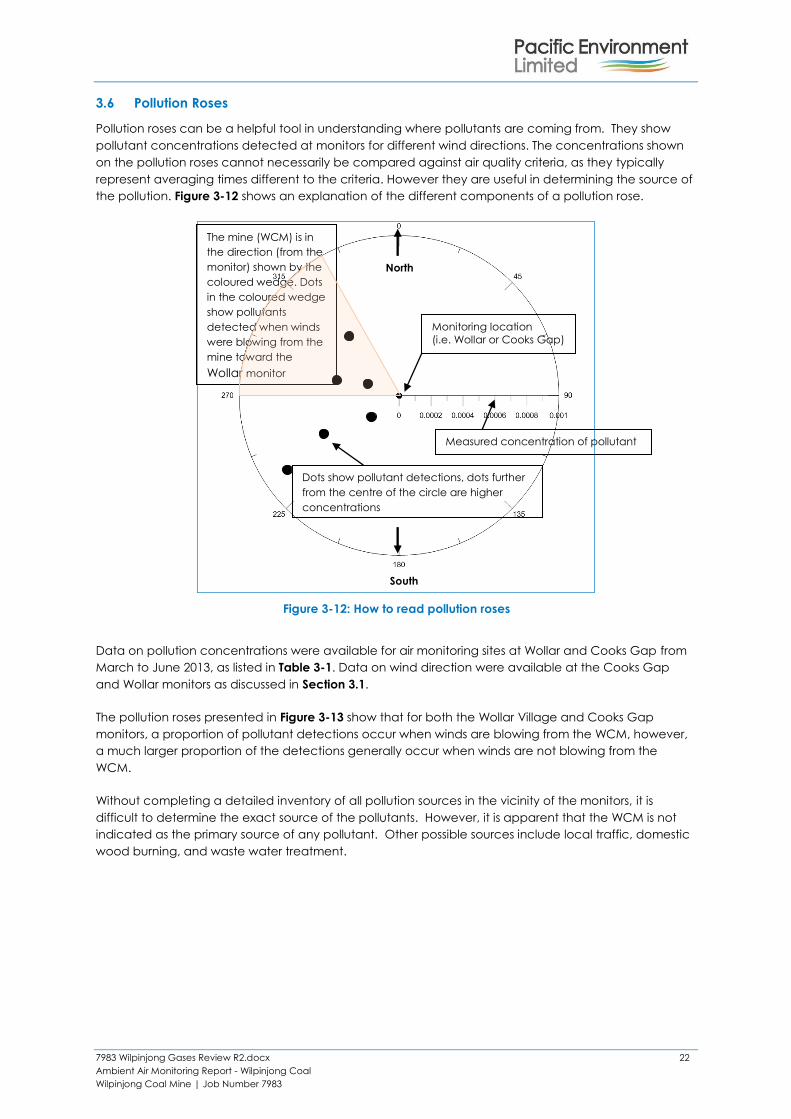
3.6 Pollution Roses
Pollution roses can be a helpful tool in understanding where pollutants are coming from. They show
pollutant concentrations detected at monitors for different wind directions. The concentrations shown
on the pollution roses cannot necessarily be compared against air quality criteria, as they typically
represent averaging times different to the criteria. However they are useful in determining the source of
the pollution. Figure 3-12 shows an explanation of the different components of a pollution rose.
Figure 3-12: How to read pollution roses
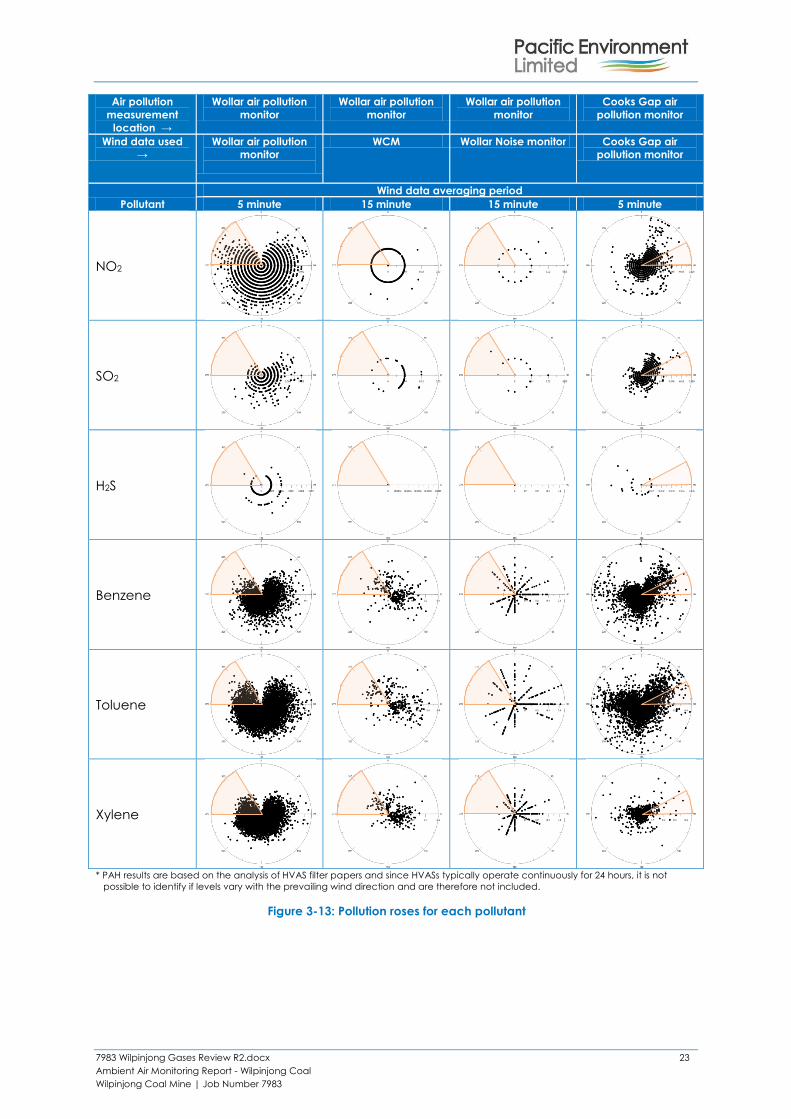
Data on pollution concentrations were available for air monitoring sites at Wollar and Cooks Gap from
March to June 2013, as listed in Table 3-1. Data on wind direction were available at the Cooks Gap
and Wollar monitors as discussed in Section 3.1.
The pollution roses presented in Figure 3-13 show that for both the Wollar Village and Cooks Gap
monitors, a proportion of pollutant detections occur when winds are blowing from the WCM, however,
a much larger proportion of the detections generally occur when winds are not blowing from the
WCM.
Without completing a detailed inventory of all pollution sources in the vicinity of the monitors, it is
difficult to determine the exact source of the pollutants. However, it is apparent that the WCM is not
indicated as the primary source of any pollutant. Other possible sources include local traffic, domestic
wood burning, and waste water treatment.
South
The mine (WCM) is in
the direction (from the
monitor) shown by the
coloured wedge. Dots
in the coloured wedge
show pollutants
detected when winds
were blowing from the
mine toward the
Wollar monitor
Dots show pollutant detections, dots further
from the centre of the circle are higher
concentrations
Measured concentration of pollutant
Monitoring location
(i.e. Wollar or Cooks Gap)
North
7983 Wilpinjong Gases Review R2.docx 23
Ambient Air Monitoring Report - Wilpinjong Coal
Wilpinjong Coal Mine | Job Number 7983
Air pollution
measurement
location →
Wollar air pollution
monitor
Wollar air pollution
monitor
Wollar air pollution
monitor
Cooks Gap air
pollution monitor
Wind data used
→
Wollar air pollution
monitor
WCM Wollar Noise monitor Cooks Gap air
pollution monitor
Pollutant
Wind data averaging period
5 minute 15 minute 15 minute 5 minute
NO2
SO2
H2S
Benzene
Toluene
Xylene
* PAH results are based on the analysis of HVAS filter papers and since HVASs typically operate continuously for 24 hours, it is not
possible to identify if levels vary with the prevailing wind direction and are therefore not included.
Figure 3-13: Pollution roses for each pollutant

7983 Wilpinjong Gases Review R2.docx 24
Ambient Air Monitoring Report - Wilpinjong Coal
Wilpinjong Coal Mine | Job Number 7983
4 CONCLUSIONS AND FUTURE MONITORING
This report presents an overview of the pollutants that can be released from spontaneous combustion
events and analysed monitoring data from a range of pollutants collected at two monitoring locations
close to the WCM (Wollar and Cooks Gap) between March and June 2013.
All measured concentrations of NO2, benzene, toluene and xylene and other VOCs were significantly
below the relevant assessment criteria.
Other than one ten-minute period, which is likely to be related to equipment malfunction, all SO2
concentrations are also below relevant assessment criteria.
Whilst the H2S concentrations are all below the relevant ambient air quality criteria, there are occasions
when a complaint coincided with higher H2S concentrations. This could explain some of the odour
complaints received. However, whilst the pollution roses show that a proportion of pollutant detections
occur when winds are blowing from the WCM, a much larger proportion of the detections generally
occur when winds are not blowing from the WCM.
Whilst it is difficult to determine the source of these pollutants on the basis of the pollution roses, it is
apparent from these data that the WCM is not indicated as the primary source of any pollutant.
Given the low concentrations of all pollutants measured, and that there is no clear indication the WCM
is the primary source of any of them, it is difficult to make any recommendations for ongoing
monitoring. Fence-line monitoring of H2S concentrations could be used as early detection measure
that a spontaneous combustion event is occurring, however, there are currently no known applications
of monitoring of this type in the mining industry.

7983 Wilpinjong Gases Review R2.docx 25
Ambient Air Monitoring Report - Wilpinjong Coal
Wilpinjong Coal Mine | Job Number 7983
5 REFERENCES
Carras J., Day S., Saghafi A. and Roberts O.C. (2005)
“Spontaneous Combustion in Open Cut Coal Mines – Recent Australian Research”
proceedings of Coal Operators Conference, University of Wollongong & the Australian Institute
of Mining and Metallurgy, 2005, 195-200.
Day, Stuart (2008)
“Spontaneous Combustion in Open Cut Coal Mines” prepared by CSIRO Energy Technology
(ACARP Project C17006). May 2008.
Day, S., Azzi, M., Fry, R., Garland, E., Jacyna, D., Javanmard, H., Patterson, M., & Tibbett, A. (2013)
“Emissions from Blasting in Open Cut Coal Mining” prepared by CSIRO Energy Technology
(ACARP Project C18034). June 2013.
NSW DEC (2005)
“Approved Methods and Guidance for the Modelling and Assessment of Air Pollutants in NSW”,
August 2005.
NSW EPA (2012)
“NSW State of the Environment 2012” published by State of NSW and Environment Protection
Authority. Available from http://www.environment.nsw.gov.au/soe/soe2012/index.htm
Ruth, J.H. (1986)
“Odor thresholds and irritation levels of several chemical substances: A review.” Am. Ind. Hyg.
Assoc. J. 47(3):A142-A151.
US EPA (2003)
“Toxicological review of hydrogen sulfide (CAS No. 7783-06-4) in support of summary
information on the Integrated Risk Information System (IRIS)” EPA/635/R-03/005. Available from
http://www.epa.gov/iris/toxreviews/0061tr.pdf
Victorian Government Gazette (2001)
“State Environment Protection Policy (Air Quality Management)”, No. S 240, Friday 21
December 2001, Government of Victoria, Melbourne.
http://www.gazette.vic.gov.au/gazette/Gazettes2001/GG2001S240.pdf
World Health Organisation (2003)
“Hydrogen sulfide: Human health aspects” Concise International Chemical Assessment
Document 53. World Health Organization, Geneva, 2003 Available from
http://www.who.int/ipcs/publications/cicad/en/cicad53.pdf
Ministry for the Environment (2002) “Ambient Air Quality Guidelines. 2002 Update” Air Quality Report No 32 Published in May 2002
by the Ministry for the Environment PO Box 10-362, Wellington, New Zealand ISBN: 0-478-24064-3
ME number: 438. Available from http://www.mfe.govt.nz/publications/air/ambient-air-quality-
may02/ambient-guide-may02.pdf

7983 Wilpinjong Gases Review R2.docx A-1
Ambient Air Monitoring Report - Wilpinjong Coal
Wilpinjong Coal Mine | Job Number 7983
Appendix A: Wollar BTX Instrument Problems - Ecotech letter

7983 Wilpinjong Gases Review R2.docx A-2
Ambient Air Monitoring Report - Wilpinjong Coal
Wilpinjong Coal Mine | Job Number 7983

7983 Wilpinjong Gases Review R2.docx B-1
Ambient Air Monitoring Report - Wilpinjong Coal
Wilpinjong Coal Mine | Job Number 7983
Appendix B: Ecotech credentials

7983 Wilpinjong Gases Review R2.docx B-2
Ambient Air Monitoring Report - Wilpinjong Coal
Wilpinjong Coal Mine | Job Number 7983

7983 Wilpinjong Gases Review R2.docx B-3
Ambient Air Monitoring Report - Wilpinjong Coal
Wilpinjong Coal Mine | Job Number 7983
7983 Wilpinjong Gases Review R2.docx C-1
Ambient Air Monitoring Report - Wilpinjong Coal
Wilpinjong Coal Mine | Job Number 7983
Appendix C: Ecotech Monitoring Report

7983 Wilpinjong Gases Review R2.docx C-2
Ambient Air Monitoring Report - Wilpinjong Coal
Wilpinjong Coal Mine | Job Number 7983

7983 Wilpinjong Gases Review R2.docx C-3
Ambient Air Monitoring Report - Wilpinjong Coal
Wilpinjong Coal Mine | Job Number 7983

7983 Wilpinjong Gases Review R2.docx C-4
Ambient Air Monitoring Report - Wilpinjong Coal
Wilpinjong Coal Mine | Job Number 7983
7983 Wilpinjong Gases Review R2.docx C-5
Ambient Air Monitoring Report - Wilpinjong Coal
Wilpinjong Coal Mine | Job Number 7983

7983 Wilpinjong Gases Review R2.docx C-6
Ambient Air Monitoring Report - Wilpinjong Coal
Wilpinjong Coal Mine | Job Number 7983
7983 Wilpinjong Gases Review R2.docx C-7
Ambient Air Monitoring Report - Wilpinjong Coal
Wilpinjong Coal Mine | Job Number 7983
7983 Wilpinjong Gases Review R2.docx C-8
Ambient Air Monitoring Report - Wilpinjong Coal
Wilpinjong Coal Mine | Job Number 7983

7983 Wilpinjong Gases Review R2.docx C-9
Ambient Air Monitoring Report - Wilpinjong Coal
Wilpinjong Coal Mine | Job Number 7983
7983 Wilpinjong Gases Review R2.docx C-10
Ambient Air Monitoring Report - Wilpinjong Coal
Wilpinjong Coal Mine | Job Number 7983
7983 Wilpinjong Gases Review R2.docx C-11
Ambient Air Monitoring Report - Wilpinjong Coal
Wilpinjong Coal Mine | Job Number 7983
7983 Wilpinjong Gases Review R2.docx C-12
Ambient Air Monitoring Report - Wilpinjong Coal
Wilpinjong Coal Mine | Job Number 7983

7983 Wilpinjong Gases Review R2.docx C-13
Ambient Air Monitoring Report - Wilpinjong Coal
Wilpinjong Coal Mine | Job Number 7983

7983 Wilpinjong Gases Review R2.docx C-14
Ambient Air Monitoring Report - Wilpinjong Coal
Wilpinjong Coal Mine | Job Number 7983
7983 Wilpinjong Gases Review R2.docx C-15
Ambient Air Monitoring Report - Wilpinjong Coal
Wilpinjong Coal Mine | Job Number 7983

7983 Wilpinjong Gases Review R2.docx C-16
Ambient Air Monitoring Report - Wilpinjong Coal
Wilpinjong Coal Mine | Job Number 7983
7983 Wilpinjong Gases Review R2.docx C-17
Ambient Air Monitoring Report - Wilpinjong Coal
Wilpinjong Coal Mine | Job Number 7983

7983 Wilpinjong Gases Review R2.docx C-18
Ambient Air Monitoring Report - Wilpinjong Coal
Wilpinjong Coal Mine | Job Number 7983

7983 Wilpinjong Gases Review R2.docx C-19
Ambient Air Monitoring Report - Wilpinjong Coal
Wilpinjong Coal Mine | Job Number 7983

7983 Wilpinjong Gases Review R2.docx C-20
Ambient Air Monitoring Report - Wilpinjong Coal
Wilpinjong Coal Mine | Job Number 7983

7983 Wilpinjong Gases Review R2.docx C-21
Ambient Air Monitoring Report - Wilpinjong Coal
Wilpinjong Coal Mine | Job Number 7983

7983 Wilpinjong Gases Review R2.docx C-22
Ambient Air Monitoring Report - Wilpinjong Coal
Wilpinjong Coal Mine | Job Number 7983

7983 Wilpinjong Gases Review R2.docx C-23
Ambient Air Monitoring Report - Wilpinjong Coal
Wilpinjong Coal Mine | Job Number 7983
7983 Wilpinjong Gases Review R2.docx C-24
Ambient Air Monitoring Report - Wilpinjong Coal
Wilpinjong Coal Mine | Job Number 7983
7983 Wilpinjong Gases Review R2.docx C-25
Ambient Air Monitoring Report - Wilpinjong Coal
Wilpinjong Coal Mine | Job Number 7983

7983 Wilpinjong Gases Review R2.docx C-26
Ambient Air Monitoring Report - Wilpinjong Coal
Wilpinjong Coal Mine | Job Number 7983
7983 Wilpinjong Gases Review R2.docx C-27
Ambient Air Monitoring Report - Wilpinjong Coal
Wilpinjong Coal Mine | Job Number 7983
7983 Wilpinjong Gases Review R2.docx C-28
Ambient Air Monitoring Report - Wilpinjong Coal
Wilpinjong Coal Mine | Job Number 7983

7983 Wilpinjong Gases Review R2.docx C-29
Ambient Air Monitoring Report - Wilpinjong Coal
Wilpinjong Coal Mine | Job Number 7983
7983 Wilpinjong Gases Review R2.docx C-30
Ambient Air Monitoring Report - Wilpinjong Coal
Wilpinjong Coal Mine | Job Number 7983

7983 Wilpinjong Gases Review R2.docx C-31
Ambient Air Monitoring Report - Wilpinjong Coal
Wilpinjong Coal Mine | Job Number 7983

7983 Wilpinjong Gases Review R2.docx C-32
Ambient Air Monitoring Report - Wilpinjong Coal
Wilpinjong Coal Mine | Job Number 7983

7983 Wilpinjong Gases Review R2.docx C-33
Ambient Air Monitoring Report - Wilpinjong Coal
Wilpinjong Coal Mine | Job Number 7983

7983 Wilpinjong Gases Review R2.docx D-1
Ambient Air Monitoring Report - Wilpinjong Coal
Wilpinjong Coal Mine | Job Number 7983
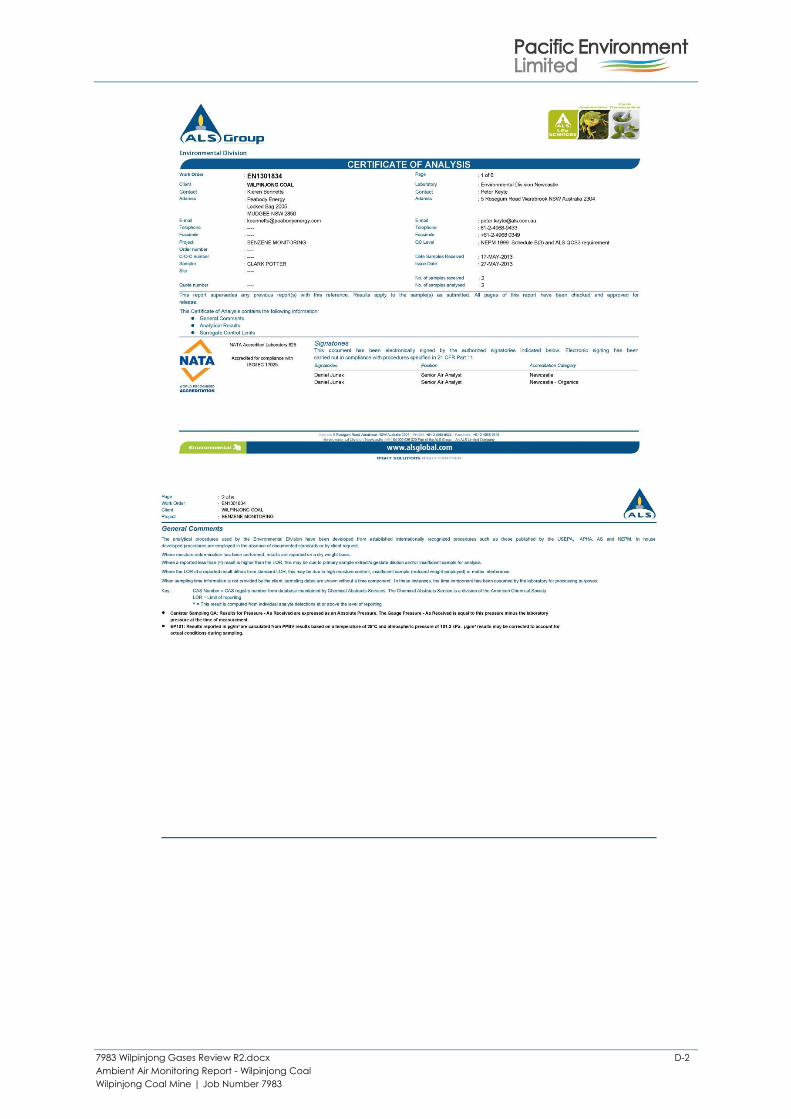
Appendix D: ALS Summa Canister Monitoring Report
7983 Wilpinjong Gases Review R2.docx D-2
Ambient Air Monitoring Report - Wilpinjong Coal
Wilpinjong Coal Mine | Job Number 7983
7983 Wilpinjong Gases Review R2.docx D-3
Ambient Air Monitoring Report - Wilpinjong Coal
Wilpinjong Coal Mine | Job Number 7983

7983 Wilpinjong Gases Review R2.docx D-4
Ambient Air Monitoring Report - Wilpinjong Coal
Wilpinjong Coal Mine | Job Number 7983
7983 Wilpinjong Gases Review R2.docx E-1
Ambient Air Monitoring Report - Wilpinjong Coal
Wilpinjong Coal Mine | Job Number 7983
Appendix E: ALS PAH Monitoring Report
7983 Wilpinjong Gases Review R2.docx E-2
Ambient Air Monitoring Report - Wilpinjong Coal
Wilpinjong Coal Mine | Job Number 7983

7983 Wilpinjong Gases Review R2.docx E-3
Ambient Air Monitoring Report - Wilpinjong Coal
Wilpinjong Coal Mine | Job Number 7983