alumetal group h1 2016 financial results · 18th july 2016 beginning of purchase and preparation of...
TRANSCRIPT
19th August 2016
Alumetal Group
H1 2016 financial results

H1 2016 and LTM at glance
Volume sales – 83k tons in H1 2016 and 161k tons in LTM
EBITDA – PLN 67 mn in H1 2016 and PLN 126 mn in LTM
Net profit – PLN 55 mn in H1 2016 and PLN 102 mn in LTM
Operational cash flow – PLN 72 mn in H1 2016 and PLN 147 mn in LTM
Payment of dividend – PLN 39 mn on 7th June 2016
Net debt – PLN 79 mn (0,6xEBITDA)

Motor vehicle registrations in the EU in thou. units
In H1 2016 motor vehicles registrations in the UE increased by 8,8% yoy, of which passagnercars (PC) sales increased by 9,4% and commercial vehicles (CV) sales went up by 13,5%
In LTM sale volume of motor vehicles in UE increased by 10,2% yoy to the level of 16,6 mnunits (9,8% increase in PC and 12,8% increase in CV)
9%
5%
6% 4%
9%
8%
10% 11%
9%
-
500 000
1 000 000
1 500 000
2 000 000
2 500 000
3 000 000
3 500 000
4 000 000
4 500 000
5 000 000
1q'13 1q'14 2q'13 2q'14 3q'13 3q'14 4q'13 4q'14 1q'14 1q '15 2q'14 2q'15 3q'14 3q'15 4q '14 4q '15 1q '15 1q '16 2q '15 2q '16
CV PC
11%
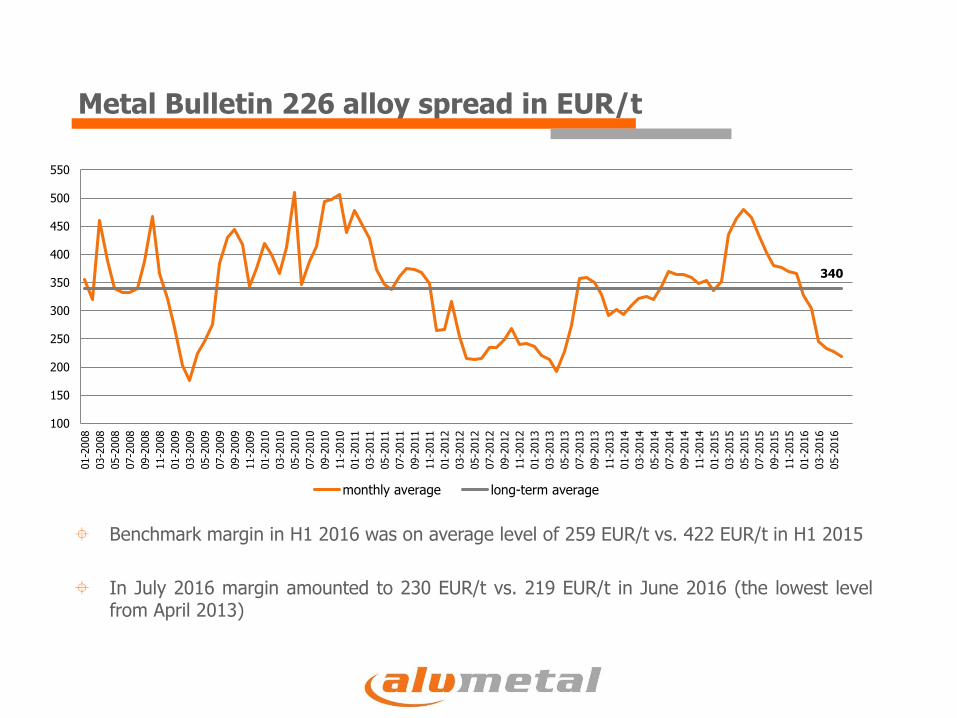
Metal Bulletin 226 alloy spread in EUR/t
Benchmark margin in H1 2016 was on average level of 259 EUR/t vs. 422 EUR/t in H1 2015
In July 2016 margin amounted to 230 EUR/t vs. 219 EUR/t in June 2016 (the lowest levelfrom April 2013)
340
100
150
200
250
300
350
400
450
500
550
01-2
008
03-2
008
05-2
008
07-2
008
09-2
008
11-2
008
01-2
009
03-2
009
05-2
009
07-2
009
09-2
009
11-2
009
01-2
010
03-2
010
05-2
010
07-2
010
09-2
010
11-2
010
01-2
011
03-2
011
05-2
011
07-2
011
09-2
011
11-2
011
01-2
012
03-2
012
05-2
012
07-2
012
09-2
012
11-2
012
01-2
013
03-2
013
05-2
013
07-2
013
09-2
013
11-2
013
01-2
014
03-2
014
05-2
014
07-2
014
09-2
014
11-2
014
01-2
015
03-2
015
05-2
015
07-2
015
09-2
015
11-2
015
01-2
016
03-2
016
05-2
016
monthly average long-term average

Volume sales in thou. tons
In H1 2016 sales volume decreased by 5% yoy to 83 thou. tons
In LTM sales volume amounted to 161 thou. tons which is 2% decrease in comparison to2015
41,3 40,2
86,7
82,6
0,0
10,0
20,0
30,0
40,0
50,0
60,0
70,0
80,0
90,0
100,0
2Q'15 2Q'16 1H'15 1H'16
88,1
99,4
126,9
156,1164,8
160,8
-
20,0
40,0
60,0
80,0
100,0
120,0
140,0
160,0
180,0
2011 2012 2013 2014 2015 LTM
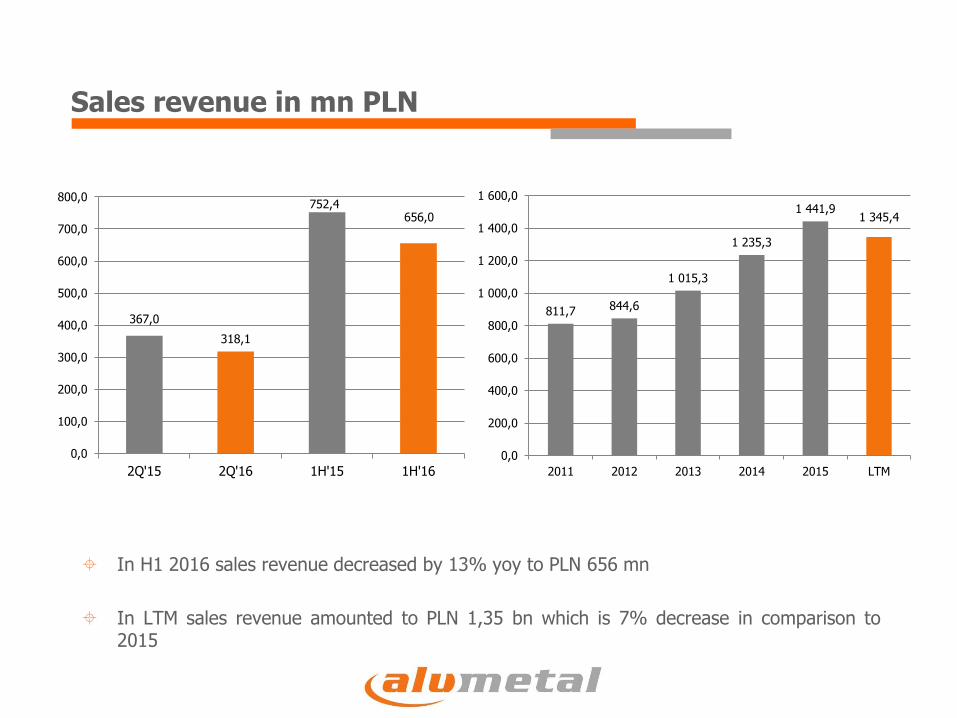
Sales revenue in mn PLN
In H1 2016 sales revenue decreased by 13% yoy to PLN 656 mn
In LTM sales revenue amounted to PLN 1,35 bn which is 7% decrease in comparison to2015
367,0
318,1
752,4656,0
0,0
100,0
200,0
300,0
400,0
500,0
600,0
700,0
800,0
2Q'15 2Q'16 1H'15 1H'16
811,7 844,6
1 015,3
1 235,3
1 441,91 345,4
0,0
200,0
400,0
600,0
800,0
1 000,0
1 200,0
1 400,0
1 600,0
2011 2012 2013 2014 2015 LTM
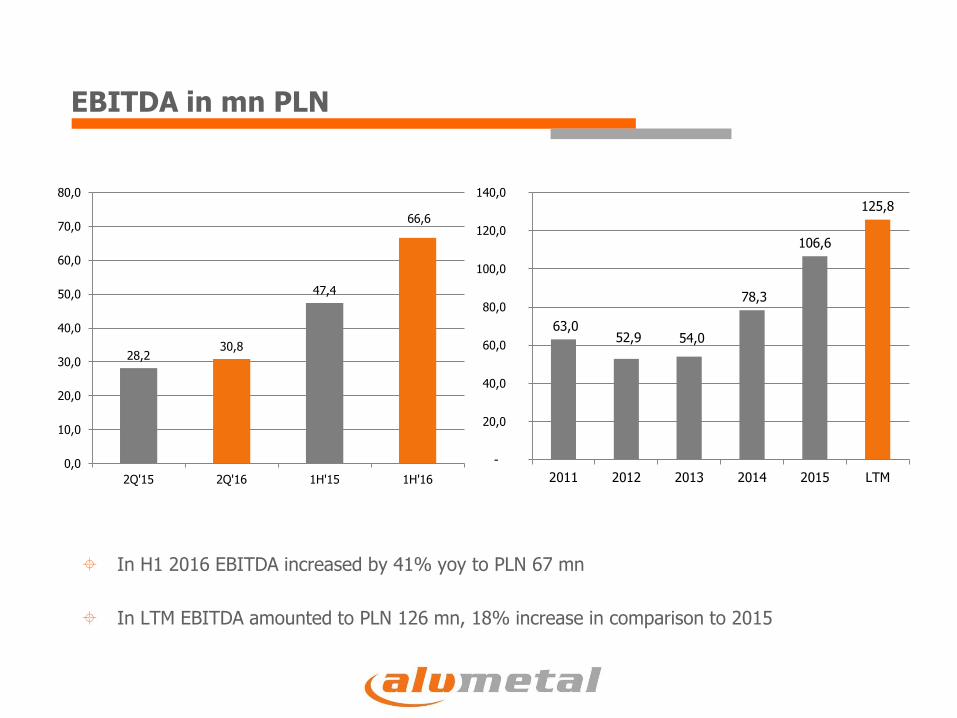
EBITDA in mn PLN
In H1 2016 EBITDA increased by 41% yoy to PLN 67 mn
In LTM EBITDA amounted to PLN 126 mn, 18% increase in comparison to 2015
28,230,8
47,4
66,6
0,0
10,0
20,0
30,0
40,0
50,0
60,0
70,0
80,0
2Q'15 2Q'16 1H'15 1H'16
63,0 52,9 54,0
78,3
106,6
125,8
-
20,0
40,0
60,0
80,0
100,0
120,0
140,0
2011 2012 2013 2014 2015 LTM
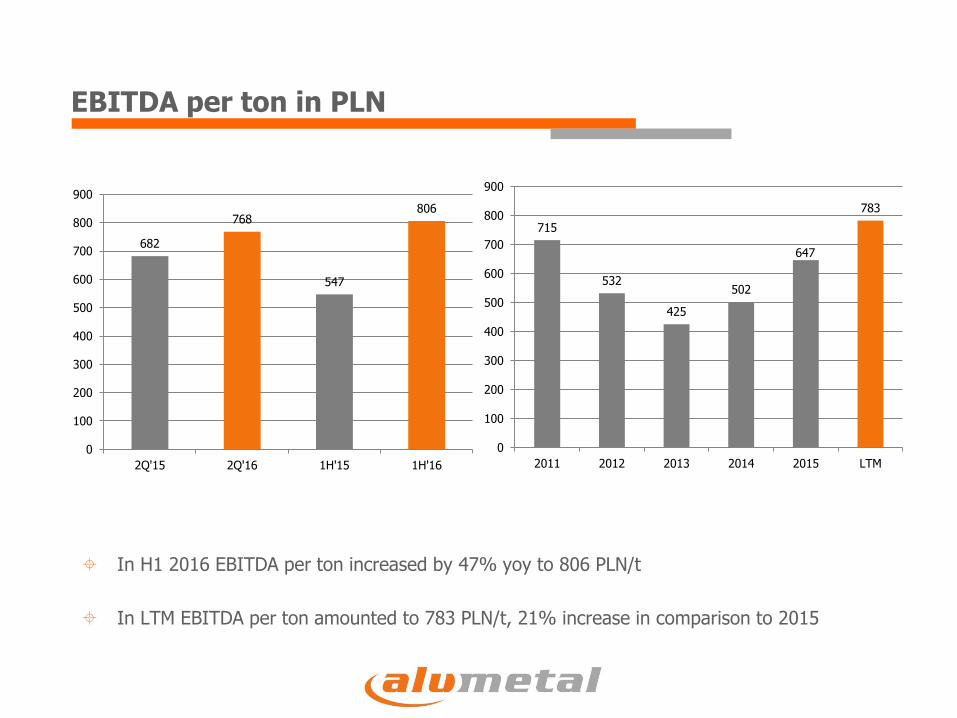
EBITDA per ton in PLN
In H1 2016 EBITDA per ton increased by 47% yoy to 806 PLN/t
In LTM EBITDA per ton amounted to 783 PLN/t, 21% increase in comparison to 2015
682
768
547
806
0
100
200
300
400
500
600
700
800
900
2Q'15 2Q'16 1H'15 1H'16
715
532
425
502
647
783
0
100
200
300
400
500
600
700
800
900
2011 2012 2013 2014 2015 LTM

Net profit in mn PLN
In H1 2016 net profit increased by 76% yoy to PLN 55 mn
In LTM net profit amounted to PLN 102 mn, 31% increase in comparison to 2015
21,6
26,631,4
55,3
0,0
10,0
20,0
30,0
40,0
50,0
60,0
2Q'15 2Q'16 1H'15 1H'16
43,9
34,5 35,8
58,9
77,7
101,5
-
20,0
40,0
60,0
80,0
100,0
120,0
2011 2012 2013 2014 2015 LTM

The impact of one-off events on financial results (thou. PLN)
1Q’15 2Q’15 3Q’15 4Q’15 2015 1Q’16 2Q’16 LTM
Valuation of management option scheme and annual bonus for achieving higher than budgeted results
-1 205 - 265 - 381 - 1 614 -3 465 -394 -130 -2 519
Impairment write-down of equipment - 867 -867 -867
Net impairment write-down of receivables from entities undergoing corporate recovery proceedings
-7 329 -7 329 366 -6 963
Impact on EBITDA -1 205 -265 -381 -9 810 -11 660 -394 236 -10 349
Income tax 774 774 -70 704
Impact on net profit -1 205 -265 -381 -9 037 -10 887 -394 167 -9 644
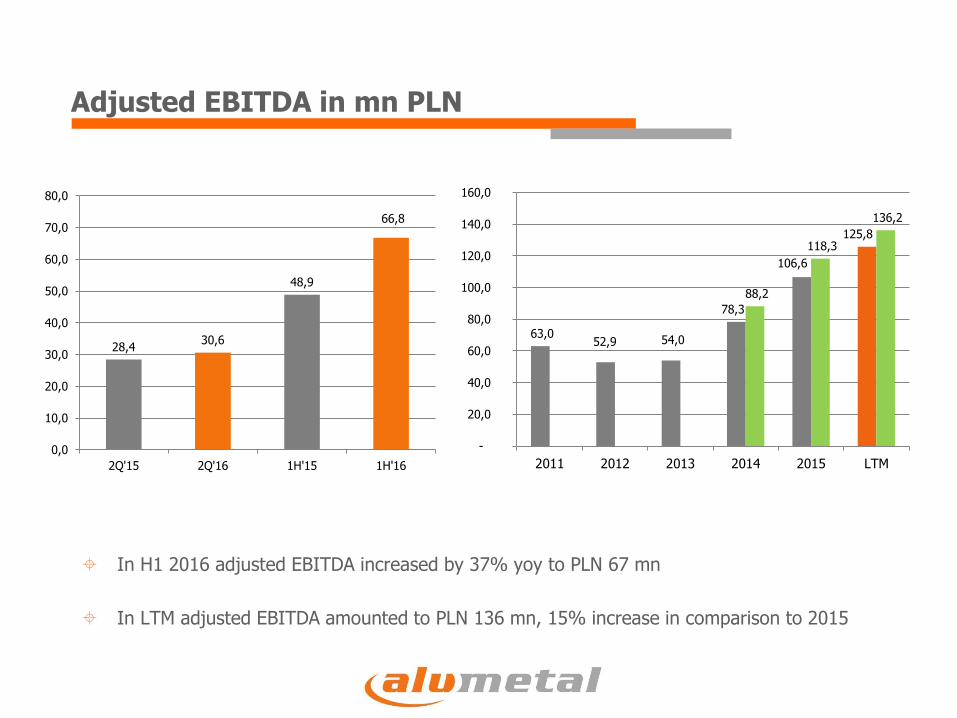
In H1 2016 adjusted EBITDA increased by 37% yoy to PLN 67 mn
In LTM adjusted EBITDA amounted to PLN 136 mn, 15% increase in comparison to 2015
Adjusted EBITDA in mn PLN
28,430,6
48,9
66,8
0,0
10,0
20,0
30,0
40,0
50,0
60,0
70,0
80,0
2Q'15 2Q'16 1H'15 1H'16
63,0 52,9 54,0
78,3
106,6
125,8
88,2
118,3
136,2
-
20,0
40,0
60,0
80,0
100,0
120,0
140,0
160,0
2011 2012 2013 2014 2015 LTM

In H1 2016 adjusted EBITDA per ton increased by 43% yoy to 808 PLN/t
In LTM adjusted EBITDA per ton amounted to 847 PLN/t, 18% increase in comparison to 2015
Adjusted EBITDA per ton in PLN
689
762
564
808
0
100
200
300
400
500
600
700
800
900
2Q'15 2Q'16 1H'15 1H'16
715
532
425
502
647
783
565
718
847
0
100
200
300
400
500
600
700
800
900
1 000
2011 2012 2013 2014 2015 LTM
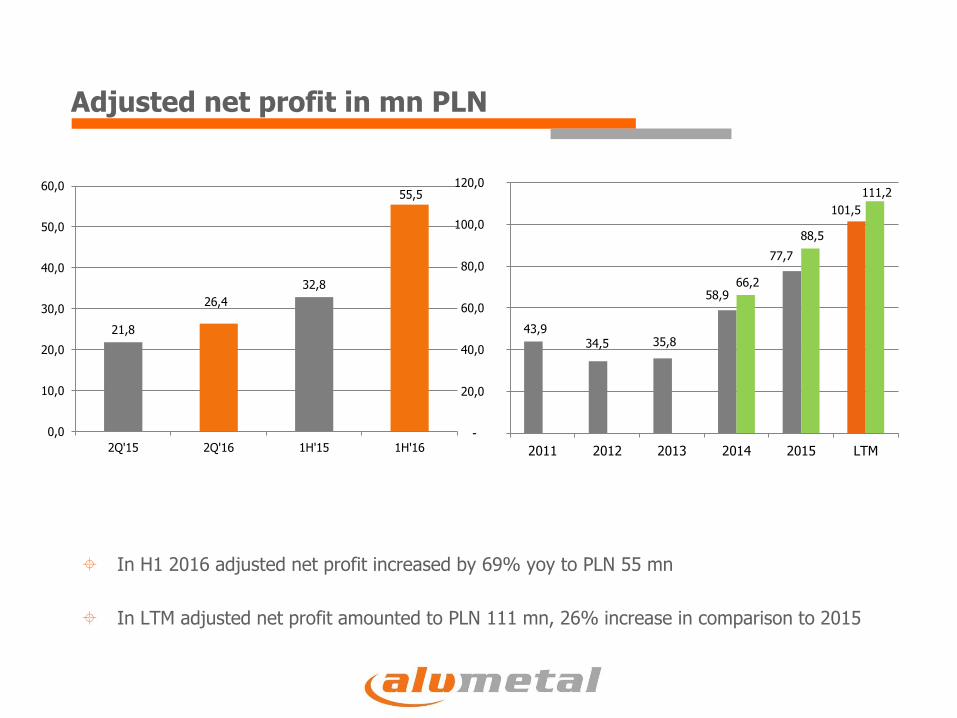
Adjusted net profit in mn PLN
In H1 2016 adjusted net profit increased by 69% yoy to PLN 55 mn
In LTM adjusted net profit amounted to PLN 111 mn, 26% increase in comparison to 2015
21,8
26,4
32,8
55,5
0,0
10,0
20,0
30,0
40,0
50,0
60,0
2Q'15 2Q'16 1H'15 1H'16
43,9 34,5 35,8
58,9
77,7
101,5
66,2
88,5
111,2
-
20,0
40,0
60,0
80,0
100,0
120,0
2011 2012 2013 2014 2015 LTM

Capex in mn PLN
In H1 2016 capex amounted to PLN 67 mn
PLN 3,8 mn maintenance capex
PLN 2,5 mn metal management
PLN 61,1 mn product mix/ production capacity increase (project in Hungary)
In LTM capex amounted to PLN 104 mn which is 121% higher than in 2015
* including cash credited to the account of the collateral manager (construction trustee service)
6,0
41,7
10,2
67,4*
0,0
10,0
20,0
30,0
40,0
50,0
60,0
70,0
80,0
2Q'15 2Q'16 1H'15 1H'16
64,2
38,6 33,5
10,8
47,3*
104,4
-
20,0
40,0
60,0
80,0
100,0
120,0
2011 2012 2013 2014 2015 LTM
*
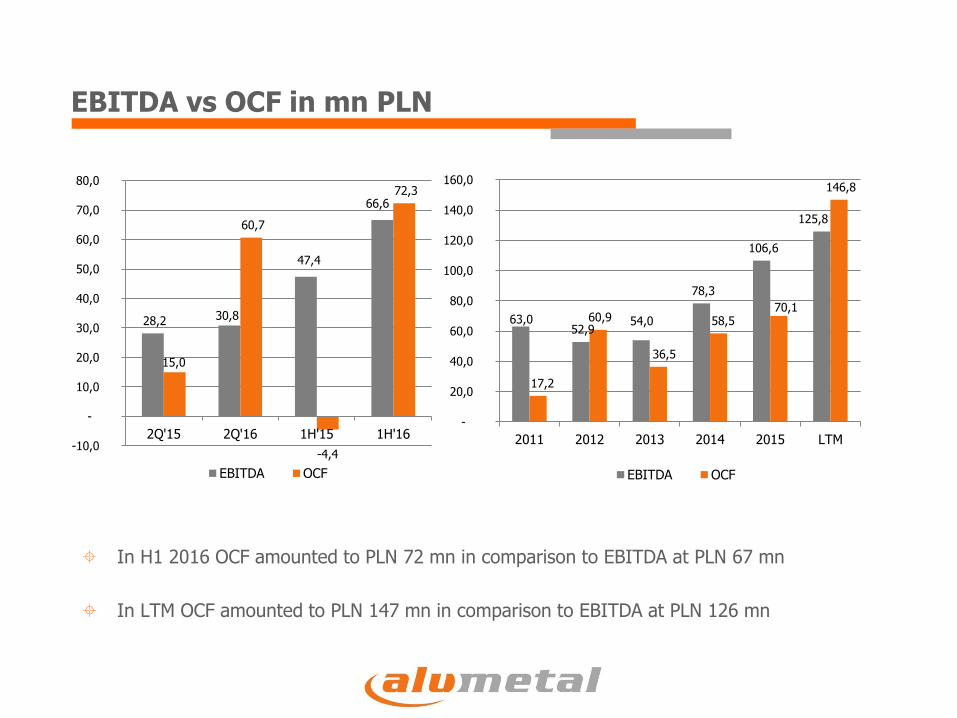
EBITDA vs OCF in mn PLN
In H1 2016 OCF amounted to PLN 72 mn in comparison to EBITDA at PLN 67 mn
In LTM OCF amounted to PLN 147 mn in comparison to EBITDA at PLN 126 mn
28,2 30,8
47,4
66,6
15,0
60,7
-4,4
72,3
-10,0
-
10,0
20,0
30,0
40,0
50,0
60,0
70,0
80,0
2Q'15 2Q'16 1H'15 1H'16
EBITDA OCF
63,0 52,9
54,0
78,3
106,6
125,8
17,2
60,9
36,5
58,5 70,1
146,8
-
20,0
40,0
60,0
80,0
100,0
120,0
140,0
160,0
2011 2012 2013 2014 2015 LTM
EBITDA OCF

Net debt and effective CIT rate
Net debt Effective CIT rate
At the end of H1 2016 net debt amounted to PLN 79 mn and Net debt/EBITDA ratioincreased from 0,4 at the end of 2015 to 0,6 at the end of June 2016
Effective CIT rate in H1 2016 amounted to 3,3%
112,1
72,1 70,2
45,4 46,7
79,1
1,8
1,41,3
0,6
0,4
0,6
0,0
0,2
0,4
0,6
0,8
1,0
1,2
1,4
1,6
1,8
2,0
0,0
20,0
40,0
60,0
80,0
100,0
120,0
2011 2012 2013 2014 2015 1H2016
12,3%
7,8%
1,7%
1,1%
3,2% 3,3%
0,0%
2,0%
4,0%
6,0%
8,0%
10,0%
12,0%
14,0%
2011 2012 2013 2014 2015 1H'16

Current status of Hungarian project
18th April 2016 first application for reimbursement of part of the capex was filed to HIPA,accepted on 4th August, payment expected in September
8th July 2016 second application for reimbursement of part of the capex was filed to HIPA
18th July 2016 beginning of purchase and preparation of scrap
5th August 2016 plant usage permit obtained
Completion of costruction works, the current progress of assembly works at 85%
Launching first production line after obtaining neccessary permits
The process of recruitment and training of employees is in progress
The project is on time, capex 2-4% above the budget
Development of infrastructure, purchase and installation of equipment technology – at leastdoubling the production capacity (currently 7 thous. tons)
Launching new production technology of master alloys
The extension of the product portfolio
Strengthen the Alumetal Group's position on the European market, expansion into newmarkets
Capex at max PLN 58,5 mn, financing from own resources, CIT allowance
Capex payment in 2016-2018 (mostly in 2017)
Commencement of production in 2Q 2018
Expansion of Master Alloys

Summary
In H1 2016 very good financial results, despite lower sales volume and highpressure on margins on some alloys kinds – financial results in line with theManagement Board expectations
Continuous favorable market environment in regards to demand for secondaryaluminium alloys – high growth of motor vehicle sale in UE
Management believes in achievement of the financial targets required to excercisethe third tranche of the managerial option scheme (increase of EBITDA and netprofit per share in 2016 by at least 10%) – H1 2016 financial result is a very goodbase to realize goals
Realization of dividend policy (50% of net profit) – dividend payment on 7th June2016
The Hungarian project is on time with small capex overrun