alternative risk transfer transactions
TRANSCRIPT

ECONOMIC & SOCIAL SCIENCES
DEPARTMENT OF INTERNATIONAL AND EUROPEAN STUDIES
MASTER'S PROGRAM IN EUROPEAN STUDIES ON INTERNATIONAL SERVICES AND TRANSACTIONS
Dissertation
ALTERNATIVE RISK TRANSFER TRANSACTIONS
Paspati Maria
mes16007
Supervisor
Dr. Kiohos Apostolos, assistant professor
Submitted as requirement for the postgraduate degree in European Studies on International
Services and Transactions.
Thessaloniki, March 2019

Paspati Maria ALTERNATIVE RISK TRANSFER TRANSACTIONS
ECONOMIC & SOCIAL SCIENCES
DEPARTMENT OF INTERNATIONAL AND EUROPEAN STUDIES
MASTER'S PROGRAM IN EUROPEAN STUDIES ON INTERNATIONAL SERVICES AND TRANSACTIONS
Dissertation
ALTERNATIVE RISK TRANSFER TRANSACTIONS
Paspati Maria
mes16007
Two-member committee
Dr. Kiohos Apostolos Dergiades Theologos
Assistant Professor, University of Macedonia
Lecturer, University of Macedonia
Thessaloniki, March 2019
ii

Paspati Maria ALTERNATIVE RISK TRANSFER TRANSACTIONS
ECONOMIC & SOCIAL SCIENCES
DEPARTMENT OF INTERNATIONAL AND EUROPEAN STUDIES
MASTER'S PROGRAM IN EUROPEAN STUDIES ON INTERNATIONAL SERVICES AND TRANSACTIONS
Copyright © - All rights reserved Maria Paspati
All rights reserved
Content of this dissertation may not be reproduced, downloaded, disseminated, published, or
transferred in any form or by any means, for commercial purposes. Reproduction, downloading
and dissemination for non-commercial, educational or research purposes is allowed, provided the
source is indicated and ths message is retained. Questions concerning the use of this dissertation
for commercial purposes should be addressed to the writer.
(Signature)
Paspati Maria
© 2019 – All rights reserved
iii

Paspati Maria ALTERNATIVE RISK TRANSFER TRANSACTIONS
Disclaimer I hereby declare that all the data in this dissertation have been obtained, edited, and presented in
accordance with the rules and principles of academic ethics, as well as the laws conditioning
research and intellectual property. I also declare responsibly that, as required by these rules, I have
fully cited and referenced the sources of all the data that I used and do not constitute my original
creation.
(Signature)
Paspati Maria
iv

Paspati Maria ALTERNATIVE RISK TRANSFER TRANSACTIONS
Acknowledgements I would first like to thank my supervisor, Dr. Kiohos Apostolos, Assistant Professor in the
Department of International and European Studies, for guiding and supporting me through the
process of writing this dissertation.
I would like to offer my special thanks to Dr. Koutsoupias Nikolaos, Associate Professor in
the Department of International and European Studies, for his invaluable assistance with RStudio
Project for Statistical Computing. Without his contribution it would be difficult to complete the 4th
chapter of the dissertation.
I am also deeply grateful to the academic staff of the master's program for making it
possible to study there, by providing me with full scholarship.
Finally, I wish to thank Mr. Sevastas Stefanos for contributing to this dissertation with data
processing in arcGIS and the essential information about earthquakes.
v

Paspati Maria ALTERNATIVE RISK TRANSFER TRANSACTIONS
“To the rational mind, nothing is inexplicable; only unexplained”
Fourth Doctor, Doctor Who Series, BBC.
vi

Paspati Maria ALTERNATIVE RISK TRANSFER TRANSACTIONS
Abstract The constantly increasing growth of insured losses due to nature related catastrophic
events (i.e. sudden events that cause significant losses to an individual or a group of people) has
pressured the reinsurance industry to consider and develop alternative risk transfer products and
transactions. These products are designed to alleviate the risk, in whole or partly, by putting into
effect securitisation mechanisms in order to access adequate liquidity funds. Among them,
Catastrophe (CAT) risk bonds are designed to transfer the financial consequences of natural
catastrophic events (e.g. floods, hurricanes, earthquakes etc.) from the issuers to investors. CAT
bonds quickly became popular, as they have been shown to successfully cover the insurers'
liabilities, while, on the same time, they protect traditional reinsurance providers and
governmental budgets.
Key words: alternative risk transfer, natural catastrophe, natural hazard, insurance - reinsurance,
liquidity, Catastrophe bonds.
vii

Paspati Maria ALTERNATIVE RISK TRANSFER TRANSACTIONS
Περίληψη Η συνεχής αύξηση των ασφαλισμένων ζημιών, οφειλόμενων σε καταστροφικά γεγονότα
που συνδέονται με τη φύση (αιφνίδια γεγονότα που προκαλούν σημαντικές απώλειες είτε σε
μεμονωμένα άτομα είτε σε ομάδα ατόμων), δημιούργησε μια πιεστική αναγκαιότητα για την
αναζήτηση και ανάπτυξη εναλλακτικών προϊόντων και συναλλαγών μεταφοράς κινδύνου. Ο
κλάδος της αντασφάλισης ανταποκρίθηκε με τη δημιουργία προϊόντων που είτε μετριάζουν είτε
απαλείφουν τους κινδύνους, μέσω της εφαρμογής μηχανισμών τιτλοποίησης για την απόκτηση
πρόσβασης σε επαρκή κεφάλαια. Μεταξύ των εργαλείων αυτών συγκαταλέγονται και τα ομόλογα
καταστροφής (Catastrophe -CAT- bonds), τα οποία έχουν σχεδιαστεί για τη μεταφορά των
χρηματοοικονομικών συνεπειών των φυσικών καταστροφών (π.χ. πλημμύρες, τυφώνες, σεισμοί,
κ.λπ.) από τους ασφαλιστές στους επενδυτές. Τα CAT bonds καθίστανται όλο και πιο δημοφιλή,
καθώς αποδεικνύεται ότι καλύπτουν επιτυχώς τις υποχρεώσεις των ασφαλιστών,
προστατεύοντας, ταυτόχρονα, τους παραδοσιακούς προμηθευτές αντασφαλίσεων και τους
κρατικούς προϋπολογισμούς.
Λέξεις κλειδιά: alternative risk transfer, φυσική καταστροφή, φυσικός κίνδυνος, ασφάλιση -
αντασφάλιση, ρευστότητα, ομόλογα καταστροφής (Catastrophe bonds).
viii

Paspati Maria ALTERNATIVE RISK TRANSFER TRANSACTIONS
Contents Disclaimer .......................................................................................................................................................... iv
Acknowledgements ............................................................................................................................................ v
Abstract ............................................................................................................................................................ vii
Περίληψη ......................................................................................................................................................... viii
Contents ............................................................................................................................................................ ix
List of Figures ..................................................................................................................................................... xi
List of Tables ..................................................................................................................................................... xii
1. Introduction ................................................................................................................................................. 13
2. Alternative Risk Transfer-ART ...................................................................................................................... 14
2.1 Risk transfer through conventional reinsurance ....................................................................................... 15
2.1.1 How reinsurance works ...................................................................................................................... 15
2.1.2 Moral hazard ...................................................................................................................................... 16
2.1.3 Typical Reinsurance Arrangements .................................................................................................... 17
2.2 What is Alternative Risk Transfer (ART) .................................................................................................... 19
2.2.1 Scope and coverage ............................................................................................................................ 19
2.2.2 Participants ......................................................................................................................................... 21
2.3 ART carriers and products ......................................................................................................................... 22
2.3.1 Risk Pools and Insurers ....................................................................................................................... 22
2.3.2 Hybrid Reinsurance-Financial Products .............................................................................................. 26
2.3.3 Financial Instruments ......................................................................................................................... 30
2.4 Summary and evaluation of ART ............................................................................................................... 37
2.5 Insurance and capital market convergence .............................................................................................. 41
3. Regulatory framework ................................................................................................................................. 43
3.1 Solvency regulation in the United States of America ................................................................................ 43
3.2 Solvency regulation in the European Union .............................................................................................. 44
3.2.1 Solvency I ............................................................................................................................................ 45
3.2.2 The transition ..................................................................................................................................... 46
3.2.3 Solvency II ........................................................................................................................................... 46
4. Exploring the probability of a flood Catastrophe bond issuance in Romania ............................................. 50
4.1 Seismicity of Romania................................................................................................................................ 51
4.2 Modelling the Catastrophe Bond .............................................................................................................. 54
4.2.1 Pricing Catastrophe Bonds ................................................................................................................. 54
4.2.2 Methodology ...................................................................................................................................... 54
4.3 One period (basic) Model .......................................................................................................................... 55 ix

Paspati Maria ALTERNATIVE RISK TRANSFER TRANSACTIONS
4.3.1 Generalized Extreme Value (GEV) Distribution for defining extremes in Earthquake Magnitude .... 57
4.3.2 Data pre-processing ............................................................................................................................ 58
4.3.3 Using R to estimate the GEV parameters ........................................................................................... 60
4.3.4 Calculating the probability measure corresponding to the GEV distribution for Magnitude ............ 63
4.3.5 Numerical example for the one-period model ................................................................................... 64
5. Conclusions .................................................................................................................................................. 65
Bibliography - References ................................................................................................................................ 67
Appendix A ...................................................................................................................................................... 73
Earthquake glossary ........................................................................................................................................ 74
Appendix B ....................................................................................................................................................... 75
Seismicity of Romania ..................................................................................................................................... 76
Intermediate - depth seismic zone .............................................................................................................. 76
Normal - depth seismic zones ..................................................................................................................... 76
Appendix C ....................................................................................................................................................... 82
Part 1 – R code for producing h=50,000 simulations in RStudio Version 1.1.463 – © 2009-2018 RStudio, Inc. ......................................................................................................................................................................... 83
Part 2 – Data processing in RStudio Version 1.1.463 – © 2009-2018 RStudio, Inc. ........................................ 84
Appendix D ...................................................................................................................................................... 86
Using EasyFit 5.6 (trial version) to obtain earthquake probabilities ............................................................... 87
x

Paspati Maria ALTERNATIVE RISK TRANSFER TRANSACTIONS
List of Figures Figure 1: The Conventional Insurance Market ................................................................................................ 16
Figure 2: Excess-of-loss reinsurance contract ................................................................................................. 18
Figure 3: The ART market ................................................................................................................................ 19
Figure 4: The three segments of ART market .................................................................................................. 21
Figure 5: ART instruments ............................................................................................................................... 22
Figure 6: Single parent captive ........................................................................................................................ 23
Figure 7: Total Captives Worldwide by Year with Corresponding World Events ............................................ 23
Figure 8: Parent Company Regions ................................................................................................................. 25
Figure 9: Least profitable countries for all captive business (Expressed as a percentage of all reinsured
premiums per country) .................................................................................................................................... 25
Figure 10: A model of Multi-line/Multi-year Product (MMP) compared to the model of a standard insurance
contract ........................................................................................................................................................... 27
Figure 11: A model of Multi-trigger Product (MTP) with a dual trigger structure .......................................... 28
Figure 12: Simplified sidecar structure ............................................................................................................ 29
Figure 13: Structure of a typical sidecar .......................................................................................................... 29
Figure 14: Financial swap transaction flow ..................................................................................................... 32
Figure 15: Portfolio cat swap transaction flow ............................................................................................... 32
Figure 16: Typical Catastrophe Bond structure ............................................................................................... 34
Figure 17: Catastrophe bonds and ILS issuance by trigger and by year .......................................................... 35
Figure 18: Catastrophe bonds & ILS issued and outstanding by year, million dollars .................................... 36
Figure 19: Spectrum of risk transfer instruments ........................................................................................... 38
Figure 20: Solvency II Timeline ........................................................................................................................ 48
Figure 21: Solvency II Preparatory Phase ........................................................................................................ 49
Figure 22: Geographical distribution of the seismogenic zones and crustal seismicity .................................. 53
Figure 23: The diagram for the one period model .......................................................................................... 55
Figure 24: Times series scatter plot of the Annual Maximum Magnitude of Earthquakes in Romania .......... 59
Figure 25: Histogram of the Annual Maximum Magnitude of Earthquakes in Romania ................................ 59
Figure 26: Profile log-likelihood of ξ for the Annual Maximum Magnitude of Earthquakes in Romania ....... 60
Figure 27: Diagnostic plots for GEV fit to the Annual Maximum Magnitude of Earthquakes in Romania ..... 61
Figure 28: Sample mean excess for Annual Maximum Magnitude of Earthquakes in Romania M1(t), with
95% confidence interval .................................................................................................................................. 62
Figure 29: Sample Mean Excess Plot for Annual Maximum Magnitude of Earthquakes in Romania ............. 62
xi

Paspati Maria ALTERNATIVE RISK TRANSFER TRANSACTIONS
List of Tables Table 1: Captive Utilisation by Parent Company Industry, 2016 ..................................................................... 24
Table 2: RRGs premiums by business area 2014-2015, in million dollars ....................................................... 26
Table 3: Overview of Indemnity vs. Parametric Protection ............................................................................ 35
Table 4: Summary and evaluation of ART instruments ................................................................................... 39
Table 4 (continued) ......................................................................................................................................... 40
Table 5: Solvency I versus Solvency II at a glance............................................................................................ 48
Table 6: Characteristics of the Lion II Re DAC cat bond .................................................................................. 50
Table 7: Annual Maximum Magnitude of Earthquakes in Romania ................................................................ 58
Table 8: Probabilities of an earthquake of magnitude M occurring within intervals set by expression 4.3.1 63
xii

Paspati Maria ALTERNATIVE RISK TRANSFER TRANSACTIONS
1. Introduction The lack of an exact definition for Alternative Risk Transfer is a result of the wide range
of products and carriers that can be defined as Alternative Risk Transfer. Furthermore, the
innovation of these products continues to expand throughout the years contributing to a
variety of literature approaches and descriptions of the ART market.
A concise overview of the ART market will be attempted in Section 2 of this dissertation,
based on the typology provided by Banks, E. (2008) and Cummins, J. D., & Weiss, M. A. (2009).
As ART was developed with the objective to resolve the capacity and coverage issues of the
conventional (re)insurance market, a brief reference in the latter will precede. This will
facilitate a better understanding of the ART transactions, namely the attempt to transfer risk
exposure from one market to another and seek for alternative financing solutions. The
convergence of financial and insurance markets ensues from these transactions.
Section 3 will provide the legal framework of the insurance market in the European
Union, as set by the Directives commonly known as Solvency I and II. Given that the laws that
regulate both (re)insurance and ART markets in the United States of America are instituted in
state level, it is difficult to present the legislation of all 50 States within the limited extent of the
present dissertation.
An earthquake is a natural disaster that causes damage worldwide. The consequences
affect both economic and social life, and may result in many casualties, regardless of the
magnitude, when an earthquake strikes unprepared regions. Unlike other natural disasters, it is
difficult to estimate the exact time of an earthquake; scientists can only predict the timeline
and magnitude based on the history of earthquakes in a region. Europe has a long history of
destructive earthquakes. Italy, the Balkans, Greece, Bulgaria, Romania and Turkey are among
the most exposed regions of the continent.
Within the above-mentioned context the probability of an earthquake Catastrophe
Bond issuance in Romania will be explored in Section 4, as earthquakes pose serious risks for
life, properties and infrastructure for Romania. The model is presented and used to point out
the main financial characteristics of such securities. The dissertation closes with some
concluding remarks.
13

Paspati Maria ALTERNATIVE RISK TRANSFER TRANSACTIONS
2. Alternative Risk Transfer-ART Alternative Risk Transfer (ART) is a concept that cannot be defined precisely, yet. This
results from the wide range of products and carriers that can be characterised as Alternative
Risk Transfer and their continuous innovation and expansion through the years. Additionally,
ART is not just a product, rather than a way of doing business, or a line of transactions. Two
segments are generally accepted as components of the ART market: risk transfer through
alternative carriers and risk transfer through alternative products. The first segment
(alternative carriers or riskbearers) consists of self-insurance, captives, risk retention groups,
and pools, while the second (alternative risk products) includes finite risk reinsurance, runoff
solutions, committed capital, multiline, multiyear products, multi-trigger programs, structured
finance and new asset solutions, and capital market solutions for weather risk.
Despite the lack of an exact definition, almost all alternative risk transfer products have
at least one of the following attributes, as noted by Hartwig and Wilkinson (2007):
• custom-tailored to the unique needs of the client;
• coverage provided on a multiyear basis;
• coverage applicable to multiple lines; or
• payoff can be triggered by multiple factors, rather than a single event.
The complexity of most alternative risk "solutions" requires a combination of skills, both
of insurance and financial professionals. When structuring, for example, a unique catastrophe
risk the expertise of catastrophe modellers, capital-market experts, accountants, tax and legal
experts is needed. Captives, on the other hand, are easier and quicker to form, with the
solicitation of an experienced captive manager.
One characteristic of alternative risk solutions, as coverage against large scale
exposures, is their dependence on non-traditional sources of capital. In other words, while in
traditional insurance the risk is transferred from the policyholder to the insurer (or insurer to
reinsurer), ART often seeks to cede risk into the capital market, instead of solely depending on
capital arising from the insurer's payment claims. It is widely accepted that the risk absorbance
capacity of global capital markets is far greater than that of the insurance and reinsurance ones;
hence ART poses as an attractive solution for large, one of a kind problems. (Hartwig &
Wilkinson, 2007:925-926)
14

Paspati Maria ALTERNATIVE RISK TRANSFER TRANSACTIONS
2.1 Risk transfer through conventional reinsurance Traditionally, the main method of risk transfer for insurers was the purchase of
reinsurance. As most of the hybrid and financial risk-transfer products that have been
developed in the past few years aim to handle "mega" risks (for example the ones resulting
from natural disasters), this section will focus on the use of reinsurance as coverage for such
risks.
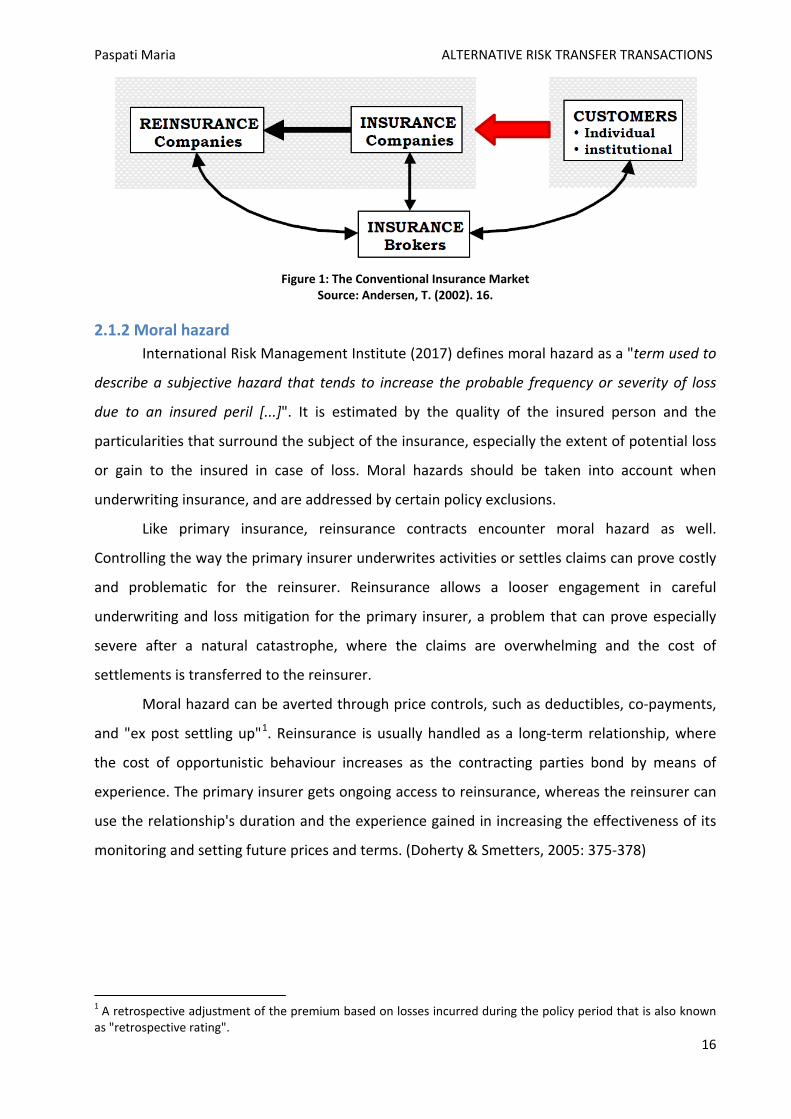
2.1.1 How reinsurance works In essence, reinsurance provides the mechanisms to share and diversify risk. It enables
primary insurers to reduce their risk exposure and capital requirements. Insurers transfer risks
like natural catastrophe risk (for nonlife insurers), longevity, epidemics, terrorism or financial
risk (for life insurers) etc. to the reinsurance market, as a means to making their balance sheets
and risk trails less volatile. Additionally, the presence of a reinsurance market enables a better
use of capital, which allows reinsurers to accept more contracts or undertake larger risks with
the same amount of capital.
As a risk-sharing mechanism, reinsurance offers diversification for extreme risks across
regions and across market participants. Catastrophes can cause simultaneous and dependent
losses, or be independent, and thus insurable, when taking place in different parts of the world.
In this context, reinsurance acts as protection against extraordinary and unforeseen losses.
Considering that a reinsurer is, in general, more widely diversified than an insurer, the latter
needs to hold more capital when covering the same risk. This represents an economic gain
produced by the reinsurance market. There is also evidence that reinsurance can be used to
reduce taxes or to avoid bankruptcy costs, but this exceeds the scope of the present
dissertation.
One can conclude that different levels of the primary insurer's capitalization, risk
exposure, as well as regulative restrictions and permissions provide various motives when it
comes to purchasing reinsurance. To sum up, insurers buy reinsurance when they cannot or do
not wish to retain a risk and they can do this through any of the several ways the market
provides them. One of the most traditional methods is writing a reinsurance policy on the
effective losses incurred by the insurer during a given period. The main issue with this form of
reinsurance is moral hazard. (Bernard, 2013: 604-606)
15
Paspati Maria ALTERNATIVE RISK TRANSFER TRANSACTIONS
Figure 1: The Conventional Insurance Market
Source: Andersen, T. (2002). 16.
2.1.2 Moral hazard International Risk Management Institute (2017) defines moral hazard as a "term used to
describe a subjective hazard that tends to increase the probable frequency or severity of loss
due to an insured peril [...]". It is estimated by the quality of the insured person and the
particularities that surround the subject of the insurance, especially the extent of potential loss
or gain to the insured in case of loss. Moral hazards should be taken into account when
underwriting insurance, and are addressed by certain policy exclusions.
Like primary insurance, reinsurance contracts encounter moral hazard as well.
Controlling the way the primary insurer underwrites activities or settles claims can prove costly
and problematic for the reinsurer. Reinsurance allows a looser engagement in careful
underwriting and loss mitigation for the primary insurer, a problem that can prove especially
severe after a natural catastrophe, where the claims are overwhelming and the cost of
settlements is transferred to the reinsurer.
Moral hazard can be averted through price controls, such as deductibles, co-payments,
and "ex post settling up"1. Reinsurance is usually handled as a long-term relationship, where
the cost of opportunistic behaviour increases as the contracting parties bond by means of
experience. The primary insurer gets ongoing access to reinsurance, whereas the reinsurer can
use the relationship's duration and the experience gained in increasing the effectiveness of its
monitoring and setting future prices and terms. (Doherty & Smetters, 2005: 375-378)
1 A retrospective adjustment of the premium based on losses incurred during the policy period that is also known as "retrospective rating".
16

Paspati Maria ALTERNATIVE RISK TRANSFER TRANSACTIONS
2.1.3 Typical Reinsurance Arrangements Ultimately, a reinsurance contract is an insurance contract bought by an insurance
company from a reinsurer or from the financial market. The most commonly used structure of a
reinsurance contract is non-proportional or excess of loss (XOL) reinsurance. It is used to
transfer "mega" risks. Its payoffs have the same mathematical structure as on a call option
spread2 and are given by the following function (Cummins & Weiss, 2009:501-502):
LR = a * {𝑀𝑀𝑀𝑀𝑀𝑀 [𝐿𝐿𝑇𝑇 − 𝑀𝑀, 0] −𝑀𝑀𝑀𝑀𝑀𝑀[𝐿𝐿𝑇𝑇 − (𝑀𝑀 + 𝑅𝑅), 0]}
where
• LR = the loss paid by the reinsurer,
• LT = the total loss,
• M = the retention (lower strike price3),
• R = the reinsurer's maximum payment under the contract), and
• a = the proportion of loss paid by the reinsurer (0 < a ≤ 1).
A loss-sharing proportion less than 1 (e.g., a = 0.9) is usually present to control moral
hazard. Thereby, the ceding insurer (the one that transfers the risk) is more careful when
settling underwriting and claims. Loss payoff triggers under non-proportional contracts can be
defined in various ways, for example, per risk, per event, or per calendar period ("stop loss").
Catastrophe XOL contracts are usually per event.
Other important parameters in understanding the role of hybrid and financial market
contracts are time period and the perils covered by the contract. Conventional reinsurance
contracts are generally negotiated and priced on annual basis and are single-peril contracts.
Some of the disadvantages of these contracts, like pricing exposure to the underwriting cycle4,
2 The same payoff structure is also used for most Cat bonds and options. 3 The strike price is defined as the price at which the holder of an option can buy (in the case of a call option) or sell (in the case of a put option) the underlying security when the option is exercised. Hence, strike price is also known as exercise price.
See further: The Options Guide. (2017). Strike Price. Retrieved from http://www.theoptionsguide.com/strike-price.aspx, accessed on 01/04/2017. 4 Reinsurance markets pass through recurrent intervals of soft markets, when prices are relatively low and coverage is imminently available, and hard markets, when prices are high and coverage is stringent.
A soft insurance market is characterised by 1) lower insurance premiums; 2) broader coverage; 3) reduced underwriting criteria (easier underwriting); 4) increased capacity (insurance carriers write more policies and higher limits); and 5) increased competition among insurance carriers.
On the other hand, while in a hard market cycle 1) insurance premiums are higher; 2) underwriting criteria become more stringent (underwriting is more difficult); 3) market capacity is reduced (insurance carriers write less insurance policies); 4) competition among insurance carriers is restrained.
17

Paspati Maria ALTERNATIVE RISK TRANSFER TRANSACTIONS
lead to innovations both in insurance and capital market. In addition, such inefficiencies
constitute main drivers in the development of the ART market. (Cummins & Weiss, 2009:501-
505)
How excess of loss reinsurance works According to Kunreuther, Kleindorfer, and Grossi (2005), a typical excess-of-loss
reinsurance contract requires the primary insurer to retain a specified level of risk with the
reinsurer covering all losses between an attachment point, LA, and exhaustion point, LE, on the
exceedance probability (EP) curve. For the purposes of their analysis, they assume that the
exhaustion point, LE, corresponds to the worst-case loss (WCL), and is defined by the target ruin
probability (TRP) of 1%. The layer of reinsurance, LE-LA, is denoted as Δ. Schematically, this can
be presented with the following diagram:
Figure 2: Excess-of-loss reinsurance contract Source: Kunreuther, H., Kleindorfer, P., Grossi, P. (2005). 193.
Excess-of-loss reinsurance contracts have the following features: the reinsurer pays all
losses in the interval LA to LE with a maximum payment to the insurer of Δ. The insurer pays the
reinsurer a premium, which reflects the expected loss and poses as reimbursement for this
protection, and a loading factor5, λR If E(Δ) = the expected losses for Δ units of reinsurance, and
λR is the loading factor, then the premium equals E(Δ) (1+ λR6).
See further: Craig, Ε. (2013). Hard Market vs. Soft Market: The Insurance Industry’s Cycle and Why We’re Currently in a Hard Market. PSA Financial Services Inc. Retrieved from https://goo.gl/eDEUK5, accessed on 01/04/2017. 5 The loading factor is the fraction of premiums used to cover administrative costs and profits. It plays a crucial role in determining whether a market for a particular type of insurance will exist.
18

Paspati Maria ALTERNATIVE RISK TRANSFER TRANSACTIONS
2.2 What is Alternative Risk Transfer (ART) Alternative Risk Transfer (ART) basically uses alternative techniques toward achieving
the same hedging and transfer of risk away from a risk bearing entity, like traditional insurance
or reinsurance. ART enables companies to transfer risks to another party, or to capital markets'
investors, and thus receive protection against certain risks the transactions aim to cover.
It grew popular during the 1990's, when insurance capacity issues drove insurers and
reinsurers to seek new mechanisms (e.g. captives, risk retention groups, pools, etc.) to pass on
their risks to a third party. Nowadays, alternative solutions emphasise on financing rather than
transferring risks (e.g. finite solutions, committed capital, etc.), seeking multiline and multiyear
coverage. Thereby, the term Alternative Risk Transfer is considered a misnomer and the more
neutral term "non-traditional (re)insurance" or "structured (re)insurance" is sometimes used.
Other authors refer to Alternative Risk Financing (ARF), though it is not solely restricted to the
transfer of risks to the capital market but also comprises solutions to fund risk retention (e.g.
via captives, contingent capital or financial reinsurance). (Frenz, 2012:5)
Figure 3: The ART market
Source: Frenz, Τ. (2012). 5.
2.2.1 Scope and coverage ART market has a broad base so its scope and coverage vary significantly among
practitioners, end users, and regulators. As indicated above, ART market offers combined risk
management for innovative insurance and capital market solutions, while ART itself can be a
product, channel, or solution for transferring risk exposures between the insurance and capital
One element of the loading factor is the insurer's required return on invested capital; the other is the administrative expense of the insurance company (the administrative component) and is affected by moral hazard. See further: Goodwin, B. K., Smith, V. H. (1995). The Economics of Crop Insurance and Disaster Aid. American Enterprise Institute, 77-83. 6 For practical reasons the reinsurance loading factor λR is held constant in this particular example. In reality it varies, following the variations of the attachment points of the reinsurance contract.
19

Paspati Maria ALTERNATIVE RISK TRANSFER TRANSACTIONS
markets. An optimal ART-based risk management plan often requires the combination of
various multiple products, vehicles, and solutions. Banks (2008) uses these three categories to
define ART market's scope, as they allow greater and more efficient dissemination of risk
exposures throughout the financial system (Figure 4). The three segments are:
1) Product Any instrument or structures used in achieving a defined risk management goal:
• Select insurance/reinsurance products, including finite risk policies. These minimal risk
transfer insurance contracts are used to finance, rather than transfer, risk exposures.
• Multirisk products: insurance policies that combine multiple risks in a single structure,
providing the client with a concentrated-integrated, and often cheaper and more
efficient solution.
• Insurance-Linked Securities (ILS): capital markets issues referencing insurance risks, such
as catastrophe, weather, and mortality, which are designed to transfer risk exposures
and create additional risk capacity.
• Contingent capital structures: ex ante contractually agreed financing facilities that
provide debt or equity financing for a corporation, in the wake of a loss event.
• Insurance derivatives: over-the-counter or listed derivatives that reference insurable
risks, such as catastrophe or weather.
2) Vehicle Any channel that is used to achieve risk management goals, like:
• Captives (risk retention groups): risk channels that are used to facilitate
insurance/reinsurance the company itself, risk financing or risk transfer strategies (their
usual form is that of a licensed insurance/reinsurance company that is controlled by one
or more owners, often the sponsoring company).
• Special-purpose vehicles/reinsurers: subsidiaries that are used to issue insurance-linked
securities and write offsetting reinsurance contracts.
• Bermuda transformers: insurance companies registered in the Bermudas, authorised to
write and purchase insurance/reinsurance, and often used by banks to convert
derivative instruments into insurance/reinsurance contracts.
• Capital markets subsidiaries: entities owned by insurance companies and are actively
involved in the field of insurance derivatives and derivative products.
20

Paspati Maria ALTERNATIVE RISK TRANSFER TRANSACTIONS
3) Solution Any broad program that uses multiple products or vehicles to manage risk exposures on
a consolidated basis. This category includes:
• Enterprise risk management programs: comprehensive risk management programs that
combine diverse risks, time horizons, and instruments into a single, multi-year "plan of
action". (Banks, 2008:50-51)
Figure 4: The three segments of ART market
Source: Banks, E. (2008). 51.
2.2.2 Participants The participants in ART market are:
• Risk takers and investors such as reinsurers, life assurers, bank traders, capital market
investors.
• Protection seekers like insurers, reinsurers and bank traders.
• Intermediaries like insurance brokers and investment bankers.
21

Paspati Maria ALTERNATIVE RISK TRANSFER TRANSACTIONS
2.3 ART carriers and products In order to explore how the various instruments fit in the ART marketplace, the typology
of Cummins & Weiss (2009) was chosen among the wide literature studied for the purposes of
the dissertation. The two authors categorise these instruments as shown in the following
figure:
Figure 5: ART instruments
Source: Cummins, J. D., & Weiss, M. A. (2009). 506.
2.3.1 Risk Pools and Insurers Arrangements between corporations or insurers to mobilise sufficient capacity for very large
risks:
Self-Insurance Plans Mostly a US phenomenon and strongly regulated in state level. It covers workers'
compensation, general liability, product liability, auto liability and property. Workers'
compensation, which accounts for the greatest area of self-insurance, and auto liability can only
be self-insured as regulated programs.
Captive Insurance companies Insurance or reinsurance companies created or owned by a corporation or an industrial,
commercial or financial group of companies which are not active in the insurance business
themselves (parent). The primary business purpose of a captive is to insure the risks of its
parent(s). In essence a captive acts as an insurer that writes risks whose origins or access are
restricted.
Alternative Risk Transfer
Risk Pools and Insurers
Self Insurance Plan Captive Insurance
Companies Risk Retention Groups
Hybrid Products Finite Reinsurance
Multi-year Products Multi-peril Products
Multiple-trigger Products Industry Loss Warranties
Sidecars
Financial Instruments Contingent Capital
Options Swaps
CAT Bonds
22

Paspati Maria ALTERNATIVE RISK TRANSFER TRANSACTIONS
The simplest form of captive is pure or single parent captive, where a company sets up
and capitalises a captive to cover its own risks (while not accepting risks from third parties). The
captive acts like an insurer to the sponsor/owner, receiving insurance premium and paying
claims. Part of the risk transferred to the captive is often ceded to a professional reinsurer.
However this is not a main characteristic of a captive. Lastly, dividends or interest are paid to
the sponsors of the captive, depending on the business performance. The workflow for a "pure"
captive is presented in the following diagram:
Figure 6: Single parent captive
Source: Frenz, T. (2012). 7.
The evolution of captives resulted in many variations that serve the different needs of
their owners, like single owner and single user (related); single owner and multiple users
(related); multiple owners and multiple users (related); single/multiple owner(s) and multiple
users (unrelated). (Frenz, 2012: 7-8)
Figure 7: Total Captives Worldwide by Year with Corresponding World Events
Source: Marsh LLC and the Risk and Insurance Management Society, Inc. (2017). 2.
23

Paspati Maria ALTERNATIVE RISK TRANSFER TRANSACTIONS
Table 1: Captive Utilisation by Parent Company Industry, 2016
Source: Marsh LLC and the Risk and Insurance Management Society, Inc. (2017). 11.
24
Paspati Maria ALTERNATIVE RISK TRANSFER TRANSACTIONS
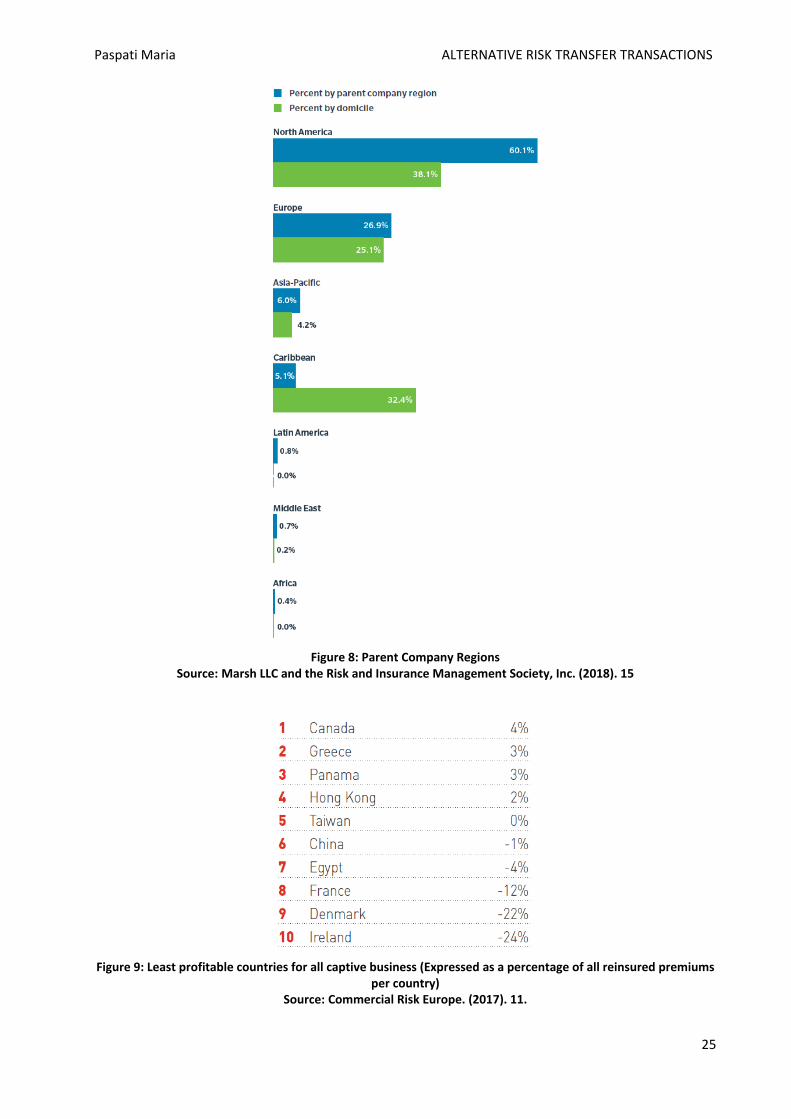
Figure 8: Parent Company Regions
Source: Marsh LLC and the Risk and Insurance Management Society, Inc. (2018). 15
Figure 9: Least profitable countries for all captive business (Expressed as a percentage of all reinsured premiums
per country) Source: Commercial Risk Europe. (2017). 11.
25

Paspati Maria ALTERNATIVE RISK TRANSFER TRANSACTIONS
Risk retention groups - RRGs Kunkel (2003) describes a risk retention group as a policy issuing liability insurance
company that is controlled by its owner. RRGs are met only in USA and can be formed either as
captive or as a traditional insurance company, under the Federal Liability Risk Retention Act of
1986. Within a RRG, members who engage in similar or related business or activities are
allowed to write liability insurance for all or any portion of the exposures of group members,
excluding first party coverage (e.g. property, worker's compensation and personal lines).
Palumbo. Insurance Associates. (n.d.) add that RRG distribute the responsibility equally
among the members and basically offer a different way of financing such liability. The primary
requirements of an RRG include that:
• it can only write liability insurance;
• there must be more than one insured/owner;
• all insured's must be owners and likewise all owners must be insured's.
Table 2: RRGs premiums by business area 2014-2015, in million dollars
Source: Insurance Information Institute, Inc. (2018).
2.3.2 Hybrid Reinsurance-Financial Products They incorporated characteristics of both financial instruments and reinsurance, while
the financial instruments resemble products traded in capital markets.
Finite Risk Reinsurance Finite is a type of reinsurance contract. Finite risk solutions constrain the reinsurance
company's drawback, in contrast with conventional reinsurance, leaving a greater amount of
that risk with the insured. The insured contractor also partakes in its own positive claims
26

Paspati Maria ALTERNATIVE RISK TRANSFER TRANSACTIONS
experience, sharing a portion of the gains that insurance companies typically retain. In this
sense, finite risk is a hybrid of risk finance and risk transfer. There is risk finance because on one
hand the insured can access capital to meet timing risk, but on the other carries the cost of
his/her own risks. There is risk transfer because some risk is transferred to the reinsurer, even if
less evidently than in traditional reinsurance programs. (Culp & Heaton, 2005:18)
Blended and Multi-Year, Multiline products Blended covers combine elements of both conventional (significant underwriting) and
finite risk reinsurance (non-traditional risk-management). Thus, blended covers may cover
multiple years, insulating the cedent from the reinsurance cycle, and usually involve recognition
of the time value of money. They tend to be more available during the "soft" phase of the
reinsurance cycle.
Integrated or structured multi-year/multiline products (MMPs) modify conventional
reinsurance by: (1) incorporating multiple lines of insurance in the same policy; (2) providing
coverage at a predetermined premium for multiple years; (3) including hedges for financial and
underwriting risks; and (4) covering risks not traditionally considered insurable (e.g. political
risks and business risks). (Cummins & Weiss, 2009:510-511)
Figure 10: A model of Multi-line/Multi-year Product (MMP) compared to the model of a standard insurance
contract Source: Wieczorek-Kosmala, M. (2010). 456.
Multiple-Trigger products Multi-trigger products (MTPs) are based on a holistic risk approach and their key feature
is that the burden of loss, and consequently the claim, is paid only if two or more predefined
triggers occur simultaneously. In a typical dual trigger structure the first trigger is always a
defined insurance event and the second trigger a non-insurance one. However, a MTP can also
27

Paspati Maria ALTERNATIVE RISK TRANSFER TRANSACTIONS
be structured as a triple trigger structure. From the insurer stance the presence of a second (or
third) trigger reduces the probability of loss and allows offering a lower premium. In general,
the non-insurance trigger is linked to a financial indicator, namely the price of a commodity, an
interest rate or a rate of return. (Wieczorek-Kosmala, 2010: 456-457)
Figure 11: A model of Multi-trigger Product (MTP) with a dual trigger structure
Source: Wieczorek-Kosmala, M. (2010). 457.
Industry loss warranties The various instruments that can be identified as Industry Loss Warranties (ILW) are also
known as Original Loss Warranties (OLW). They basically cover losses from events where the
industry-wide insured loss (and not a single company's loss) exceeds some pre-agreed
threshold. As the operative trigger is an industry loss, there is an implication of a possible loss
to the reinsured portfolio without triggering the ILW, on the condition that the corresponding
industry loss is smaller than the industry trigger amount. This is the "basis risk" for the
reinsured and is higher for companies whose aggregated risk exposures are far from the
industry norm. Hence, ILW covers are usually preferred by companies whose portfolios closely
follow the market. Such detach can be relented with the selection of a proper trigger. Factors
like geography, level, and other events contribute to the formation of the trigger amount and
the selection of industry loss in each case, offering a variety of ILWs. (Ishaq, 2005:76)
Sidecars The main purpose of sidecars is to allow investors to take the risk and return of a small
and limited category of insurance policies, like short-tailed property catastrophe policies
written by a (re)insurer. They are funded by capital market investors (sponsors) through equity
or debt financing. In the first case, a holding company is usually set-up in order to allocate the 28

Paspati Maria ALTERNATIVE RISK TRANSFER TRANSACTIONS
equity stake to equity investors. In the second case, debt financing is provided either directly to
the sidecar or through its holding company.
In essence sidecars are special purpose entities (or special-purpose vehicles, or
"disposable reinsurers"), with limited life span (usually 3 years), that serve as quota-share
reinsurance against property catastrophe for their sponsors. The latter aren't obliged to
undertake the long-term investment risk associated with a (re)insurer's entire book of business
or legacy loss reserves. (Willis Property Resource Group, 2007:1)
Figure 12: Simplified sidecar structure
Source: Willis Property Resource Group. (2007). 1.
Figure 13: Structure of a typical sidecar
Source: Cummins, J. D., & Weiss, M. A. (2009). 514.
29

Paspati Maria ALTERNATIVE RISK TRANSFER TRANSACTIONS
2.3.3 Financial Instruments Financial instruments are of great importance because of their ability to absorb the risk
of large catastrophes and their potential to add transparency and liquidity to the risk transfer
market.
Contingent Capital Contingent capital instruments, also known as contingent convertible bonds (CoCo
bonds), contingent surplus notes, or enhanced capital notes, provide a mechanism that
automatically converts the instruments to equity upon the occurrence of some specified trigger
event.
Two of the most common types are catastrophe equity puts and contingent surplus
notes. The first entitles the insurer to sell stocks at a fixed price if a specified trigger event
occurs. The second entitles the insurer to issue surplus notes in exchange for liquid assets, in
case a predefined trigger event takes place. However, the trigger events (i.e. the risks from
which the companies have been protected), are normally related to catastrophe risk. The term
of the protection is also relatively short.
The main reason why contingent capital was introduced into the capital structure was
that, from the regulators' perspective, it could solve the "too-big-to-fail" problem and reduce
the loss paid by taxpayers instead of the investors. Compared to issuing new stocks, investors
want to avail themselves on the debt-like feature of the contingent capital: tax deductibility
before the conversion and upfront and fixed recapitalization cost at conversion. (Shang, 2013:7-
8)
By providing additional resources when needed, contingent capitals reduce the need for
government intervention and bail out. In the European Union, the Basel Committee has
included them in bank regulatory capital in 2010, under the Basel III framework. The majority of
the Basel III proposals have been implemented by the Capital Requirements Regulation
(Regulation (EU) No. 575/2013) ("CRR") which, together with the Directive 2013/36/EU and
recasting the previous Capital Requirements Directive, form the package of legislation known as
"CRD4".
30

Paspati Maria ALTERNATIVE RISK TRANSFER TRANSACTIONS
Options and Swaps Options
In the ART market there are insurers who wish to transfer risk and there are investors
who can meet this demand. However, such transactions should meet the institutional needs of
both the investors and the insurers.
As investors are ill-equipped to deal with counterparty risk7 (default risk), they base the
contract on the combined results of several insurers, i.e. a catastrophe index. However, trading
contracts on an index introduces additional risk for the insurer, on the grounds that the money
it recovers from a catastrophe contract might be much different from its own losses.
The insurer would care for a high correlation between its losses and the index, as is the
case for reinsurance, so as to minimise its basis risk. The other counterparty, the investor, seeks
to maximise profit while adding the least amount of risk to the total investment portfolio. Both
the insurer and the investor want to quantify their risk.
Often enough, the returns on available investments have a tendency to correlate over
time. For instance, stock returns tend to correlate with the general economy. If the value of the
index has no correlation with the seller’s other investments, the investor will undertake less risk
by selling contracts on the index than if he took on an otherwise equivalent investment on the
stock market. (Meyers, 1998:188-189)
Swaps Swaps usually offer coverage for multi-year periods, not only against natural
catastrophes, but against extreme mortality and longevity risks as well. They are suitable for
smaller transactions, as they are not collateralised. We have two types of swaps:
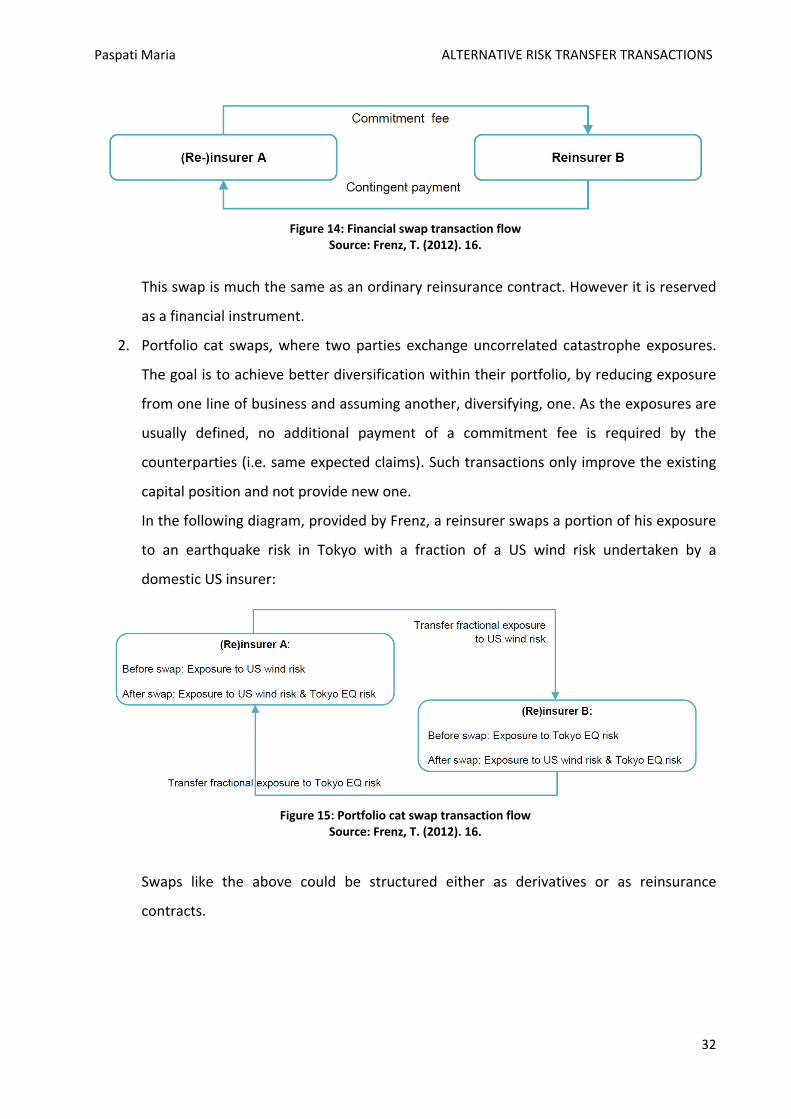
1. Financial swaps, where two parties exchange risk for a commitment fee (usually a
floating rate linked to the London Interbank Offered Rate - LIBOR). The payment is
contingent on catastrophic insurance event (the trigger), therefore increasing the
buyer's capacity.
7 Counterparty or default risk is the risk to each party of a contract that the counterparty will not live up to its contractual obligations.
See further: Investopedia LLC. (2017). Counterparty Risk. Retrieved from http://www.investopedia.com/terms/c/counterpartyrisk.asp, accessed on 08/04/2017.
31
Paspati Maria ALTERNATIVE RISK TRANSFER TRANSACTIONS
Figure 14: Financial swap transaction flow
Source: Frenz, T. (2012). 16.
This swap is much the same as an ordinary reinsurance contract. However it is reserved
as a financial instrument.
2. Portfolio cat swaps, where two parties exchange uncorrelated catastrophe exposures.
The goal is to achieve better diversification within their portfolio, by reducing exposure
from one line of business and assuming another, diversifying, one. As the exposures are
usually defined, no additional payment of a commitment fee is required by the
counterparties (i.e. same expected claims). Such transactions only improve the existing
capital position and not provide new one.
In the following diagram, provided by Frenz, a reinsurer swaps a portion of his exposure
to an earthquake risk in Tokyo with a fraction of a US wind risk undertaken by a
domestic US insurer:
Figure 15: Portfolio cat swap transaction flow
Source: Frenz, T. (2012). 16.
Swaps like the above could be structured either as derivatives or as reinsurance
contracts.
32

Paspati Maria ALTERNATIVE RISK TRANSFER TRANSACTIONS
Catastrophe Bonds Catastrophe bonds, or shortly CAT bonds, were introduced in the capital markets in the
1990s and they are the most common and accepted form of insurance linked securities. They
are sponsored by insurers and reinsurers and employ securitisation to increase insurance
capacity in the global reinsurance market.
A catastrophe bond transaction centres on a special purpose reinsurance vehicle (SPV),
which is also known as transformer (because it transforms insurance risk into securities). The
SPV issues and sells securities (catastrophe bonds) to institutional investors, and the proceeds
from the sale are deposited in a collateral trust account and invested into highly rated short-
term investment assets. The SPV then provides reinsurance to a ceding insurer or reinsurer (an
insurance company seeking to transfer risk, henceforth the cedent or cedant), who pays a
premium in exchange. The premium, as well as any income earned on the trust investments
(which are often swapped for either fixed or variable returns provided by a swap counterparty),
funds interest payments to investors. An interest coupon8 is paid periodically and the principal
is returned at maturity unless the bond was triggered by a loss event.
If the bond is triggered, the principal repayment and coupon could be reduced or
forfeited in full, or the principal repayment delayed. In this sense, the bond provides coverage
equal to its issuance value, through a single insurance policy, and is fully collateralised by the
funds held in trust. The reinsurer "economises" on collateral, as the value of its collateral assets
support a much larger face value of coverage than in the case of the catastrophe bond (where
the value of collateral assets supports exactly the same amount of coverage). In other words,
the reinsurer takes advantage of imperfect correlation among its multiple cedents to promise
more in coverage than it actually holds in assets.
If no event occurs, the principal is returned to investors. A key institutional detail is that
the entire face value of the bond is held in trust and available if the bond is triggered.
(Lakdawalla & Zanjani, 2012:452-454)
8 The interest coupon is usually a floating rate such as LIBOR, plus a spread. The risk period commonly coincides with the major renewal dates (1 January or 1 July) and runs over multiple years – mostly 3 years and some up to 5 years.
33

Paspati Maria ALTERNATIVE RISK TRANSFER TRANSACTIONS
Figure 16: Typical Catastrophe Bond structure
Source: Frenz, T. (2012). 12.
Frenz (2012) records the following trigger classification:
• The indemnity trigger is based on actual financial losses to the sponsor-issuer. Indemnity
triggers basically mirror excess-of-loss reinsurance.
• Industry-loss index triggers use an index that is calculated by a third-party9. The index
measures the level of industry-wide losses instead of the individual company's loss and
is based on actual insured loss information collected directly from insurance companies
writing insurance business in the affected territories.
• A pure parametric trigger uses a clearly defined parametric loss metric, for instance if
the rainfall, wind speed or earthquake in a defined coverage area exceeds a given
threshold.
• Parametric index: A more refined form of a parametric trigger that aims to reduce basis
risk by using more measurement locations and weighting factors at each location to
more accurately recognise the vulnerability and value distribution.
• Modelled loss triggers are also based on a specific loss index; however the index is
calculated using a predefined catastrophe simulation model and parameters. This
trigger aims to model the expected loss based on the given assumptions, which can be
set to mirror the sponsor's exposure.
9 Namely risk-modeling companies that calculate in sufficient accuracy the estimated industry-wide loses for specific events.
34

Paspati Maria ALTERNATIVE RISK TRANSFER TRANSACTIONS
Figure 17: Catastrophe bonds and ILS issuance by trigger and by year
Source: Evans, S. (2017a).
Table 3: Overview of Indemnity vs. Parametric Protection
Source: Kessler, T. (2016). 6.
35

Paspati Maria ALTERNATIVE RISK TRANSFER TRANSACTIONS
Figure 18: Catastrophe bonds & ILS issued and outstanding by year, million dollars
Source: Evans, S. (2017b). 36
Paspati Maria ALTERNATIVE RISK TRANSFER TRANSACTIONS
2.4 Summary and evaluation of ART Large US corporations use risk carriers such as captives, risk retention groups, and self-
insurance to overcome capacity shortages. Captives have evolved into a global business with an
increasing number of locations, including offshore financial centres, competing with each other
to provide attractive business environments and taxation benefits.
Pools have been used by several industries to cover liability risk but also for states and
multinational organisations to cover natural or man-made catastrophe risk.
Finite solutions are custom-made for prospective and retrospective coverage. Multi-risk
products reduce the number of reinsurance counterparties, as they combine a number of risks
for various non-life insurance lines.
Derivatives are bi-lateral, standardised products and rather inexpensive. Only few of the
counterparties are currently apt to and interested in exchange-traded products. Therefore,
liquidity is still rather low, and secondary market pricing is difficult. Over-The-Counter products
like ILW are more liquid and, if traded as derivatives, based on International Swaps and
Derivatives Association (ISDA10) standard terms and conditions.
ILWs formed as derivatives bridge reinsurance and capital markets, since a signed ILW is
not treated as an insurance activity. Alternatively, ILWs can be traded as reinsurance contracts
and are comparable to traditional single- or double-trigger cover.
Contingent capital is a rather limited resource, as it can hit the investor at a time when
he may face his own difficulties because of an event of low probability and high severity.
Reinsurance side-cars are another product that bridges the traditional reinsurance
sector and capital markets. Investors are able to take part in the reinsurance market for a
limited period of time and follow the sponsor's fortune. The investor may choose between risks
and further between segments with different risk profiles. (Weber, 2011: 90-91)
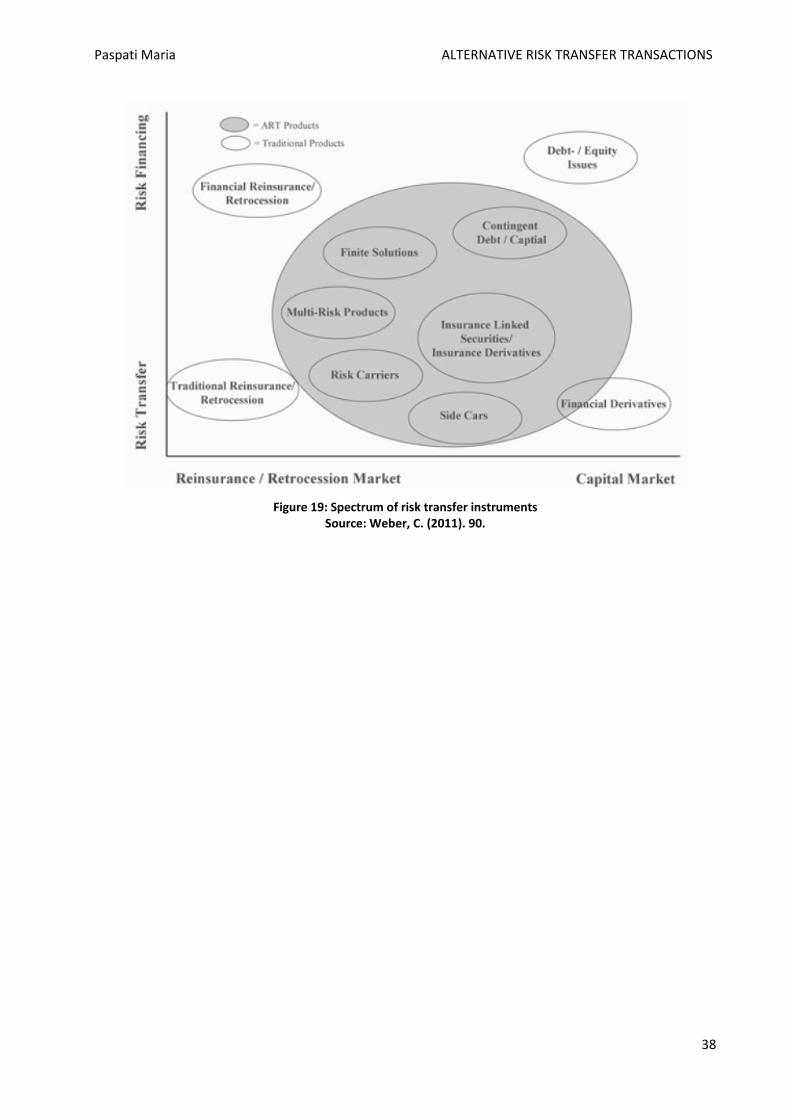
The various instruments used in ART transactions have both benefits and costs, which
are recorded in various studies (e.g. Cummins & Lewis, 2002; Banks, 2004; Culp, 2012; Hartwig
& Wilkinson, 2007; Cummins & Weiss, 2009; Maes & Schoutens, 2012; Ben Ammar, Braun &
Eling, 2015). Weber (2011) presents a categorised overview of the instruments available (Figure
19), as well as a concise synopsis of the different products’ characteristics (Table 4).
10 ISDA was established in 1985, aiming to make the global derivatives markets safer and more efficient. Its 850 member institutions from 68 countries work in three key areas: reducing counterparty credit risk, increasing transparency, and improving the industry’s operational infrastructure.
See further International Swaps and Derivatives Association, http://www2.isda.org/about-isda/. 37
Paspati Maria ALTERNATIVE RISK TRANSFER TRANSACTIONS
Figure 19: Spectrum of risk transfer instruments
Source: Weber, C. (2011). 90.
38

Paspati Maria ALTERNATIVE RISK TRANSFER TRANSACTIONS
Table 4: Summary and evaluation of ART instruments
Source: Weber, C. (2011). 92.
39

Paspati Maria ALTERNATIVE RISK TRANSFER TRANSACTIONS
Table 4 (continued)
Source: Weber, C. (2011). 93.
40

Paspati Maria ALTERNATIVE RISK TRANSFER TRANSACTIONS
2.5 Insurance and capital market convergence As the risk management evolved over the years, it resulted in a convergence of the
various perspectives on risk management (once divided by extreme differences in vocabulary,
concepts, and methods); convergence of organizational processes for managing an
extraordinary variety of risks; convergence of risk management products previously offered by
completely separate industries (e.g. insurance and capital markets); and, finally, convergence of
risk management with the quest for optimal capital structure.
Insurance securitization is an example of this slowly evolving convergence process
between the insurance and banking sectors. Industries that traditionally focus on the opposite
sides of a customer's balance sheet, now manage the financial needs of customers on a holistic
basis.
The use of capital market instruments in the underwriting sector offers freedom as
regards to transferring risk. Moreover, it is not limited only to transferring the underwriting
risk; it also provides extensive possibilities for risk management. Capital market transactions
should always be viewed in the context of the insurer's objectives (e.g. hedging against a
possible rise in rate levels on the international reinsurance market, hedging reinsurance costs,
procuring equity capital). The integration of capital market instruments into the insurance
industry provides a set of risk-policy tools that allow better planning and a more cost-effective
risk transfer in overall terms by way of securitization (contrary to an exclusively capital market
solution).
In the case of ART, convergence can be described as a financial deregulation that allows
vertical integration and economics of scale in the insurance, banking and investment market,
which are the main propellers of ART growth. This process has been driven by various factors,
including the increase in the frequency and severity of the catastrophic risk, market
inefficiencies generated by the (re)insurance underwriting cycles, amelioration of information
and communications technologies, emergence of risk management for businesses. It reflects
the evolution of the company's cash management needs, from simple banking products to a
wide range of instruments: managing both currency and liquidity risks and following the
direction of their treasury department.
As (re)insurers' services adapt so that they cover a wider range, their involvement in
capital market solutions will continue. In this context, it is mainly the risk assessment and the
formation of complex transactions on the capital market, as well as the assumption of any
41

Paspati Maria ALTERNATIVE RISK TRANSFER TRANSACTIONS
underlying risk, the fronting function, and the provision of any necessary bridge cover, that
establish the operational sectors of the (re)insurance activity. Those sectors are also combined
with interactions with additional financial cooperation partners, such as investment banks, so
that the (re)insurer can offer professional support and guidance for the cedent's entry into the
capital market.
For a thorough review of how the convergence of insurance and capital markets evolved
since the introduction of the various ART transactions, see further Walker, Fulcher, Green et al
(1999), Anon. (2001), Culp (2002a), Culp (2002b), Banks (2004), Cummins & Weiss (2009),
Kampa (2010), Gatzert, Pokutta & Vogl (2014), Ben Ammar, Braun, & Eling (2015).
42

Paspati Maria ALTERNATIVE RISK TRANSFER TRANSACTIONS
3. Regulatory framework The regulation of insurance companies in the United States (US) and the European
Union (EU) continues to evolve in response to market forces and the changing nature of risk but
with somewhat different philosophies and at different rates.
This section provides the legal framework of the (re)insurance market, mainly focusing
on the case of the European Union, as the Greek (re)insurance market operates within this
context.
3.1 Solvency regulation in the United States of America Insurance regulation in the United States is rooted in its historical legacy. Although the
business of insurance is primarily regulated at state level, the US insurance sector is in a larger
sense subject to an integrated federal-state framework. A state insurance regulator focuses on
the financial strength (solvency) of the insurers that are subject to the jurisdiction of that
regulator (based on the insurers domicile), as well as on market conduct issues (e.g., product
design, pricing, and claims' payment practices). Each state is principally responsible for
regulating the market practices of all insurers operating in its jurisdiction. The states use the
National Association of Insurance Commissioners (NAIC) to coordinate and support their
regulatory activities. The states are not compelled to adopt NAIC standards but have tended to
do so in the financial regulation; with respect to market regulation the states have acted more
independently.
The applied approach is heavily influenced by an accounting perspective and aims to
regulate insurers' financial condition and market practices. This is reflected in an extended set
of laws, regulations, rules, and other measures that govern insurers' activities and financial
structure. Regulators focus on insurers' compliance with these prescriptions rather than the
prudence of their management and their overall financial risk. Thereby, insurers lack the
incentive to use the most efficient methods in terms of valuing assets and liabilities, calculating
losses and income, and estimating their risk exposure.
In terms of federal involvement, the government is engaged, among others, with
oversight of savings and loan holding companies that control insurers, as well as any insurer
that may be a nonbank financial company that the Financial Stability Oversight Council (FSOC)
43
Paspati Maria ALTERNATIVE RISK TRANSFER TRANSACTIONS
determines should be subject to supervision by the Board of Governors of the Federal Reserve
System and enhanced prudential standards.
While reinsurance serves a range of important functions, regulators recognise that it can
concentrate credit risk into comparatively few counterparties. The credit risk created by
reinsurance -often involving large transactions-, can be measured by the amount of reserves a
reinsurer holds for losses, loss adjustment costs and life, annuity and health insurance benefits.
These reserves are based on the expected future claims payments for the risks borne by the
ceding insurers. This credit risk is mitigated because transactions must be conducted in
accordance with a prudential regulatory framework that limits the amount of risk transferred to
a reinsurer. This framework also requires the use of collateral in certain circumstances, as well
as appropriate capital sums to be held by the ceding insurers.
Regulation of the business of reinsurance in the US is either direct (state insurance
regulator directly regulates reinsurers domiciled and licensed in its state as well as reinsurers
licensed in its state but domiciled in another state) or indirect (a large and increasing
proportion of reinsurance premiums from US-based insurers are ceded to reinsurers based
outside the United States that are not licensed by any US state, and thus not directly subject to
prudential regulation by any state). (Klein & Wang, 2009:608-612; Federal Insurance Office, US
Department of the Treasury, 2014:18-20)
Changes in the legislation regarding (re)insurance transactions are recorded and
documented annually from the Federal Insurance Office, US Department of the Treasury.
3.2 Solvency regulation in the European Union From a judicial point of view, EU countries face some of the same challenges, as the
States, in coordinating and harmonizing their insurance regulatory activities. However, EU is
composed of sovereign countries and its authority and influence diverge from that of the
federal government in the United States. Therefore, a consensus must be achieved among its
members, in order to support its regulatory standards, as well as other policies.
At present, EU member states are subject to some common, minimum standards, as set
by the Solvency II EU Directive that was adopted in 2009. Beyond this Directive, the majority of
jurisdictions are applying their own additional standards.
The main objective of EU policies has been to facilitate cross-border trade within the EU
and to make it easier for an insurer residing in a member state to sell collateral in other
member States (either across border or through founding branch companies), as well as trade
44
Paspati Maria ALTERNATIVE RISK TRANSFER TRANSACTIONS
beyond the European borders. EU member states will continue to regulate insurers domiciled in
their respective jurisdictions, but each will do so in line with EU policies and standards.
The two most important perspectives of the EU's regulatory procedure are its guiding
philosophy and program for developing a stronger and more effective approach to insurance
regulation, indicated in Solvency II. The proposal for the Solvency II Directive was published by
the European Commission in July 2007 and reflected the economic substance of insurance,
focused on the management of risk, and grounded in risk-sensitive capital requirements.
Contrary to the United States, many European countries move with a faster pace
towards applying a principles-based and prudential approach to insurance regulation. A
prudential system emphasises on the maintenance of an adequate "solvency margin" by the
insurer, by means of competence and judgment of the insurer's management. The ultimate
focal point is the insurer's financial risk.
Many EU countries were also quicker to embrace a financial/economic outlook for
regulating insurance companies, than their US counterparts. Therefore, although Solvency II
will promote and harmonise regulatory standards, it is in line with the regulatory philosophy of
most EU countries. (Klein & Wang, 2009:612-613)
3.2.1 Solvency I The adoption of the first non-life insurance Directive (Directive 73/239/EEC) in 1973,
and of the first life assurance Directive (Directive 79/267/EEC) six years later, were the first
steps towards harmonisation of insurance supervision in Europe. Implementation of the
Directives resulted in harmonised solvency requirements in the EU member states. The
supervisory regime Solvency I was perfected by the second and third Directives (Directives
88/357/EEC, 90/619/EEC, 92/49/EEC and 92/96/EEC), which, inter alia, implemented the
freedom to provide services in the insurance sector.
Title I of the Council Directive 73/239/EEC of 24 July 1973, also known as Solvency I, sets
its scopes and limits. The Directive concerns direct insurance provided by insurance
undertakings (companies) domiciled in a member state, as well as classes of insurance defined
in its annex. It specifically excludes life assurance and other supplementary insurance,
annuities, insurance as part of social security, and health insurance in the cases of Ireland and
the United Kingdom. It also lists a number of institutions in Germany, France, Italy, Ireland, and
United Kingdom, who either enjoy monopoly, or are partly under public control.
45

Paspati Maria ALTERNATIVE RISK TRANSFER TRANSACTIONS
Title II states the rules applied to undertakings whose head offices are situated within
the Community. According to Article 16 the solvency margin shall correspond to the assets of
the company, free of any foreseeable burden, less intangible assets. Moreover, it shall be
determined based on either the annual premium, or contributions, or the average charge for
the last three financial years. As stated in Article 17 one-third of the solvency margin shall
constitute the guarantee fund, while the minimum units of account vary accordingly. All
undertakings are obliged to comply with the provisions of the Directive and produce an annual
account, covering all types of operation, of their financial situation and solvency; free disposal
of assets is prohibited in case of no compliance. Moreover, member states shall facilitate an
undertaking to assign all or part of its portfolio of policies if the assignees possess the necessary
solvency margin, due account being taken of the assignment. (Council of the European
Communities, 1973)
3.2.2 The transition Work aimed at improving and providing a new focus for the existing EU solvency rules
began at the European level in the 1990s. A Working Group, led by former president of the
Federal Insurance Supervisory Office (Bundesaufsichtsamt für das Versicherungswesen – BAV),
Dr Helmut Müller, proceeded to a comparative examination of the European solvency rules.
The so called Müller Report stated that solvency in Europe had stood the test of time. However,
the (rather complex) existing provisions on own funds did not adequately account for all risks to
which an insurer is exposed.
Consequently, a reform was decided resulting, initially, in the implementation of the
most urgent changes to Solvency I: the life assurance Directive (Directive 2002/83/EC) and the
Directive regarding the solvency margin requirements for non-life insurance undertakings
(Directive 2002/13/EC). Still, these two Directives only represented a transitional solution
towards a new risk-based supervisory system. The fundamental reform of the solvency rules for
insurers remained the preserve of the supervisory regime Solvency II, while the Solvency I rules
remain applicable to undertakings to which Solvency II does not apply (small insurance
undertakings, institutions for occupational retirement provision and death benefit funds).
(Bundesanstalt für Finanzdienstleistungsaufsicht, 2016)
3.2.3 Solvency II Solvency I represented 14 EU Directives and foresaw the existence of 28 national
supervisory regimes. As of 1 January 2016, these 14 EU Directives were replaced by Solvency II.
46

Paspati Maria ALTERNATIVE RISK TRANSFER TRANSACTIONS
The new harmonised, risk based, robust, and proportionate prudential supervisory common
regime for insurance and reinsurance companies shall be applied by all 28 EU Member States11.
The Solvency II supervisory regime consists of the three pillars, of equal importance:
1. Pillar I - Calculation of capital reserves: One characteristic of the financial crisis was the
underestimation of risks. The first pillar outlines the standard formula insurance
companies across the European Union have to use for the calculation of their capital
reserves, covering all types of risks.
2. Pillar II - Management of risks and governance: It contains the requirements for the
management of potential risks and for governance. Companies will be provided
incentives to clearly identify and manage the risks they are facing.
3. Pillar III - Reporting and disclosure: It describes the information and reporting insurance
companies across the European Union have to submit to the national supervisor and
disclose publicly. Supervisors will have the possibility to timely act and their
interventions can be better targeted.
The benefits of Solvency II can be summarised as follows:
• Enhanced protection of consumers of insurance products. Through risk and governance
management, as well as by requiring a market-consistent valuation of insurers' assets
and liabilities, the latter will enjoy full benefits off their insurance contracts.
• Less administrative burden for insurance conglomerates based in several EU countries
as they will report to one supervisory authority instead of reporting to each national
supervisor in different countries. This, along with abolishing advantages some cross-
border groups had under Solvency I, will also enhance fair competition and create level-
playing field in the insurance market.
• Safeguarding financial stability in Europe, as transparency in application, reporting and
disclosure will allow supervisors to compare companies and by that to better and timely
analyse the risks and vulnerabilities of the European (re)insurance market as a whole.
The Solvency II regime is to be reviewed in 2018. (European Insurance and Occupational
Pensions Authority, n.d.)
11 For the time being, the United Kingdom remains a full member of the EU and rights and obligations continue to fully apply in and to the UK.
47
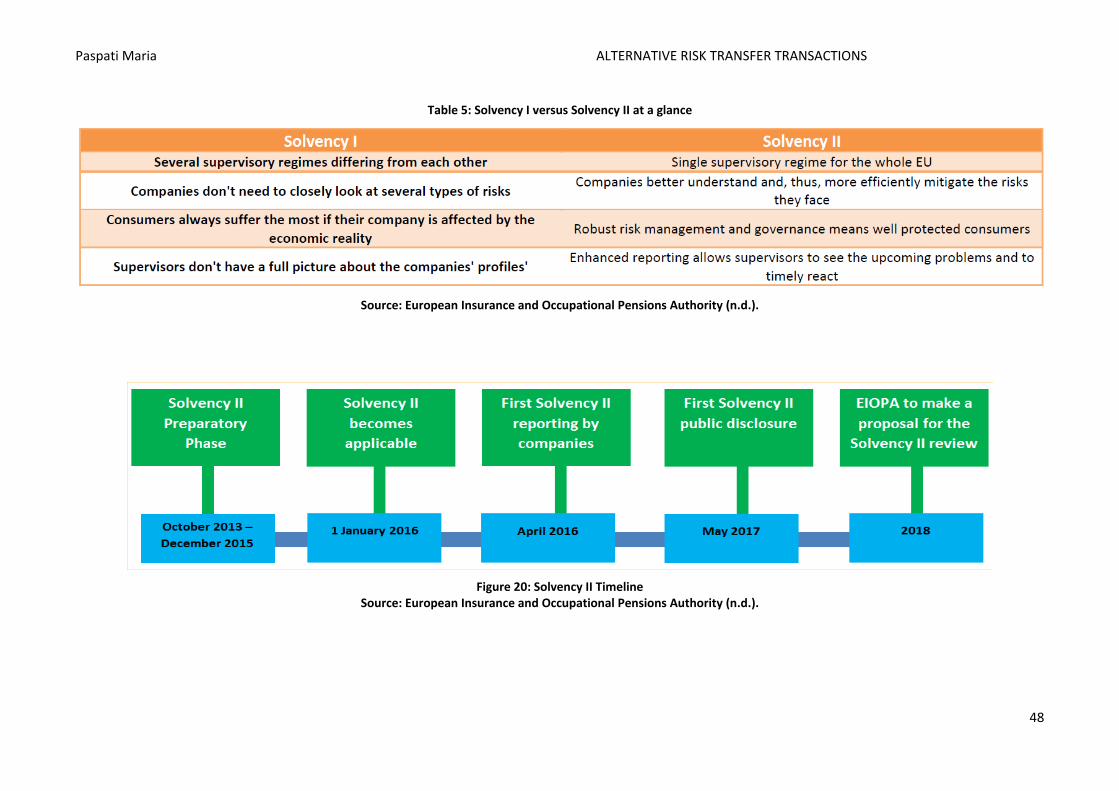
Paspati Maria ALTERNATIVE RISK TRANSFER TRANSACTIONS
Table 5: Solvency I versus Solvency II at a glance
Source: European Insurance and Occupational Pensions Authority (n.d.).
Figure 20: Solvency II Timeline
Source: European Insurance and Occupational Pensions Authority (n.d.).
48
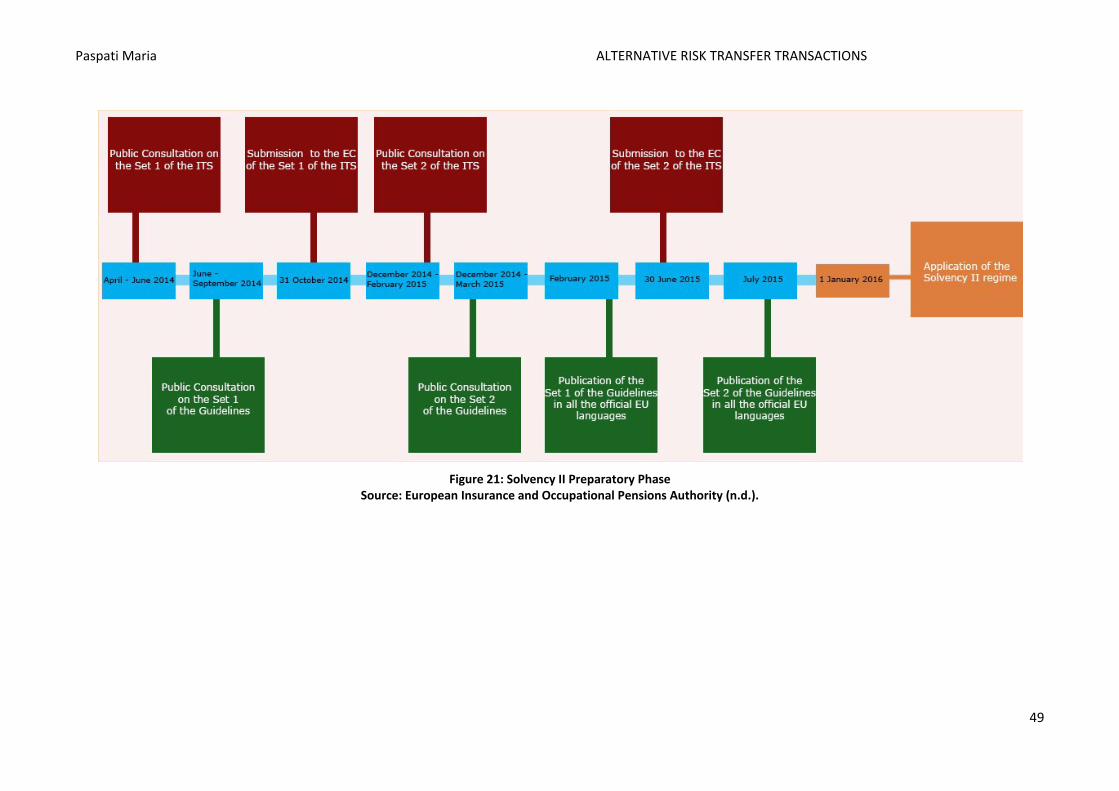
Paspati Maria ALTERNATIVE RISK TRANSFER TRANSACTIONS
Figure 21: Solvency II Preparatory Phase
Source: European Insurance and Occupational Pensions Authority (n.d.).
49
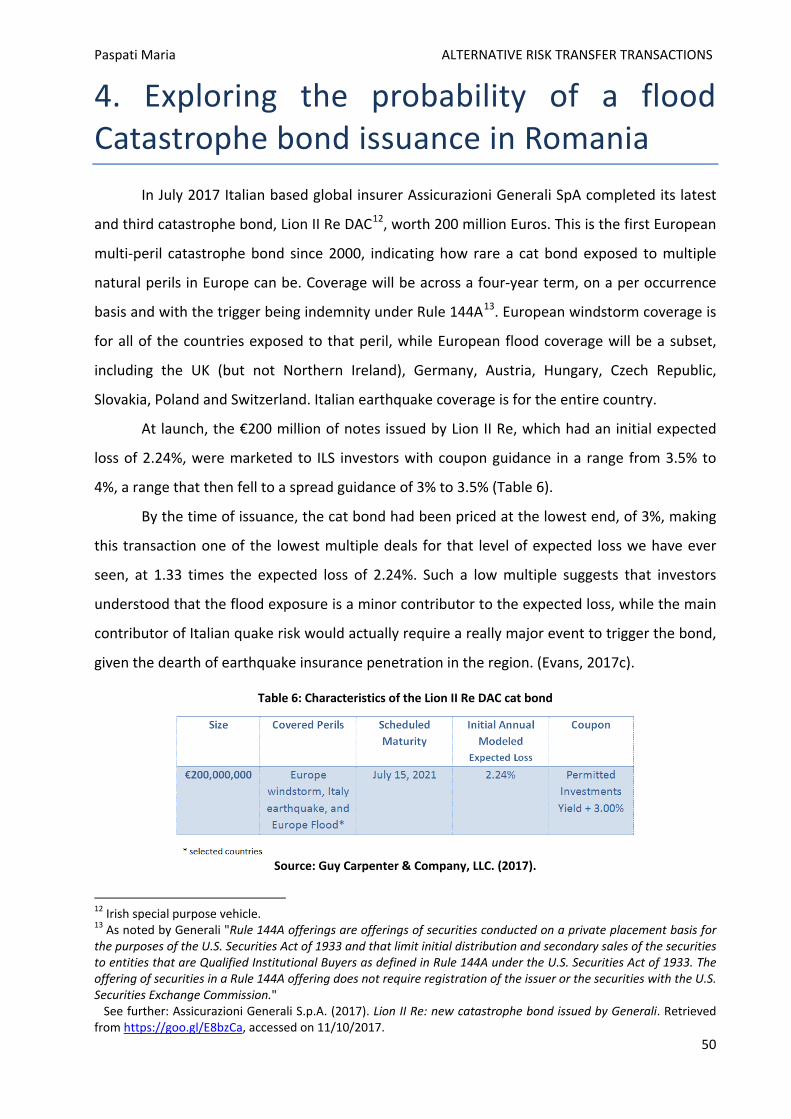
Paspati Maria ALTERNATIVE RISK TRANSFER TRANSACTIONS
4. Exploring the probability of a flood Catastrophe bond issuance in Romania
In July 2017 Italian based global insurer Assicurazioni Generali SpA completed its latest
and third catastrophe bond, Lion II Re DAC12, worth 200 million Euros. This is the first European
multi-peril catastrophe bond since 2000, indicating how rare a cat bond exposed to multiple
natural perils in Europe can be. Coverage will be across a four-year term, on a per occurrence
basis and with the trigger being indemnity under Rule 144A13. European windstorm coverage is
for all of the countries exposed to that peril, while European flood coverage will be a subset,
including the UK (but not Northern Ireland), Germany, Austria, Hungary, Czech Republic,
Slovakia, Poland and Switzerland. Italian earthquake coverage is for the entire country.
At launch, the €200 million of notes issued by Lion II Re, which had an initial expected
loss of 2.24%, were marketed to ILS investors with coupon guidance in a range from 3.5% to
4%, a range that then fell to a spread guidance of 3% to 3.5% (Table 6).
By the time of issuance, the cat bond had been priced at the lowest end, of 3%, making
this transaction one of the lowest multiple deals for that level of expected loss we have ever
seen, at 1.33 times the expected loss of 2.24%. Such a low multiple suggests that investors
understood that the flood exposure is a minor contributor to the expected loss, while the main
contributor of Italian quake risk would actually require a really major event to trigger the bond,
given the dearth of earthquake insurance penetration in the region. (Evans, 2017c).
Table 6: Characteristics of the Lion II Re DAC cat bond
Source: Guy Carpenter & Company, LLC. (2017).
12 Irish special purpose vehicle. 13 As noted by Generali "Rule 144A offerings are offerings of securities conducted on a private placement basis for the purposes of the U.S. Securities Act of 1933 and that limit initial distribution and secondary sales of the securities to entities that are Qualified Institutional Buyers as defined in Rule 144A under the U.S. Securities Act of 1933. The offering of securities in a Rule 144A offering does not require registration of the issuer or the securities with the U.S. Securities Exchange Commission."
See further: Assicurazioni Generali S.p.A. (2017). Lion II Re: new catastrophe bond issued by Generali. Retrieved from https://goo.gl/E8bzCa, accessed on 11/10/2017.
50

Paspati Maria ALTERNATIVE RISK TRANSFER TRANSACTIONS
From June 1st 2009 to May 31st 2012, leading European geologists, seismologists and
engineers cooperated within the SHARE (Seismic Hazard Harmonization in Europe) project, with
the objective to provide a community-based seismic hazard model for the Euro-Mediterranean
region with update mechanisms. In 2013, when the project officially ended, SHARE successfully
delivered a pan Euro-Mediterranean probabilistic seismic hazard assessment across multiple
disciplines spanning from geology to seismology and earthquake engineering (Seismic Hazard
Harmonization in Europe, n.d.). According to the researchers, Italy, the Balkans, Greece,
Bulgaria, Romania and Turkey are among the most exposed regions of the continent. (Horizon,
The EU Research & Innovation Magazine, 2014)
4.1 Seismicity of Romania The seismogenic zones are areas of grouped seismicity in which the seismic activity and
stress field are assumed to be relatively uniform. The identification of long-term characteristics
of the earthquake generation process in each seismogenic zone is of great significance for the
seismic hazard assessment.
The most dangerous seismogenic zone in Romania is located in the subcrustal
lithosphere at the bending of the Eastern Carpathians – Vrancea region. Beside this
intermediate-depth source, several shallow-depth seismic areas of local importance for the
seismic hazard are pointed out: the East-Vrancea, Făgăraş – Câmpulung, Danubian, Banat and
Crişana – Maramureş zones, the Bârlad Depression14, the Predobrogean Depression, the
Intramoesian Fault, and the Transylvanian Depression. The background seismicity – crustal
events with magnitude Mw < 5 – is sporadically observed, mainly in northern Oltenia, Haţeg
Depression, eastern part of the Romanian Plain, Moldavian Platform, Eastern Carpathians
orogen. (Institutul National de Cercetare Dezvoltare pentru Fizica Pamantului, Romania, n.d.)
The geographical distribution of the seismogenic zones and the distribution of the
epicenters of the crustal earthquakes are given in Figure 22, as described by Radulian et al
14 Depression: Any relatively sunken part of the earth’s surface; especially a low-lying area surrounded by higher ground. A closed depression has no natural outlet for surface drainage (e.g., a sinkhole). An open depression has a natural outlet for surface drainage. Closed depression: A generic name for any enclosed area that has no surface drainage outlet and from which water escapes only by evaporation or subsurface drainage; an area of lower ground indicated on a topographic map by a hachured contour line forming a closed loop. Open depression: A generic name for any enclosed or low area that has a surface drainage outlet whereby surface water can leave the enclosure; an area of lower ground indicated on a topographic map by contour lines forming an incomplete loop or basin indicating at least one surface exit. See further U.S. Department of Agriculture, Natural Resources Conservation Service. (n.d.). National soil survey handbook, title 430-VI. Available at http://www.nrcs.usda.gov/wps/portal/nrcs/detail/soils/ref/?cid=nrcs142p2_054242, accessed on 15/02/2019.
51

Paspati Maria ALTERNATIVE RISK TRANSFER TRANSACTIONS
(2000). The Shabla zone, situated in the northeastern part of Bulgaria close to the border with
Romania, is also taken into account. To the east, the earthquakes are related to the subduction
process at the Carpathians arc bend (Vrancea region); to the west, they follow the contact
between the Pannonian Depression and the Carpathians orogen. The eastern segment of the
Carpathians in Romania is practically aseismic, except the southern extremity (Vrancea region).
The western segment (Apuseni Mountains) is aseismic as well. The southern Carpathians are
considerably more seismically active, especially in the eastern (zone FC) and western (zone DA)
extremities. The platform regions are stable, except the small strip crossing the Carpathians
foredeep area on a SW–NE direction, in front of Vrancea region. Several active faults are
identified here following the same SE–NW orientation (Intramoesian, Perceneaga-Camena,
Sfântul Gheorghe and Trotuş faults). They mark the contact between different tectonic units,
where a relative enhancement of seismicity appears. The Transylvanian Depression is almost
aseismic at present. The small isolated seismogenic zone (TD) delimited there is defined only on
the basis of historical earthquakes. (Radulian et al, 2000: 58-59)
The strong seismic events originating from Vrancea area can generate the most
destructive effects experienced in Romania, and may seriously affect high risk man-made
structures such as nuclear power plants (Cernavoda, Kosloduj, etc.), chemical plants, large dams
and pipelines located within a wide area from Central Europe to Moscow. The earthquakes are
localized to a restricted area in the bending zone between the Eastern and Southern
Carpathians, where at least three units are in contact: the East European plate, Intra-Alpine and
Moesian sub-plates. Earthquakes in the Carpathian-Pannonian region are confined to the crust,
except the Vrancea zone, where earthquakes with focal depth down to 200km occur.
(Marmureanu, Cioflan, Marmureanu, 2011: 226-227)
For a basic glossary on earthquakes and more information about Romania’s seismicity,
see Appendix A and Appendix B respectively.
52

Paspati Maria ALTERNATIVE RISK TRANSFER TRANSACTIONS
Figure 22: Geographical distribution of the seismogenic zones and crustal seismicity Source: Radulian et al, 2000, 59.
VR: Vrancea; EV: East Vrancea; BD: Bârlad Depression; PD: Predobrogean Depression; IM: Intramoesian Fault; SH: Shabla; FC: Făgăraş-Câmpulung; DA: Danubian Zone; BA: Banat; CM: Crişana-Maramureş; TD: Transylvanian Depression. Solid lines: border limits of the seismogenic zones; dotted lines: border of tectonic units, dashed lines: major active faults. IMF: Intramoesian Fault; PCF: Peceneaga - Camena Fault; SGF: Sfântul Gheorghe Fault; TF: Trotuş Fault. Inset: Tectonic sketch of Romania: 1 = Carpathian orogenic belt; 2 = Focşani-Odobeşti Depression; 3 = Fore-Carpathian zone; 4 = plate-subplate boundary; 5 = subplate - subplate boundary; 6 = strike-slip fault; 7 = active subduction; 8 = Neogene “frozen” subduction; 9 = intra-plate crustal fracture; 10 = (a) crustal and (b) subcrustal earthquake epicenters.
53
Paspati Maria ALTERNATIVE RISK TRANSFER TRANSACTIONS
4.2 Modelling the Catastrophe Bond The goal of this section, given the information provided above, the data presented in
Appendix B, and considering that earthquake hazard in Romania is excluded from the coverage
provided by Lion II Re DAC, is to provide a general types of earthquake catastrophe bond, which
is based on magnitude of earthquakes as a parametric trigger.
4.2.1 Pricing Catastrophe Bonds According to Cox and Pedersen (2000), the difference between corporate and insurance-
based securities, such as catastrophe risk bonds, is that the default risk of the latter is not
correlated with the underlying financial market and economic variables (e.g. interest rate levels
or aggregate consumption) rather than depends on catastrophic events. Consequently, neither
the payments from a catastrophe risk bond nor the bond itself can be counterbalanced by a
portfolio comprised of traditional assets (e.g. traditional bonds or common stocks, the so-called
primitive securities) that already trade in the market.
It is, therefore, evident that the pricing of a CAT bond requires an incomplete market
framework, as it is simpler than the case of significant correlation and offers a variety of
alternative pricing mechanisms that are tied to the specific nature of each market. In an
incomplete market one can construct several different hedging portfolios by selecting the
proper risk-neutral probability measure in order to obtain the price of a derivative.
4.2.2 Methodology Using the abovementioned approach and the theory of equilibrium pricing, in 2007
Zimbidis, Frangos, and Pantelous developed a simple one-period and one more complicated
multi-period model for pricing catastrophe bonds15. This model will be applied in the case of
Romania as well.
The valuation is performed in two stages. The first stage is the estimation of risk
dynamics, i.e. the distribution function of the annual maximum earthquakes of the broader
area of Romania, using the tools of Extreme Value Theory. The statistical analysis of extremes is
a key factor to many of the risk management problems related to Insurance, Reinsurance and
Finance in general. The second stage requires the selection or estimation of the interest rate
dynamics. (Zimbidis, et al, 2007:166-167)
15 In 2015, Shao extended the model by adding a financial risk (inflation rates) and a catastrophe risk (depth). See further Shao, J. (2015). Modelling Catastrophe Risk Bonds. Thesis submitted in accordance with the requirements of the University of Liverpool for the degree of Doctor in Philosophy in Mathematical Science.
54

Paspati Maria ALTERNATIVE RISK TRANSFER TRANSACTIONS
4.3 One period (basic) Model In this subsection the simple one-period model, where the interest rate dynamics are
restricted to constant values of different rates, will be presented. The necessary symbols and
the respective notation are defined as follows:
T: maturity date for the CAT bond.
K: is the face amount of the CAT bond.
r(t): is the risk free rate continuously compounding, up to maturity date (e.g. 1-year
Romanian Treasury Certificates).
e: is the extra premium loading for bearing earthquake risk (normally, this is a positive
quantity reflecting the respective risk aversion of the buyers of such a security).
R(t): is the basic element for the determination of the coupon payment rate for the one
year period as long as a specified catastrophic event does not occur (e.g. 12-month US
LIBOR rate on the bond issuance date ).
M(t): is the maximum magnitude level of the earthquake in the broader area of
Romania. M is a random variable following the distribution obtained in subsection 4.3.4
(see Table 8, page 62). Moreover, M is measured in moment magnitude (Mw) scale16.
PCAT: is the price of the CAT bond at the time of issuance.
C(R; M): is the cash value of the CAT bond at the maturity date depending upon the
value of M.
As we are working in a one-period model, we assume, from this point on, that T = t = 1.
Thus one can simplify the notations as r1; e; R; and M and assume the dynamics of financial
risks (risk-free interest rate, and LIBOR rate) are constant.
Figure 23: The diagram for the one period model
Source: Zimbidis et al, 2007, 169.
16 The magnitude is a number that characterizes the relative size of an earthquake. Magnitude is based on measurement of the maximum motion recorded by a seismograph. Most commonly used scales are (1) local magnitude (ML), commonly referred to as "Richter magnitude", (2) surface-wave magnitude (Ms), (3) body-wave magnitude (Mb), and (4) moment magnitude (Mw). Scales 1-3 have limited range and applicability and do not satisfactorily measure the size of the largest earthquakes. The moment magnitude (Mw) scale, based on the concept of seismic moment, is uniformly applicable to all sizes of earthquakes and measures the size of events in terms of how much energy is released. However it is more difficult to compute than the other types. All magnitude scales should yield approximately the same value for any given earthquake. See further United States Geological Survey, Earthquake Glossary. Available at https://earthquake.usgs.gov/learn/glossary/?term=magnitude.
55
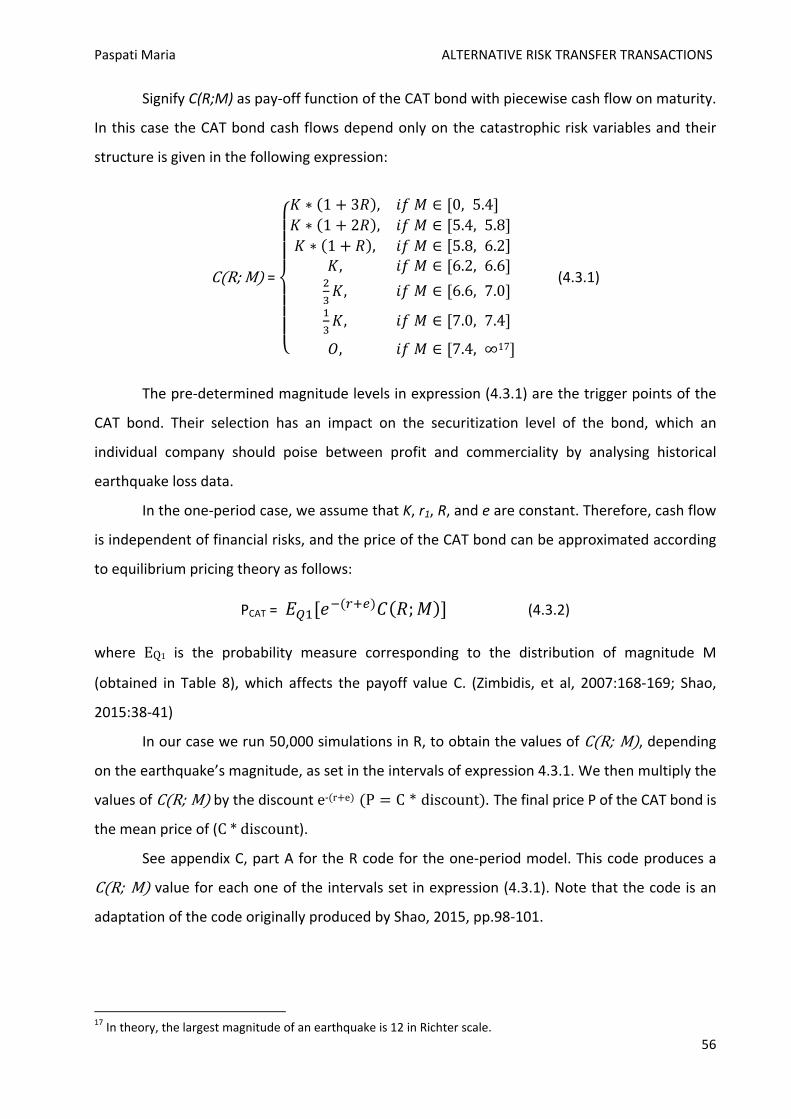
Paspati Maria ALTERNATIVE RISK TRANSFER TRANSACTIONS
Signify C(R;M) as pay-off function of the CAT bond with piecewise cash flow on maturity.
In this case the CAT bond cash flows depend only on the catastrophic risk variables and their
structure is given in the following expression:
C(R; M) =
⎩⎪⎪⎪⎨
⎪⎪⎪⎧𝐾𝐾 ∗ (1 + 3𝑅𝑅), 𝑖𝑖𝑖𝑖 𝑀𝑀 ∈ [0, 5.4]𝐾𝐾 ∗ (1 + 2𝑅𝑅), 𝑖𝑖𝑖𝑖 𝑀𝑀 ∈ [5.4, 5.8]𝐾𝐾 ∗ (1 + 𝑅𝑅), 𝑖𝑖𝑖𝑖 𝑀𝑀 ∈ [5.8, 6.2]
𝐾𝐾, 𝑖𝑖𝑖𝑖 𝑀𝑀 ∈ [6.2, 6.6] 23𝐾𝐾, 𝑖𝑖𝑖𝑖 𝑀𝑀 ∈ [6.6, 7.0]
13𝐾𝐾, 𝑖𝑖𝑖𝑖 𝑀𝑀 ∈ [7.0, 7.4]
𝑂𝑂, 𝑖𝑖𝑖𝑖 𝑀𝑀 ∈ [7.4, ∞17]
(4.3.1)
The pre-determined magnitude levels in expression (4.3.1) are the trigger points of the
CAT bond. Their selection has an impact on the securitization level of the bond, which an
individual company should poise between profit and commerciality by analysing historical
earthquake loss data.
In the one-period case, we assume that K, r1, R, and e are constant. Therefore, cash flow
is independent of financial risks, and the price of the CAT bond can be approximated according
to equilibrium pricing theory as follows:
PCAT = 𝐸𝐸𝑄𝑄1[𝑒𝑒−(𝑟𝑟+𝑒𝑒)𝐶𝐶(𝑅𝑅;𝑀𝑀)] (4.3.2)
where EQ1 is the probability measure corresponding to the distribution of magnitude M
(obtained in Table 8), which affects the payoff value C. (Zimbidis, et al, 2007:168-169; Shao,
2015:38-41)
In our case we run 50,000 simulations in R, to obtain the values of C(R; M), depending
on the earthquake’s magnitude, as set in the intervals of expression 4.3.1. We then multiply the
values of C(R; M) by the discount e-(r+e) (P = C * discount). The final price P of the CAT bond is
the mean price of (C * discount).
See appendix C, part A for the R code for the one-period model. This code produces a
C(R; M) value for each one of the intervals set in expression (4.3.1). Note that the code is an
adaptation of the code originally produced by Shao, 2015, pp.98-101.
17 In theory, the largest magnitude of an earthquake is 12 in Richter scale. 56

Paspati Maria ALTERNATIVE RISK TRANSFER TRANSACTIONS
4.3.1 Generalized Extreme Value (GEV) Distribution for defining extremes in Earthquake Magnitude
Extreme Values Theorem Let X1, X2, . . . , Xn be independent and identically distributed random variables with
cumulative distribution function F, let Mn = max (X1, X2, . . . , Xn) represent the maximum, and
suppose that exist sequences of constants an > 0 and bn ∈ ℝ, such that:
P��𝑀𝑀𝑛𝑛− 𝑏𝑏𝑛𝑛𝑎𝑎𝑛𝑛
� ≤ 𝑧𝑧� → G(z), when z → ∞
where G(z) is a distribution function.
Generalized Extreme Value (GEV) Distribution Richard Von Mises (1954) and A.F. Jenkinson (1955) independently derived the
Generalised Extreme Value distribution (GEV), often denoted G(μ, σ, ξ), whose cumulative
distribution function (CDF) is given by:
G(x; μ, σ, ξ) = exp �− �1 + 𝜉𝜉 � 𝑥𝑥− 𝜇𝜇 𝜎𝜎��+
− 1𝜉𝜉� (4.3.1.1)
By differentiating (4.3.1.1) with respect to x, we could get the probability density
function for GEV as:
g(x; μ, σ, ξ) = 1𝜎𝜎�1 + 𝜉𝜉 �𝑥𝑥−𝜇𝜇
𝜎𝜎�−1− 1𝜉𝜉� exp �− �1 + 𝜉𝜉 �𝑥𝑥−𝜇𝜇
𝜎𝜎� �
−1𝜉𝜉� (4.3.1.2)
where -∞ < μ < +∞, σ > 0 and -∞ < ξ < +∞, are location (position of the GEV mean, shows the
central tendency and range), scale (multiplier that scales function, indicates central tendency
and dispersion) and shape (describes the relative distribution of the probabilities, provides the
dispersion and moments of high order) parameters respectively. The value of the shape
parameter ξ differentiates between the three types of extreme value distribution. When ξ = 0 is
the limit of Eq. (4.3.1.1) as ξ → 0, the model corresponds to the Gumbel distribution. For the
cases ξ > 0 and ξ < 0, Eq. (4.3.1.1) leads to Frechét and Weibull family distributions, respectively.
The GEV parameters need to be estimated beforehand (meaning that the data need to
be pre–processed in order to have a filtered set of extremes – in particular, block, or annual,
maxima Mn,i), so in practice the normalisation constants are ignored and the GEV is fitted
directly to the set of maxima. (Ayuketang Arreyndip & Joseph, 2016:5-6).
57

Paspati Maria ALTERNATIVE RISK TRANSFER TRANSACTIONS
4.3.2 Data pre-processing In the case of the Romanian Cat Bond modelling, the analysis is based on the series of
annual maximum magnitude of the earthquakes in the broader area, over the period 1969-
2018 (see Table 7).
Figure 24 shows a time series plot of the 50 annual maxima, which was produced using
RStudio. It is reasonable to assume that the patterns of variation have stayed constant over the
observed period, which suggests that the data are independent observations from the GEV
distribution.
Table 7: Annual Maximum Magnitude of Earthquakes in Romania
Source: Institutul National de Cercetare Dezvoltare pentru Fizica Pamantului, Romania. n.d.
58

Paspati Maria ALTERNATIVE RISK TRANSFER TRANSACTIONS
Figure 24: Times series scatter plot of the Annual Maximum Magnitude of Earthquakes in Romania
Source: Data analysis in RStudio.
Figure 25: Histogram of the Annual Maximum Magnitude of Earthquakes in Romania
Source: Data analysis in RStudio.
59

Paspati Maria ALTERNATIVE RISK TRANSFER TRANSACTIONS
4.3.3 Using R to estimate the GEV parameters Maximization of the GEV log-likelihood for the data presented in Table 7 leads to the
following estimates:
μ̂ (location estimate) = 4.687832990, σ̂ (scale estimate) = 0.601971476,
ξ� (shape estimate)= -0.005990949,
for which the log-likelihood is 53.33175. The approximate variance-covariance matrix of the
parameter estimates is:
V = �0.009078041 0.002389238 −0.0032335650.002389238 0.004694901 −0.001831653−0.003233565 −0.001831653 0.009868771
�
* Columns, from left to right: location estimate, scale estimate, shape estimate Rows, from top to bottom: location estimate, scale estimate, shape estimate
The diagonals of the variance-covariance matrix correspond to the variances of the
individual parameters of (z, s, m). Computing square roots, the standard errors are 0.09527876
0.06851935, and 0.09934169, for μ, σ, and ξ respectively. Combining estimates and standard
errors, approximate 95 % confidence intervals for each parameter are:
μ̂ ∈ (4.59255423, 4.78311175),
σ̂ ∈ (0.670490826, 0.670490826),
and ξ� ∈ (−0.105332639, 0.093350741)
Greater accuracy of confidence intervals can usually be achieved by the use of profile
likelihood. Figure 26 shows the profile log-likelihood for ξ, from which a 95% confidence
interval is obtained:
Figure 26: Profile log-likelihood of ξ for the Annual Maximum Magnitude of Earthquakes in Romania
Source: Data analysis in RStudio.
60

Paspati Maria ALTERNATIVE RISK TRANSFER TRANSACTIONS
The various diagnostic plots for assessing the accuracy of the GEV mode,l fitted to the
Annual Maximum Earthquakes in Romania data are presented in Figure 27.
Figure 27: Diagnostic plots for GEV fit to the Annual Maximum Magnitude of Earthquakes in Romania
Source: Data analysis in RStudio.
The quantile plot compares the model quantiles against the data (empirical) quantiles.
The fact that it does not deviate from a straight line suggests that the model assumptions are
valid for the data plotted.
The return level plot shows the return period against the return level, and shows an
estimated 95% confidence interval. The return level is the level (in this case magnitude) that is
expected to be exceeded, on average, once every m time points (in this case, 50 years). The
return period is the amount of time expected to wait for the exceedance of a particular return
level. The return level curve converges asymptotically to a finite level as a consequence of the
negative estimate of ξ, though the estimate is close to zero and the respective estimated curve
is close to a straight line. The curve also provides a satisfactory representation of the empirical
estimates, especially once sampling variability is taken into account.
Finally, the corresponding density estimate seems consistent with the histogram of the
data presented in Figure 25. Consequently, all four diagnostic plots provide support to the
fitted GEV model.
61
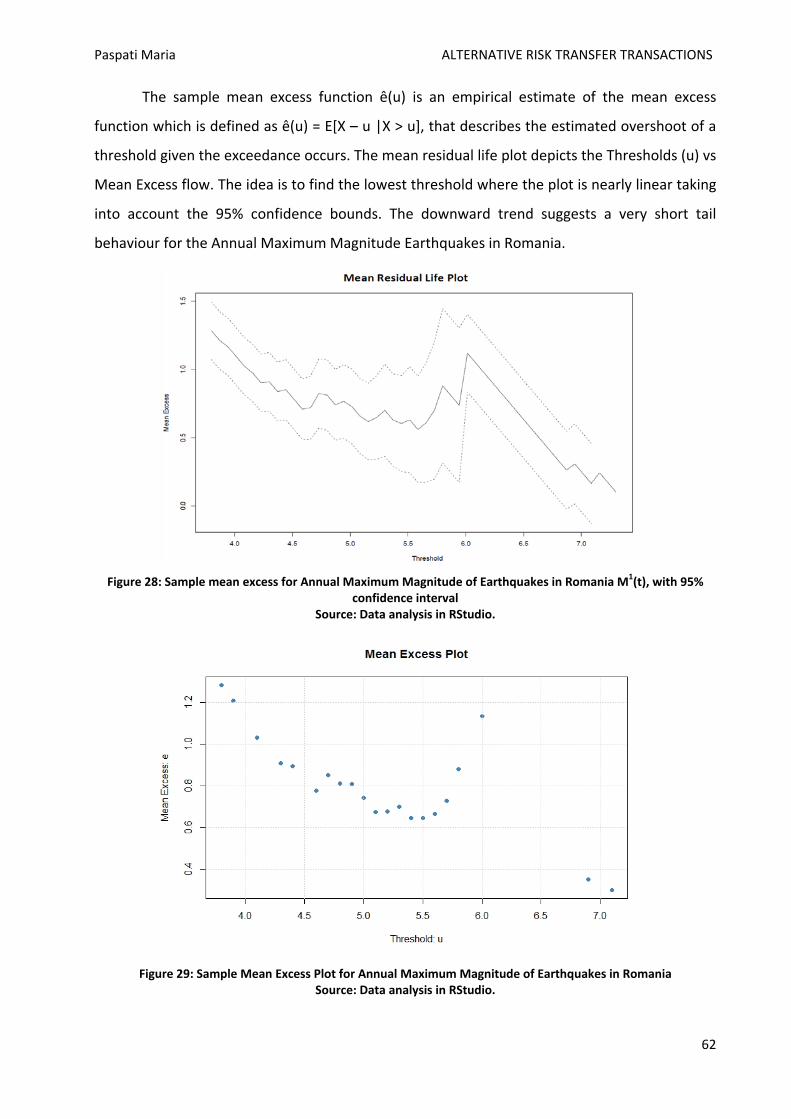
Paspati Maria ALTERNATIVE RISK TRANSFER TRANSACTIONS
The sample mean excess function ê(u) is an empirical estimate of the mean excess
function which is defined as ê(u) = E[X – u |X > u], that describes the estimated overshoot of a
threshold given the exceedance occurs. The mean residual life plot depicts the Thresholds (u) vs
Mean Excess flow. The idea is to find the lowest threshold where the plot is nearly linear taking
into account the 95% confidence bounds. The downward trend suggests a very short tail
behaviour for the Annual Maximum Magnitude Earthquakes in Romania.
Figure 28: Sample mean excess for Annual Maximum Magnitude of Earthquakes in Romania M1(t), with 95%
confidence interval Source: Data analysis in RStudio.
Figure 29: Sample Mean Excess Plot for Annual Maximum Magnitude of Earthquakes in Romania
Source: Data analysis in RStudio.
62

Paspati Maria ALTERNATIVE RISK TRANSFER TRANSACTIONS
Maximization of the GEV returned a rather small ξ� = -0.005990949, which can be
considered equal to zero (0), therefore the limiting distribution for Annual Maximum
Earthquakes in Romania is a type of Gumbel that. However, in our case we use the Standard
Extreme Value distribution, as discussed in section 4.3.1, which groups the three forms of G
(namely Gumbel, Fréchet, Weibull) and has the following cumulative distribution function:
G(z) = P(Mk ≤mk) = exp�− �1 + 𝜉𝜉 � 𝑧𝑧− 𝜇𝜇 𝜎𝜎��− 1𝜉𝜉� (4.3.3.1)
where parameters are μ̂ = 4.687832990, σ̂ = 0.601971476, ξ� = -0.005990949.
Equation (4.3.3.1) gives the probability that the annual maximum magnitude
earthquake Mk will be less than or equal to a magnitude mk.
See Appendix C, part 2 for the sequence of orders in R for obtaining the results
presented in subsections 4.3.2 and 4.3.3.
4.3.4 Calculating the probability measure corresponding to the GEV distribution for Magnitude
For the purpose of obtaining the probability measure corresponding to the GEV
distribution for magnitude M, we use the trial version of EasyFit 5.6 Professional Evaluation
Version™, a software application developed by MathWave Technologies18. This particular
application was chosen for its easiness to use, as it allows to automatically or manually fit a
large number of distributions to the data available. The trial version allows an input of data up
to 5,000 records.
Out of the 50,000 earthquake simulations mentioned above, 5,000 were selected with
respect to the frequency of each magnitude in the original simulations’ sample. Fitting the data
to the GEV, with the parameters μ̂, σ̂, ξ� of the maximized GEV log-likelihood, EasyFit 5.6 returns
the probabilities shown in the following table (see Appendix D for the process):
Table 8: Probabilities of an earthquake of magnitude M occurring within intervals set by expression 4.3.1
Source: Data analysis in EasyFit 5.6.
18 For further information about the company and the application and its trial version, see http://www.mathwave.com/en/home.html, accessed on 15/02/2019.
63
Paspati Maria ALTERNATIVE RISK TRANSFER TRANSACTIONS
Note that, according to expression (4.3.1) our capital may decrease only if the
magnitude of the earthquake exceeds 6.6 Mw. From Table 8, the possibility of an earthquake of
magnitude greater than 6.6 Mw (i.e. 6.7 →∞) occurring in Romania is around 4%, so we can
introduce a CAT bond with 96% capital guarantee which makes it rather attractive for
conservative investors.
4.3.5 Numerical example for the one-period model Consider a one-period model with face value K = RON 4,748 (the equivalent of 1,000€ in
Romanian leu, as of 19/02/2019), interest rate r = 3.16% (yield of 1-year Romanian Treasury
Certificate, issued on December 17th 2018, with maturity date December 16th 2019), Libor rate
R=2.90713% (as of 18/02/201919), and extra risk premium e = 5%, we obtain (according to
expression 4.3.1 and equation 4.3.4) P= RON 4,481.291.
19 Accessed on 19/02/2019, https://www.homefinance.nl/english/international-interest-rates/libor/usdollar/libor-rates-12-months-usd.asp.
64

Paspati Maria ALTERNATIVE RISK TRANSFER TRANSACTIONS
5. Conclusions As the severity of natural catastrophes continues to intensify, in terms of the economic,
environmental and human impacts, disaster risk management is becoming increasingly
significant. The financing of catastrophe risks requires an economically solid and collaborative
scheme among private insurers/reinsurers, capital markets, and governments. As a means to
expand the capacity of the insurance markets and reduce the cost of risk over time, insurers
and reinsurers utilize Alternative Risk Transfer (in essence, financing) mechanisms.
Among the most commonly used ART instruments are index-linked catastrophe loss
instruments such as index-based Catastrophe (CAT) bonds or Industry Loss Warranties (ILWs),
which are mainly characterised by their dependence on an industry loss index and, also, on the
company-specific loss as a result of a natural catastrophe. Almost thirty years since the issuance
of the first Catastrophe (CAT) bond, today the CAT bond market is well developed with an
increasingly relevant secondary market. This rapid growth is the consequence of the rising
number of natural disasters and their economic and social costs over the past decades, as well
as the augmenting number of institutions seeking to alleviate the impact of these catastrophes.
The entry into force of the Solvency II regulatory regime in the European Union compels
insurance companies to evaluating their balance sheet in terms of market consistency,
including the financial options and guarantees embedded in life with-profit funds. The
robustness of these valuations is decisive for insurance companies in order to deliver solid
estimates and proper risk management strategies, in particular for liability-driven products such
as with-profit saving and pension funds. It is without a doubt that, in the future, the
implementation of Solvency II will provide more consistency and transparency in the insurance
industry, as well as strict risk-based capital requirements.
One of the standard approaches to studying risks is using the Extreme Value Theory,
which aims to predict occurrence of rare events (e.g. earthquakes of large magnitude, severe
flooding, tsunamis etc.), outside the range of available data. Zimbidis et al (2007) use Extreme
Value Theory to model the risk dynamics of the magnitude of the earthquakes and,
subsequently, design and implement a CAT bond, under stochastic interest rates and within an
incomplete and arbitrage-free market framework (introduced by Cox and Pedersen in 2000).
Shao (2015) extends their model by bringing in two more risks, a financial one (inflation rates)
and a catastrophe one (earthquake depth).
65

Paspati Maria ALTERNATIVE RISK TRANSFER TRANSACTIONS
Using these examples as a guide, the modeling of a CAT bond covering earthquake
hazard in Romania was attempted. The data-set consists of 50 largest earthquakes in Romania,
from 1969 to 2018, and is analysed with the use of Generalized Extreme Value (GEV)
Distribution, in order to define the extremes in earthquake magnitude. The findings of the data
analysis are consistent with the ones in the abovementioned research, resulting in a rather
attractive CAT bond, with 96% capital guarantee, that can generate sufficient funds for
insurance claims indemnification and post-disaster reconstruction costs coverage, in the event
of a catastrophic earthquake in Romania.
Moreover, the adopted assumptions are quite standard and realistic. To further simplify
the model, all the risks are mutually independent. Since earthquakes are mostly regional, such
events have little effect on global scale, in terms of exchange and production level and the
economic environment. However, the dependence between the different risk variables could
not be used within the chosen methodology and framework for bond pricing, as it constitutes a
separate issue. Note, that only the one-period (basic) model is presented, as the multi-period
(advanced) one exceeds the requirements of a master’s dissertation.
To summarise, the main purpose of this dissertation has been to present the different
ways of financing catastrophic risk, using the instruments provided by Alternative Risk Transfer.
The variety of stakeholders taking part in such tradeoffs results in different quandaries that
should be further addressed. To name a few:
• Imperfect information on the probability and losses correlated with risks from natural
hazards. This affects the premium required by insurers and reinsurers, as well as the
return required by investors.
• Capacity constraints in terms of reinsurance, following a major disaster. In this case
either insurers seek other sources of funds, like CAT bonds, or reinsurers employ such
sources themselves.
• Willingness and capacity of insurers to eliminate most of the basis risk, by adopting a
model-indexed custom policy. Whether they will hold the residual model risk as well,
will depend on the moral hazard magnitude.
• Double role of the government as “reinsurer of last resort” and imposer of taxes on
property owners. It should be investigated whether governments can supplement a
bond/reinsurer combination, on what terms and when (the optimal timing), and how
would they distribute the yields.
66
Paspati Maria ALTERNATIVE RISK TRANSFER TRANSACTIONS
Bibliography - References Andersen, T. (2002). Innovative financial instruments for natural disaster risk management.
Inter-American Development Bank.
Anon. (2001). Risk management: Alternative risk transfer (ART). Center for Insurance and
Financial Planning.
Ayuketang Arreyndip, N., & Joseph, E. (2016). Generalized extreme value distribution models
for the assessment of seasonal wind energy potential of Debuncha, Cameroon. Journal of
Renewable Energy, 2016, Hindawi.
Banks, E. (2004). Alternative risk transfer: integrated risk management through insurance,
reinsurance, and the capital markets. John Wiley & Sons.
Banks, E. 2008. Overview of Risk Management and Alternative Risk Transfer. Handbook of
Finance, vol.III, 39-52.
Ben Ammar, S., Braun, A., & Eling, M. (2015). Alternative Risk Transfer and Insurance-Linked
Securities: Trends, Challenges and New Market Opportunities (No. Bd. 56, p. 162). Institute of
Insurance Economics IVW-HSG.
Bernard, C. (2013). Risk Sharing and Pricing in the Reinsurance Market. In Handbook of
Insurance, Second Edition (ed. Georges Dionne). Springer Science + Business Media New York,
603-626.
Bundesanstalt für Finanzdienstleistungsaufsicht. (2016). Solvency I. Retrieved from
https://goo.gl/LVEpwb, accessed on 20/05/2017.
Carbunar, O. F., & Radulian, M. (2011). Geometrical constraints for the configuration of the
Vrancea (Romania) intermediate-depth seismicity nest. Journal of seismology, 15(4), 579-598.
Commercial Risk Europe. (2017). Captive Survey 2017 – Captives on the Rise. Rubicon Media
Ltd. East Sussex, United Kingdom.
Council of the European Communities. (1973). First Council Directive 73/239/EEC of 24 July
1973 on the coordination of laws, regulations and administrative provisions relating to the
67

Paspati Maria ALTERNATIVE RISK TRANSFER TRANSACTIONS
taking-up and pursuit of the business of direct insurance other than life assurance. Official
Journal L228, 16/08/1973, .0003 - 0019.
Cox, S. H., & Pedersen, H. W. (2000). Catastrophe risk bonds. North American Actuarial Journal,
4(4), 56-82.
Culp, C. L. (ed). (2012). Multiline and Multitrigger Insurance Structures. In Structured Finance
and Insurance: The ART of Managing Capital and Risk. John Wiley & Sons, Inc., Hoboken, NJ,
USA, 577-608.
Culp, C. L., & Heaton, J. B. (2005). The uses and abuses of finite risk reinsurance. Journal of
Applied Corporate Finance, 17(3), 18-31.
Culp, C. L. (2002a). The ART of risk management: alternative risk transfer, capital structure, and
the convergence of insurance and capital markets (Vol. 142). John Wiley & Sons.
Culp, C. L. (2002b). The Revolution in Corporate Risk Management: A Decade of Innovations in
Process and Products. Journal of Applied Corporate Finance, Volume 14 Number 4. Morgan
Stanley, 8-26.
Cummins, J. D., & Weiss, M. A. (2009). Convergence of insurance and financial markets: Hybrid
and securitized risk-transfer solutions. Journal of Risk and Insurance, 76(3), 493-545.
Doherty, N., & Smetters, K. (2005). Moral hazard in reinsurance markets. Journal of Risk and
Insurance, 72(3), 375-391.
European Insurance and Occupational Pensions Authority (n.d.). Solvency II - Going Live!
Retrieved from https://goo.gl/JqA8ll, accessed on 20/05/2017.
Evans, S. Ltd. (2017a). Catastrophe bonds and ILS issuance by trigger and by year. Retrieved
from http://www.artemis.bm/deal_directory/cat_bonds_ils_by_trigger_by_year.html, accessed
on 09/01/2018.
Evans, S. Ltd. (2017b). Catastrophe bonds & ILS issued and outstanding by year. Retrieved from
http://www.artemis.bm/deal_directory/cat_bonds_ils_issued_outstanding.html, accessed on
09/01/2019.
68
Paspati Maria ALTERNATIVE RISK TRANSFER TRANSACTIONS
Evans, S. (2017c). Generali hails “innovative & flexible” Lion II Re catastrophe bond. Retrieved
from http://www.artemis.bm/blog/2017/07/10/generali-hails-innovative-flexible-lion-ii-re-
catastrophe-bond/, accessed on 28/09/2018.
Federal Insurance Office, U.S. Department of the Treasury. (2014). The Breadth and Scope of
the Global Reinsurance Market and the Critical Role Such Market Plays in Supporting Insurance
in the United States - Completed pursuant to Title V of the Dodd-Frank Wall Street Reform and
Consumer Protection Act.
Frenz, T. (2012). The Art of Developing Alternative Risk Transfer (ART) Solutions Under the
Ambit of the Shari’a. 2nd ISRA Colloquium “Islamic Finance in a Challenging Economy: Moving
Forward”. Sasana Kijang, Bank Negara Malaysia, 27th November 2012.
Gatzert, N., Pokutta, S., & Vogl, N. (2014). Convergence of Capital and Insurance Markets:
Consistent Pricing of Index-Linked Catastrophic Loss Instruments. Working Paper, Friendrich-
Alexander University Erlangen-Nurnberg (FAU).
GeoNet - Geological hazard information for New Zealand. (n.d.). Earthquake Glossary. Retrieved
from https://www.geonet.org.nz/earthquake/glossary, accessed on 15/02/2019.
Guy Carpenter & Company, LLC. (2017). GC Securities Completes First Ever Indemnity Triggered
Multi-Europe Peril Only 144A Catastrophe Bond for Assicurazioni Generali S.p.A. Retrieved from
https://goo.gl/yNGvqQ, accessed on 11/10/2017.
Hartwig, R. P., & Wilkinson, C. (2007). An Overview of the Alternative Risk Transfer Market.
Handbook of International Insurance, Springer US, 925-952.
Horizon, The EU Research & Innovation Magazine. (2014). Mapping Europe’s earthquake risk.
Retrieved from https://horizon-magazine.eu/article/mapping-europe-s-earthquake-risk.html,
accessed on 15/02/2019.
Institutul National de Cercetare Dezvoltare pentru Fizica Pamantului (INCDFP), Romania. (n.d.).
Catalog ROMPLUS. Retrieved from https://web.infp.ro/#/romplus, accessed on 15/02/2019.
Insurance Information Institute, Inc. (2018). Background on: Captives and other risk-financing
options. Retrieved from https://www.iii.org/article/background-on-captives-and-other-risk-
financing-options, accessed on 20/07/2018.
69

Paspati Maria ALTERNATIVE RISK TRANSFER TRANSACTIONS
International Risk Management Institute, Inc. (IRMI). (2017). Moral hazard. Glossary of
Insurance & Risk Management Terms. Retrieved from https://www.irmi.com/online/insurance-
glossary/terms/m/moral-hazard.aspx, accessed on 03/04/2017.
Ishaq, A. (2005). Reinsuring for catastrophes through industry loss warranties–a practical
approach. Casualty Actuarial Society Forum, 75-91.
Kampa, C. (2010). Alternative Risk Transfer: The Convergence of the Insurance and Capital
Markets - A Three Part Series. Insurance Studies Institute, Elk Crossing, Keystone, USA.
Kessler, T. (2016). 2016 Standing Committee on Finance Forum - Disaster Risk Finance Insurance
incl. Cat and Resilience Bonds. Swiss Re Global Partnerships, 5 September 2016, Manila.
Klein, R. W., & Wang, S. (2009). Catastrophe risk financing in the United States and the
European Union: A comparative analysis of alternative regulatory approaches. Journal of Risk
and Insurance, 76(3), 607-637.
Kunkel, C. (2003). Risk Retention Groups. Gallagher Captive Services, Inc. Retrieved from
https://www.captive.com/art-market/captive-associations/icarfia/rrg, accessed on 06/04/2017.
Kunreuther, H., Kleindorfer, P., Grossi, P. (2005). The Impact of Risk Transfer Instruments: An
Analysis of Model Cities. In Grossi, P., Kunreuther, H. (eds) Catastrophe Modeling: A New
Approach to Managing Risk. Springer Science + Business Media, Inc, Boston, 189-208.
Lakdawalla, D., & Zanjani, G. (2012). Catastrophe bonds, reinsurance, and the optimal
collateralization of risk transfer. Journal of Risk and Insurance, 79(2), 449-476.
Marmureanu, G., Cioflan, C. O., & Marmureanu, A. (2011). Intensity seismic hazard map of
Romania by probabilistic and (neo) deterministic approaches, linear and nonlinear analyses.
Rom. Rep. Phys, 63(1), 226-239.
Marsh LLC and the Risk and Insurance Management Society, Inc. (2018). The Captive Landscape
- 50 Years of Risk Financing Innovation, How organizations around the world use their captive
insurers. New York, United States of America.
Marsh LLC and the Risk and Insurance Management Society, Inc. (2017). The Captive Landscape
- Captives at the Core: The Foundation of a Risk Financing Strategy. New York, United States of
America.
70
Paspati Maria ALTERNATIVE RISK TRANSFER TRANSACTIONS
Meyers, G. (1998). A Buyer’s Guide for Options on a Catastrophe Index. Casualty Actuarial
Society Proceedings, 85(162/163), 187-210.
Palumbo. Insurance Associates. (n.d.). What is a Risk Retention Group? Retrieved from
http://www.palumboinsassoc.com/userfiles/files/faqs.pdf, accessed on 25/12/2016.
Radulian, M., Mandrescu, N., Panza, G. F., Popescu, E., & Utale, A. (2000). Characterization of
seismogenic zones of Romania. Pure and Applied Geophysics, 157, 57–77. Birkhäuser, Basel.
Shang, K. (2013). Understanding Contingent Capital. Casualty Actuarial Society. Arlington,
United States of America.
Shao, J. (2015). Modelling Catastrophe Risk Bonds. Thesis submitted in accordance with the
requirements of the University of Liverpool for the degree of Doctor in Philosophy in
Mathematical Science.
Toma-Danila, D., Cioflan, C. O., Ionescu, C., Tiganescu, A. (2018). The Near Real-time System for
Estimating the Seismic Damage in Romania (SEISDARO). Recent Upgrades and Results. In 16th
European Conference on Earthquake Engineering, 18-21 June 2018, Thessaloniki, Greece.
Walker, S., Fulcher, G., Green, P., et al. (1999). ART and Insurance Derivatives Working Party.
GIRO Convention, October 1999, 289-386.
Weber, C. (2011). Insurance Linked Securities - The Role of the Banks. Gabler Verlag / Springer
Fachmedien Wiesbaden GmbH.
Wieczorek-Kosmala, M. (2010). Innovative Design of Insurance Risk Transfer–a Corporate
Perspective. In Managing and Modeling of Financial Risks. Book of Proceedings from 5th
International Scientific Conference, 453-462.
Willis Property Resource Group. (2007). Perspectives – Insurance Sidecars. London, United
Kingdom.
World Bank Group. (2016). Europe and Central Asia Country Risk Profiles for Floods and
Earthquakes. World Bank, Washington, DC.
World Health Organization. (2010). Romania: Seismic Hazard Distribution Map. Country
Emergency Preparedness Programme in the European Region.
71
Paspati Maria ALTERNATIVE RISK TRANSFER TRANSACTIONS
Zimbidis, A. A., Frangos, N. E., & Pantelous, A. A. (2007). Modeling earthquake risk via extreme
value theory and pricing the respective catastrophe bonds. ASTIN Bulletin: The Journal of the
International Actuarial Association (IAA), 37(1), 163-183.
72

Paspati Maria ALTERNATIVE RISK TRANSFER TRANSACTIONS
Appendix A
73

Paspati Maria ALTERNATIVE RISK TRANSFER TRANSACTIONS
Earthquake glossary
• Active fault: A fault that is likely to have another earthquake sometime in the future.
Faults are commonly considered to be active if they have moved in the last 10,000 years.
• Crust: The outermost layer of the earth, ranging from 10 to 65 km in thickness
worldwide. The uppermost 15-35 km of crust is brittle enough to produce earthquakes.
• Epicentre: The point on the earth's surface vertically above the hypocentre.
• Fault: A fracture, along which the blocks of crust on either side have moved relative to
one another in a direction parallel to the fracture.
• Fissure: A long narrow crack in the ground caused by earthquakes.
• Focal depth: The depth of an earthquake's hypocentre.
• Focus: Same as Hypocentre.
• Hypocentre: The point on the fault plane where the rupture starts.
• Intensity: A measure of how strongly an earthquake manifests at the surface, based on
its observable effects on people, buildings and the environment. Intensity is usually ranked
using the 12 point Modified Mercalli Intensity (MMI) scale.
• Magnitude: A measure of the energy released by an earthquake at its source.
Magnitude is commonly determined from the shaking recorded on a seismograph. Each unit of
magnitude on the scale represents a substantial increase in energy, for example a magnitude 5
releases 30 times more energy than a magnitude 4.
• MMI: An abbreviation for Modified Mercalli Intensity (see Intensity above).
• Subduction zone: The area or zone where two tectonic plates come together, one riding
over the other.
• Tectonic uplift: Elevation of the ground caused by plate movement.
(GeoNet - Geological hazard information for New Zealand, n.d.)
74

Paspati Maria ALTERNATIVE RISK TRANSFER TRANSACTIONS
Appendix B
75
Paspati Maria ALTERNATIVE RISK TRANSFER TRANSACTIONS
Seismicity of Romania
Intermediate - depth seismic zone Vrancea subcrustal Zone (VR): The Vrancea region is a complex seismic region of
continental convergence characterized by (at least) three tectonic units in contact: the East
European plate, Intra-Alpine and Moesian subplates. The strongest seismic activity of Romania
concentrates at intermediate depths (60–200 km) in an almost vertical downgoing high-velocity
lithospheric body. Enhanced activity is observed within two depth ranges – 80 to 100 km, and
120 to 160 km, respectively.
Normal - depth seismic zones East Vrancea Zone (EV): The shallow seismicity in the Vrancea region spreads diffusely
eastward relative to the Carpathians arc bend, in the strip delimited by the Peceneaga-Camena
fault to the north and Intramoesian fault to the south (so-called Black Sea subplate). It consists
of only moderate-size earthquakes, not exceeding magnitude Mw=6. Bursts of seismic activity –
earthquake sequences or swarms – are relatively common in this zone (e.g., in Râmnicu Sărat –
Focşani region, in Vrâncioaia area).
Făgăraş – Câmpulung Zone (FC): It is sited in the eastern part of the Southern
Carpathians. It is characterized by shocks as large as Mw~6.5, which are the largest shallow
earthquakes recorded on the Romanian territory. The last major event occurred on January 26,
1916 (Mw=6.4), and was followed by significant aftershock activity. The epicenter distribution
outlines two clusters: one located to the west, which includes the largest shocks (Mw~6), the
other one located to the east (Sinaia region), with smaller events (Mw<5).
Danubian Zone (DA): The seismogenic Danubian Zone represents the western extremity,
adjacent to the Danube River, of the orogenic unit of the Southern Carpathians. The rate of
seismic activity is relatively high, especially at the border and beyond the border with Serbia,
across the Danube river. The magnitude does not exceed Mw=5.6.
Banat Zone (BA): The contact between the Panonnian Depression and the Carpathian
orogen lies entirely along the western part of the Romanian border. The seismicity of the Banat
zone is characterized by many earthquakes with magnitude Mw>5, but not exceeding 5.6. In
general, the larger shocks, which are frequently followed by aftershock sequences, occur in
clusters (within a few month intervals).
76

Paspati Maria ALTERNATIVE RISK TRANSFER TRANSACTIONS
Crişana-Maramureş Zone (CM): The historical earthquake catalogues report the
occurrence of events greater than magnitude Mw=6 in Crişana-Maramureş. Several damaging
earthquakes with magnitude above Mw=5 are also reported on the basis of historical
information.
Bârlad Depression (BD): The Bârlad Depression is a subsiding depression situated to the
NE of the Vrancea region on the Scythian platform, and it represents the prolongation towards
the NW of the Predobrogean Depression. Only moderate-size events are observed, not
exceeding Mw=5.6.
Predobrogean Depression (PD): This seismogenic zone belongs to the southern margin
of the Predobrogean Depression, following the Sfântul Gheorghe fault alignment. Roughly, the
seismicity and focal mechanism characteristics are similar to those outlined for the Bârlad
Depression, e.g. the moderate seismic activity (Mw≤5.3), clustered especially along the Sfantul
Gheorghe fault, and the extensional regime of the deformation field. This consistently reflects
the affiliation of the two zones to the same tectonic unit – the Scythian platform.
Intramoesian Fault (IM): The Intramoesian fault crosses the Moesian platform in a SE–
NW direction, separating two distinct sectors with different constitution and structure of the
basement. Although it is a well-defined deep fault, reaching the base of the lithosphere, and
extending southeast to the Anatolian fault region, the associated seismic activity is scarce and
weak (only two events above magnitude Mw=5, both reported in the instrumental period). The
focal depth (whenever it can be constrained) has relatively large values (h~35 km), suggesting
active processes in the lower crust or in the upper mantle.
Transylvanian Depression (TD): This seismogenic zone is defined only on the basis of
historical information. The seismic activity is mostly absent at present; nevertheless, several
earthquakes with magnitude above Mw=5 (a couple of events with Mw > 5.5) have been
reported on the basis of historical documents, which notify important damaging effects in
Transylvania. (Institutul National de Cercetare Dezvoltare pentru Fizica Pamantului, Romania,
n.d.)
77

Paspati Maria ALTERNATIVE RISK TRANSFER TRANSACTIONS
Figure B.1 Map of Romania showing Annual Maximum Magnitude of Earthquakes, 1969-2018 Source: Data processing in ArcGIS.
78

Paspati Maria ALTERNATIVE RISK TRANSFER TRANSACTIONS
Figure B.2 Map of Romania showing earthquakes with Mw ≥ 4 and seismic sources according to the BIGSEES Catalog (NIEP, 2017), results of the probabilistic seismic hazard
analysis of the RO-RISK Project and seismic stations with real-time transmission at the Romanian Seismic Network (RSN) Source: Toma-Danila et al. 2018. 3.
79

Paspati Maria ALTERNATIVE RISK TRANSFER TRANSACTIONS
Figure B.3 Seismic Hazard Distribution Map Source: World Health Organization. 2010.
80

Paspati Maria ALTERNATIVE RISK TRANSFER TRANSACTIONS
Figure B.4 Top Epicentral map of the earthquakes on the Romania territory and the Vrancea seismic source location. The crustal events ( h < 60 km) are plotted in red ; the subcrustal events ( h ≥ 60 km) are plotted in black
Source: Carbunar, O. F., & Radulian, M. (2011). 581.
81

Paspati Maria ALTERNATIVE RISK TRANSFER TRANSACTIONS
Appendix C
82

Paspati Maria ALTERNATIVE RISK TRANSFER TRANSACTIONS
Part 1 – R code for producing h=50,000 simulations in RStudio Version 1.1.463 – © 2009-2018 RStudio, Inc.
> setwd("C:/Users/MP/Desktop") # Setting the working directory
> library(fExtremes) # Loading the library needed for the analysis
> T<-1 # time period
> m <-50000 # simulation time h
> e <-0.05 # extra risk premium
> r<-0.0316 # risk free interest rate
> R<-rep(0.029,m) # LIBOR rate
> K=4748 # face value of the CAT bond
## generate m cases for Magnitude
> Mag <- rgev(m, -0.005990949, 4.687832990, 0.601971476)
> C=rep(NA,m) # value of payoff function
# Price payoff function PCAT is
> for (i in 1:m){if(Mag[i]<5.4) C[i]=K*(1+3*R)
+ if(Mag[i]<5.8 && Mag[i]>=5.4) C[i]=K*(1+2*R)
+ if(Mag[i]<6.2 && Mag[i]>=5.8) C[i]=K*(1+R)
+ if(Mag[i]<6.6 && Mag[i]>=6.2) C[i]=K
+ if(Mag[i]<7.0 && Mag[i]>=6.6) C[i]=(2/3)*K
+ if(Mag[i]<7.4 && Mag[i]>=7.0) C[i]=(1/3)*K
+ if(Mag[i]>7.4) C[i]=0}
> write.csv2(Mag, file="Mag.csv") # Saving the Results for magnitude M in a csv file in our
working directory
> write.csv2(C, file="C.csv") # Saving the Results for payoff value C in a csv file in our
working directory
83
Paspati Maria ALTERNATIVE RISK TRANSFER TRANSACTIONS
Part 2 – Data processing in RStudio Version 1.1.463 – © 2009-2018 RStudio, Inc. # Loading libraries needed for the analysis
> library(extRemes) # functions for performing extreme value analysis
> library(ismev) # includes functions like: maxima/minima, order statistics, peaks over thresholds, point processes > library(evd) # functions for maximum likelihood estimates for maxima models
> library(evmix) # maximum likelihood inference and model diagnostics for univariate
stationary extreme value mixture models
# Typing data into R Console:
> RomaniaMax=c(5.2, 4.7, 3.8, 3.8, 6.0, 4.9, 5.3, 3.9, 7.4, 5.2, 5.3, 5.1, 5.5, 4.3, 5.6, 4.7, 5.8, 7.1,
4.8, 4.6, 4.4, 6.9, 5.7, 4.6, 4.4, 4.3, 4.1, 4.6, 4.7, 4.7, 5.3, 5.0, 4.9, 4.7, 4.7, 6.0, 5.5, 4.7, 4.4, 4.3,
5.4, 4.6, 4.9, 4.4, 5.2, 5.7, 4.3, 5.6, 4.8, 5.8)
# Setting up a year counter (from 1969 to 2018):
> year=seq(1969,2018,1)
# Producing the plots shown in Figures 24 and 25, page 59:
> plot(RomaniaMax~year,type='b') # Scatter Plot > hist(RomaniaMax) # Histogram
# Fitting the data in Generalized Extreme Value Distribution
> a<-gev.fit(RomaniaMax) #setting object a as the GEV fitted distribution of our data $conv # The convergence code, a zero indicates successful convergence [1] 0 $nllh # The negative logarithm of the likelihood evaluated at the maximum likelihood estimates [1] 53.33175 # maximized log-likelihood $mle # maximized log-likelihood estimators for parameters μ, σ, ξ [1] 4.687832990 0.601971476 -0.005990949 $se # standard errors of parameters μ, σ, ξ [1] 0.09527876 0.06851935 0.09934169
84

Paspati Maria ALTERNATIVE RISK TRANSFER TRANSACTIONS
> a$cov # produces the covariance matrix of the GEV distribution
[,1] [,2] [,3]
[1,] 0.009078041 0.002389238 -0.003233565
[2,] 0.002389238 0.004694901 -0.001831653
[3,] -0.003233565 -0.001831653 0.009868771
> gev.profxi(a, -0.105332639, 0.093350741) # Produces profile log-likelihood of shape para
meter. “a” the object returned by gev.fit, followed by the lower and upper bound of the 95 % confidenc
e interval of the shape parameter
> gev.diag(a) # produces the diagnostic plots for assessing the accuracy of the GEV model
> mrl.plot(RomaniaMax, umin = min(RomaniaMax), umax = max(RomaniaMax) - 0.1, + conf = 0.95, nint = 100) # produces the sample Mean Residual Life plot, includes
95% confidence bounds for the mean excess
> mePlot(RomaniaMax, doplot = TRUE, labels = TRUE) # produces the Sample Mean Excess
Plot
85

Paspati Maria ALTERNATIVE RISK TRANSFER TRANSACTIONS
Appendix D
86
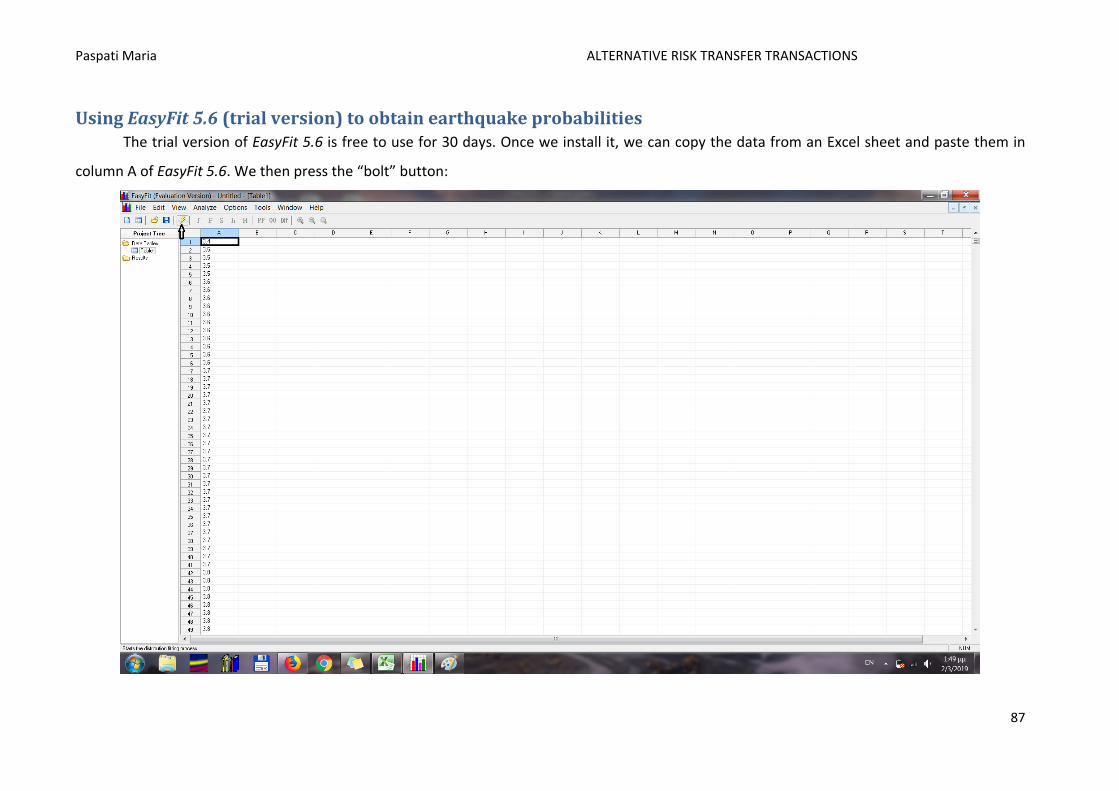
Paspati Maria ALTERNATIVE RISK TRANSFER TRANSACTIONS
Using EasyFit 5.6 (trial version) to obtain earthquake probabilities The trial version of EasyFit 5.6 is free to use for 30 days. Once we install it, we can copy the data from an Excel sheet and paste them in
column A of EasyFit 5.6. We then press the “bolt” button:
87

Paspati Maria ALTERNATIVE RISK TRANSFER TRANSACTIONS
We click “OK” on the pop up window in order for the application to run the available distributions and fit them to our data:
88

Paspati Maria ALTERNATIVE RISK TRANSFER TRANSACTIONS
Once the fitting is done, we get the following:
• In “Graphs” tab: on the left hand-side of the screen a column with all the available distributions (we choose Generalized Extreme
Value Distribution), a graph of the chosen distribution, as well as a smaller window on the right top corner with the parameters of
the distribution. Note that in EasyFit 5.6 k is the ξ parameter of our analysis. Moreover, one can change the parameters,
accordingly. In our case we copy-paste the μ̂, σ̂ and ξ� estimates of the maximized log-likelihood of GEV that we obtained from R and
click the green “tick” button for the fitting.
89
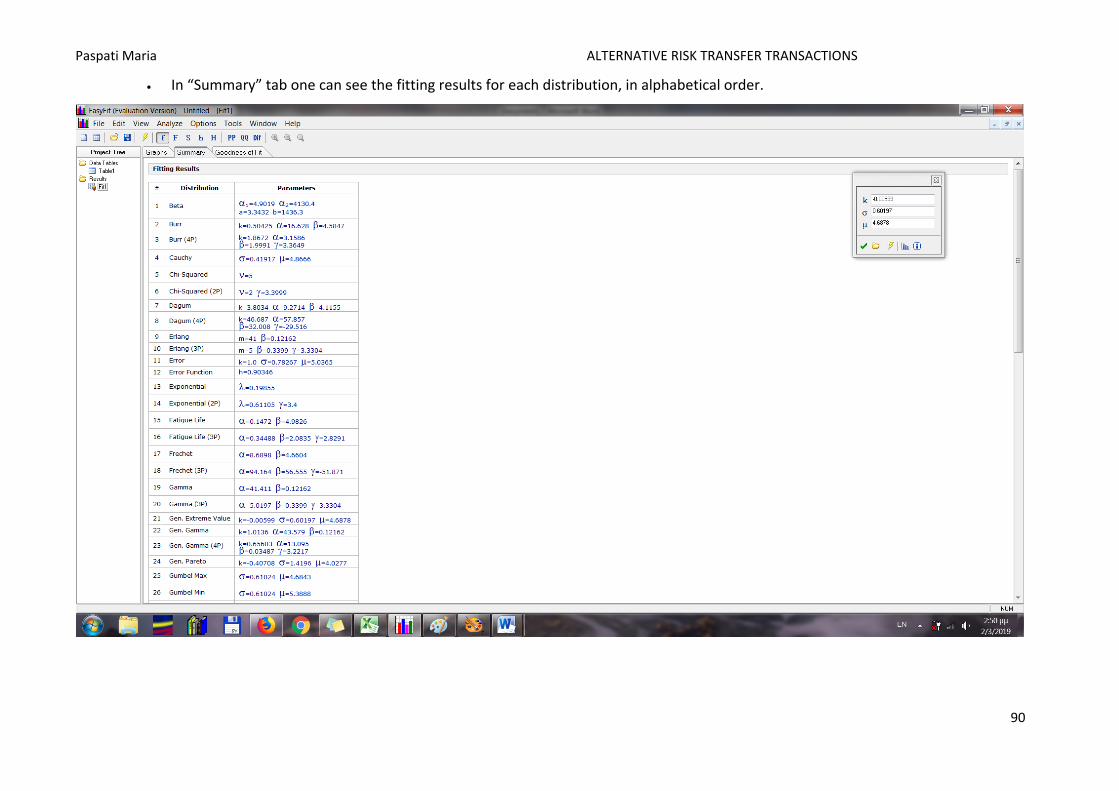
Paspati Maria ALTERNATIVE RISK TRANSFER TRANSACTIONS
• In “Summary” tab one can see the fitting results for each distribution, in alphabetical order.
90

Paspati Maria ALTERNATIVE RISK TRANSFER TRANSACTIONS
• In “Goodness of Fit” tab one can check which is the best fitting distribution, according to the following probability tests:
Kolmogorov-Smirnov, Anderson-Darling, and Chi-Squared. By clicking to each test title we get the rank from best- to worst-fitting,
of each distribution. In our case GEV is ranked as no 1 in the Kolmogorov-Smirnov test.
91

Paspati Maria ALTERNATIVE RISK TRANSFER TRANSACTIONS
Above the tabs area, and next to the “bolt” button, one can check the Probability Distribution Function (“f” button), Cumulative
Distribution Function (“F” button), Survival Function (“S” button), Hazard Function (“h” button), Cumulative Hazard Function (“H” button), P-P Plot
(button “PP”), Quality Plot (“QQ” button), and Probability Difference (“Dif” button) for any chosen distribution. Each plot can be saved as an
image by right-clicking in the plot area.
Once we set our μ̂, σ̂ and ξ� parameters, we return on the “Graphs” tab, right-click on the “Gen. Extreme Value” on the left hand-side
column and then click on StatAssist in the drop-down menu.
92

Paspati Maria ALTERNATIVE RISK TRANSFER TRANSACTIONS
The three tabs in the new window are:
• “Graphs”: the Probability Density Function curve.
93
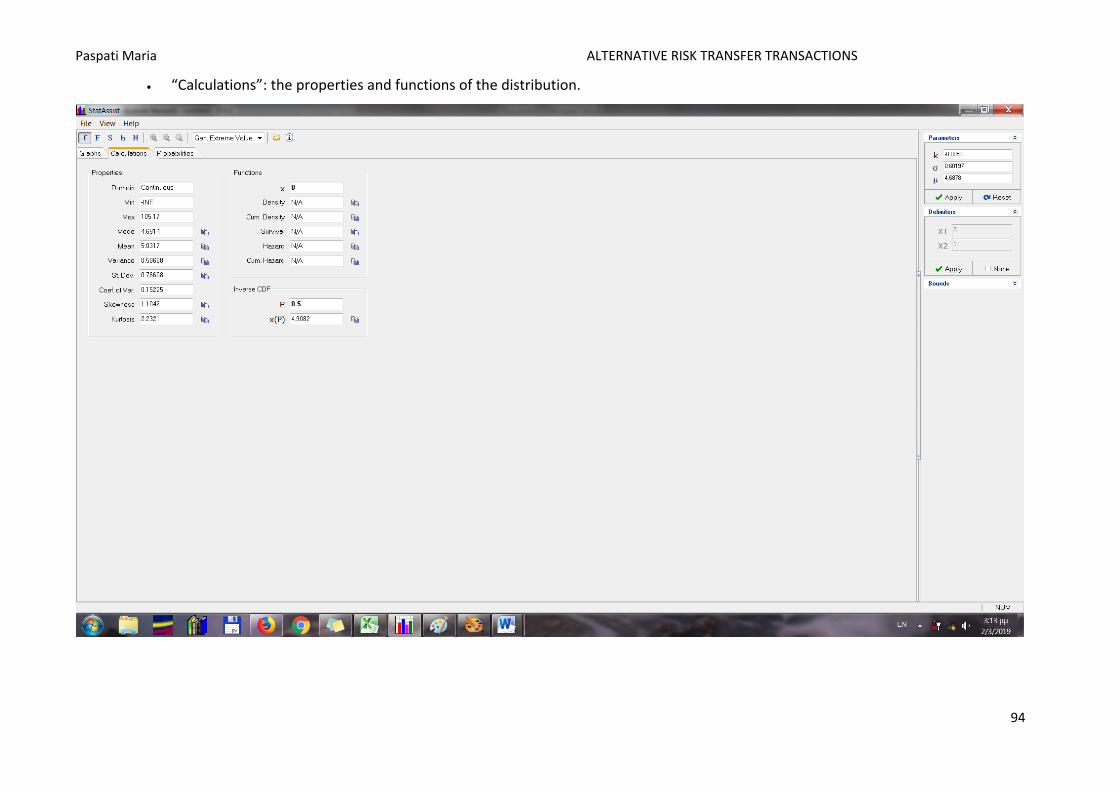
Paspati Maria ALTERNATIVE RISK TRANSFER TRANSACTIONS
• “Calculations”: the properties and functions of the distribution.
94

Paspati Maria ALTERNATIVE RISK TRANSFER TRANSACTIONS
• “Probabilities” the probabilities of the distributions, according to an input of our choice. We click “Delimiters” on the right, then the
“None” button and the “Two Delimiters” options.
95

Paspati Maria ALTERNATIVE RISK TRANSFER TRANSACTIONS
The X1 and X2 fields, under “Delimiters”, are now active and we can write the lower (X1) and upper (X2) limits of our magnitudes interval.
We then press the “Apply” button and get the probabilities for each interval. We follow the same procedure until we obtain the “X1<X<X2”
probabilities for all the intervals set in expression 4.3.1, page 43.
96