alternative reducing agents in metallurgical processes...
TRANSCRIPT

RESEARCH ARTICLE
Alternative Reducing Agents in Metallurgical Processes:Devolatilization of Shredder Residue Materials
Samira Lotfian1 • Hesham Ahmed1,2 • Caisa Samuelsson1
� The Author(s) 2016. This article is published with open access at Springerlink.com
Abstract Plastic-containing shredder residue material has
the potential to be used as an alternative reducing agent in
nonferrous bath smelting processes. This would lead to not
only decreased dependency on primary sources such as coal
or coke but also to an increase in the efficiency of utilization
of secondary sources. This calls for systematic scientific
investigations, wherein these secondary sources are com-
pared with primary sources with respect to devolatilization
characteristics, combustion characteristics, reactivity, etc.
As a first step, in this paper, devolatilization characteristics
of plastic-containing shredder residue material (SRM) are
compared to those of coal using thermogravimetric analysis.
Proximate analysis has shown that SRMmainly decomposes
by release of volatiles, while coal shows high fixed carbon
content, which is reported to contribute to reduction reac-
tions. To study the reduction potential of the evolved mate-
rials, composition of evolved off-gas was continuously
monitored using quadrupole mass spectroscopy. The com-
position of volatiles shows H2, CO, and hydrocarbons which
are known to have reduction potential. Therefore, it is
essential that SRM would be used in a process that could
utilize the evolved volatiles for reduction. Furthermore, to
understand the potentials of different plastic materials as
reducing agents, the devolatilization mechanisms and vola-
tile composition of three common plastics, namely, poly-
ethylene, polyurethane, and polyvinylchloride and their
mixtures have been studied. The results show the interaction
between the plastics within the binary and ternary mixtures.
Similar phenomena may occur during devolatilization of
SRM, which contains different type of plastics.
Keywords Devolatilization � Shredder residue material �Plastic � Coal � Thermogravimetry � Alternative reducing
agent
Introduction
Shredder residue material (SRM) is the residue from the
shredding of end-of-life equipment such as automotive or
discarded electrical and electronic equipment [1]. End-of-
life equipment is fed into hammer mills, which reduces all
parts in size; these parts are then separated using an array
of processes such as air classification, magnetic and eddy
current separators into three major streams: ferrous, non-
ferrous scraps, and a light fraction which mainly consist of
plastics called SRM. Ferrous and nonferrous fractions are
recycled in metallurgical plants for recovery of metals [2].
The fraction with low metal value and high fraction of
plastics is considered to be more problematic due to its
complexity and low economic value. Unfortunately, con-
ventional mechanical recycling which is common choice
for recycling of packing materials (e.g., polyethylene
terephthalate or high density polyethylene) is not applica-
ble to SRM. This is due to the fact that in electronic
equipment, 15–20 different types of plastics may be used
The contributing editor for this article was Brajendra Mishra.
& Samira Lotfian
Hesham Ahmed
Caisa Samuelsson
1 MiMer, Lulea University of Technology, 97187 Lulea,
Sweden
2 Central Metallurgical Research & Development Institute
(CMRDI), Cairo, Egypt
123
J. Sustain. Metall.
DOI 10.1007/s40831-016-0094-0

containing a variety of plasticizers, colorants, flame retar-
dants, and fillers, in addition to a fraction of metals and
ceramics [3]. One way to utilize this material is as a
reducing agent in metallurgical processes. Plastics are
composed of long polymeric chains of carbon and hydro-
gen; for this reason, they are potential candidates to sub-
stitute the traditionally used reducing agents [4]. Utilizing
residue materials in general and, specifically SRM in
metallurgical processes not only reduces the dependency
on the fossil coal, but can also lead to a more sustainable
way to manage these materials [5, 6].
The usage of plastic materials as a source of reducing
agent in the iron and steel-making industry has been
reported both in research and on the industrial level.
[1, 4, 7, 8] JFE Steel in Japan has reported the use of plastic
in their blast furnace since 1996. Plastic injection has been
developed by Bremer Stahlwerke in Germany, with more
than 50,000 tons of plastics injected in their blast furnace
[4]. However, one limitation in using plastic-containing
residue material for iron making is the presence of asso-
ciated impurity metals such as copper, which is undesirable
in the iron-making process [1]. Such restrictions do not
apply for nonferrous bath-smelting processes, which makes
them appealing for utilization of SRM. For nonferrous
processes, in which coal is used as a reductant, it is known
that coal contributes to reduction through the gasification
reaction of carbon in char [9, 10]. However, plastics are
known to decompose by low amount of char and high
amount of volatiles. Studies on the utilization of plastic
material in blast furnace reported generation of C1–C4
hydrocarbons, H2, and CO, which can participate in
reduction reactions [4, 11]. Thus, prior to utilizing SRM as
an alternative reducing agent, a deep understanding of the
thermal decomposition of SRM in comparison with coal as
current reducing agent is needed for process optimization.
The present paper is devoted to studying the
devolatilization of shredder residue material in comparison
with coal using a thermogravimetric analyzer. In order to
investigate the devolatilization mechanism, the composi-
tion of volatiles released during devolatilization is deter-
mined using quadrupole mass spectroscopy. SRM consists
of a mixture of different plastic materials and other
impurity elements, which brings heterogeneity and com-
plexity to its devolatilization. Therefore, to gain a better
understanding on potential of plastic materials as reducing
agent, devolatilizations of three common plastics, namely,
polyethylene (PE), polyvinyl chloride (PVC), polyurethane
(PU), and their mixture have been studied.
Theoretical Background
Depending on the molecular arrangement and bond energies,
plastic materials have different thermal decomposition
behaviors. Among the suggested number of decomposition
mechanisms, themost commonmechanisms are random-chain
scission, in which chain scission occurs at apparently random
locations in polymer chains; and crosslinking, in which bonds
are created between two adjacent polymer chains [12].
PE is one of the most commonly used thermoplastics,
composed of a long chain of ethylene monomers (repeated
units of –(CH2–CH2)–). Bond breakage in PE occurs with
random scission. Thermoplastic materials go through a
molten stage during thermal decomposition. PE devolati-
lizes by bubble formation, which moves toward the surface
and releases light products [13]. PU is a nitrogen-contain-
ing polymer; consisting of repeated units of –NH–COO–.
The two main constituents of PU are isocyanate and polyol.
The major breakdown mechanism in PU is the scission of
the polyol–isocyanate bond, to form gaseous isocyanates,
and liquid polyols. A further step is the dimerization of the
isocyanate to carbon dioxide [14, 15]. PVC is a chlorine-
containing polymer with repeated units of –(CH2–CHCl)–.
Thermal decomposition of PVC proceeds in two distinct
stages. Up to 360 �C, dehydrochlorination is the main
reaction, accompanied by release of HCl, giving a
remaining structure of polyene. Above 360 �C, structuralbreakdown of remaining polyene structure occurs, resulting
in formation of hydrocarbons and residual char [16].
Materials and Methods
A plastic-containing SRM (generated from shredding elec-
trical and electronic equipment) and a coal sample as refer-
ence material for comparison were selected. Three individual
plastics were selected, namely PE, PU, and PVC. SRM and
individual plastics were crushed to less than 0.5 mm, and the
coal sample was pulverized to less than 38 lm. Crushing the
SRM particles to less than 0.5 mm leads to segregation using
the current method, due to different grinding abilities of
contained materials. Devolatilization of coal sample with
particle sizes ranging from 38 lm up to 0.5 mm has been
studied; no significant differences in devolatilization of dif-
ferent particle sizes were observed.
Characterization
Proximate and ultimate analyses based on standard meth-
ods1 were carried out for all samples, by the certified
1 Standards for proximate analysis of coal: Moisture SS 187155, ash
SS 185157, volatile SS-ISO 562:2010. Standards for proximate
analysis of SRM: Moisture SS-EN 14774:2009, ash SS-EN
14775:2009, volatile SS-EN 15148:2009. Fixed carbon was calcu-
lated. Ultimate analysis standard for coal: CHN ASTM D5373, Sulfur
SS 187177, Oxygen calculated, Ultimate analysis standard for SRM:
CHN SS-EN 15104:2011, Oxygen calculated.
J. Sustain. Metall.
123

laboratory, ALS Scandinavia AB, Sweden. Ultimate anal-
ysis was done to determine the elemental compositions of
samples, namely, C, H, N, O, and S. Proximate analysis
was used to determine moisture, volatile matter, ash, and
fixed carbon content.
To determine the representativeness of the results,
especially for SRM, which is a heterogeneous material,
proximate analysis was also performed using a thermal
gravimetric analyzer (TGA). The experiment, as shown in
Fig. 1, involves heating of 20 mg of samples under an inert
atmosphere of Argon, at a heating rate of 10 �C/min from
room temperature to 110 �C, the samples were kept at this
temperature for 10 min to remove residual moisture.
Afterward, the samples were heated up to 950 �C still
under an inert atmosphere of Argon; the weight loss
observed in this stage is associated with volatile content.
Finally, the sample was kept at a temperature of 950 �C for
5 h, while the atmosphere was changed from Argon to air.
Since this stage involves oxidation of carbon, the weight
loss observed is associated with the fixed carbon content of
material, and remaining material represents ash [17]. The
experiment was repeated five times, for determining the
reproducibility of results.
Devolatilization Experiment
Devolatilization experiments were carried out using a
Netzsch Thermal Analyzer STA 409 instrument with sen-
sitivity of ±1 lg. The device is coupled with a quadrupole
mass spectroscometer (QMS) to analyze the evolved gases.
A schematic figure of the thermal analysis instrument is
given in Fig. 2. In a mass spectrometer, compounds are
ionized and separated based on mass/charge (m/z) ratio.
The number of ions representing each mass/charge ratio is
recorded. For example, mass spectra of H2O show the
molecular ion at m/z of 18, and include numerous fragment
peaks for m/z ratios in the range of 2–16 [18]. During
devolatilization experiments, mass spectroscopy monitors
the off-gas composition online for the mass/charge ratio
numbers in the range of 1–100. The presented values are
used only for qualitative analysis of released species.
20 mg of the sample was placed in the TGA and heated
up to 900 �C at a heating rate of 10 �C/min as shown in
Fig. 3. All experiments were performed under an Argon
atmosphere with a flow rate of 100 ml/min to avoid oxi-
dation of char or evolved volatiles. Based on preliminarily
experiments, the following experimental conditions were
chosen to minimize the interference of heat and mass
transfer [19]. Small amount of sample, 20 mg; shallow
crucible height, 3 mm; and high flow rate, 100 ml/min.
Results and Discussion
Characterization of Samples
The proximate and ultimate analyses of SRM and coal are
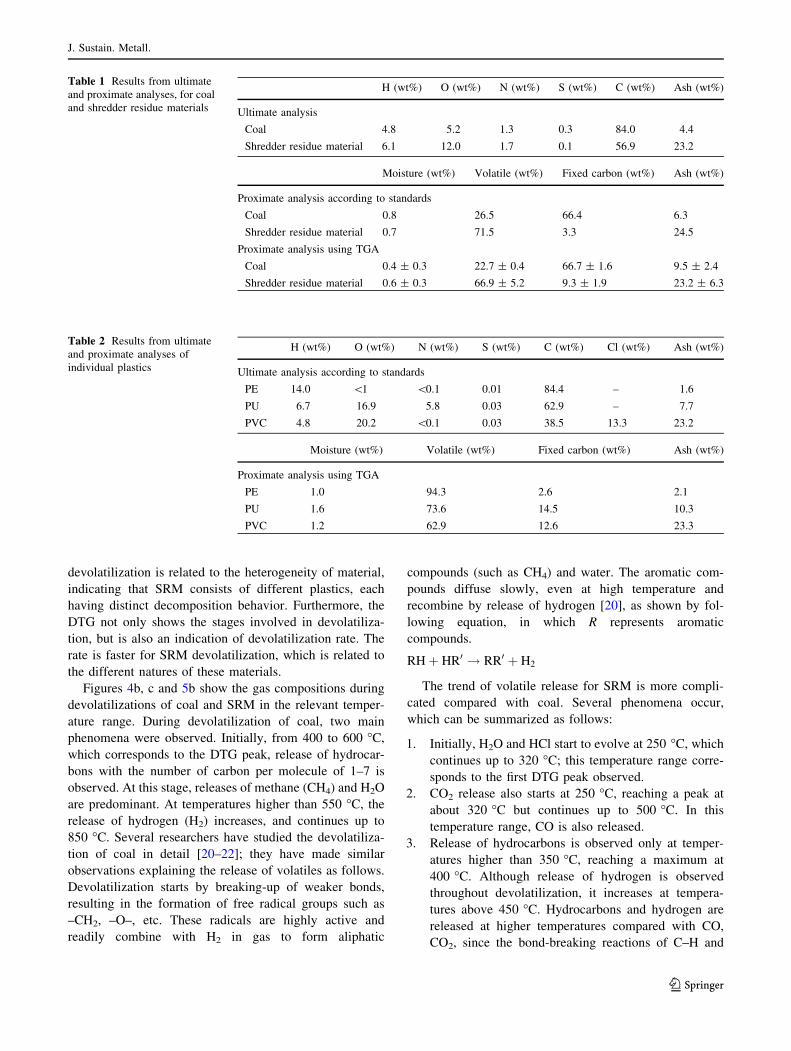
summarized in Table 1. Ultimate analysis shows that the
carbon content of SRM is lower than that in coal, while
its hydrogen content is slightly higher, with both elements
indicating the reduction potential of this material. The
proximate analysis shows that coal mainly decomposes
forming char; the fixed carbon content of char is known
to contribute to reduction [9]. In contrast to the compo-
sition of coal, the fixed carbon content of SRM char is
low. SRM decomposes with a significantly higher amount
of volatiles compared with coal; therefore, it is important
that the volatile content of SRM participates in reduction
reactions. SRM has higher content of ash compared with
coal, due to the presence of metals and ceramic materials.
Due to the heterogeneous nature of SRM, proximate
analysis was performed using TGA for comparison with
the standard method analysis; the results are shown in
Table 1.
Ultimate and proximate analyses of individual plastics
(PE, PU, and PVC) are presented in Table 2 which shows
the diversity in the characteristics of the studied plastics
and, possibly, for plastics present in SRM. PE shows the
highest hydrogen and carbon contents, compared with the
other plastics. The carbon content of PE is similar to that of
coal, while the hydrogen content is even higher than that
for coal. Based on this result, it is possible to assume that
PE could have the same reduction potential as coal. The
main difference, however, is the proximate analysis, where
PE decomposes by release of approximately 94 % vola-
tiles. PU and PVC have lower carbon and hydrogen con-
tents, compared with PE and coal. In addition, they both
have high oxygen contents, which might affect their
reduction potential. All the three plastics show high vola-
tile content, with the trend being in the decreasing order:
Fig. 1 Heating cycle during proximate analysis using TGA
J. Sustain. Metall.
123

PE[ PU[ PVC; these results are in agreement with
studies reported by other researchers [13, 15, 16]. Similar
to SRM, all three types of these plastics can be described
by high volatile contents and relativeley low fixed carbon
compared with coal.
Devolatilization of SRM and Coal
Figures 4a and 5a show the weight loss for coal and SRM
during devolatilization. Devolatilization of coal starts at
450 �C and continues gradually up to 800 �C, while, incase of SRM, it starts at around 250 �C and ends at 450 �C.The first derivative of the weight percent curves with
respect to time is plotted and shown as a derivative ther-
mogravimetric (DTG) curve. It represents mass loss rate
versus time and indicates the temperature at which differ-
ent stages are taking place [12]. For coal, the maximum
reaction rate is indicated by a maximum at 480 �C, indi-cating that coal devolatilizes in one gradual stage.
Devolatilization of SRM shows two stages; the first one
occurs at approximately 280 �C, and the second peak
seems to consist of two overlapping peaks at 350 and
400 �C. Day et al. [3] have studied the devolatilization of
several plastics used in electronic industry and have
reported a substantial difference in weight loss curves of
these plastics. The presence of several stages during SRM
Fig. 2 Schematic figure of
TGA/QMS
Fig. 3 Heating cycle during devolatilization experiments using TGA
J. Sustain. Metall.
123
devolatilization is related to the heterogeneity of material,
indicating that SRM consists of different plastics, each
having distinct decomposition behavior. Furthermore, the
DTG not only shows the stages involved in devolatiliza-
tion, but is also an indication of devolatilization rate. The
rate is faster for SRM devolatilization, which is related to
the different natures of these materials.
Figures 4b, c and 5b show the gas compositions during
devolatilizations of coal and SRM in the relevant temper-
ature range. During devolatilization of coal, two main
phenomena were observed. Initially, from 400 to 600 �C,which corresponds to the DTG peak, release of hydrocar-
bons with the number of carbon per molecule of 1–7 is
observed. At this stage, releases of methane (CH4) and H2O
are predominant. At temperatures higher than 550 �C, therelease of hydrogen (H2) increases, and continues up to
850 �C. Several researchers have studied the devolatiliza-
tion of coal in detail [20–22]; they have made similar
observations explaining the release of volatiles as follows.
Devolatilization starts by breaking-up of weaker bonds,
resulting in the formation of free radical groups such as
–CH2, –O–, etc. These radicals are highly active and
readily combine with H2 in gas to form aliphatic
compounds (such as CH4) and water. The aromatic com-
pounds diffuse slowly, even at high temperature and
recombine by release of hydrogen [20], as shown by fol-
lowing equation, in which R represents aromatic
compounds.
RHþ HR0 ! RR0 þ H2
The trend of volatile release for SRM is more compli-
cated compared with coal. Several phenomena occur,
which can be summarized as follows:
1. Initially, H2O and HCl start to evolve at 250 �C, whichcontinues up to 320 �C; this temperature range corre-
sponds to the first DTG peak observed.
2. CO2 release also starts at 250 �C, reaching a peak at
about 320 �C but continues up to 500 �C. In this
temperature range, CO is also released.
3. Release of hydrocarbons is observed only at temper-
atures higher than 350 �C, reaching a maximum at
400 �C. Although release of hydrogen is observed
throughout devolatilization, it increases at tempera-
tures above 450 �C. Hydrocarbons and hydrogen are
released at higher temperatures compared with CO,
CO2, since the bond-breaking reactions of C–H and
Table 1 Results from ultimate
and proximate analyses, for coal
and shredder residue materials
H (wt%) O (wt%) N (wt%) S (wt%) C (wt%) Ash (wt%)
Ultimate analysis
Coal 4.8 5.2 1.3 0.3 84.0 4.4
Shredder residue material 6.1 12.0 1.7 0.1 56.9 23.2
Moisture (wt%) Volatile (wt%) Fixed carbon (wt%) Ash (wt%)
Proximate analysis according to standards
Coal 0.8 26.5 66.4 6.3
Shredder residue material 0.7 71.5 3.3 24.5
Proximate analysis using TGA
Coal 0.4 ± 0.3 22.7 ± 0.4 66.7 ± 1.6 9.5 ± 2.4
Shredder residue material 0.6 ± 0.3 66.9 ± 5.2 9.3 ± 1.9 23.2 ± 6.3
Table 2 Results from ultimate
and proximate analyses of
individual plastics
H (wt%) O (wt%) N (wt%) S (wt%) C (wt%) Cl (wt%) Ash (wt%)
Ultimate analysis according to standards
PE 14.0 \1 \0.1 0.01 84.4 – 1.6
PU 6.7 16.9 5.8 0.03 62.9 – 7.7
PVC 4.8 20.2 \0.1 0.03 38.5 13.3 23.2
Moisture (wt%) Volatile (wt%) Fixed carbon (wt%) Ash (wt%)
Proximate analysis using TGA
PE 1.0 94.3 2.6 2.1
PU 1.6 73.6 14.5 10.3
PVC 1.2 62.9 12.6 23.3
J. Sustain. Metall.
123
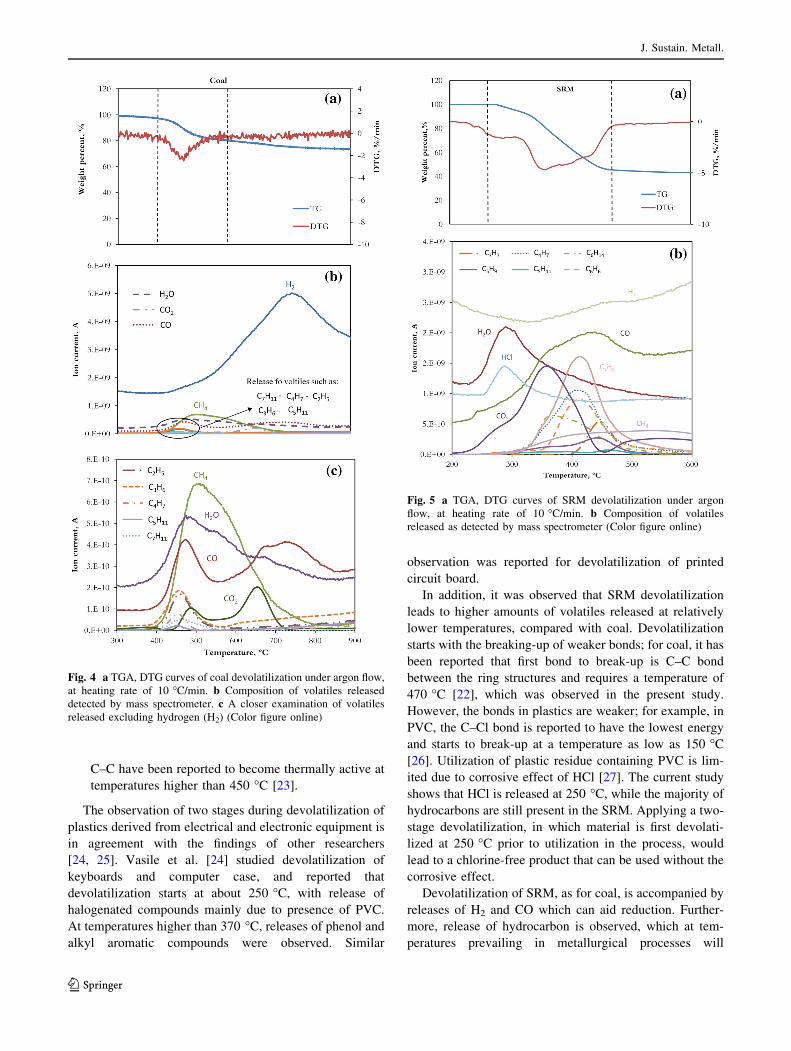
C–C have been reported to become thermally active at
temperatures higher than 450 �C [23].
The observation of two stages during devolatilization of
plastics derived from electrical and electronic equipment is
in agreement with the findings of other researchers
[24, 25]. Vasile et al. [24] studied devolatilization of
keyboards and computer case, and reported that
devolatilization starts at about 250 �C, with release of
halogenated compounds mainly due to presence of PVC.
At temperatures higher than 370 �C, releases of phenol andalkyl aromatic compounds were observed. Similar
observation was reported for devolatilization of printed
circuit board.
In addition, it was observed that SRM devolatilization
leads to higher amounts of volatiles released at relatively
lower temperatures, compared with coal. Devolatilization
starts with the breaking-up of weaker bonds; for coal, it has
been reported that first bond to break-up is C–C bond
between the ring structures and requires a temperature of
470 �C [22], which was observed in the present study.
However, the bonds in plastics are weaker; for example, in
PVC, the C–Cl bond is reported to have the lowest energy
and starts to break-up at a temperature as low as 150 �C[26]. Utilization of plastic residue containing PVC is lim-
ited due to corrosive effect of HCl [27]. The current study
shows that HCl is released at 250 �C, while the majority of
hydrocarbons are still present in the SRM. Applying a two-
stage devolatilization, in which material is first devolati-
lized at 250 �C prior to utilization in the process, would
lead to a chlorine-free product that can be used without the
corrosive effect.
Devolatilization of SRM, as for coal, is accompanied by
releases of H2 and CO which can aid reduction. Further-
more, release of hydrocarbon is observed, which at tem-
peratures prevailing in metallurgical processes will
Fig. 4 a TGA, DTG curves of coal devolatilization under argon flow,
at heating rate of 10 �C/min. b Composition of volatiles released
detected by mass spectrometer. c A closer examination of volatiles
released excluding hydrogen (H2) (Color figure online)
Fig. 5 a TGA, DTG curves of SRM devolatilization under argon
flow, at heating rate of 10 �C/min. b Composition of volatiles
released as detected by mass spectrometer (Color figure online)
J. Sustain. Metall.
123

decompose to carbon and hydrogen [28], and probably
further contribute to reduction reactions. Decomposition of
hydrocarbons is accelerated by the presence of H2O(g). In
addition, the lower devolatilization temperature observed
for SRM indicates that the process could operate at lower
temperatures compared to the temperatures needed for
utilizing coal.
Devolatilization of Individual Plastics
Considerable variations in thermal decomposition charac-
teristics of individual plastics have been reported by sev-
eral researchers [3, 29]. Some plastic such as PE
decomposes mainly by release of volatiles, while for some
materials, such as PVC and PU, decomposition is accom-
panied by production of char. Utilization of some indi-
vidual plastics such as PE as a reduction agent in iron and
steel making has been reported in the literature [4, 11]. In
this study, the devolatilization characteristics and volatile
releases from PE, PVC, and PU are studied, to gain a better
understanding on the potential of plastic materials as
reducing agent. Figures 6, 7, and 8a show the weight loss,
DTG curves, while Figs. 6, 7, and 8b show the evolved
volatiles for devolatilizations of the three studied plastics,
PE, PVC, and PU. Devolatilization of PE starts at
approximately 400 �C, and occurs in one narrow temper-
ature range. The DTG peak observed at 460 �C is
accompanied by release of H2, in addition to hydrocarbons
ranging from C1 to C7. PVC decomposes in two distinct
stages, which is in agreement with other researchers find-
ings [16, 25]. In the temperature range of 250–350 �C,corresponding to the first peak of DTG, HCl is observed. In
addition to HCl, other volatiles such as CO2, H2O, and
hydrocarbons are released in this temperature range. For
the second peak of DTG, which occurs in the temperature
range of 400–500 �C, the volatiles detected, apart from
HCl, are the same as those identified for the previous peak.
The DTG curve for the devolatilization of PU shows two
peaks, indicating two stages of devolatilization. The first
peak is judged, based on experimental data, to consist of
three overlapping peaks. The first overlapping peak at
300 �C corresponds to releases of CO2, CO, and CH4.
Release of CO2 is due to dimerization of the isocyanate
[14]. The second overlapping peak corresponds to releases
of C2H5OH and H2O at 350 �C, and releases of water vaporand ethanol have also been observed by other researchers
[14]. The last overlapping peak was observed at 400 �C, in
Fig. 6 a TGA, DTG curves of PE devolatilization under argon flow,
at heating rate of 10 �C/min. b Composition of volatiles released as
detected by mass spectrometer (Color figure online)
Fig. 7 a TGA, DTG curves of PVC devolatilization under argon
flow, at heating rate of 10 �C/min. b Composition of volatiles
released as detected by mass spectrometer (Color figure online)
J. Sustain. Metall.
123

which releases of hydrocarbons such as C6H6 and C7H8
were observed. Finally, the last peak (second peak)
observed at 450 �C is accompanied by an increase in the
release of H2.
For the metallurgical process, it can be observed that PE
decomposes by release of 94 % volatiles, which consist of
aliphatic hydrocarbons with low content of carbon. Thus, it
is probable that PE would contribute to reduction just by
volatiles. PVC and PU both give rise to hydrocarbons with
higher carbon content, which requires higher energy to
crack during the process. Devolatilizations of PVC and PU
are accompanied by release of CO, which can directly
participate in reduction. Furthermore, decompositions of
PVC and PU produce char with 12 and 14 % fixed carbon
contents, respectively, that can also participate in
reduction.
Table 3 summarizes the structures of the studied plastics
and the identified released volatiles during their
devolatilization. As devolatilization involves chain scis-
sion, different mechanisms were observed for these plas-
tics. PE has a simpler structure compared with the two
other plastics and is known to devolatilize by random
scission of C–C bond, forming different molecular weight
hydrocarbons. PVC has a slightly more complex structure
compared with PE, and two stages during its devolatiliza-
tion were observed. Formation of HCl observed for SRM is
probably due to the presence of PVC and breaking-up of
C–Cl bond. PU consists of several different bonds; there-
fore, its devolatilization involves more stages, which leads
to a more complex devolatilization behavior. It can be
concluded that even at the level of individual plastics,
devolatilization mechanisms are complex.
Devolatilization of Mixed Plastics
Binary and ternary mixtures give rise to the possibility of
modifying the desired properties from individual plastics.
Current study shows that the studied plastics decompose
differently, and mixing would result in tailored properties.
Several researchers have studied the mixture of plastics
and have reported their possible interaction [30, 31];
therefore, the mixture of plastics is studied. Binary mix-
tures of PE/PU, PE/PVC, and PU/PVC with the weight
proportions of 1:1 were investigated. A calculated curve is
constructed based on the assumption that each plastic in
the mixture devolatilizes according to the results of this
study and free from interaction with other plastics (Fig. 9).
Fig. 8 a TGA, DTG curves of PU devolatilization under argon flow,
at heating rate of 10 �C/min. b Composition of volatiles released as
detected by mass spectrometer (Color figure online)
Table 3 Structures of PE, PVC, and PU and the volatiles observed during their devolatilizations
Structure Temperature (�C) The volatile
PE(adopted from [12])
400–500 C1–C7, and H2O, H2
PVC
(adopted from [12])
250–350 HCl and C1–C7, H2O CO, CO2
400–500 C1–C7
PU
(adopted from [14])
300 CH4, CO, CO2
380 H2O, C2H5OH
450 C3–C7
J. Sustain. Metall.
123

For the PE/PVC and PE/PU mixtures, the experimental
devolatilization curves are in good agreement with the
calculated ones, although the rates are slightly different.
This suggests that these plastics devolatilize without
interaction. Miranda et al. [30] studied the vacuum
devolatilization of a PE/PVC mixture and also reported
similar observations.
Comparison of the experimental curve and the calculated
curve for PVC/PU mixture shows a higher amount of char
left compared to what has been calculated. The binary
mixture shows two stages, indicated by DTG curve. During
the first stage, experimental and calculated curves are in
agreement. However, in the second stage, the amount of char
produced during the experiment is higher compared with the
calculated curve, which indicates the possible interaction
between the two plastics at this stage. In the second stage, the
binary mixture shows similar devolatilization behavior as
that of PVC. The deviation observed in the second stage is
probably related to crosslinking reactions, which is espe-
cially important in the formation of char [12]. The higher
amount of char observed could be due to the crosslinking
(recombination) reaction of the volatiles formed with the
remaining structure. In addition, possible bond formation
between the two remaining plastics and their structures could
also result in a more stable structure and, consequently,
higher residual char.
Furthermore, the devolatilization of a ternary mixture of
PE, PU, and PVC with a weight ratio of 1:1:1 was studied.
A calculated curve is constructed based on the experi-
mental data from devolatilization curves of PU/PVC binary
mixture and PE, presented in Fig. 10. This way the inter-
action between PU/PVC is already considered, and the
assumption is that no further interaction would occur
between the plastics.
The first stage of devolatilization shows that a higher
amount of volatile was released during the experiment than
the calculated amount. However, the second stage shows
lower experimental volatile release; therefore, a higher
amount of char compared with the calculated curve was
observed. It has been reported that the nitrogen-containing
compounds in PU can contribute to acceleration of PVC
dehydrochlorization [32], which can explain the higher rate
of devolatilization observed in the initial stage of
devolatilization. The experimental rate shows a lower rate
in the second devolatilization stage, which is probably
related to a change in the extent of crosslinking reaction.
Despite the assumption that PE would not interact with the
other plastics, addition of PE to binary mixture of PU/PVC
led to an observed difference between the calculated and
experimental curves. This indicates a possible further
interaction between PE and binary mixture.
The study of binary and ternary mixtures shows the
complication arising from the interaction between the
plastics in the mixture. Although devolatilization mecha-
nisms of individual plastics and to some extent binary
Fig. 9 Calculated and experimental curves of binary mixture of
plastics, devolatilization under argon flow at heating rate of 10 �C/min. a PE/PVC, b PE/PU, c PU/PVC; experimental DTG curve is
plotted, showing different stages of devolatilization (Color
figure online)
Fig. 10 Calculated and experimental curves of ternary mixture of
plastics, devolatilization under argon flow at heating rate of 10 �C/min, PE/PU/PVC; experimental DTG curve is plotted, showing
different stages of devolatilization (Color figure online)
J. Sustain. Metall.
123

mixtures are reported in the literature, fewer studies are
available for higher numbers of compounds in the mixture.
However, considering the different mechanisms involved
in devolatilizations of plastics and interactions occurring in
the studied mixture, some understanding of the
devolatilization mechanism of SRM has been gained. Ini-
tially plastics decompose by release of the primary vola-
tiles. The primary volatiles could leave the plastic without
further interaction with the other primary volatiles from
either the same or different plastics. However, a more
probable theory is that the primary volatiles either interact
with other primary volatiles released from other plastics or
with the remaining structure of plastics. Consequently, in
SRM, which contains different types of plastics, and their
composition is not always known, there is a high chance of
interaction between the plastics, which makes its
devolatilization mechanisms complex. In addition, it is
known that the inorganic content present in ash such as Cu
and Fe can have a catalytic effect on devolatilization of
plastic material [33]. Furthermore, while the presence of
elements such as Cu restricts utilization of SRM in the blast
furnace, in nonferrous bath smelting, the process can be
designed in such a way that the inorganic compound can be
extracted.
Conclusions
• Proximate analysis showed that the volatile contents of
SRM and individual plastics were higher than that of
coal, while their fixed carbon content was lower.
• Ash content of SRM was higher than that of coal, which
is reported to have a catalytic effect during
devolatilization.
• During SRM devolatilization, volatiles are released in
the temperature range of 280–450 �C, and composed of
CO, H2, and hydrocarbons, which have reduction
potential, and thus could possibly contribute to reduc-
tion reactions.
• The DTG curve and volatiles released during
devolatilization of SRM show more stages during
SRM devolatilization, due to the heterogeneous nature
of SRM.
Thermal decomposition of SRM is studied in compar-
ison with coal, for potential utilization as a substitute to be
used as a reducing agent in nonferrous bath smelting pro-
cesses. The findings of this study show that for SRM to be
used as a reducing agent, it is necessary to utilize the
evolved volatiles in the process. The devolatilization of
SRM occurs in a lower-temperature range compared with
coal.
Furthermore, to gain a better understanding on potential
utilization of plastic materials as reducing gent, the
devolatilizations of three common plastics, namely, PE,
PVC, and PU and their mixtures have been studied. PE
decomposes by release of 94 % volatiles, which consist of
aliphatic hydrocarbons with low carbon number. Thus, it is
probable that PE would contribute to reduction just by
volatiles, while PVC and PU produces char with 12 and
14 % fixed carbon contents, respectively, that can also
participate in reduction. The binary and ternary mixtures
have shown the interaction between the plastics during
devolatilization. Thus, it is possible to conclude that during
SRM devolatilization, the released volatile from each
plastic could interact with volatiles from other plastics.
Acknowledgments Financial supports from Boliden Commercial
and Vinnova-supported Strategic innovation program for the Swedish
mining and metal producing industry, SIP STRIM are greatly
acknowledged. The authors would also like to express their gratitude
to Tommy Vikstrom, Boliden Mineral AB, for his kind collaboration.
Open Access This article is distributed under the terms of the
Creative Commons Attribution 4.0 International License (http://crea
tivecommons.org/licenses/by/4.0/), which permits unrestricted use,
distribution, and reproduction in any medium, provided you give
appropriate credit to the original author(s) and the source, provide a
link to the Creative Commons license, and indicate if changes were
made.
References
1. Menad N, Kanari N, Guignot S, et al. (2013) Material and energy
beneficiation of the automobile shredder residues. In: The Min-
erals Metals Materials Society—Rewas 2013. Wiley, New York,
pp 89–99.
2. Forton O, Harder M, Moles N (2006) Value from shredder waste:
ongoing limitations in the UK. Resour Conserv Recycl
46(1):104–113
3. Day M, Cooney J, Touchette-Barrette C, Sheehan S (1999)
Pyrolysis of mixed plastics used in the electronics industry.
J Anal Appl Pyrolysis 52(2):199–224
4. Sahajwalla V, Zaharia M, Kongkarat S, Khanna R, Saha-
Chaudhury N, O’Kane P (2009) Recycling plastics as a resource
for electric arc furnace (EAF) steelmaking: combustion and
structural transformations of metallurgical coke and plastic
blends. Energy Fuels 24(1):379–391
5. Kantarelis E, Donaj P, Yang W, Zabaniotou A (2009) Sustainable
valorization of plastic wastes for energy with environmental
safety via high-temperature pyrolysis (HTP) and high-tempera-
ture steam gasification (HTSG). J Hazard Mater 167(1):675–684
6. Yang X, Sun L, Xiang J, Hu S, Su S (2013) Pyrolysis and
dehalogenation of plastics from waste electrical and electronic
equipment (WEEE): a review. Waste Manag 33(2):462–473
7. Babich A, Senk D, Knepper M, Benkert S (2016) Conversion of
injected waste plastics in blast furnace. Ironmak Steelmak
43(1):11–21
8. Mirabile D, Pistelli MI, Marchesini M, Falciani R, Chiappelli L
(2002) Thermal valorisation of automobile shredder residue:
injection in blast furnace. Waste Manag 22(8):841–851
J. Sustain. Metall.
123

9. Richards GG, Brimacombe J, Toop G (1985) Kinetics of the zinc
slag-fuming process: part I. Industrial measurements. Metall
Trans B 16(3):513–527
10. Usachev A, Balasanov A, Lekherzak V, Romenets V (2013)
Behaviour of coal in smelting reduction installation. Ironmak
Steelmak 27(6):426–431
11. Kim D, Shin S, Sohn S, Choi J, Ban B (2002) Waste plastics as
supplemental fuel in the blast furnace process: improving com-
bustion efficiencies. J Hazard Mater 94(3):213–222
12. Beyler CL, Hirschler MM (2002) Thermal decomposition of
polymers. SFPE handbook of fire protection engineering, vol 2,
pp 110–131
13. Faravelli T, Bozzano G, Scassa C, Perego M, Fabini S, Ranzi E,
Dente M (1999) Gas product distribution from polyethylene
pyrolysis. J Anal Appl Pyrolysis 52(1):87–103
14. Lefebvre J, Duquesne S, Mamleev V, Bras ML, Delobel R (2003)
Study of the kinetics of pyrolysis of a rigid polyurethane foam:
use of the invariant kinetics parameters method. Polym Adv
Technol 14(11–12):796–801
15. Rein G, Lautenberger C, Fernandez-Pello AC, Torero JL, Urban
DL (2006) Application of genetic algorithms and thermo-
gravimetry to determine the kinetics of polyurethane foam in
smoldering combustion. Combust Flame 146(1):95–108
16. Miranda R, Yang J, Roy C, Vasile C (1999) Vacuum pyrolysis of
PVC I: kinetic study. Polym Degrad Stab 64(1):127–144
17. Beamish BB (1994) Proximate analysis of New Zealand and
Australian coals by thermogravimetry. N Z J Geol Geophys.
37(4):387–392
18. Silverstein RM, Webster FX, Kiemle DJ, Bryce DL (2014) Spec-
trometric identification of organic compounds. Wiley, New York
19. Zhou L, Wang Y, Huang Q, Cai J (2006) Thermogravimetric
characteristics and kinetic of plastic and biomass blends co-py-
rolysis. Fuel Process Technol 87(11):963–969
20. Saxena S (1990) Devolatilization and combustion characteristics
of coal particles. Prog Energy Combust Sci 16(1):55–94
21. Solomon PR, Hamblen DG, Serio MA, Yu Z, Charpenay S
(1993) A characterization method and model for predicting coal
conversion behaviour. Fuel 72(4):469–488
22. Yu J, Lucas JA, Wall TF (2007) Formation of the structure of
chars during devolatilization of pulverized coal and its thermo-
properties: a review. Prog Energy Combust Sci 33(2):135–170
23. Guo Q, Zhang X, Li C, Liu X, Li J (2012) TG–MS study of the
thermo-oxidative behavior of plastic automobile shredder resi-
dues. J Hazard Mater 209:443–448
24. Vasile C, Brebu MA, Karayildirim T, Yanik J, Darie H (2006)
Feedstock recycling from plastic and thermoset fractions of used
computers (I): pyrolysis. J Mater Cycles Waste Manage
8(2):99–108
25. Hall WJ, Williams PT (2006) Fast pyrolysis of halogenated
plastics recovered from waste computers. Energy Fuels
20(4):1536–1549
26. Williams EA, Williams PT (1997) Analysis of products derived
from the fast pyrolysis of plastic waste. J Anal Appl Pyrolysis
40:347–363
27. Bodenan F, Menad N, Wavrer P, Guignot S, Quatravaux T, Russo
P (2013) Recycling of automotive shredder residues (ASR) in
iron-and steelmaking furnaces. Ironmak Steelmak 39(7):493–497
28. Ghosh D, Roy A, Ghosh A (1986) Reduction of ferric oxide
pellets with methane. Trans Iron Steel Inst Jpn 26(3):186–193
29. Menad N, Bjorkman B, Allain EG (1998) Combustion of plastics
contained in electric and electronic scrap. Resour Conserv Recycl
24(1):65–85
30. Miranda R, Yang J, Roy C, Vasile C (2001) Vacuum pyrolysis of
commingled plastics containing PVC I: kinetic study. Polym
Degrad Stab 72(3):469–491. doi:10.1016/S0141-3910(01)00048-9
31. Sakata Y, Uddin MA, Koizumi K, Murata K (1996) Thermal
degradation of polyethylene mixed with poly(vinyl chloride) and
poly(ethyleneterephthalate). Polym Degrad Stab 53(1):111–117
32. Kolesov S, Neboilova I, Steklova A, Vladychina S, Minsker K
(1989) Kinetics of thermal degradation of poly(vinyl chloride)-
polyurethane blends. Polym Sci USSR 31(2):476–480
33. Blazso M (1999) Thermal decomposition of polymers modified
by catalytic effects of copper and iron chlorides. J Anal Appl
Pyrolysis 51(1):73–88
J. Sustain. Metall.
123