alternative calibration strategies for the clinical laboratory: application to nortriptyline...
TRANSCRIPT
Alternative Calibration Strategies for the Clinical Laboratory: Application to Nortriptyline Therapeutic Drug Monitoring
M.T. Olson, A. Breaud, R. Harlan,N. Emezienna, S. Schools, A.L. Yergey, and W. Clarke
June 2013
www.clinchem.org/content/59/6/920.full
© Copyright 2013 by the American Association for Clinical Chemistry

© Copyright 2009 by the American Association for Clinical Chemistry
Background
Use of LC-MS/MS is growing in the clinical laboratory
LC-MS/MS instrument is expensive, so a single instrument often must be used for multiple quantitative assays
Additional challenges include assay throughput and meeting turnaround time goals for some assays

© Copyright 2009 by the American Association for Clinical Chemistry
Background
A major driver behind LC-MS/MS assay cost and time is the generation of a calibration curve with every assay run
CLIA requires linearity proof biannually Practice of measuring calibration line with every
assay is unique to mass spectrometry Practice of measuring calibration line with every
assay originated when the instruments were less stable than they are now
© Copyright 2009 by the American Association for Clinical Chemistry
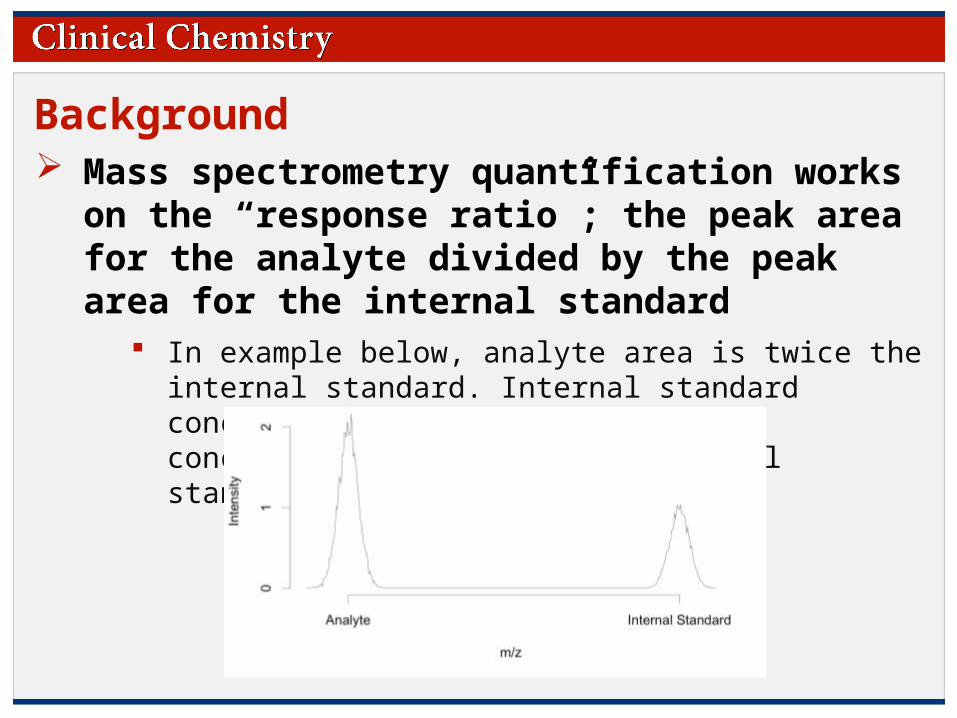
Background Mass spectrometry quantification works on the
“response ratio”; the peak area for the analyte divided by the peak area for the internal standard
In example below, analyte area is twice the internal standard. Internal standard concentration is known, so analyte concentration is twice the internal standard.

© Copyright 2009 by the American Association for Clinical Chemistry
Background
Instead of making a calibration curve, the authors used the response ratio
There is a correction for day to day differences, the “response factor” (RF) which is the response ratio of a 1:1 analyte:internal standard mixture
RF can be measured with each batch: contemporaneous RF or cRF
Alternatively, RF can be measured with QC failures or after instrument manipulation: sporadic RF or sRF
© Copyright 2009 by the American Association for Clinical Chemistry© Copyright 2009 by the American Association for Clinical Chemistry
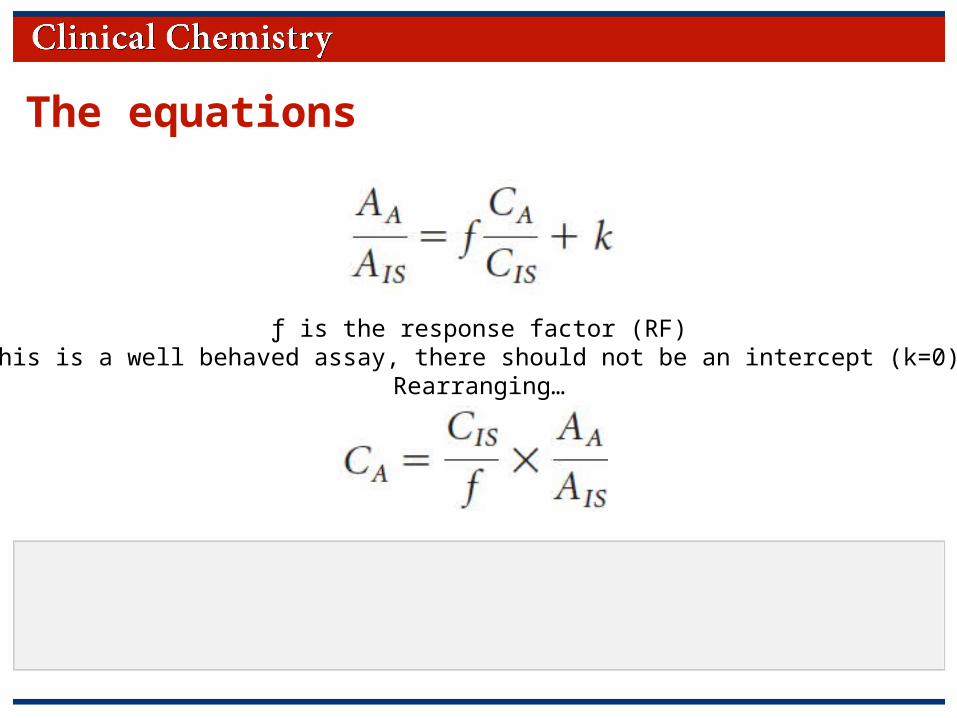
The equations
ƒ is the response factor (RF)This is a well behaved assay, there should not be an intercept (k=0).
Rearranging…
© Copyright 2009 by the American Association for Clinical Chemistry© Copyright 2009 by the American Association for Clinical Chemistry
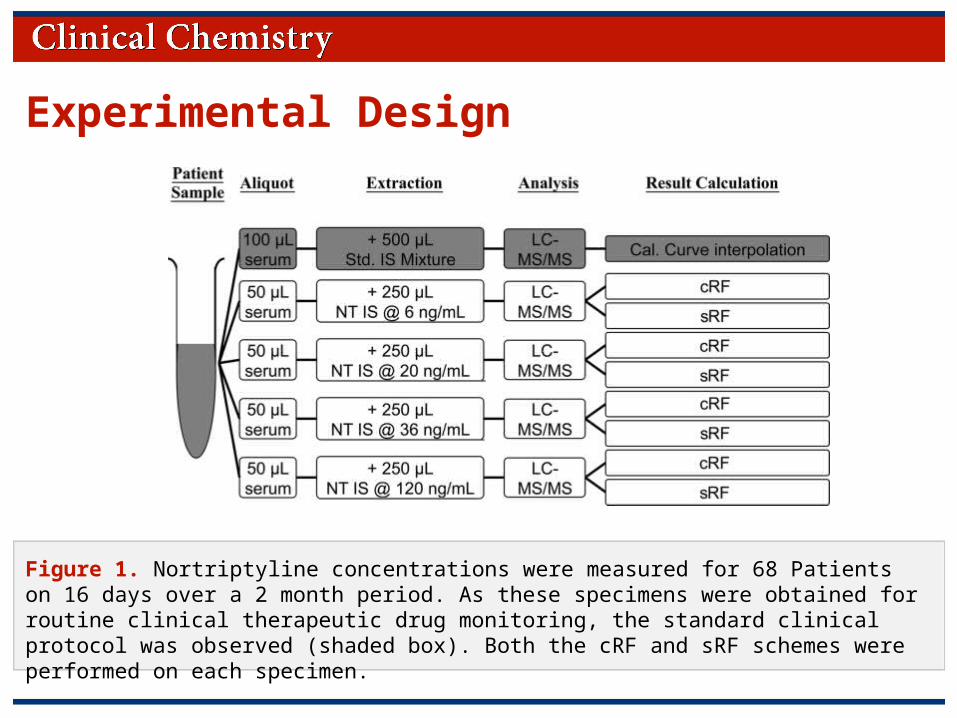
Figure 1. Nortriptyline concentrations were measured for 68 Patients on 16 days over a 2 month period. As these specimens were obtained for routine clinical therapeutic drug monitoring, the standard clinical protocol was observed (shaded box). Both the cRF and sRF schemes were performed on each specimen.
Experimental Design

© Copyright 2009 by the American Association for Clinical Chemistry© Copyright 2009 by the American Association for Clinical Chemistry
Figure 2. The dot-dash blue line representing the calibration curve with an internal standard concentration of 36ng/mL shows the most overlap with the solid unity line. The highest proportional and constant error is seen with 6ng/mL.
Results: Is the Assay Well Behaved? (i.e., is k=0? Is ƒ=1?)

© Copyright 2009 by the American Association for Clinical Chemistry© Copyright 2009 by the American Association for Clinical Chemistry
Figure 3. The dot-dash blue line representing the calibration curve with an internal standard concentration of 36ng/mL shows the most overlap with the solid unity line. The highest proportional and constant error is seen with 6ng/mL.
Results: Does this work?
Graph A shows patient results at the four internal standard concentrations plotted against calibration curve results
Best agreement is seen with 36 ng/mL
Bland-Altman (Graph B) shows mean bias of 3.69% for cRF versus calibration curve with a range of -15.8 to 23.2%
© Copyright 2009 by the American Association for Clinical Chemistry© Copyright 2009 by the American Association for Clinical Chemistry
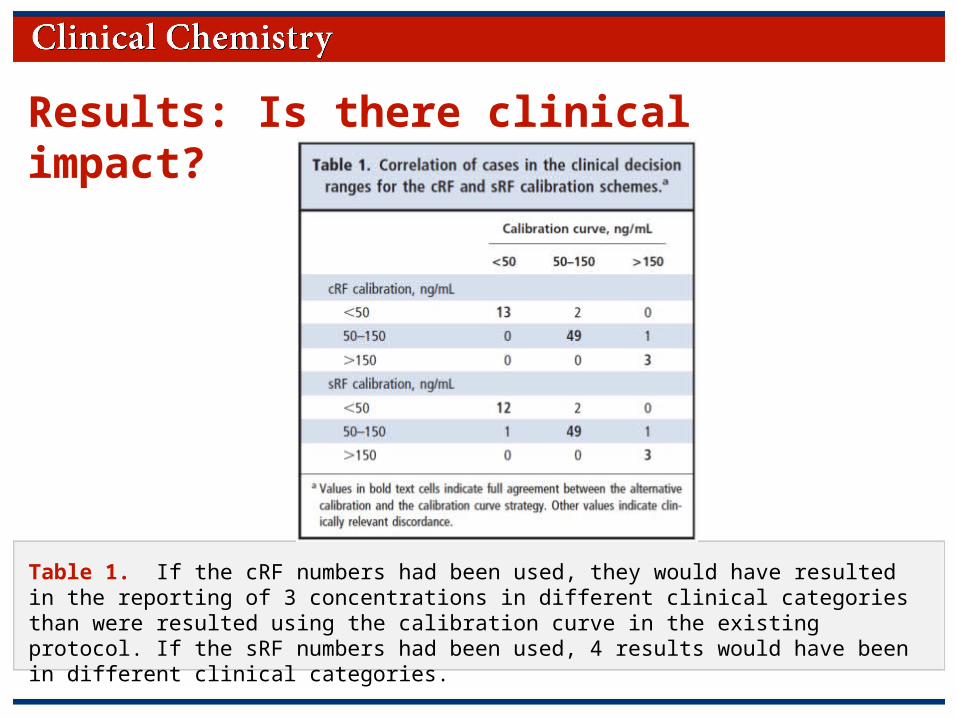
Results: Is there clinical impact?
Table 1. If the cRF numbers had been used, they would have resulted in the reporting of 3 concentrations in different clinical categories than were resulted using the calibration curve in the existing protocol. If the sRF numbers had been used, 4 results would have been in different clinical categories.

© Copyright 2009 by the American Association for Clinical Chemistry
Discussion Measurement of multiple analytes with a single
LC-MS/MS assay is commonplace
Done to minimize calibration and QC No clinical benefit in the context of prescription drugs
with no abuse potential
Multiplexing risks ion suppression and augmentation for coeluting analytes
cRF or sRF calibration can cut time spent calibrating instrument and may make single analyte assays more feasible
© Copyright 2009 by the American Association for Clinical Chemistry
Discussion
LC-MS/MS assays function best when analyte concentration is close to internal standard concentration (A/IS ~ 1)
For clinical values for this assay (mostly in 100-150 ng/ml range) the ideal internal standard concentration was 36 ng/mL
Thus, selection of internal standard for an assay should reflect expected analyte concentrations in the patients

© Copyright 2009 by the American Association for Clinical Chemistry
Thank you for participating in this month’sClinical Chemistry Journal Club.
Additional Journal Clubs are available atwww.clinchem.org
Download the free Clinical Chemistry app on iTunes for additional content!
Follow us