alternative approaches to locating the food insecure
TRANSCRIPT

ALTERNATIVE APPROACHES TO LOCATING THE FOODINSECURE: QUALITATIVE AND QUANTITATIVE EVIDENCE
FROM SOUTH INDIA
Kimberly Chung, Lawrence Haddad, Jayashree Ramakrishna, and Frank Riely
DISCUSSION PAPER NO. 22
Food Consumption and Nutrition Division
International Food Policy Research Institute1200 Seventeenth Street, N.W.
Washington, D.C. 20036-3006 U.S.A.(202) 862-5600
Fax: (202) 467-4439
January 1997
FCND Discussion Papers contain preliminary material and research results, and are circulated prior to a fullpeer review in order to stimulate discussion and critical comment. It is expected that most Discussion Paperswill eventually be published in some other form, and that their content may also be revised.
CONTENTS
Acknowledgments . . . . . . . . . . . . . . . . . . . . . . . . . . . . . . . . . . . . . . . . . . . . . . . . . . . . . . . . . . vi
Executive Summary . . . . . . . . . . . . . . . . . . . . . . . . . . . . . . . . . . . . . . . . . . . . . . . . . . . . . . . . . vii
1. Introduction . . . . . . . . . . . . . . . . . . . . . . . . . . . . . . . . . . . . . . . . . . . . . . . . . . . . . . . . . . . . . 1The Need for Alternative Indicators of Food Security for Targeting . . . . . . . . . . . . . . . . . 1The Need for Alternative Indicators in India . . . . . . . . . . . . . . . . . . . . . . . . . . . . . . . . . . . 1Research Objectives . . . . . . . . . . . . . . . . . . . . . . . . . . . . . . . . . . . . . . . . . . . . . . . . . . . . 2Outline of Report . . . . . . . . . . . . . . . . . . . . . . . . . . . . . . . . . . . . . . . . . . . . . . . . . . . . . . . 3
2. Literature Review . . . . . . . . . . . . . . . . . . . . . . . . . . . . . . . . . . . . . . . . . . . . . . . . . . . . . . . . . 4Food and Nutrition Monitoring in India . . . . . . . . . . . . . . . . . . . . . . . . . . . . . . . . . . . . . . 4Conceptual Framework for Understanding Food Security . . . . . . . . . . . . . . . . . . . . . . . . . 5Food Security Indicators . . . . . . . . . . . . . . . . . . . . . . . . . . . . . . . . . . . . . . . . . . . . . . . . . 6Indicators from India . . . . . . . . . . . . . . . . . . . . . . . . . . . . . . . . . . . . . . . . . . . . . . . . . . . . 8
3. Methodological Framework . . . . . . . . . . . . . . . . . . . . . . . . . . . . . . . . . . . . . . . . . . . . . . . . . . 8Indicators of Chronic and Acute Food Insecurity . . . . . . . . . . . . . . . . . . . . . . . . . . . . . . . 8Identifying Candidate Indicators . . . . . . . . . . . . . . . . . . . . . . . . . . . . . . . . . . . . . . . . . . . 8The Need for a Benchmark . . . . . . . . . . . . . . . . . . . . . . . . . . . . . . . . . . . . . . . . . . . . . . . 9Quantitative Measures of Association . . . . . . . . . . . . . . . . . . . . . . . . . . . . . . . . . . . . . . 10Indicator Selection Criteria . . . . . . . . . . . . . . . . . . . . . . . . . . . . . . . . . . . . . . . . . . . . . . 13
4. Study Design . . . . . . . . . . . . . . . . . . . . . . . . . . . . . . . . . . . . . . . . . . . . . . . . . . . . . . . . . . . 18Project Site . . . . . . . . . . . . . . . . . . . . . . . . . . . . . . . . . . . . . . . . . . . . . . . . . . . . . . . . . . 18Data Collection Methods . . . . . . . . . . . . . . . . . . . . . . . . . . . . . . . . . . . . . . . . . . . . . . . . 21Choice of Households Surveyed . . . . . . . . . . . . . . . . . . . . . . . . . . . . . . . . . . . . . . . . . . . 32Timing of Survey Rounds . . . . . . . . . . . . . . . . . . . . . . . . . . . . . . . . . . . . . . . . . . . . . . . 33
5. Qualitative Results: Indicators of Household Food Insecurity . . . . . . . . . . . . . . . . . . . . . . . . 33Productive Assets: Land . . . . . . . . . . . . . . . . . . . . . . . . . . . . . . . . . . . . . . . . . . . . . . . . 34Productive Assets: Livestock . . . . . . . . . . . . . . . . . . . . . . . . . . . . . . . . . . . . . . . . . . . . 36Other Productive Assets . . . . . . . . . . . . . . . . . . . . . . . . . . . . . . . . . . . . . . . . . . . . . . . . 37Liquidatable Assets: Small Livestock, Jewelry, and Roof Tiles . . . . . . . . . . . . . . . . . . . 38Loans . . . . . . . . . . . . . . . . . . . . . . . . . . . . . . . . . . . . . . . . . . . . . . . . . . . . . . . . . . . . . . 38Choice of Crops Cultivated . . . . . . . . . . . . . . . . . . . . . . . . . . . . . . . . . . . . . . . . . . . . . . 39Wage Workers . . . . . . . . . . . . . . . . . . . . . . . . . . . . . . . . . . . . . . . . . . . . . . . . . . . . . . . 40"Permanent" or "Attached" Laborers . . . . . . . . . . . . . . . . . . . . . . . . . . . . . . . . . . . . . . . 42Women with Young Children Who Work for Wages . . . . . . . . . . . . . . . . . . . . . . . . . . . 43Migration in Search of Work . . . . . . . . . . . . . . . . . . . . . . . . . . . . . . . . . . . . . . . . . . . . . 43High Household Dependency Ratios . . . . . . . . . . . . . . . . . . . . . . . . . . . . . . . . . . . . . . . 44Buying Staples on a Daily Basis . . . . . . . . . . . . . . . . . . . . . . . . . . . . . . . . . . . . . . . . . . 46Illness . . . . . . . . . . . . . . . . . . . . . . . . . . . . . . . . . . . . . . . . . . . . . . . . . . . . . . . . . . . . . . 46Staple Substitutions . . . . . . . . . . . . . . . . . . . . . . . . . . . . . . . . . . . . . . . . . . . . . . . . . . . . 47Vegetable and Legume Substitutions . . . . . . . . . . . . . . . . . . . . . . . . . . . . . . . . . . . . . . . 49Dowries . . . . . . . . . . . . . . . . . . . . . . . . . . . . . . . . . . . . . . . . . . . . . . . . . . . . . . . . . . . . 50Gifts and Obligations to Relatives . . . . . . . . . . . . . . . . . . . . . . . . . . . . . . . . . . . . . . . . . 51Religious Obligations and Holidays . . . . . . . . . . . . . . . . . . . . . . . . . . . . . . . . . . . . . . . . 51

iii
6. Quantitative Results . . . . . . . . . . . . . . . . . . . . . . . . . . . . . . . . . . . . . . . . . . . . . . . . . . . . . . 53Issues Concerning Choice of Method to Determine Statistical Association
Between the Benchmark and the Alternative Indicator . . . . . . . . . . . . . . . . . . . . . 53A Quantitative Assessment of the Performance of the Alternative Indicators . . . . . . . . . . 57How Do the Alternative Indicators Suggested from the Qualitative Work
Compare to Those Derived from the Quantitative Work? . . . . . . . . . . . . . . . . . . . 72The Benefits of Targeting . . . . . . . . . . . . . . . . . . . . . . . . . . . . . . . . . . . . . . . . . . . . . . . 77
7. An Evaluation of the Data Collection Process . . . . . . . . . . . . . . . . . . . . . . . . . . . . . . . . . . . 85Qualitative Data Collection . . . . . . . . . . . . . . . . . . . . . . . . . . . . . . . . . . . . . . . . . . . . . . 86Survey Data Collection . . . . . . . . . . . . . . . . . . . . . . . . . . . . . . . . . . . . . . . . . . . . . . . . . 88
8. Lessons Learned from this Study . . . . . . . . . . . . . . . . . . . . . . . . . . . . . . . . . . . . . . . . . . . . . 90
9. Conclusions and next Steps . . . . . . . . . . . . . . . . . . . . . . . . . . . . . . . . . . . . . . . . . . . . . . . . . 95Suggested Areas for Future Investigation . . . . . . . . . . . . . . . . . . . . . . . . . . . . . . . . . . . . 96
References . . . . . . . . . . . . . . . . . . . . . . . . . . . . . . . . . . . . . . . . . . . . . . . . . . . . . . . . . . . . . . . . 99
TABLES
1. Definition of benchmark indicators of food insecurity used in the quantitativeassessment of alternative indicators . . . . . . . . . . . . . . . . . . . . . . . . . . . . . . . . . . . . . . . . 11
2. Relationships between true food insecurity, as determined by the benchmarkand food insecurity measured by the alternative . . . . . . . . . . . . . . . . . . . . . . . . . . . . . . . 12
3. Summary statistics for the four study villages . . . . . . . . . . . . . . . . . . . . . . . . . . . . . . . . 20
4. Survey information collected during the India study . . . . . . . . . . . . . . . . . . . . . . . . . . . . 22
5. Household indicators identified by the qualitative analysis . . . . . . . . . . . . . . . . . . . . . . . 35
6. The relationship between the number of indicators tested and the critical chi-square statistic needed to determine a significant relationship between thealternative indicator and the benchmark . . . . . . . . . . . . . . . . . . . . . . . . . . . . . . . . . . . . . 57
7. Performance of selected alternative indicators of chronic household foodinsecurity . . . . . . . . . . . . . . . . . . . . . . . . . . . . . . . . . . . . . . . . . . . . . . . . . . . . . . . . . . . 60
8. Energy sources by food source and location of village . . . . . . . . . . . . . . . . . . . . . . . . . . 62
9. Performance of selected indicators of acute household food insecurity . . . . . . . . . . . . . . 64
10. Performance of selected alternative indicators of chronic preschooler food

iv
insecurity . . . . . . . . . . . . . . . . . . . . . . . . . . . . . . . . . . . . . . . . . . . . . . . . . . . . . . . . . . . 65
11. Performance of selected indicators of acute preschooler food insecurity . . . . . . . . . . . . . 67
12. Mean serum vitamin A (ug/dL) and percentage below NHANES II cutoffs by season, agegroup and village . . . . . . . . . . . . . . . . . . . . . . . . . . . . . . . . . . . . . . . . . . . . . . . . . . . . . . 68
13. Mean blood hemoglobin (g/dL) with percentage below WHO cutoffs foranemia by season, age group and village . . . . . . . . . . . . . . . . . . . . . . . . . . . . . . . . . . . . 68
14. Performance of selected alternative indicators of vitamin A insecurity, round 1, late kharifseason . . . . . . . . . . . . . . . . . . . . . . . . . . . . . . . . . . . . . . . . . . . . . . . . . . . . . . . . . . . . . . 70
15. Performance of selected alternative indicators of vitamin A security, round 3, late summer,early kharif . . . . . . . . . . . . . . . . . . . . . . . . . . . . . . . . . . . . . . . . . . . . . . . . . . . . . . . . . . 71
16. Performance of selected alternative indicators of iron insecurity, round 1,late kharif season . . . . . . . . . . . . . . . . . . . . . . . . . . . . . . . . . . . . . . . . . . . . . . . . . . . . . . 73
17. Performance of selected alternative indicators of iron insecurity, round 3,late summer, early kharif . . . . . . . . . . . . . . . . . . . . . . . . . . . . . . . . . . . . . . . . . . . . . . . . 74
18. Indicators suggested by the Qualitative work that appeared in the survey andwere tested using quantitative performance criteria . . . . . . . . . . . . . . . . . . . . . . . . . . . . . 76
19. The benefits from targeting with selected indicators, compared to no targeting . . . . . . . . 79
20. Accounting for the social costs of food insecurity in assessing indicatorperformance (numbers in 000s) . . . . . . . . . . . . . . . . . . . . . . . . . . . . . . . . . . . . . . . . . . . 82
21. Investigator perceptions on three methods of dietary analysis: 24-hour recall,food frequency, and food charts . . . . . . . . . . . . . . . . . . . . . . . . . . . . . . . . . . . . . . . . . . . 89
22. Problem questions on the food security perceptions module . . . . . . . . . . . . . . . . . . . . . . 91
FIGURES
1. Food security conceptual framework and "generic" indicator categories . . . . . . . . . . . . . . 7
2. Map of the study site . . . . . . . . . . . . . . . . . . . . . . . . . . . . . . . . . . . . . . . . . . . . . . . . . . . 19
3. Village map drawn in Aurepalle, Round 3 . . . . . . . . . . . . . . . . . . . . . . . . . . . . . . . . . . . 25

v
4. Example of a completed village map . . . . . . . . . . . . . . . . . . . . . . . . . . . . . . . . . . . . . . . 26
5. Upper caste women in Shirapur, completing a food chart . . . . . . . . . . . . . . . . . . . . . . . . 27
6. A completed food chart . . . . . . . . . . . . . . . . . . . . . . . . . . . . . . . . . . . . . . . . . . . . . . . . . 28
7. A group of low caste men charting the availability of work in Aurepalle . . . . . . . . . . . . . 30
8. A completed seasonality chart . . . . . . . . . . . . . . . . . . . . . . . . . . . . . . . . . . . . . . . . . . . . 31
9. Timing of the three survey rounds in the four study villages . . . . . . . . . . . . . . . . . . . . . . 34
PROFILES
1. "I Have Buried Eight Sons" . . . . . . . . . . . . . . . . . . . . . . . . . . . . . . . . . . . . . . . . . . . . . . 41
2. "My Body Has the Habit of Work, so It Is Still Working." . . . . . . . . . . . . . . . . . . . . . . . 45
3. "We Have to Borrow Money for the First Time in Our Lives. We Are Finished." . . . . . . 48
4. "Even a Sinking Person Would Try to Hang on to a Small Stick" . . . . . . . . . . . . . . . . . . 52
vi
ACKNOWLEDGMENTS
The Alternative Indicators Study was a collaborative project between the InternationalCrops Research Institute for the Semi-Arid Tropics (ICRISAT); the International Food Policy
Research Institute (IFPRI); Andhra Pradesh Agricultural University (APAU), Hyderabad, India;
and the National Institute of Nutrition (NIN), Hyderabad, India. We would like to acknowledge
the following individuals for their assistance with this work:
Data Collection/Entry/Editing (ICRISAT):T.V.N. Anuradha, V. Sujatha, D. Vijayalakshmi, P. Tanuja, N. Jyothi, N. Leena, K.
Anita, T. Vasantha, Neeta Potdar, V. Sujatha, G.D. Nagashewar Rao, Y. Mohan Rao, V.K. Chopde, V. B. Ladole, V. Bhasker Rao, Murthy, K. Radha Vani, B. Seshanjini, H.
Hariharan, Stanford Waits, M. Baig
Computer Analysis:Kathleen Merchant (UNLV), A. Narasimha Rao (ICRISAT), Joshua Rozen (MPR),
and Ellen Payongayong (IFPRI)
Editing and Writing:Christine Peña (World Bank), Lynn Brown (IFPRI), Eugenie Feakin (ICRISAT)
Computer Support:Nancy Walczak, Dave Bruton, Mary Snyder, and Yin Leong (IFPRI)
Administrative Support:V.N. Krishnan, V.S. Swaminatham (ICRISAT), Lynette Aspillera, Tina Abad,
Ginette Mignot, Julia Addae-Mintah, Michelle Mendez, Jay Willis, Andy Orlin (IFPRI),Bruce Cogill (ISTI)
Intellectual Support:Margaret Bentley (Johns Hopkins University), Eunyong Chung (USAID), Bruce
Cogill (ISTI), Frances Davidson (USAID), Dr. P. Yasoda Devi, Ed Frongillo (Cornell
University), Dr. P. Geervani, Eileen Kennedy (USDA), Lynnda Kiess (World Bank), Dr.
K. Nair, Dr. G.N.V. Ramana (NIN), Dr. K. Chittema Rao (APAU), Dr. N. Prahlad Rao,
Dr. Vinodini Reddy (NIN), Jay Ross (AED), Andrew Swiderski (USAID), ElizabethTolley, and Kathleen Tucker (Tufts University).

EXECUTIVE SUMMARY
This paper reports on two methods used for identifying alternative indicators of chronicand acute food insecurity. A need for alternative indicators exists since many of the
"benchmark" or "gold standard" indicators (such as household income or dietary intake) are too
cumbersome to be of practical use in food aid targeting. The ideal alternative indicator should be
statistically reliable, yet straightforward to collect and analyze.The study uses data collected in four villages in the Indian Semi-Arid Tropics to illustrate
two methods for identifying the alternative indicators. A qualitative methodology included
ethnographic case studies of at-risk households, participatory mapping of vulnerable households
within a community, food charts, and seasonality charts. The quantitative methods included botheconomic and nutrition surveys. The data were collected over three rounds in 1992-93 from 324
households in south-central India.
For the qualitative work, we used both the villagers' perceptions of food insecurity as well
as the ethnographers' observations to generate a list of indicators for these areas. Triangulationamong the various qualitative methods was used to validate the indicators suggested. For the
quantitative study, we used statistical methods to test the strength of association between each
indicator and six benchmark measurements of food security. The benchmark measurements were
derived from dietary recall, anthropometric, and blood data. The dietary data were used togenerate a benchmark for chronic and acute households' food insecurity. The anthropometric
data were used to construct benchmarks of chronic and acute preschooler food insecurity.
Finally, serum measures of vitamin A and iron adequacy were used to generate benchmarks of
household micronutrient insecurity.We tested a core set of alternative indicators against each of these benchmarks. The
majority of the alternative indicators were drawn from a review of the food security literature as
well our own qualitative work in the study sites. Other indicators were included as they
represent information that is typically available in secondary data sets collected by governmentsand research institutions.
For each benchmark, the quantitative tests involved two steps. We first "screened" the
large set of core indicators for their statistical association with the appropriate benchmark. We
then used a hypothesis-testing framework to test the relationship between the "screened"indicators and the benchmark of interest. The strength of the association was assessed using two
criteria: a Bonferroni-corrected chi-square statistic and an unadjusted chi-square statistic.
Indicators that proved successful in the quantitative analysis were used in targeting
simulations to explore the savings associated with using indicators to target food aiddistributions. The simulations assumed a certain set of program characteristics. Given that
program parameters will vary, these simulations are illustrative of the potential benefits to
targeting. The results indicate that modest but significant associations between a targeting
indicator and the benchmark can provide savings in terms of program costs. In some cases, theprogram savings can be quite substantial. We note, however, that program costs are not the only
cost-related issue at stake; rather, data collection costs and the social and financial costs of
making targeting "mistakes" must also be taken into account. A full accounting of these costs
can render an alternative indicator less efficient than a benchmark indicator.

viii
Assuming that a benchmark indicator is either too expensive or infeasible to use, arequalitative or quantitative methods more appropriate for choosing an alternative indicator? Our
experience indicates that the choice of method depends on the type of human and financial
resources available to an organization, the speed with which decisions must be made, and the
types of secondary data already available. For example, targeting at the household andindividual levels is likely to be a component of an NGO's programming activities. Given that (1)
NGOs often work intensively in a limited number of communities and that (2) financial and
human resources are generally limited, the qualitative method appears to be the most viable
option for these organizations.On the other hand, a combination of qualitative and quantitative methods might be more
appropriate for organizations that plan to carry out more centralized forms of targeting (such as
governments, large-scale NGOs, or international organizations.) The quantitative methods,
however, require large sample sizes for statistical testing as well as personnel and equipment tocollect and analyze these data. As such, use of these methods is limited to institutions with the
requisite financial, human, and computing resources.
Clearly, there are advantages and disadvantages to each method chosen. The qualitative
methods require less time for analysis, but require staff with special talents for interpretingqualitative information. In addition, qualitative results are not generalizable and are thus
location-specific. By contrast, the quantitative method requires staff with statistical skills as well
as large databases that increase the probability of sufficient power for tests of statistical
association. The results from quantitative studies are more generalizable to similar populations,but can be puzzling if little is known about the program areas. As such, qualitative information is
useful for indicator identification and evaluation, even when a quantitative approach is taken.
Finally, we must underscore the difference between using a qualitative method and a
participatory one. At the outset, we planned to use participatory methods as we thought theywould be more respectful and empowering to the communities we studied. However, we found
that despite our best intentions, the research-based participatory methods were no more
empowering for the villagers than our survey methods. This is more a testament to the objective
of pursuing a predetermined research agenda rather than a failure of participatory methods per se. Our experience leads us to believe that qualitative techniques are truly participatory when
employed in action-orientation interventions.

1. INTRODUCTION
THE NEED FOR ALTERNATIVE INDICATORS OF FOOD SECURITY FOR TARGETINGTargeting scarce resources toward the food insecure lies among the many objectives of
food-related information systems. Although targeting is not a new tool, its use has become even
more relevant in today's era of ever-shrinking aid budgets. To be successful, however, a viable
targeting system requires indicators that are valid and reliable for identifying at-risk groups andstill straightforward and inexpensive to use. In spite of this obvious need, a recent survey of food
and nutrition policymakers in developing countries found many of the recommended indicators
difficult to incorporate into ongoing information and targeting systems (Kennedy and
Payongayong 1991). Too often, indicators are laborious and expensive to collect, difficult toanalyze and interpret, and of limited use in targeting-related activities.
A need therefore exists for food security indicators that are simple to derive and simple to
use. Recent empirical analyses by Haddad, Sullivan, and Kennedy (1992) suggest that relatively
simple indicators can perform well in locating the food insecure. Their work suggested thatindicators such as number of unique foods consumed, region, dependency ratio, household size,
rooms per capita, incidence of illness, vaccination status, age at weaning, drinking water and
sanitation facilities—all coded with only two or three different values—were able, either singly
or in combination, to identify food-insecure households and preschoolers.This work continues the work by Haddad, Sullivan, and Kennedy (1992) by exploring the
methodological issues related to the identification and validation of alternative indicators for
targeting food security programs. Two distinct methods of indicator development are
considered: qualitative methods that rely on indigenous knowledge and quantitative methodsthat rely on conceptual models derived from theory.
THE NEED FOR ALTERNATIVE INDICATORS IN INDIA
Fortunately, famines in India are a "nightmare of the past" (Gopalan 1992). This has beendue to: food production that has kept up with population increases, government buffer stocks of
grain which have stabilized food grain prices, democracy and a free press to give the rural poor a
voice, the existence of relatively efficient inter-regional grain markets, the availability of
informal consumption credit, and a set of explicit famine-relief policies such as rural publicworks programs (Drèze 1988; Bidinger et al. 1990).
Given the successful prevention of famine in India, is there a need for improved targeting
of food security and nutrition programs? There are at least two reasons why the search for better
targeting methods is crucial. First, improvements in aggregate food availability at the nationaland regional levels have not eliminated chronic and often severe food insecurity throughout

2
much of the country. Child malnutrition rates in India, for example, continue to cause alarm. According to the UNDP's 1994 Human Development Report, 63 percent of children under five in
India were underweight in 1990—the highest rate of any of the 127 developing countries listed
(UNDP 1994).
Second, current programs designed to address food insecurity come at the cost of scarceresources that have alternative uses. For example, India's Title II food aid program has ranked as
the world's largest non-emergency food program since its inception in 1954. In recent years, the
value of Title II food aid has reached approximately US$100 million annually. There is a
widespread feeling that current levels of food security in India could be achieved with less strainon public expenditures if policies were better targeted to the undernourished (Government of
India 1990; Ravallion and Subbarao 1992; Jha 1992; Dev, Suryanarayana, and Parikh 1992;
Bapna 1991; Harriss 1991).
Food aid programs in India are diverse, but center on providing aid to food-insecurepreschoolers, women, and households (USAID 1994). Resources are currently targeted in a
number of different ways. Under the Integrated Child Development Scheme (ICDS), health
workers are asked to use anthropometry to screen prospective children and pregnant women for
food supplements and child development programs (NIPCCD 1989). The World FoodProgramme currently runs a "self-targeting" Food-For-Work program, implicitly assuming that
only food-insecure households will avail of this work scheme. However, undercoverage is a
concern for many of these programs since not enough needy households or individuals receive
benefits (Kennedy and Slack 1993). Program leakage can be high in some areas, with benefitsoften accruing to those who would not otherwise be considered needy (NIPCCD 1989).
Interviews in our study villages indicated a frustration among aganwadi workers in their inability
to target resources better (Vasantha 1993).
Clearly, resources mobilized to combat food insecurity—whether from the Government ofIndia or in the form of donor food aid—will be much more effective if they can be targeted to the
most food insecure. But who are the food insecure and where are they? Is it possible to identify
these at-risk groups in a way that is consistent with local capacity for targeting and implementing
these programs?
RESEARCH OBJECTIVES
The objective of this study is to explore two methods for selecting "alternative" indicators
for targeting food security programs. In keeping with the message from policymakers andpractitioners around the world, the alternative indicators should be simple to develop, collect,
and use.
Specific study objectives include the development of relatively simple methods to:

3
1. Identify a set of candidate alternative indicators. This set of candidates will include(1)"generic" indicators that are derived from a general conceptual framework of food
security and are not unique to a particular setting as well as (2) "location-specific"
indicators that are derived from qualitative field methods in the study area.
2. Identify appropriate "targeting" indicators by testing the statistical association of thecandidate indicators with more direct, benchmark measures of food security.
3. Assess the relative performance of each of the targeting indicators for improving the
efficiency of food security and nutrition-related programs. Increased efficiency is defined
in terms of reducing program costs and maximizing the social benefit associated withprograms.
OUTLINE OF REPORT
The study focuses on four villages in two Indian States: Maharashtra and Andhra Pradesh. Alternative and benchmark indicators of household and individual food security were collected
using survey, ethnographic, and participatory methods during three rounds between August 1992
and September 1993.
Qualitative methods are used to identify locally-determined indicators of food insecurity. These methods include participatory rural appraisal exercises and traditional ethnographic case
studies. In addition to the qualitative studies, a quantitative approach is presented for identifying
indicators. For this method, the alternative indicators are compared to a set of benchmark
indicators that are presumed to represent the true food security situation. The benchmarkindicators are based on caloric adequacy measures, anthropometry, and biochemical serum
determinations.
The performance of the alternative targeting indicators are judged by the strength of their
association with the benchmark indicators as well as their cost-effectiveness. Two-by-twocontingency tables are used to determine whether the proportion of cases (households or
individuals) with a certain indicator characteristic are more likely to be food insecure than those
without the same characteristic (Snedecor and Cochran 1989). Various targeting simulations are
also undertaken to demonstrate the potential resources saved through targeting with theindicators identified.
4
Appendix 7.1 provides a more complete review of nutrition monitoring systems in India.1
2. LITERATURE REVIEW
FOOD AND NUTRITION MONITORING IN INDIA1
A large number of nutritional assessment studies were undertaken in India over the period
1918-1972. Their coverage was limited, however, and they were not undertaken on a regularbasis. This lack of comprehensive repeated assessments led the Indian Council of Medical
Research to set up the National Nutrition Monitoring Bureau (NNMB) in 1972. The NNMB's
mission is to
• continuously collect and process information on dietary intakes and
nutritional status of representative segments of the Indian population,
using standardized procedures and techniques, and
• undertake periodic evaluation of ongoing national nutrition programs.
A recent evaluation of the NNMB's activities (Rao, Sastry, and Rao 1987) found that
current operations were hampered by lack of internal coordination and excessive administrative
bureaucracy. As part of a series of efforts to improve the NNMB's efforts, the National Instituteof Nutrition (NIN) initiated a project to develop a nutritional surveillance model that used simple
and sensitive indicators that would be useful to both macro and micro planning. The project has
been undertaken in Andhra Pradesh, and is designed to
1. Use primary and secondary data sources to illuminate the relationship between basic needs
indicators, economic, environmental, and agricultural factors, and food consumption and
nutritional status;
2. Develop a set of simple, quick to collect, and cost-effective indicators to form the core ofa nutrition surveillance system; and
3. Develop both the computer software and hardware necessary to implement the monitoring
system.
The need for indicators with such characteristics has been identified by the NIN as of
paramount importance. The research undertaken as part of this study, to identify effective
indicators that are simple to collect and use in targeting ongoing nutrition programs, is a timely
and innovative complement to the efforts planned by NIN.

5
CONCEPTUAL FRAMEWORK FOR UNDERSTANDING FOOD SECURITYFor this work, we adopt a commonly accepted definition of food security:
When all people at all times have both physical and economic access to sufficientfood to meet their dietary needs for a productive and healthy life (USAID 1992).
By this definition, food security is a broad and complex concept that is determined by agro-
physical, socioeconomic, and biological factors (Campbell 1991; von Braun et al. 1992).
Furthermore, food security is defined by a triad of concepts: food availability, food access, andfood utilization. By implication, the "food insecure" have lost, or are at risk of losing,
availability and access to food, or the ability to utilize it. Several researchers have included this
concept of vulnerability in their definitions of food security (Watts and Bohle 1993; Radimer,
Olson, and Campbell 1990; Kendall, Olson, and Frongillo 1995). Few, however, have broadenedthe notion of food security to include elements of social acceptability (Radimer, Olson, and
Campbell 1990; Kendall, Olson, and Frongillo 1995) and sustainability (Chambers 1991).
It is also important to recognize the temporal dimensions of the food security concept.
Chronic food insecurity is characterized by a persistent inability to attain food access over thelong term. Acute food insecurity is characterized by abrupt declines in food security status over a
relatively short period of time. These short-term declines in food security status may occur on a
fairly regular basis as the result of seasonal changes in food access in a given area. They may
also be associated with less frequent, but more acute, declines in food access, as in the case offamine.
The factors that influence the food security status of households and individuals may be
quite diverse. The United States Agency for International Development (USAID) identifies a
range of important issues that lead to the food insecurity of households and individuals in thedeveloping world. These include, among others; chronic poverty, rapid population growth,
declining per capita food output, poor infrastructure, ecological constraints, limited arable land,
disease, poor water and sanitation, inadequate nutritional knowledge, civil war, and ethnic
conflicts (USAID 1995).Figure 1 summarizes the diverse determinants of food security status into a general
conceptual framework. In particular, the framework highlights the hypothesized causal
relationships between the various elements of food availability, access, and utilization. It
therefore focuses on the links between the resources commanded by the household, levels offarm and off-farm production, household income, household and individual consumption, and
individual nutrition. This configuration suggests that adequate food availability is a necessary,
although not sufficient, condition to achieve adequate food access. Food access, in turn, is
necessary, but not sufficient, for adequate food utilization.

6
There are likely to be a number of exceptions to this general statement of relationships. As2
an example of one exception, although not in close proximity along the causal chain defined inFigure 1, demographic indicators such as education levels and household size are thought to bestrongly associated with nutritional status outcomes.
FOOD SECURITY INDICATORSFigure 1 also provides a brief list of indicators associated with each link in the food
security causal chain. These indicators are derived from the food security literature. This
literature spans a wide range of disciplines—including anthropology, nutrition, sociology,
geography, public health, epidemiology, and economics. The recent literature is reviewed inHaddad, Sullivan, and Kennedy (1992) and Maxwell and Frankenberger (1992).
The indicators described in Figure 1 are somewhat "generic," as they are defined by theory
rather than by a specific set of empirical observations. As a result, it is expected that these
indicators may be obtained in a fairly consistent fashion across locations and socioeconomiccontexts. This list of indicators is intended to be suggestive, however, not exhaustive.
Undoubtedly, there are other indicators suggested by food security theory that have been
excluded. Furthermore, there are sure to be additional indicators of food security that are unique
to a particular setting. Such indicators may only be identified through fieldwork in each location.The conceptual framework is useful as a starting point for identifying food security
indicators for targeting. The precise measures chosen as targeting indicators will depend on the
particular aspect of food access that the intervention is designed to address. Consider, for
example, a program focused on improving food access. Figure 1 suggests that targeting criteriashould be chosen from measures that represent household production, income, or consumption.
Similarly, efforts to improve food utilization would likely employ indicators of consumption and
nutritional status as targeting criteria.
When direct measures of these targeting criteria are difficult or expensive to obtain, theconceptual framework may also assist in the identification and prioritization of alternative
indicators to test as proxies. In general, indicators in close proximity to one another along the
causal chain described in Figure 1 are likely to be more strongly associated than those that are
more distantly located. Indicators of frequency of consumption of particular foods, for example,2
are expected to be relatively strongly associated with indicators derived from dietary intake data,
compared to indicators in the income category. Similarly, indicators of consumption are
expected to be more strongly associated with indicators of nutritional status

CONSUMPTIONTotal expenditureFood expenditureNonfood expenditureConsumer pricesDietary intakeFood frequencies
NUTRITIONAnthropometrySerum micronutrient levelsMorbidityMortalityFertilityAccess to health servicesAccess to clean water sourceAccess to adequate sanitation
INCOMETotal incomeCrop incomeLivestock incomeWage incomeSelf-employment incomeProducer pricesMarket/road access
PRODUCTIONTotal area cultivatedIrrigated areaArea in fallowAccess to/use of inputsNumber of cropping seasonsCrop diversityCrop yieldsFood productionCash crop production
RESOURCESNatural:Rainfall levels/stabilitySoil qualityWater availabilityForest resource access
Physical:Livestock ownershipInfrastructure accessFarm implement ownershipLand ownership/accessOther physical assets
Human:Gender of household headDependency ratioEducation/literacy levelsHousehold sizeAge of household head
7
Figure 1—Food security conceptual framework and "generic" indicator categories

8
With exceptions due to confounding, measurement error, etc.3
than indicators of production. This suggests a hierarchy for testing alternative indicators whenresources are limited: indicators that lie close to the direct measure should be tested first, as they
are most likely to have a strong association with the benchmark. There will, of course, be
exceptions to this statement. Yet, in general, such indicators are more likely to identify the3
intended segment of the population than those selected from more distant points along the causalchain.
INDICATORS FROM INDIA
A review of the India literature reveals a specific set of indicators that are thought tocapture important aspects of food security status. Correlates of preschooler nutrition status
include low (scheduled) caste, no land (or very little), poor nutrition knowledge, mother forced to
work outside the home, young age of mother at marriage, later-born child, being a girl-child, and
recent diarrheal infection (Chung et al. 1996, Appendix 2).
3. METHODOLOGICAL FRAMEWORK
INDICATORS OF CHRONIC AND ACUTE FOOD INSECURITY
This chapter presents a method for identifying food security indicators at the individual
and household levels. Alternative indicators are developed for both chronic and acute food
insecurity. For this study, area indicators of chronic food insecurity are necessary because manyof the households are persistently food insecure. Indicators of acute food security are also
necessary, because some households are expected to exhibit seasonality in food production,
income generation, and morbidity rates. Consequently, we focus on identifying indicators that
tell us if a household is chronically food insecure and indicators that predict acute, season-to-season declines in household food security. It is important to note that households can
simultaneously exhibit chronic and acute food insecurity.
IDENTIFYING CANDIDATE INDICATORSTwo types of candidate indicators are proposed. Candidate indicators are termed generic
indicators if (1) they can be collected in a number of different settings and (2) they are derived
from a well-defined conceptual framework of food security. Although the candidate indicators
are postulated to operate across a wide range of possible settings, their interpretation and relativeimportance in describing a particular aspect of food security is likely to be context-specific. The
actual usefulness of any generic indicator must therefore be tested in the context of each

9
program. Examples of generic indicators are the household dependency ratio and the incidenceof preschooler illness in a household.
Fieldwork may also reveal a set of indicators that we call location-specific. Location-
specific indicators typically only carry meaning within a particular study area due to unique
agroclimatic, cultural, or socioeconomic factors. Types of food grown that are unique to an area,local seasonal behavioral patterns, or cultural feeding practices may define location-specific
indicators. In India, an example of a unique indicator might be "caste." Location-specific
indicators can only be identified from a detailed understanding of local conditions. This
understanding is best obtained by using qualitative data collection methods.In this study, we use both qualitative and quantitative methods to identify and test
alternative targeting indicators. The generic indicators are identified from the food security
literature and tested using statistical methods. The location-specific indicators are suggested by
information generated using qualitative methods.
THE NEED FOR A BENCHMARK
The search for effective alternative indicators relies upon comparisons of the candidate
indicators to a benchmark or "gold standard" measure of food security. This comparisonhowever, assumes that the benchmark indicator is itself a direct and accurate measurement of
"true" food security status.
Given that food security is a multifaceted concept, there is no one indicator that
encompasses all dimensions of availability, access, and utilization. However, from a practicalperspective, a multifaceted food security indicator may not be what is needed. Rather, most food
security programs are designed to address a particular element of the food security problem. As
such, the choice of a benchmark indicator for selecting alternative targeting indicators should
depend on the objectives of each program.Assume, for example, that chronically low levels of food access is the food security
concern that requires intervention. Under these conditions, candidate alternative indicators
should be tested against a benchmark indicator of chronic access. A long-term measure of per
capita food expenditure or energy intake are possible examples of appropriate benchmarkindicators. Similarly, if preschooler malnutrition is the critical food security concern, then the
benchmark measure might be some measure of child anthropometry. In the area of nutrition in
particular, there is a considerable body of expertise in identifying appropriate indicators for
various program types and information purposes (see, for example, Habicht and Pelletier 1990).For the purposes of this study, alternative targeting indicators will be derived for six
specific dimensions of food insecurity: chronic and acute household-level food insecurity,
chronic and acute preschooler food insecurity, and vitamin A and iron deficiency. Table 1
summarizes the benchmark measures that will be used to evaluate a wide range of candidatealternative indicators in this study. The chosen benchmark of household food security is

10
To make a contingency table, observations are categorized by two dichotomous criteria. If4
the two variables are originally continuous variables, a "cutoff point" must first be chosen totransform the continuous variable into a dichotomous variable. The cutoff point determines whetheran observation is qualified as a "1" or a "0."
household energy adequacy. In order to increase the association between this indicator and thetrue, but unobserved, measure of adequate food intake (our definition of household food
security), we (1) undertake two repeated 24-hour dietary recall surveys within each season, (2)
collect three rounds of 24-hour dietary recall data in three seasons, and (3) construct calorie
requirements based on age, weight, sex, physiological status, and a three-scale classification ofactivity patterns.
The analysis of alternative indicators for preschooler food security use anthropometric
measures as benchmarks (height-for-age for chronic food insecurity and weight-for-height for
acute food insecurity). The benchmark indicators of vitamin A and iron insecurity are also basedon biochemical indicators of nutritional status. Serum vitamin A and hemoglobin serve as
benchmarks for these analyses.
QUANTITATIVE MEASURES OF ASSOCIATIONThere are a number of methods to evaluate the association between benchmark and
alternative indicators: correlation coefficients (both continuous and rank), factor analysis, cluster
analysis, and regression analysis, among others. Each of these methods has been reviewed for its
usefulness to this project and has been found to present significant limitations for the purposesoutlined above (Haddad, Sullivan, and Kennedy 1992; Haddad, Chung, and Yasoda Devi 1993).
Aside from these methods, two other methods merit special discussion: contingency tables
and receiver operating characteristic curves (ROC analysis). Contingency tables are frequently
used in the nutrition epidemiology literature as a measure of association. This method (alsoreviewed in Haddad, Sullivan, and Kennedy 1992) is summarized in Table 2 and described in
detail in Tucker et al. (1989).
In a contingency table, observations are categorized according to two dichotomous
criteria, the benchmark indicator and the alternative indicator. Statistical tests may be used to4
indicate whether the alternative indicator is significantly associated with the benchmark
indicator. Indicators that show a significant association with the benchmark can be rated
according to two criteria: sensitivity and specificity. Sensitivity is defined as the proportion of
truly food-insecure individuals that is identified by the alternative indicator (i.e., the probability

11
Table 1—Definition of benchmark indicators of food insecurity used in the quantitativeassessment of alternative indicators
Indicator of Chronic Indicator of AcuteConditions Conditions
Household-level food Households with less Households dropping below insecurity than 70 percent of 70 percent caloric
caloric adequacy in four adequacy between surveyof six visits rounds 2 and 3, or those already
below 70 percent adequacyexperiencing a further drop of10 percent or more
Preschooler-level food Children five years of Children under five years of insecurity age and under with age among the 30 percent
height-for-age Z-scores with the most acute declineless than -3.00 in weight-for-height Z-score
between rounds 2 and 3
Indicator of Vitamin A Indicator of IronDeficiency Deficiency
Micronutrient deficiency Households containing Households with at leastat least one woman or one woman or child withchild with serum vitamin hemoglobin levels less thanA levels less than 20 WHO cutoffsµg/dl

12
There are diagnostic instances when sensitivity and specificity are not weighted equally.5
In this case, researchers might chose an indicator for its performance on sensitivity or specificity.
Table 2—Relationships between true food insecurity, as determined by the benchmark andfood insecurity measured by the alternative
"True" Benchmark Measure of Food Security
Yes No
Alternative Measure Yesof Food Security
True-Positive False-Positive (a) (b)
NoFalse-Negative True-Negative (c) (d)
Sensitivity = True-Positive/(True-Positive + False-Negative) or a / a+c
Specificity = True-Negative/(False-Positive + True-Negative) or d / b+d
Positive Predictive Value = True-Positive/(True-Positive + False-Positive) or a / a+b
Source: Habicht, Meyers, and Brownie (1982).
of a true positive). Specificity refers to the proportion of truly food-secure individuals that is
correctly identified by the indicator (i.e., the probability of a true negative). If an indicator is to
be effective at identifying the food insecure, it is important for both sensitivity and specificity tobe high. As such, it is common in the nutrition literature to sum the sensitivity and specificity.5
Note, however, that the sensitivity-specificity table assumes that an appropriate cutoffpoint has been chosen for the alternative indicator. Research in the surveillance literature has
shown that the performance of an indicator can be highly dependent on the chosen cutoff.
Indicators can be compared, however, across a range of cutoffs using ROC analysis. This
method is a generalization of the two-by-two sensitivity-specificity analysis described above. Ithas been used in psychology (Szucko and Kleinmuntz 1981), medicine (Swets 1979), and

13
This is optimal in the sense that the maximum of this sum maximizes the measured6
difference in prevalences (between groups or over time), on average.
nutrition epidemiology (Brownie, Habicht, and Cogill 1986; Ruel, Rivera, and Habicht 1995;Ross et al. 1995), among other fields.
From a technical perspective, the optimal cutoff point exists at the point where the sum ofsensitivity and specificity are maximized. In practice, however, the choice of the cutoff may be6
fixed by program objectives and budgetary considerations. In many cases, program managers
may wish to target only that segment of the population that is most food insecure. This is likely
to be the targeting objective in cases when the program budget is insufficient to address theneeds of all who are considered food insecure. Under these circumstances, the best targeting
cutoff is one that will deliver exactly the number of participants for which program resources
suffice (Habicht, Meyers, and Brownie 1982). In other words, the cutoff would be set at a value
corresponding to the percentage of the population that can be served with available programresources.
Selected Method of Quantitative Analysis
After careful consideration, the chosen method for this study is the two-by-two
contingency table. For illustrative purposes, the cutoffs for the alternative indicator are set at
either the lower 25 percent or the upper 25 percent of the distribution. The candidate indicatorsare then "screened" and tested statistically for the strength of their association with the
benchmark indicator of interest (e.g., household and preschooler food insecurity, or
micronutrient insecurity). We underscore that the selected cutoff levels do not represent "the
optimal cutoff" for this indicator. Rather, this method exemplifies a practical scenario faced byprogram staff and, more importantly, represents a level of analysis that is possible for program
managers in India and elsewhere in the developing world.
INDICATOR SELECTION CRITERIA
The choice of a targeting indicator should be based not only on its statistical strength of
association with a known benchmark of food insecurity, but also on the total costs and benefitsassociated with collecting and using that indicator. The benefits of using an indicator include (1)
correctly excluding from a program the individuals that are truly food secure, and thus avoiding
the cost of a wasted intervention (leakage), and (2) correctly including food-insecure individuals
into a program, and thus reducing the social costs associated with unchecked food insecurity. The social costs of food insecurity include the psychological cost of hunger, decreased physical
and cognitive development in children, the value of foregone income as a result of lower
14
Note that in a field setting, it is possible for an alternative indicator to be more accurate than7
a benchmark indicator if it is more objective in its interpretation than the benchmark. Consider, forexample, a situation in which individuals are likely to bias their responses to an benchmark querybecause they perceive that they will receive a benefit if a they give a certain response (e.g.,underreporting income). An alternative indicator may be more accurate than a benchmark ifrespondents are less likely to bias a response to an alternative query (e.g., frequency of meatconsumption).
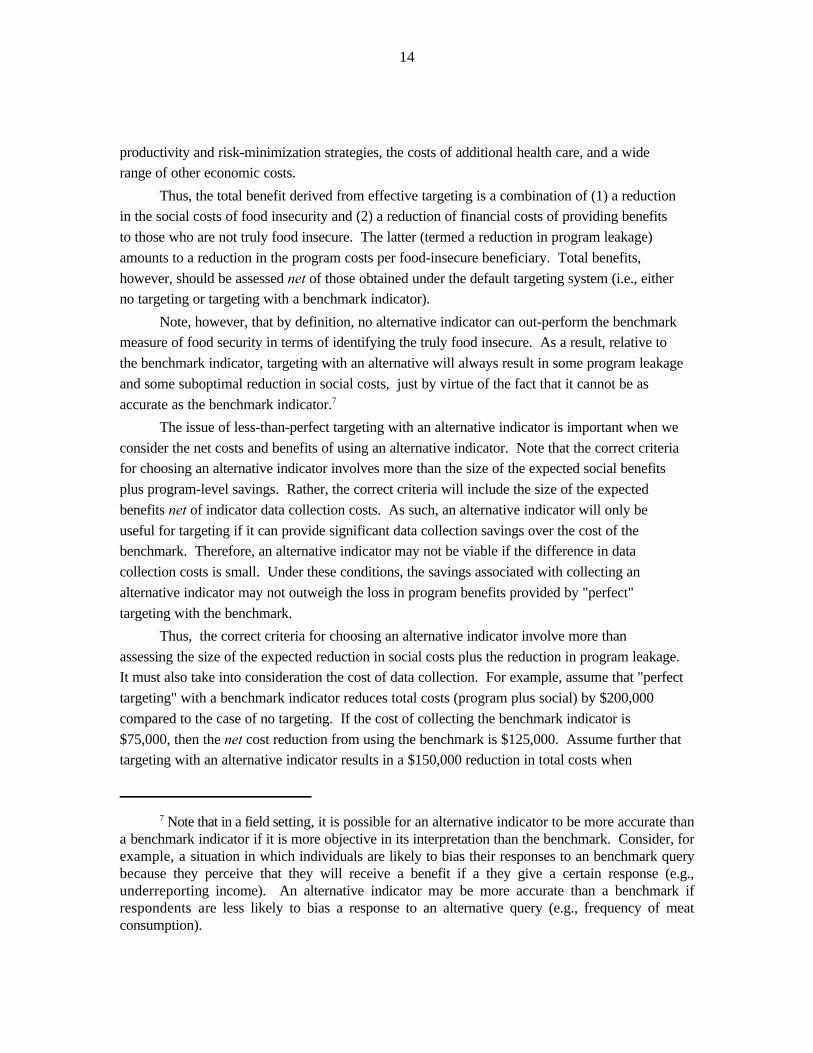
productivity and risk-minimization strategies, the costs of additional health care, and a widerange of other economic costs.
Thus, the total benefit derived from effective targeting is a combination of (1) a reductionin the social costs of food insecurity and (2) a reduction of financial costs of providing benefits
to those who are not truly food insecure. The latter (termed a reduction in program leakage)
amounts to a reduction in the program costs per food-insecure beneficiary. Total benefits,
however, should be assessed net of those obtained under the default targeting system (i.e., eitherno targeting or targeting with a benchmark indicator).
Note, however, that by definition, no alternative indicator can out-perform the benchmarkmeasure of food security in terms of identifying the truly food insecure. As a result, relative to
the benchmark indicator, targeting with an alternative will always result in some program leakage
and some suboptimal reduction in social costs, just by virtue of the fact that it cannot be as
accurate as the benchmark indicator.7
The issue of less-than-perfect targeting with an alternative indicator is important when we
consider the net costs and benefits of using an alternative indicator. Note that the correct criteriafor choosing an alternative indicator involves more than the size of the expected social benefits
plus program-level savings. Rather, the correct criteria will include the size of the expected
benefits net of indicator data collection costs. As such, an alternative indicator will only be
useful for targeting if it can provide significant data collection savings over the cost of thebenchmark. Therefore, an alternative indicator may not be viable if the difference in data
collection costs is small. Under these conditions, the savings associated with collecting an
alternative indicator may not outweigh the loss in program benefits provided by "perfect"
targeting with the benchmark.
Thus, the correct criteria for choosing an alternative indicator involve more than
assessing the size of the expected reduction in social costs plus the reduction in program leakage. It must also take into consideration the cost of data collection. For example, assume that "perfect
targeting" with a benchmark indicator reduces total costs (program plus social) by $200,000
compared to the case of no targeting. If the cost of collecting the benchmark indicator is
$75,000, then the net cost reduction from using the benchmark is $125,000. Assume further thattargeting with an alternative indicator results in a $150,000 reduction in total costs when

Bi ' sTPi ,
maxi
Bi
Ci
, for allBi
Ci
> 1,
15
Depending on whether the intervention alleviates all or only a part of the food security8
problem, the social benefit of an intervention consists of the social cost of the problem in the absenceof the intervention multiplied by the fraction which the intervention actually addresses. Equation2 assumes that the intervention solves the problem completely.
(2)
compared to the no-targeting case. In this example, using the alternative indicator is warrantedonly if the cost of data collection is less than $25,000; otherwise the net reduction in costs would
be less than that provided by the benchmark indicator ($125,000).
The decision to use a targeting indicator can be formalized into a cost-benefit problem.
Targeting indicators, for example, should be selected such that they maximize the social benefits
derived from the program, while minimizing the combined social and program costs (including
indicator data collection costs). This is equivalent to choosing the targeting method thatmaximizes the program cost-benefit ratio, as specified:
(1)
where B = social benefit of program targeted on indicator i, and C = total (social plus program)i i
cost with intervention targeted on indicator i.
In this formulation, the total benefit of the program that is targeted using indicator i can be
defined as the extent to which the social cost of food insecurity is reduced. In theory, this can be
calculated as the number of truly food-insecure individuals receiving benefits under the program
(true positives or TP) multiplied by the per capita social cost of food insecurity :8
where s = per capita social cost of food security problem, and TP = number of true positivesi
obtained with indicator i. In practice, however, the social cost of food insecurity is difficult to
measure (this issue will be discussed below).
As represented in Equation (3) below, the calculation of total costs includes
program intervention costs: the cost of providing goods and services to each participant
in the intervention multiplied by the total number ofparticipants in the program (including those identified by the
targeting indicator who are truly food insecure [true
positives] and those identified by the targeting indicator
who are not truly food insecure [false positives]);
social costs of remaining the per capita social cost of the food security

Ci ' r(TPi % FPi) % sFNi % Di,
16
(3)
food insecure: problem of concern multiplied by the number of truly food-insecure individuals who are misclassified by the targeting
indicator and do not receive benefits under the intervention
(false negatives); and
targeting costs: the costs associated with identifying targeting indicators and
collecting and analyzing this information from individuals
who are candidate participants in the program.
where
r = per capita program costs,
FP = number of false positives obtained with indicator i,i
FN = number of false negatives obtained with indicator i, andi
D = targeting costs using indicator i.i
With some types of interventions, there might be additional costs associated with treating
false positives. Some health interventions, for example, produce deleterious side effects in
individuals that are incorrectly diagnosed. These side effects can represent costs over and abovethe financial costs of program leakage. For food security programs that are focused on energy
supplementation (as opposed to vitamin A megadose supplementation) we believe that it is
appropriate to assume that the intervention has no negative side effects and, indeed, will
probably generate benefits for the false positive recipients. In such cases, the cost of a falsepositive is limited to the financial cost of the intervention (program leakage costs) and the social
costs of a false positive are equal to zero (see Habicht, Meyers, and Brownie 1982).
As may be apparent, the actual calculation of the social costs of food insecurity and
malnutrition can be quite complicated. Leaving aside the question of the physical and
psychological costs, it is difficult to measure the economic costs of food insecurity, given the
difficulty of quantifying the costs of lost productivity, additional health care costs, and otherdirect and indirect effects (Strauss and Thomas 1995). Therefore, comparison of targeting
indicators on the basis of a complete accounting of costs and benefits may not always be
possible.
On the other hand, calculating the program costs involved in delivering a set of goods and
services to program beneficiaries is relatively straightforward, as is the determination of targeting
costs. Obviously, these costs are likely to vary significantly across contexts. In particular, datacollection costs, even for similarly defined indicators, can vary significantly from program to
program, depending on the method of data collection utilized and the ability to share costs or

17
"piggy-back" targeting efforts on to other program functions. In the research setting, forexample, data collection costs can be quite high. In most cases, staff for data collection, data
entry, and preliminary data analysis are recruited and trained specifically for the research survey,
implying high labor and training costs. Equipment such as computers may also have to be
specially purchased for the research effort as well. Where population densities are low, orsurvey locations are spread out across distant locations, the logistics costs of information
gathering for research purposes may also be quite large.
In contrast, in an operational context, where well-trained program staff are already in
place in the field, the requirements for additional staffing, equipment, logistics, and training costs
are likely to be minimal. In the program setting, the cost of information is likely to represent
primarily the opportunity cost of the time of existing field staff. This cost itself will varyconsiderably, not only with the complexity of the data collection task, but according to whether
the information is gathered at a central program location or requires visits to individual
households. An important concern in any program-based data collection effort is the possible
erosion in the quality of the goods and services provided under the program, given excessive datacollection and reporting requirements. This fact underscores the need to identify relatively
simple indicators for targeting purposes.
The development of any targeting system is likely to entail two potentially separate data
collection efforts with significantly different staffing and cost implications. First, in the initial
stages of the program operations, some type of qualitative and quantitative fieldwork will be
necessary to identify and test candidate indicators. Second, in the course of program operations,the screening of households or individuals for participation in the program according to the
selected targeting indicator(s) will represent an ongoing data collection effort that may be quite
distinct from the first. To the extent that the assessment of targeting indicators can be linked to
baseline data collection activities of a program monitoring and evaluation system, for example,there may be opportunities to significantly contain the information system costs.
This study will focus on methods to be used in the initial evaluation of targetingindicators, rather than operational issues related to ongoing program screening. Because the
present research activity is unable to mirror data collection costs incurred in a program
setting—particularly ongoing screening costs, this study will carry out various targeting
simulations to illustrate the method for determining the worth of an alternative indicator. Thesimulations will first illustrate the potential reduction in program leakage from improved
targeting under a set of fixed assumptions regarding the size of the program and the per capita
program costs of an intervention. The simulations will also address the issue of the social cost of
food insecurity by defining the range of social costs over which the choice of an alternativeindicator may (or may not) be appropriate. In cases where these ranges fall outside the set of
realistic estimates of the likely social cost of food insecurity, clear choices among indicators may
still be possible.

18
More specifically, we were constrained by our inability to find investigators that were fluent9
in Marathi and could carry out the nutrition surveys. Constraining the survey to four villages meantthat fewer Marathi speakers were needed. The four-village survey was also more economical.
4. STUDY DESIGN
PROJECT SITE
Four villages were chosen for the study. All four villages were part of ICRISAT's
longitudinal Village Level Studies (VLS) conducted between 1975-84 (Old VLS) and 1989-90
(New VLS). These data have been the subject of many studies and are well documented in
Walker and Ryan (1990).
Visits to the six villages in March 1992 indicated that a six-village study would be
logistically difficult. Instead, a four-village study of Kanzara, Shirapur, Aurepalle, and Dokur9
was proposed. Kalman and Kinkheda villages were dropped from the sample since agricultural
conditions in Maharashtra were found to be more variable between districts rather than within
districts. Specifically, rainfall patterns (and hence crop performance) were quite similar in
Kanzara and Kinkheda, yet they varied considerably from those found in the dry SholapurDistrict, where Kalman and Shirapur were located. In the Mahabubnagar villages, the significant
variability in cropping patterns and irrigation practices prompted us to retain both villages
(Aurepalle and Dokur) in the sample.
The four study villages are located in three districts in two states of India. The villages
are described in Chung et al. (1996, Appendix 3). Dokur and Aurepalle are located in
Mahabubnagar District in Andhra Pradesh, Shirapur is in Sholapur District, Maharashtra, andKanzara is in Akola District, Maharashtra (see Figure 2). The village economies are based on
rainfed agriculture, but rainfall is low and is particularly erratic in Mahabubnagar and Sholapur
Districts (see Table 3). The villages are rural and have agrarian-based economies, but are quite
diverse economically and agroclimatically.
Aurepalle, a village that was once the worst-off economically (Walker and Ryan 1990), is
situated in an area that is prone to droughts. The soils are poor and most farming is dryland. Theincreasing value and demand for two rural products, toddy (local liquor) and sheep, has
diversified the village economy away from crop production. The effect has been to make many

19
Figure 2—Map of the study site
Source: Walker and Ryan (1990).

20
Table 3—Summary statistics for the four study villages
Characteristic AUREPALLE DOKUR SHIRAPUR KANZARA
Location Mahabubnagar, Mahabubnagar, Sholapur, Akola,Andhra Pradesh Andhra Pradesh Maharashtra Maharashtra
Distance from Hyderabad 70 kms south 125 kms south 365 kms west 528 kms north-westRainfall (general) Unassured; Unassured; Unassured; Assured;a
630 mm 630 mm 630 mm 890 mmTotal rainfall in 1992 428 mm 578 mm 319.4 mm 450.6 mm(monthly standard deviation) (38.72) (57.11) (36.17) (94.78)b
Soils Red soil Red soil Deep black Medium deep blacka
Low water retention Low water clay soil; high clay soil; mediumretention water retention water retention
Major crops Kharif Kharif Rabi sorghum, Cotton, sorghum,a
sorghum, pearl sorghum, pearl pigeon pea and mung bean, pigeonmillet, caster, paddy, millet, caster, paddy, minor pulses pea and wheatpigeon pea, pigeon pea,groundnut groundnut
Number of households in 1975 476 313 297 169a
Number of households in 1989-90 664 464 451 292b
Percent laborers 31% 24% 33% 32%a
Dominant caste groups Reddis Reddis Marathas Malia
Dhangars MarathasPercent literate adults 32% 29% 49% 66%c
Average per capita landholdings (hectares) 1.46 0.77 1.95 1.94c
Mean household energy intake(kcal per adult equiv per day) 2,265 2,298 1,957 2,044c
Mean iron intake (mg per adult equiv per day) 9.5 7.8 17.4 17.4c
Mean carotene intake (ug per adult equiv. per day) 408 528 1,248 864Average per capita land cultivated (hectares) 1.18 0.31 1.58 1.90c
Mean per capita total expenditure (rs per week) 58 45 67 41Average price of sorghum (rs per kg) (3 seasons) 3.08 3.20 5.10 2.97Average price of market rice (rs per kg) (3 seasons) 5.37 5.10 5.84 6.72Average 1992-93 male daily wage (rs/day) 18 20 25 22Average 1992-92 female daily wages (rs/day) 10 11 12 14
Walker and Ryan (1990, 4).a
Unpublished ICRISAT data.b
ICRISAT-IFPRI. 1992-93. Alternative Indicators Study.c

21
of the landless relatively well-off, so well-off that many have begun to acquire land. Farmingcontinues to be a major occupation, however, with the majority of plots still rainfed.
Dokur, like Aurepalle, is situated in Mahabubnagar District, but is significantly differentin two respects. First, the land is heavily irrigated, primarily from a large local tank. The effect
of irrigation is clear: opportunities for employment are greater in the post-rainy (r2) and summer
(r3) seasons. Second, the villagers in Dokur are accustomed to migrating for work during the
"slack" seasons. Typically, villagers join "work gangs" to find temporary employment inconstruction or agriculture. Migration opportunities therefore provide alternative sources of
income during the slack season or during difficult years.
Shirapur is situated in an area characterized by frequent droughts and erratic rainfall. The
village economy is very much dependent on local crop production. A government Employment
Guarantee Scheme (EGS) provides work for villagers, but the demand for labor is inconsistent as
well as insufficient to employ all that need work. Shirapur is located relatively close to Sholapurcity, but there is no tradition for migration in this village.
Finally, Kanzara is located in a rain-assured area of Akola District, hence dryland farmingis less at the mercy of the monsoon. In addition, significant employment is usually available
during the post-rainy (r2) and summer (r3) seasons as canal irrigation is available. Kanzara,
however, is situated at the end of the canal, so irrigation is not always assured. Neighboring
villages, however, have more assured access to canal irrigation, so there is usually a great deal ofstability to labor demand. The year in which our study was conducted, however, proved to be a
difficult year for this village. Canal water was withheld, so much less land was planted during
the rabi season. In addition, untimely rains during the late kharif season ruined the sorghum
crop, causing sorghum prices to plummet.
DATA COLLECTION METHODS
Two different styles of data collection were used for this study. The multiple forms of
data collection reflected our interest in (1) examining qualitative and quantitative methodologies
for identifying and testing alternative indicators and (2) determining whether food security
indicators are robust to method of investigation. Insights from this process may suggest that onemethod is more feasible or desirable under certain conditions.
Quantitative Data Collection Methods: Economic and Nutrition Surveys
Both economic and nutrition data were collected for this study (see Chung et al. [1996,
Appendix 4] for details of the survey data collection). Table 4 shows the various modules
collected in each of four study villages. Note that several modules offer overlapping
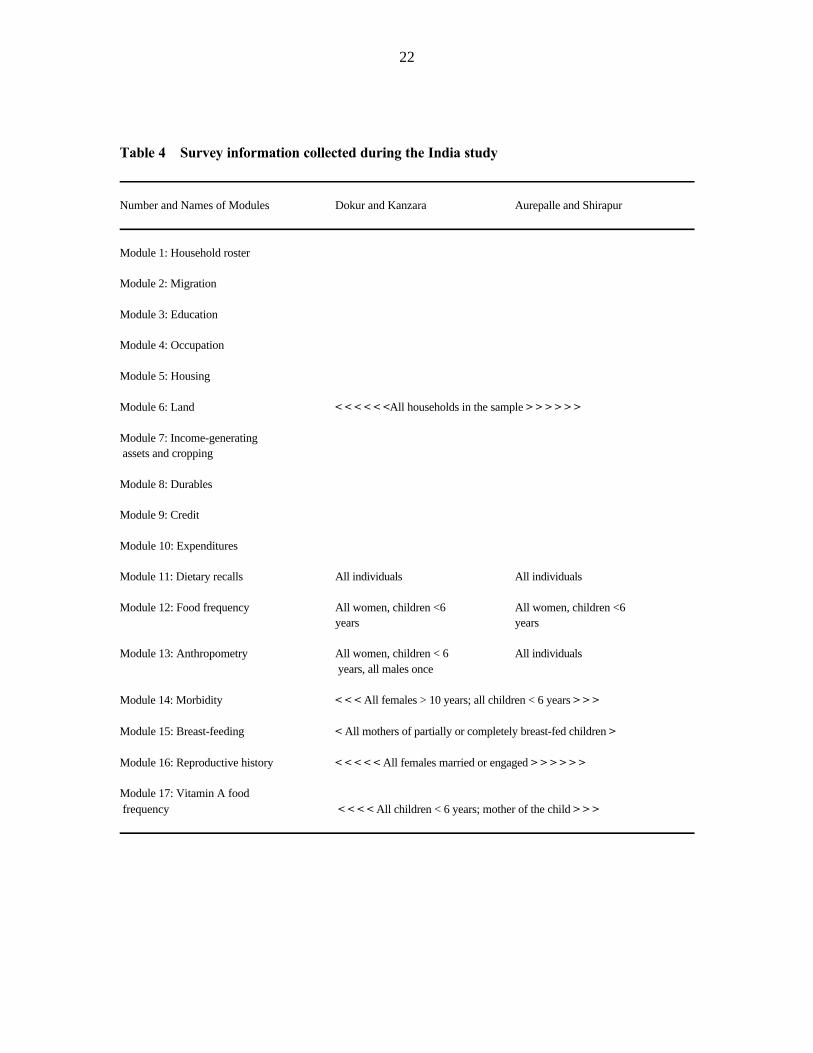
22
Table 4—Survey information collected during the India study
Number and Names of Modules Dokur and Kanzara Aurepalle and Shirapur
Module 1: Household roster
Module 2: Migration
Module 3: Education
Module 4: Occupation
Module 5: Housing
Module 6: Land < < < < < <All households in the sample > > > > > >
Module 7: Income-generating assets and cropping
Module 8: Durables
Module 9: Credit
Module 10: Expenditures
Module 11: Dietary recalls All individuals All individuals
Module 12: Food frequency All women, children <6 All women, children <6years years
Module 13: Anthropometry All women, children < 6 All individuals years, all males once
Module 14: Morbidity < < < All females > 10 years; all children < 6 years > > >
Module 15: Breast-feeding < All mothers of partially or completely breast-fed children >
Module 16: Reproductive history < < < < < All females married or engaged > > > > > >
Module 17: Vitamin A food frequency < < < < All children < 6 years; mother of the child > > >

23
information. One objective of the survey is to identify the methods that are most successful inthe indicator identification exercise.
The survey modules are designed to keep the form of the alternative indicators as simpleas possible. For example, income level was not calculated for each household. Rather, the
number of income sources and sources of household income were recorded for each household.
Lastly, we have focused many nutrition and health questions on females and children.
The focus on children is not new, but the focus on women who are not mothers is new. This
focus reflects a growing recognition that women contribute significantly to household food
production and, in many cases, are the sole providers of food. In such cases, it becomesimportant to understand that women's health status plays an important economic role within the
household and may therefore have an impact on food and nutrition security beyond that
associated with reproduction.
Qualitative Data Collection Methods
In addition to the survey data, qualitative data were also collected in two villages:specifically, participatory rural appraisal (PRA) modules, season-specific village-level
ethnographic reports, and six case studies of selected families. This information is used to (1)
develop unique location-specific indicators of food and nutrition insecurity and (2) provide
qualitative support for the information produced by the survey.
Participatory Rural Appraisal (PRA). Large surveys are often justly criticized for being
inappropriately designed and disrespectful of local knowledge. One way of countering this
criticism is to gain more information about the local context and to design surveys that areappropriate to this setting. Another approach is to employ data collection methods that
encourage researchers to listen to, and learn from, respondents (Chambers 1991). Specifically,
PRA data collection embodies the principles of "optimal ignorance" (not trying to find out more
than is needed) and "appropriate imprecision" (not measuring more accurately than is necessaryfor practical purposes).
The use of PRA techniques offers the possibility of obtaining a holistic picture ofindividual/family/community food security interactions while reducing the costs of data
collection. The application of the approach to nutrition and health is relatively recent (Bentley
1988) and has been mostly limited to project development and evaluation. However, recent
research experience focusing on the complementary nature of qualitative and quantitativemethods for evaluating health and nutrition status has proved to be quite successful (Paolisso and
Regmi 1992).
To explore the use of PRA as a research tool for generating indicators, three different
PRA exercises were conducted concurrently with the survey work. The three exercises chosen

24
for the study were village mapping, food charts, and seasonality charts (see Chung et al. [1996,Appendix 5] for the Guideline to PRA Methods for this study). Village mapping is used to
identify households that are at "very high risk" and "no risk" of food insecurity as defined by thevillagers. Essentially, the method involves asking a group of villagers to draw a map of their
neighborhood. Typically, the map is drawn on the ground using rangoli (or colored powder)provided by the investigators. The same group of villagers is then asked to identify households
that are "very high risk" of food insecurity by local standards. The villagers then provide
reasons for why these households were chosen. These "reasons" serve as emic or locally-defined
indicators of food insecurity.
The identification exercise is conducted separately for men and women in order to
measure gender-differentiated perceptions of risk. Figure 3 shows a map drawn in Aurepalleduring the last round in 1993. Figure 4 shows an example of a completed map.
The construction of food charts was undertaken at the household level. The key informantin each household is the person in charge of cooking. The informant is asked to list the foods
eaten in this season by the household. No attempt is made to standardize the number of foods
reported by the informant: the fact that an informant wishes to list two types of sorghum as
opposed to one may be a valuable indication of diet diversity or household coping. Theinvestigator then places a small bag with a sample of the food on a sheet in front of them to
represent each food. The informant is asked to place ten beans in a column above the food item
most consumed, and one bean on top of the food item least consumed. Next, the informant is
asked to place a colored bean below each food item to signify the frequency of consumption. Consumption of other foods is rated using 1-10 beans, using the two foods just identified by one
bean and ten beans. Figure 5 shows an upper caste woman in Shirapur completing a food chart.
The finished food chart is shown in Figure 6.
The third PRA method used is the seasonality chart. This method is conducted with small
groups (differentiated by gender and caste) to understand the yearly changes in rainfall, harvests
of two main staples, food consumption, male and female labor demand, childhood illness, and women's illness. Separate groups of men and women are asked to "make a picture" of how the
above aspects of village life has varied throughout the past 12 months. The group is asked to
place 10 beans of one color in a column above the month in which a particular characteristic
(e.g., rainfall) is highest. The group is then asked to place one color in a column above themonth in which the same characteristic is least evident. The remaining months are rated or
ranked using these two endpoints as reference points. The result is a histogram-like picture with
anywhere from one bean to ten beans above each month, illustrating the seasonal trends over
time. This exercise is then repeated with a group of higher caste to

25
Figure 3—Village map drawn in Aurepalle, Round 3

26
Figure 4—Example of a completed village map

27
Figure 5—Upper caste women in Shirapur, completing a food chart

28
Figure 6—A completed food chart

29
capture intra-village heterogeneity in perceptions. Figure 7 shows a group of low-caste mencharting availability of work in Aurepalle. The figure shows that the exercise is characterized by
lively discussion. Figure 8 shows a close-up of a completed seasonality chart. Note that pictures
of local festivals and agricultural events are used to depict the months of the year. Pictorial
representations increase participation by illiterate villagers.
Ethnographic Case Studies. In a further attempt to learn how villagers describe the concepts we
understand as "hunger" and "food insecurity," an ethnographer was placed in Shirapur and
Aurepalle for the duration of each survey round. The ethnographer used in-depth interviews, keyinformant interviews, focus groups, and participant observation to conduct six household case
studies as well as village-level profiles during each round. The case study work was used to
develop unique, emic indicators of food insecurity (defined by locals or "insiders"). These
indicators will be compared with the etic indicators produced by the survey (defined by theresearchers or "outsiders").
Although the case study method is meant to be fluid and unstructured, general guidelines(Chung et al. 1996, Appendix 6) for the team of ethnographers were developed. The guidelines
include the following topics:
1. What are local perceptions of "health" and "food security"? What community, household,and individual resources are required to obtain health and food security? Does this vary
by sex and age?
2. Within this community, what are traditional early signs of "food insecurity"? How are
"high risk" households or individuals identified by local people?
3. What is a "good quality" diet? In times of plenty or scarcity, how does this diet change
and what are the consequences of change?
4. What has been the experience of local people regarding fluctuations in food or nutrition
insecurity? What factors are perceived to be responsible for these fluctuations? How do
rural households cope with threats to food or nutrition security? What do people do to
protect food/nutrition security?
5. What is the decisionmaking process within the household with regard to achieving
food/nutrition security or responding to problems in its attainment? Who makes specificdecisions, how are resources allocated/reallocated? What is the bargaining power of
different family members?

30
Figure 7—A group of low caste men charting the availability of work in Aurepalle

31
Figure 8—A completed seasonality chart
32
Biochemical Analyses
To provide objective "benchmarks" of micronutrient adequacy, serum measurements of
vitamin A and iron status were collected for preschoolers and their mothers in two villages. Hemoglobin samples were analyzed using the filter paper technique developed by NIN (NIN
Annual Report 1986). Vitamin A samples were analyzed using a variation on the
microfluorometric technique reported in Sivakumar (1977).
CHOICE OF HOUSEHOLDS SURVEYED
The size and composition of the sample was selected to (1) maximize the use of the OldVLS time series for future analyses of structural factors affecting current food and nutrition
security and (2) maximize intra-village variability.
With regard to the first objective, the three-village Old VLS time series contains a
household-level time path of the economic status of 120 households over 10 years. In addition to
the Old VLS time series, the Six Village Nutrition Study provides a 15-year-old nutrition
baseline for individuals in the 240 Old VLS households. The children in this data set are nowadolescents and adults and many have separated into families of their own. Combined with a
present-day follow-up of the same households, these data permit a comparison of nutritional
status and economic well-being during childhood and adulthood.
To maximize the number of cases on which longitudinal contrasts may be performed, it
was necessary to (1) resurvey as many of the OLD VLS families as possible and (2) survey the
households of individuals who have separated from the original OLD VLS household ("spin-offfamilies"). An investigation of the spin-off families required an increased survey burden in each
of the OLD VLS villages, so the number of villages investigated needed to be reduced.
To maximize intra-village variation, the sample was expanded beyond the Old VLS
sample and their spinoffs. Specifically the new VLS households were included and a few "non-
VLS" families were added to bring the sample up to 80 households in each village. In total, 320
households were surveyed from the four villages. The total sample represents 17 percent of thetotal number of household in the four villages.
Unfortunately, the longitudinal analysis, beyond our three-round 1992-93 analysis, provedto be infeasible, given the resources available to the project. The primary difficulty lies in
linking individual records across the two data sets. Past documentation is available on the
household-level data, but individual-level records are not as clean. Therefore, further cleaning of
the Old VLS data set are necessary before the two individual-level data sets can be linked. Thedata in this study have, however, been collected so as to permit a future analysis of this issue.
33
TIMING OF SURVEY ROUNDS
The semi-arid climate of the study villages results in seasonal variations in food
production, labor demand, and purchasing power (Behrman 1987). As such, we surveyed duringthree rounds corresponding to the late monsoon (round 1, "late kharif"), post-rainy (round 2,
"rabi"), and late summer/early monsoon (round 3, "late summer or early kharif") seasons.
Figure 9 shows the timing of the crop cycles in the four villages. The kharif season varies
regionally, but generally runs from June through October in the study villages. The rains may
begin as early as June, but they often do not make a significant start until later in the kharif
season. The late kharif season tends to be the busiest season in all villages (except Shirapur),since it is the main cropping season. In Shirapur, by contrast, farmers plant at the end of the
rainy season, so the post-rainy (r2, rabi) season is the busiest time. The main staple crop harvest
usually takes place in late October in Kanzara, November in Aurepalle, December-January in
Dokur, and February in Shirapur. In all villages, smaller staple crop harvests occur during otherparts of the year. In general, however, the late summer/early kharif time is a period of relative
scarcity for all villages, since the smallest staple crop harvest is obtained at this time.
Furthermore, in 1993, the monsoon began late and, as a result, little to no agricultural activity
occurred in the last round of data collection (late summer-early kharif season).
The longitudinal dimension of data collection is important for areas characterized by
heavy seasonality. If only one round of information is collected, the researcher assumes that therelationship between the true food security status and the alternative indicators is stable over
time. This may be true for some indicators, but an indicator that identifies chronically food-
insecure households in one season may not perform during the next season. It is therefore
important to follow households over time so that we may identify indicators that (1) identifyhouseholds that remain consistently food insecure and observe what indicators are independent
of changes in season and (2) use alternative indicators to predict households that move in and out
of food security, experiencing acute periods of food insecurity. Only longitudinal data provide
this opportunity.
5. QUALITATIVE RESULTS: INDICATORS OF HOUSEHOLD FOOD INSECURITY
The qualitative methods described above were applied in two villages, Shirapur and
Aurepalle. Over the course of approximately one year, researchers used the participatory andcase study methods to elicit information on local perceptions regarding food insecurity.

34
Figure 9—Timing of the three survey rounds in the four study villages
1992 1993 Village Aug. Sept. Oct. Nov. Dec. Jan. Feb. Mar. Apr. May June July
Aurepalle
Round 1 2 3 Typical food availability surplus medium low Season kharif rabi late-summer/
early kharif
Dokur
Round 1 2 3 Typical food availability low surplus low Season kharif rabi late-summer
Shirapur
Round 1 2 3 Typical food availability low surplus low Season kharif rabi late-summer/
early kharif
Kanzara
Round 1 2 3 Typical food availability medium surplus medium-low Season kharif rabi late-summer/
early kharif
Triangulation between the various qualitative methods produced the set of indicators shown in
Table 5 The evidence for each indicator is discussed below.
PRODUCTIVE ASSETS: LAND
In Shirapur and Aurepalle, villagers commonly identified landholdings as an importantdeterminant of a household's ability to provide food for its members. During the mapping
exercise, villagers cited reasons for identifying certain households as "food insecure." In both
Aurepalle and Shirapur, villagers indicated that roughly 40 percent of households were food
insecure due to landlessness or lack of good quality land. The in-depth case studies supportedthis finding. Specifically, many case studies showed that landless families are day-by-day
uncertain whether they will find work. In Aurepalle, Chinnama's family of seven is landless

35
Table 5—Household indicators identified by the qualitative analysis
• Poor quality land or landless
• Distress sales of large livestock or small livestock
• Distress sales of other productive assets
• Distress sales of other "valued" assets, e.g., jewelry
• High number of small loans, especially from informal sources (neighbors, relatives, and shopkeepers)
• Choice of drought tolerant crops when more profitable, but risky options exist
• Heavy reliance on wage work
• Women who work for wages who have young children
• Accepting permanent laborer positions
• Few income earners in large family
• Purchase of staple grains on a more-than-once-a-week basis
• Substituting inferior quality staple foods for preferred quality
• Substituting inferior quality vegetables or legumes, or going without
• Substituting gruels for the main staple (to stretch consumption)

36
and she cannot think of sitting home for a single day. She states, "if I lose wages for one day,then we must struggle for two days to eat." Similarly, in Shirapur, Krushnabai, a landless
widow, depends heavily on her partially disabled son's wages to buy groceries..."if and when he
gets them." Owning land, she claims, would make it easier for them to obtain loans. In addition,
they could at least lease the land out and collect rent. This would take the pressure off dayswhen no wages are earned.
Quality of land appeared to be more important than quantity in determining the foodsecurity status of the family. In Shirapur, the Gofne family owned five acres of dry land. Lack
of irrigation meant that farm production hinged on receiving abundant and timely rainfall. In
Shirapur, roughly three years in five are poor rainfall years, hence the risk of poor crop
production is great. This year was not unusual: Pandhari Gofne of Shirapur received only 50kilograms of sorghum from his land, just enough to feed his extended family for a month.
By contrast, access to irrigation meant that inferior land could be fairly productive. Therefore, households with a modest amount of fertile land or irrigation were often better-off
than those with larger plots that were dry and unfertile.
PRODUCTIVE ASSETS: LIVESTOCK
Although lack of land seemed to be the most commonly cited reason for food insecurity,
observation and interview revealed that livestock ownership or sale might also be a goodindicator. In both villages, the ethnographers observed that poor households rarely owned large
livestock. In Shirapur and Aurepalle, large draft animals, specifically bullocks, are necessary to
plow the land. Bullocks are so essential that many farmers do not cultivate their land if they do
not have access to them or do not have any cash to rent them. The most resource-poorhouseholds lack relations with those who own bullocks. A. Sayalu of Aurepalle, for example,
owns 2.5 acres of low quality land (banjar dubba). Since he does not have access to a bullock,
he must either borrow money from the village moneylender (savakr) to rent them or let his land
sit idle. This year, Sayalu decided to let his brother graze animals on the land rather than farm it. Larger farmers, by contrast, owned a number of large livestock such as cows, bullocks, and
buffaloes. These households typically owned irrigated land, which reliably provided crop wastes
to feed the animals.
Despite the advantages of owning large livestock, these animals could also become an
unnecessary burden to families living on the edge. Usually, if a poor family owned any large
animals, it was just one or two. During bad agricultural years (such as the year of our study),fodder and water prices were high and these households could not afford to feed the animals. In
Shirapur, for example, the Gofne family was forced to liquidate what seemed to be a profitable
asset. Deepak Gofne explained that their bad harvest meant that they must spend exorbitantly to
buy fodder for the bullocks.
37
Attached laborers are persons who agree to work full-time for one employer for a specified10
period of time, usually a year or an agricultural season. The laborer typically receives meals, an in-kind payment of sorghum or rice, and a single lump sum payment. During the 1992-93 agriculturalyear, the going rate for an attached laborer was 2,000-3,000 rupees per year (roughly US$700-1,000).In Aurepalle, this arrangement is called jeetam. In Shirapur, it is called chakari.
The experience of the families who owned buffaloes and Jersey cows was similar. Eventhough Sumit Navendra of Shirapur owned one-and-a-half acres of irrigated land, he could not
get enough fodder to feed his three Jersey cows. With the cost of fodder rising, Sumit Navendra
sold two of his cows and began to half the amount of fodder fed to his remaining cow. Milk
production, he predicted, would fall and it would probably be unprofitable to maintain the lastone. Nevertheless, he felt sentimental about this cow and kept it because it was "lucky."
Feeding a Jersey cow, he claimed, was like "raising an elephant" (hattilla poslyagat).
Because large livestock often generate income, households are reluctant to liquidate them.
However, when they do, it is because they have no other choice. Shaik Abdul Ahemad, an
attached laborer from Aurepalle, was planning to sell a milking buffalo for Rs 2,000, even10
though it provided roughly Rs 250 per month. He and his wife had no stocks of rice and hadalready cut down on purchases of vegetables, oil, and chilies. Debtors were demanding their
money and Abdul Ahemad saw no other way but to sell the buffalo. Selling the buffalo would
pay half the loan and allow him to buy rice for the family.
OTHER PRODUCTIVE ASSETS
During our ethnographic work, we also observed that ownership of various otherproductive assets could either contribute to the food security of the household or destabilize it.
In general, it depended on whether the asset allowed the household to rise out of debt or whether
it created more debt. In Shirapur, for example, a middle-aged widow named Annapurna began a
small business making chuhlas, or mud stoves. Her business did not require any capital and,before long, she had saved some money to put toward a chile grinding device. The remainder she
took as a loan. Before long, Annapurna's chile grinding business was providing regular income.
Within no time, she had paid off her old debts and was making regular payments against her
loan. Buying the chile grinder, she said, was the best decision she ever made.
Not all investments worked out, however. Krishnayya, a well digger from Aurepalle, used
Rs 10,000 in savings to purchase a crane with a partner. The crane could be used to remove mudfrom hand-dug wells. Although he would earn about Rs 1,200 for each well contract, Krishnayya
miscalculated the demand for the crane as well as the costs of paying a team of laborers to work
the crane. As a result, his crane sat idle and his other debts, totaling Rs 1,700, were unpaid. He
took another loan to buy some dry land, but the poor rains meant no harvest this year. Later inthe year, we learned that he was forced to migrate to the city to repay his debts.

38
LIQUIDATABLE ASSETS: SMALL LIVESTOCK, JEWELRY, AND ROOF TILES
Villagers of Aurepalle and Shirapur also invested in items that could be liquidated rapidly
and without hassle. The most common asset of this category was small animals, such as goatsand sheep. Goats, in particular, did not require special fodder and could survive on "anything
green." Acquiring a goat was also not very difficult. Government schemes for those below the
poverty line (BPL) were available for buying goats. If one did not qualify for a BPL loan, the
local custom of share-rearing allowed a household to acquire an animal by taking care of anotherhousehold's animal for a period of a year. After the animal has two offspring, the rearer and the
owner each take one and the mother is returned to the owner.
Aside from ease of acquisition, villagers reported that goats and sheep were assets that
could be sold with relative ease whenever money was needed to repay a debt. In Shirapur,
Janabai Mane, an elderly man with three school-aged children, regularly sold sheep whenever he
needed cash. Similarly, Krushnabai owned 12 goats and considered them to be her "gold." During times that she urgently needed money, she could sell a goat for Rs 200-600, the
equivalent of 20-60 days of wage labor for a woman.
Although small livestock were by far the most common form of liquidatable assets, we
observed a few households using other goods as short-term deposits for their wealth. In both
villages, we observed that households often liquidate a woman's jewelry when a crisis occurs.
For example, Vimal Potdar, a landless woman in Shirapur, had to cope with the costs of a suddenillness. She took a loan using her tin roof as collateral. When she could not repay the loan, she
was forced to sell her mangal sutra, or marriage necklace, to save the roof. Selling jewelry was
also useful to raise cash to make investments, but it often signaled the beginning of more debts.
For example, N. Jangayya and his brother both sold their wives jewelry to raise a down paymenton a piece of land. They borrowed the rest, roughly Rs 25,000, from a moneylender at a rate of
36 percent interest.
LOANS
Our ethnographers noted that most food-insecure families were preoccupied with
obtaining and paying back loans. Both agreed that a good indicator of household food insecuritywas the number of small debts owed. Among the food insecure, it was not uncommon to have a
variety of debts. In Aurepalle, five out of the seven case study families were heavily in debt.
Pedda Balanna said that he had so many loans, he could not remember the number of people he
owed. His wife, Mallamma, said that she did not know how to repay these loans. Almostcertainly, they will use a system of adal-badal (literally "exchange") to repay. By this,
Mallamma meant that she will take a loan from one person to pay another and then take a new
loan to pay off the second one. The situation of multiple debts was commonplace. Krishnayya
Gouda, for example, owed Rs 3,000 to a moneylender, Rs 1,000 to a cousin, Rs 3,000 to his

39
wife's aunt, Rs 300 to a caste fellow, and a number of small bakis (or debts) to clothes merchantsand neighbors. The total debt was greater than one year's salary.
In Aurepalle, households held larger sums of debt than in Shirapur. But in both villages,the strategy of juggling small debts from neighbors, shopkeepers, and friends was a remarkably
robust finding among the food insecure. Steeped in debt, food-insecure families took small loans
(Rs 5 -10) to purchase enough food for one meal. In addition, they borrowed grain, with or
without interest, from neighbors, large landowners, and shopkeepers. It was not uncommon forhouseholds to have debt at several stores in the village. In Shirapur, for example, Krushnabai
explained, "We don't have lumpsum amounts to buy groceries or pay back the credit at once."
Instead, she buys on credit from two or three grocers at once, each of whom only allow her a
small amount of credit. In this way, Sushilbai juggles her daily food expenses, even though sheremains in an endless cycle of debt. Similarly, Sabera holds credit at three different grocery
shops. When a shopkeeper refuses to give her credit, she tries to get credit at another until she
can pay back the first one.
Poor households also took loans from local moneylenders at high interest rates. Often, the
interest amounted to as much as the principle. Pedda Belanna, for example, took a Rs 312 loan
four years ago. After four years, the interest and the principle amounted to Rs 650. Villagersalso took large loans from banks or cooperatives, but more often avoided these sources, as the
paperwork was too troublesome and confusing. In Aurepalle, bank officers were not as strict
about collecting on loans and many villagers were lax about repaying. Here, the ethnographer
observed that debt was a "web from which it is difficult to extricate oneself." Many of thevillagers felt the same way. One attached laborer, from a Harijian case study family, was
"drenched" in debt and finally had to migrate from the village, since he had no possible way to
repay it all.
CHOICE OF CROPS CULTIVATED
The choice of crops cultivated often signaled the amount of risk a family was willing toaccept. The most food-insecure households, whether they held irrigated or nonirrigated land,
were more risk adverse and they often chose crops accordingly. For example, among the families
that owned dryland, most could not grow a great variety of crops. In addition, most adopted a
strategy of growing crops that did not require much water or other inputs. In Aurepalle, caster (acash crop) and sorghum (a food crop) were common choices among the poorer farmers. Raju
Maisayya, a small farmer from Aurepalle, gambled this year on good rain and planted cotton.
Rainfall this year was erratic, however, and the cotton did not grow well. His family had urged
him to grow either caster or sorghum, since both grow well in dry, low-input conditions. Investing in cotton, his wife said, was "like throwing money on plants" (chetla pal). Similarly, in
Shirapur, Dyaneshwar Patil adopted the risk minimizing strategy of farming with a partner and

40
choosing crops that require little water. This year, they are only growing sorghum andDyaneshwar expects that as much as 50 percent of the crop could fail due to lack of water. Many
other dryland farmers in Shirapur followed a similar strategy.
By contrast, among the households who owned land, those who were able to grow risky
cash crops were comparatively food secure. Digamber Gharbude, for example, worked as an
attached laborer for three to four years and saved enough to dig a well. Ten years ago, they
irrigated their land and their income has changed dramatically. They never have to buy grain andthey never substitute inferior quality hybrid sorghum for the preferred local varieties. Aside
from sorghum, they are able to take on riskier cash crops such as chilies, onions, corn, groundnut,
chickpea, red gram, and sugarcane.
The main difference in crop choice between the food secure and food-insecure households
seemed to be that the food-secure households could guarantee water for the more profitable
crops, such as cotton or chilies. For those that were not food secure, the only strategy was to actrisk adverse, that is, to plant a crop that would grow under favorable or harsh conditions. In both
villages, the emphasis in choice of crop appeared to be on reducing the likelihood of failure, not
on whether it was a cash crop or a food crop. Resource poor farmers often chose cash crops,
such as sunflower, castor, or safflower, which did not require good soil, purchased inputs, orabundant irrigation.
WAGE WORKERS
In both villages, wage workers with no other source of income were often food insecure.
Women wage laborers of Aurepalle commented that their food security for a particular day
depended on whether they got work on that day. Hanumamma, an elderly wage worker whosupports her disabled husband, depends almost entirely on wage work, but cannot always get it
(see Profile 1). Due to the seasonality of the agricultural cycle, the food security status of
agricultural wage workers also followed a seasonal pattern. Most wage workers that were
interviewed (irrespective of caste) agreed that the period right after the main harvest was a timeof relative food security. During this time work was abundant and they were paid in-kind wages.
Conversely, the months preceding the harvest are relatively lean.
For wage working families, the lack of regular work during the lean seasons was often
exacerbated by increased morbidity among children. The effect of children's illness on
household food security of wage households was clearly stated by the women interviewed:
during these periods, women often had to forego wage work in order to look after their sickchildren.
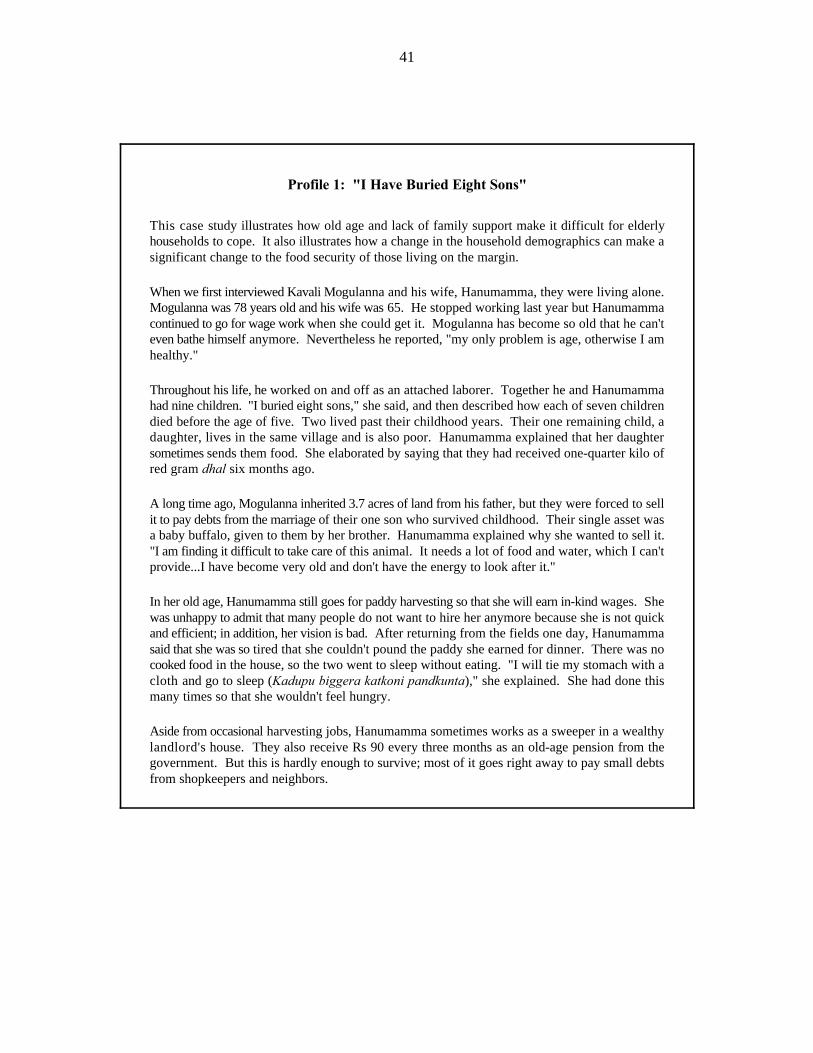
41
Profile 1: "I Have Buried Eight Sons"
This case study illustrates how old age and lack of family support make it difficult for elderlyhouseholds to cope. It also illustrates how a change in the household demographics can make asignificant change to the food security of those living on the margin.
When we first interviewed Kavali Mogulanna and his wife, Hanumamma, they were living alone.Mogulanna was 78 years old and his wife was 65. He stopped working last year but Hanumammacontinued to go for wage work when she could get it. Mogulanna has become so old that he can'teven bathe himself anymore. Nevertheless he reported, "my only problem is age, otherwise I amhealthy."
Throughout his life, he worked on and off as an attached laborer. Together he and Hanumammahad nine children. "I buried eight sons," she said, and then described how each of seven childrendied before the age of five. Two lived past their childhood years. Their one remaining child, adaughter, lives in the same village and is also poor. Hanumamma explained that her daughtersometimes sends them food. She elaborated by saying that they had received one-quarter kilo ofred gram dhal six months ago.
A long time ago, Mogulanna inherited 3.7 acres of land from his father, but they were forced to sellit to pay debts from the marriage of their one son who survived childhood. Their single asset wasa baby buffalo, given to them by her brother. Hanumamma explained why she wanted to sell it."I am finding it difficult to take care of this animal. It needs a lot of food and water, which I can'tprovide...I have become very old and don't have the energy to look after it."
In her old age, Hanumamma still goes for paddy harvesting so that she will earn in-kind wages. Shewas unhappy to admit that many people do not want to hire her anymore because she is not quickand efficient; in addition, her vision is bad. After returning from the fields one day, Hanumammasaid that she was so tired that she couldn't pound the paddy she earned for dinner. There was nocooked food in the house, so the two went to sleep without eating. "I will tie my stomach with acloth and go to sleep (Kadupu biggera katkoni pandkunta)," she explained. She had done thismany times so that she wouldn't feel hungry.
Aside from occasional harvesting jobs, Hanumamma sometimes works as a sweeper in a wealthylandlord's house. They also receive Rs 90 every three months as an old-age pension from thegovernment. But this is hardly enough to survive; most of it goes right away to pay small debtsfrom shopkeepers and neighbors.
42
"PERMANENT" OR "ATTACHED" LABORERS
Villagers of Aurepalle and Shirapur agreed that families with an attached laborer (jeetam)
were usually food insecure. In Shirapur, villagers reasoned that "no one became a permanentservant unless they were desperate" (nad aslekich Chakari dharato). At times of crisis, families
became attached laborers to obtain lump-sum amounts to pay off loans, while still ensuring a
minimum supply of food. Shaik Abdul Ahemad, for example, needed a large sum of money
when his wife became ill. He borrowed it from a large landowner and began working as apermanent servant. Balrappa, of the Gofne family of Shirapur, also worked as a permanent
servant to pay off the wedding expenses of his younger brother, Deepak. Neither Balrappa nor
Shaik Abdul Ahemad were happy with the terms, but agreed that it was the only way to get a
large sum of money advanced when they needed it. While Balrappa was able to extract himselfat the end of his contract, Shaik Abdul Ahemad appeared to be in a never ending cycle of debt.
As such throughout his life, he frequently rendered his services as an attached laborer.
Most permanent servants affirmed that the salary they received was not enough to support
an entire family for a year. In such cases, the rest of the family, particularly the women, were
under considerable stress to make up the shortfall. Case studies indicated that the relationship
between the laborer and the landlord was fairly exploitative. For example, Yadayya of Aurepalletook a Rs 5,000 loan to pay for his daughter's marriage. To repay this loan, Yadayya had to work
for his landlord for two years. With the death of his father, however, and the associated costs of
a funeral, Yadayya estimated that he would be forced to work another year on an attached
contract. Other than the lump sum advance, he received no wages and his wife was completelyresponsible for supporting their family of five. His wife, Satamma, earned six to seven rupees a
day (roughly 18 to 24 cents per day) and saw no end to their problems. "It's better to die rather
than live this life," she told an investigator ("Sacci poinde neyamu e batku kanna").
We conducted interviews in six households with members that worked as attached
laborers. Only one family stated that they thought that permanent labor (jeetam) was a good
option. Raju Maisayya of Aurepalle, for example, has worked as a permanent servant sincechildhood for a village "rich man" (dora). Maisayya and his wife claim that jeetam is good
because there is assurance of a lump-sum salary and they do not have to search for work daily.
In addition, their landlord is a good man; he provides money, fodder, and grain whenever they
need it and pays medical bills. They agreed, however, that the work is hard and that their wagesare lower than those of a daily agricultural worker. Nevertheless, his landlord has provided him
with loans to buy land and he can farm a small plot. In addition, with his wife's wages, they are
able to send their only child to school. Maisayya's experience with jeetam, however, appears to
be exceptional.

43
WOMEN WITH YOUNG CHILDREN WHO WORK FOR WAGES
Interviews with our case study families, key informants, and observation in the village
indicated that women with small infants who still went for wage work often came from food-insecure households. When asked, villagers agreed with this assertion; local customs dictate that
a mother should stay with their children, particularly if they are breast-fed. On the whole,
women from food secure, particularly, upper caste families, did not work outside their home or
their own farms. Conversely, mothers in food-insecure families had no choice but to go for wagework. In Aurepalle, for example, Balamma took her four-month-old daughter, Manjula, to the
field when she works. Her family cannot manage alone on her husband's earnings; he says,
"kashtam chesi batkutunnaru"—"we are surviving only by working hard." In Shirapur, Manisha
also took her infant when she went for sorghum harvesting. During the harvest period, she wasemployed less than one month, but earned 50 kilograms of sorghum, enough to feed her family
for two months.
Many women lamented over having to leave their children unattended while they sought
wage work. Jaya Sujatha, for example, passed tenth grade and has a good job in a spinning
factory. However, her husband does not contribute regularly to the family income. To feed her
family, she will take any job, even agricultural work. Her children "wander the village in (her)absence." "They are too young to take care of themselves," she said, "but what to do?"
MIGRATION IN SEARCH OF WORK
In Aurepalle, migration appeared to be a strong indicator of food insecurity. Wage work
within the village was often not available during the lean seasons. Families with no productive
activities within the villages sent migrants to cities or to labor-deficit agricultural areas. InAurepalle, Sayalu migrates in a circular fashion to Hyderabad, 70 kilometers from Aurepalle.
There he works as a rickshaw puller for 15 days a month; the remaining 15 days he returns to
Aurepalle to be with his family. "I don't have to struggle for jobs. I run a rickshaw in the city
and save money for my family," he says. Each month he sends about Rs 250-300 (about US$8-10) to his wife and then seeks work during the 15 days that he is home in the village. If he gets
work, then he might earn Rs 100 rupees (US$3) in 15 days. Women also migrated temporarily
during the lean season. During the summer (r3) season, four women from the Aurepalle case
studies migrated to labor-deficit areas for rice planting or harvesting. All were from food-insecure families that had no other means of making money for food.
Migration, however, appears to be a very village-specific response. In Shirapur, fewerpeople migrated to the city, even though it was much closer to Sholapur than Aurepalle was to
Hyderabad. Investigators claim that Shirapur villagers are not "accustomed" to migrating. In
addition, there were several Employment Guarantee Schemes nearby, although none provided
regular work and did not employ all that wanted work. Finally, contractors do not come to
44
Shirapur seeking workers and no groups have formed on their own to migrate as they do in othervillages.
HIGH HOUSEHOLD DEPENDENCY RATIOS
Throughout the qualitative work, villagers identified various demographic variables as
strong determinants of household food security. More so than the absolute size of the household,
the villagers listed characteristics that were related to the number of persons capable of earningmoney or the number that must be supported by those who work. Many of these variables (e.g.,
"one person earning," "disabled head of household," "many small children") are related to the
etic concept of the dependency ratio. For example, the villagers thought that households that
were dependent on a single wage earner were at high risk of food insecurity. During the mappingexercises in which they identified the most food-insecure families in their neighborhoods,
villagers cited "only one earner" as a common reason for which these households struggled. In
Shirapur, for example, 37 percent of the total households identified had only one earner; in
Aurepalle, 36 percent of the households identified had one earner.
The villagers also identified households comprised of many elderly or solely elderly
members as food insecure. In Aurepalle, 40 percent of households identified during the mappingexercise had an elderly member who could not work for money or could only do light
housework. The situation was similar in Shirapur, where 43 percent of the identified households
were identified because they had old members. Villagers also noted that many of these elderly
households did not have any social support; either their sons did not support them or they did nothave any sons. Consequently, they struggled. In Shirapur, one elderly woman, Malanbai, was
identified by all mapping groups as being food insecure. Malanbai described herself as so poor
that nobody would invite her to a wedding (see Profile 2). She reasoned that it would be odd to
have "a rough woollen piece patching up a fancy sari" ("shalila ghongadiche thigal kashala"). Inher old age, Malanbai had no children who would care for her and she depended completely on
daily wage work to support herself. On days that she had no work and no stored food, she says
that she "drinks lots of water and sleeps 'hungry'."
During the mapping exercise, villagers also identified households with several small
children as food insecure. This indicator was not as strongly associated with food insecurity as
the presence of the elderly. Our case study families provide several reasons for which thesehousehold were vulnerable. First, child-bearing and caring responsibilities often kept women

45
Profile 2: "My body has the habit of work, so it is still working."
This story illustrates that sometimes the only resource an elderly widow has is her two hands.
Malanbai, an old widow, attributed her "downfall" to old age, joblessness, loss of a working sonand the lack of social support. She was married to an "attached laborer" before she reachedmenarche. She never saw her husband in the daylight until her first daughter was born.
During the big drought of 1972, her family ate wild weeds to cope. Nevertheless, she lost herhusband and four children. Only one son remained. Soon after their deaths, her brother-in-lawdrove her family out of their house. Malanbai lived with her son and worked to survive; sheearned 75 paisa a day (roughly 2 cents). Her son was good to her, but he died young after hestepped on a nail and contracted tetanus. Her daughter-in-law left with her grandchild, who diedsoon after. Shortly after, her brother-in-law insisted that she repay 1,500 rupees, which he saidher husband had borrowed from him. The village panchayat, whom she likened to "God,"supported this demand.
It took her four years to pay off the loan, but today she is still extremely poor. She never borrowsmoney and does not run credit at any shops. When she doesn't have money, she eats roti withchile or "kanya" without sugar or salt. When she has money, she buys a small quantity of cheapvegetables (like eggplant) or low quality dhal. "I don't even look at potatoes and tomatoes," shecommented. Her method of coping with poverty was matter-of-fact. "I don't dare ask anybodyfor money. If I cannot get anything to eat, I drink lots of water and go to bed hungry."
In her elderly state, Malanbai is still considered one of the best wage workers in the village. Sheworks hard and is honest. Employers often seek her when they need workers. "It makes mehappy that they remember me for work," she says. Nevertheless, Malanbai is ostracized by herfamily and relatives; when she enters their house, they cover their cooked food. They do notinvite her to weddings or festivals. "I have cleaned everyone's dirt for so long that now theythink that I too am dirty," she said. She stopped visiting her daughter because her son-in-law wassuspicious that his wife was feeding her mother.
Malanbai knows that her ability to work is her only asset in life. Fearing that she would behelpless if she became sick, she considered selling the half acre of dryland that she still owned.As soon as her son-in-law and brother-in-law heard, they wanted their share. For the time being,Malanbai had given up the idea of selling her land.

46
away from wage work. Chinnama, a 24-year-old mother of five, reported that she lost seven daysof wages when her daughter was ill. To tide the family over, she borrowed Rs 20 (equivalent to
US$.60—two days wages) from her neighbor to buy food. In Shirapur, a 26-year-old mother
named Malabai worked until the eighth month of her first pregnancy. She stayed home for three
months after her delivery, but then resumed wage work, since her wages were essential for thefamily.
Aside from the cost of lost wages, children's sicknesses require money for doctor's visits,transport, and medicines, as well as lost wages for the caretaker. Yelliah Gouda, a toddy tapper,
complained about spending roughly 100 rupees per month for his children's medicines
(equivalent to roughly 10 of his wife's wage days). Similarly Chinnama claimed that in addition
to losing her 7 days of wages she had to pay transport costs and doctor's fees when she took herdaughter to see a physician in Amangal. Chinnama explained that if she or her husband become
ill they can sleep off the fever. However, if the children become ill she must take them to the
doctor despite the cost.
BUYING STAPLES ON A DAILY BASIS
Direct observation and interviews indicated that purchasing staples on a daily basis was astrong indicator of food insecurity. Poor people could not afford to buy enough for long periods
of time. They bought cereals at least twice a week, usually after the "wage day." Researchers
recorded a number of instances in our case-study families where mothers purchased only enough
food for a few meals at a time. In Aurepalle, Chinnama and Balamma regularly bought onlywhat they needed as they were dependent on daily wages. Sometimes purchasing grains on a
daily basis was part of an intricate food security strategy. In Shirapur, Savita was the second
wife of a farmer with some irrigated land. Her husband did not support her. To cope, she said
that she would buy sorghum on a daily basis whenever she would get wage work. She wouldsave her bag of storable local sorghum for the leanest season. When questioned, villagers agreed
that buying staples on a daily basis was an indicator of food insecurity. The Gofne family
commented, "One who can't earn enough to store at least for two or three days will buy every
day. They are surely food insecure."
ILLNESS
Households in which working age adults had physical disabilities or chronic illnesses
were also identified as being food insecure during the mapping exercises. We also found
examples in our case-study families. Laxman Gore of Shirapur became ill at the age of two. As
a result of this sickness, his upper right arm became wasted and now he has a problem gettingwage work. Similarly, Yelliah Gouda fell from a toddy tree almost 20 years ago. He can still
climb toddy trees, but is unable to do heavy work such as well-digging, road making, plowing, or

47
harrowing. Aside from long-term disabilities, accidents with temporary consequences can bringon large medical expenses, which begin a downward spiral (see Profile 3).
Vinod Manohar of Shirapur used to work on a sand carting truck. However, recently, amotorcycle hit him while he was on his bicycle. One month after the accident, Vinod Manohar
was still unable to work and was forced to borrow Rs 2,500 to pay medical expenses. His wife,
Archana, said, "Now we have to borrow money for the first time in our life. We are finished."
STAPLE SUBSTITUTIONS
In Shirapur, the normal meal included sorghum roti (unleavened bread) with a liquidlegume preparation (dhal) or a cooked vegetable curry dish. In Aurepalle, the typical meal was
the same except rice was substituted for roti. In Aurepalle, families substituted broken rice
(available for Rs 3 per kilogram instead of Rs 5.25) or ration rice for their preferred rice. One
elderly woman was seen collecting rice that was spilled in the field after the paddy harvest. Shealso collected a black colored rice (taal buva), which had been discarded with the chaff while
winnowing. Her employer, a large landowner, let her take it when she sifted and pounded the
paddy. In Shirapur, poorer families substituted subsidized sorghum available at the ration shop.
When households do not have enough of even an inferior grain (broken rice or ration rice
in Aurepalle or ration sorghum in Shirapur), they often resort to making a solid gruel out of
sorghum or millet. In Aurepalle, villagers often make sanketti, a solid gruel made from boiledmillet or sorghum. Traditionally, this is eaten after the October grain harvest (when people are
paid in-kind), but during other times of the year, consumption of sanketti is considered to be a
sign of stress. When asked, the villagers agreed that this pattern of consumption was consistent
with food insecurity. In Aurepalle, a group of women from the madigas caste reasoned thatsanketti did not require any accompaniment of expensive vegetables. Furthermore, only a small
quantity of grain could be stretched into a full meal by cooking sanketti.
Similarly, in Shirapur, families that did not have enough sorghum to make rotis ground the
available sorghum, boiled it, and made a thick gruel called kanya. All case families interviewed
in Shirapur explained that they thought this was a certain indicator of food insecurity. Kanya,
they said, was an "emergency" food, and was usually eaten for a day or two until the familygathered enough resources to buy enough grain to make rotis.
In Aurepalle, villagers spoke of another staple substitute, a thin gruel called ambali, whichis made of pounded rice. Traditionally, ambali is drunk during the summer to quench

48
Profile 3:"We Have to Borrow Money for the First Time in Our Lives. We Are Finished."
This family's story illustrates how unexpected accidents can set a relatively food-secure family intodebt and food insecurity.
Archana and Vinod Manohar live in an abandoned, dilapidated house. Vinod Manohar typicallyworks on a sand carting truck and farms some of his own land. Two weeks ago, Vinod Manoharmet with an accident when he was riding his bicycle and hurt his hand and head. He was treatedfor superficial cuts. Later, he returned to the doctor because his teeth were loose and he felt lotsof pain in his jaw. He felt a constant vibration in his head (dokyala thartharte). The doctor wiredhis teeth and jaw and told him to only have milk and an occasional biscuit. He stopped workingand his wife began to go for weeding work.
Until this time, the family was doing quite well. Vinod Manohar was an only son and had inheritedtwo acres of dryland. He was a careful farmer and improved the land by manuring. They got goodyields and were able to save their money, since they had no children for six to seven years. Theybought a cow and fed it well; it was giving two liters of milk a day. Both he and Archana workedand earned about Rs 390 per week (approximately US$13). "We were earning well and ourexpenses were minimal," he said.
During this time, Vinod Manohar and Archana had no debts. They were doing so well they couldafford to spend nearly Rs 10,000 on pilgrimages and rituals so that they could have a child. WhenArchana became pregnant, they sold the animals so that she could rest. Archana was able to stayhome with her son and Vinod Manohar was planning to buy some livestock for her to tend to whileat home.
Their plans were dashed with this accident. For the initial check-up, they borrowed RS 500 andthe doctor estimates they will need Rs 2,000 more. They had no savings; recently they had spentRs 4,000 on two acres of land. "Now we have to borrow the money for first time in our life. Weare finished" ("aamachi pachava dharan basali").
Archana said that they still have one bag of sorghum. They ate one bag of hybrid jowar becauseit was cheap and was prone to pest infestation (kid lawkar lagate). Their bag of local jowar couldbe stored for two years and would be useful during the rainy season. They were also planning tobuy wheat and rice so that the remaining stock of jowar will last them until next harvest.

49
thirst. One group of upper caste women said that if ambali is eaten in the off-season, it is usuallya sign that the household is struggling for food. A group of madiga caste (scheduled caste)
members said that mostly the poor harjian households eat ambali. "Ambali quenches their thirst
and kills their hunger" ("doopa arthadi, aakali chasthadi"). An old man from the group
explained that if they drank ambali during the day, they will not feel like eating until the evening. Another concluded, "a woman who has suffered and who is hungry will be able to describe these
foods. A woman with a full stomach won't be able to say anything" ("debballu thinna amma,aakali konna amma chopthadi, kadpu nindina amma aemi chopthadi").
VEGETABLE AND LEGUME SUBSTITUTIONS
In addition to substitutions for staple foods, observation and interview revealed that food-insecure families often substituted cheaper, more accessible, foods for the traditional dhal or
curry preparations. Families in Shirapur bought broken legumes, such as broken toor dhal(dalga) or matki (33 percent), since it was half the price of proper split dhal. In addition to
stretching their legume preparations, they often made a, thin, watery dhal dish. Sometimes, theysubstituted eggplant (a relatively cheap vegetable) or spinach for the more expensive dhal (35
percent).
During the summer (r3) lean season, some families were not able to purchase dhal or
vegetables due to lack of wages. Ethnographers in both villages reported that many families
collected wild green vegetables as a substitute. The wild vegetables were abundantly available
during this season and, when cooked, did not require spices or oil. In Shirapur, investigatorsfound that food-secure families ate certain wild vegetables just to add variety in the diet.
However, for many households, consumption of wild vegetables was part of an important
strategy to stretch their food budgets during the lean season. Malanbai, the elderly widow from
Shirapur, said that she cooked these wild greens so that she could save money for when hermonthly allocation from the ration shop became available. If she did not have enough money on
the day the food came, she would have to forego her allocation. In the harijian busti(neighborhood), one woman showed the investigator a large pot of boiled wild greens that was
seasoned only with salt. She said that this was all her family would have for lunch. One mansitting nearby commented, "What else can we do? We can't even buy oil, salt, or chile powder.
(Otherwise) we would just sit (here) and not eat (tarmadya det basayache)."
In Aurepalle, observation and interview with case study families also indicated that wild
vegetables were an important food resource during the rainy season. Chinnama of Aurepalle
collects these vegetables two to three times a week, since she does not need to spend money on
them. Eating too much, though, causes vomiting, headaches, and dizziness, commented Balaiah,a harijian woman from Aurepalle. She figures that people in the harijian busti eat these wild
50
Literally meaning, "dowry is like sweeping and cleaning someone else's mouth."11
greens at least three times a week. "We can't help it," she continued, "just like goats eat grass,we eat this like grass."
When families were destitute, they ate no dhal or curry. In Aurepalle, our ethnographernoted several times that her case study families ate rice with red chilies (miraga thoku) when no
vegetables or legumes were available. In Shirapur, the traditional way of eating roti included a
traditional blend of many spices (called black masala). Consumption of roti with plain red chili
was therefore an indication of food insecurity, since black masala contained many ingredientssuch as garlic and expensive oil. During the food chart exercise, the households that reported
that they do not run short of food also said that they liberally used good quality spices. By
contrast, the poor used small quantities of fewer spices, just enough to flavor the black masala.
One case study family said that only the poor eat roti with only crushed chilies. Similarly,
Laxmamma, a harijian woman from Aurepalle, commented that the landlords "never eat chile
powder with ration rice. Why would they? They have enough for generations to eat together."
DOWRIES
Throughout India, the tradition of providing dowries for daughters is a huge burden for
poor families. Our study villages were no exception. In Shirapur, Pushpa Prakhesh and her
daughter-in-laws were so well-off that they never had to go out for wage work. Nevertheless, she
states that they had to sell a lot of land and animals to marry off their three daughters. Whenasked about her household expenses, she implied that daily expenses were not a problem.
However, she remarked, "the major expense is sitting next to you," referring to her fourth
daughter.
Many families did not have any resources to sell to raise the dowry money. Instead, they
took loans. Janabai Mane of Shirapur had four daughters and one son. For his first daughter's
marriage, he borrowed Rs 7,000; for his second, Rs 10,000. Dowries were often multiples ofwhat a family could earn in a single year, hence some people became attached laborers to raise
the necessary sum. Many times, dowry money "recycled" itself through some families. The
money received from a new daughter-in-law might be used to marry off one of the groom's
sisters. It was therefore up to luck whether a family had more girls than boys. Sushelabai hadfive sons and claimed that it was a "must" to accept the money, even though all the daughter-in-
laws had been her husband's nieces. Radhabai of Shirapur has three grand daughters and was
clearly on the losing side of the dowry lottery. Realizing this, she lamented "lokachya tondachezadane potare," meaning that dowry not only feeds other people, but also provides for all their11
future needs.

51
While recounting this story, the investigator commented that the definition of the marathi12
word for gift, aher, differs from the Western definition. In English, "gift" implies that somethingis given willfully; by contrast, in marathi "aher" is used for gifts that are compulsory and that givesocial respect to the givers and receivers.
GIFTS AND OBLIGATIONS TO RELATIVES
The ethnographers noted that many of the food-insecure households had taken large loans
to fulfill traditional obligations to family. Many respondents claimed that they had no choice andthat it was their duty. The Gofne family, for example, frequently did not have enough food to
eat. Nevertheless, they felt obliged to have a large celebration for their daughter-in-law's parents
when she matured. Deepak Gofne estimated that out of 100 paise (percent), he had saved only
25 paise for the celebration and would borrow the other 75.12
In Aurepalle, families that were food insecure also expressed a need to fulfill social
obligations. Sabera Abdul Ahemad's family, which has no rice stocks in the house, iscontemplating selling their only buffalo to meet debts and buy rice. Her husband worked as an
attached laborer to pay off the debt. Nevertheless, they are planning to butcher one of their four
chickens when their relatives visit. "We have to provide a nice meal for guests. . . .it is our
custom," she said.
Some families got themselves into a cycle of irretrievable debt by fulfilling these
obligations (see Profile 4). Nandishilor of Shirapur spent lavishly when his wife's relatives cameto visit, buying sweets and clothes for them on credit. To get himself out of debt, he became an
attached laborer. His children are losing weight and he admits that it might have been foolish.
"The guests might have forgotten the gifts (aher) that were given them, but we are still suffering
in living hell (narakwas bhogato)." For the rich, this was not a problem, but to families living onthe margin, it often provoked a cycle of debt from which they could never escape.
RELIGIOUS OBLIGATIONS AND HOLIDAYS
Even the poorest case study households expressed a need to celebrate holidays with new
purchases and to fulfill religious holidays. In Aurepalle, Chinnama's family often borrows food
or grain from neighbors or shopkeepers. Yet last year, her husband, Sayalu, took a loan from thecooperative bank that was supposed to be used to fund income-generating activities.

52
Profile 4:"Even a Sinking Person Would Try to Hang on to a Small Stick"
This story illustrates how landlessness, debt, unexpected sickness, and social obligations worktogether to create a situation of food insecurity.
Nandishilor's family has always been poor, so poor that when it became time for him to seek a bride,no one was willing to "make an alliance" with him. Once, while in Pune, he met Vimal and herbrother. They also were very poor. Because they were both poor and unmarriageable, they decidedto marry each other. Now they live in Shirapur in a two-room house obtained from the Indira GandhiYojna. Nandishilor worked on a sand carting truck and Vimal did not work. Some time ago,Nandishilor became sick and needed an intravenous drip. They owned no land, so Vimal borrowedRs 500 by offering the tin sheets from her roof as collateral. The moneylender demanded that shegive him the sheets; rather than live without a roof, she sold her mangal sutra (marriage necklace).
The debt situation worsened, however. Some time ago, some distant relatives came to visit andNandishilor felt obliged to offer them gifts and good foods. The sweets and clothes were purchasedon credit and, four years later, the debt has not been repaid.
With interest, the debt became bigger and bigger and lenders started troubling them. Nandishilor wasfinally forced to accept work as an attached laborer to pay his debts. He received a lump sum of Rs500 and was given 28 kilos of sorghum per month. The large debt was paid off. But Nandishilor andVimal were forced to take small loans, since their in-kind earnings were not enough to make endsmeet. To supplement their income, Vimal raised a couple hens to buy mith-mirchi (daily groceries).The children demand food that they were once accustomed to eating, but Vimal cannot provide itnow. They both see that their children have lost weight.
Vimal said they have passed many nights when they both have cried together. Nandishilor feels guiltybecause he cannot feed his family enough and his wife has to start working. Their children look afterthemselves and stay outside the house the entire day. "What to do?," she remarked; her wages aretheir sustenance. Vimal lamented to our investigator that she had no choice but to work. "Budtyalatinkyacha aadhar" she said..."even a sinking person would try to hang on to a small stick."

53
Instead, Sayalu used the money to buy his family new clothes and to celebrate the dussehrafestival. In Shirapur, Krushnabai, the woman whose postpartum daughter-in-law felt that she
could not demand food since she was not working, explained that she had recently bought an
"urban looking" outfit for her infant granddaughter. It was her first marathi new year and she
wanted it celebrated properly.
Aside from holidays, some of our poor case study households undertook unusual lengths
to fulfill religious obligations. In Aurepalle, Pedda Balanna (the man who was so steeped in debtthat he could not remember how many people he owed) was planning to give up his house and,
with his relatives, build a temple on the same site. To buy a new plot and construction materials,
he planned to take another loan and sell 20 goats. His wife seemed very proud of their actions
and said that during the celebrations at the new temple, her husband will "get god inside of hisbody."
6. QUANTITATIVE RESULTS
During the course of this study, we considered several different methods to quantitatively
evaluate each indicator. The first section of this chapter outlines the choice of method for
indicator evaluation. The second section presents the results of a quantitative assessment of
indicator performance. The third section uses a simulation to illustrate the potential savingsassociated with a targeted food distribution program.
ISSUES CONCERNING CHOICE OF METHOD TO DETERMINE STATISTICAL
ASSOCIATION BETWEEN THE BENCHMARK AND THE ALTERNATIVE INDICATOR
At the beginning of the project, we identified a method to evaluate the performance of
each indicator. This method, known as the overlap procedure, is described in Haddad, Sullivan,and Kennedy (1992). The overlap method basically asks what proportion of households (or
individuals) with a certain indicator characteristic is also food insecure? A strong indicator
shows a high (and significant) proportion of observations that are in both the food insecure and
target groups. The statistical significance of this "overlap" is determined with a simple t-statisticto determine a significant difference between two proportions. Indicators that are identified as
"successful" are submitted to a targeting simulation for a final testing of its ability to distribute
food aid to the food insecure.
A preliminary analysis of these data used the overlap method to evaluate indicator
performance (Chung, Haddad, and Ramakrishna 1994). An evaluation of these results, however,
indicated that the overlap method was flawed for evaluating the performance of the alternativeindicators (Cogill 1994, personal communication; Khan and Riely 1995). More specifically, the
overlap method rewarded indicators that identified a high proportion of food insecure among the
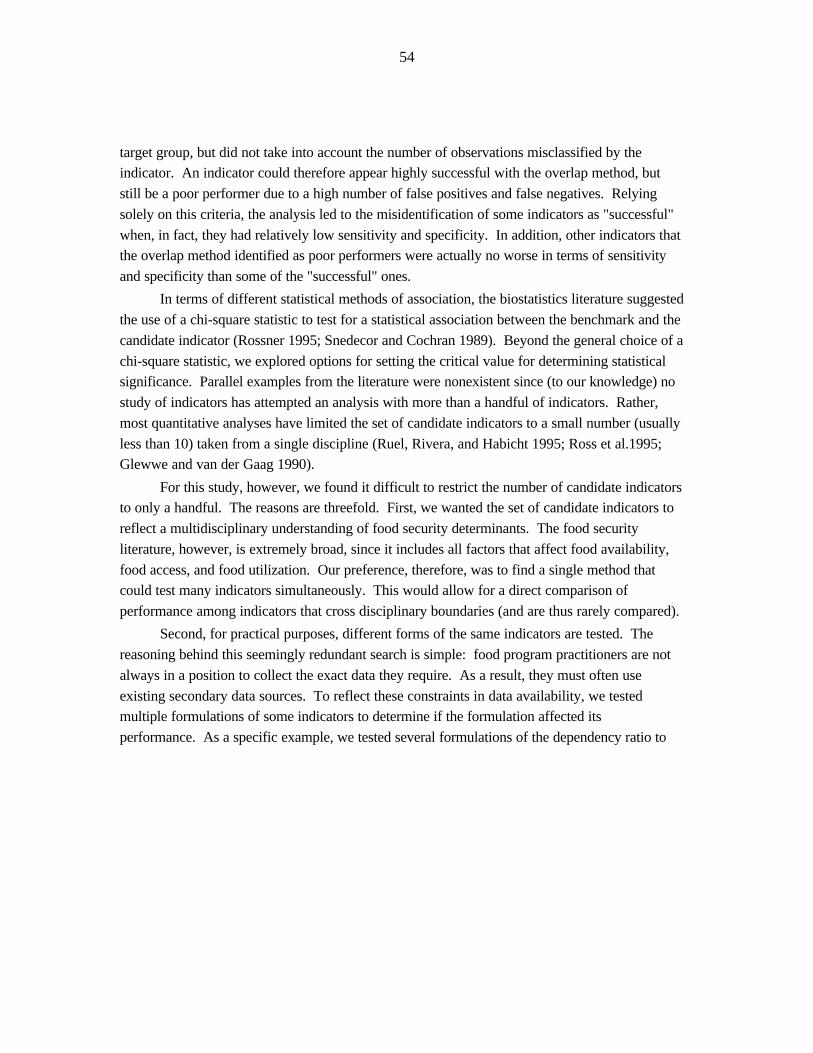
54
target group, but did not take into account the number of observations misclassified by theindicator. An indicator could therefore appear highly successful with the overlap method, but
still be a poor performer due to a high number of false positives and false negatives. Relying
solely on this criteria, the analysis led to the misidentification of some indicators as "successful"
when, in fact, they had relatively low sensitivity and specificity. In addition, other indicators thatthe overlap method identified as poor performers were actually no worse in terms of sensitivity
and specificity than some of the "successful" ones.
In terms of different statistical methods of association, the biostatistics literature suggested
the use of a chi-square statistic to test for a statistical association between the benchmark and the
candidate indicator (Rossner 1995; Snedecor and Cochran 1989). Beyond the general choice of a
chi-square statistic, we explored options for setting the critical value for determining statisticalsignificance. Parallel examples from the literature were nonexistent since (to our knowledge) no
study of indicators has attempted an analysis with more than a handful of indicators. Rather,
most quantitative analyses have limited the set of candidate indicators to a small number (usually
less than 10) taken from a single discipline (Ruel, Rivera, and Habicht 1995; Ross et al.1995;Glewwe and van der Gaag 1990).
For this study, however, we found it difficult to restrict the number of candidate indicatorsto only a handful. The reasons are threefold. First, we wanted the set of candidate indicators to
reflect a multidisciplinary understanding of food security determinants. The food security
literature, however, is extremely broad, since it includes all factors that affect food availability,
food access, and food utilization. Our preference, therefore, was to find a single method thatcould test many indicators simultaneously. This would allow for a direct comparison of
performance among indicators that cross disciplinary boundaries (and are thus rarely compared).
Second, for practical purposes, different forms of the same indicators are tested. The
reasoning behind this seemingly redundant search is simple: food program practitioners are not
always in a position to collect the exact data they require. As a result, they must often use
existing secondary data sources. To reflect these constraints in data availability, we testedmultiple formulations of some indicators to determine if the formulation affected its
performance. As a specific example, we tested several formulations of the dependency ratio to

55
Several version of the dependency ratio were tested:13
dependency ratio1 = (# children + # preschoolers)/household size;dependency ratio2 = # preschoolers/household size;dependency ratio3 = # cannot work/household size;dependency ratio4 = (# children + # preschoolers)/(household size - # preschoolers);dependency ratio5 = # preschoolers/(household sizeR - # preschoolers);dependency ratio6 = # cannot work/(household size - # preschoolers);dependency ratio7 = (# children + # preschoolers)/(household size - # cannot work);dependency ratio8 = # preschoolers/(household size - # cannot work);dependency ratio9 = # cannot work/(household size - # cannot work);dependency ratio10 = household size/(household size - # cannot work).
determine how sensitive an indicator's performance may be to its formulation. We also13
dichotomized various continuous variables and tested both the dichotomized variable and the
continuous variable itself. For example, we constructed a dichotomous variable "at least one
preschooler sick with diarrhea. . ." from a variable that gave the number of preschoolers in the
household that had diarrhea. Both variables were tested to determine if there was anything to begained from collecting a continuous variable over a simple dichotomous one.
The typical limitations on data availability also suggests that we should be concernedwhether an indicator performs equally well at all times of the year. Does it matter, for example,
when we collect data to target the chronically food insecure? Are data from one season just as
effective as data collected in another? For this reason, we collected indicators in three seasons
and tested each for its association with chronic food insecurity. If an indicator performs equallywell across the seasons, then it implies that the timing of indicator collection is not important.
This information would be especially useful to organizations with limited data collection
budgets.
The three factors described above encouraged us to test the performance of a large number
of alternative indicators. All in all, we found over 450 variations of food security indicators
suggested by the literature that could be tested with our data. This set of indicators is listed inChung et al. (1996, Appendix 7) and became our "core set" of alternative indicators. The set was
large, however, and this presented a number of methodological problems. First, the test for
significant association between the benchmark and the more than 450 core indicators presented a
situation of multiple statistical comparisons. Repeating the same "experiment" several timesleads to the possibility of obtaining a high number of significant associations purely due to
chance. The chance of making such an error can be reduced, using procedures such as the
Bonferroni adjustment (Rossner 1995). The Bonferroni procedure adjusts the critical value of
the test statistic to ensure that the overall probability of declaring significant differences betweenindicators and the alternatives is maintained at some fixed level of significance (say "=.05).
The Bonferroni adjustment is a conservative adjustment and it raises the critical value ofthe chi-square statistic: the more experiments conducted, the higher the value of the critical chi-

56
In actuality, an exact chi-square statistic can be calculated for each additional indicator.14
However, chi-square tables list critical values associated with incremental levels of probability. Assuch, we have reported the critical values that are associated with each range of probability levelsreported in the chi-square table shown in Rossner (1995).
For analyses of the chronic indicators of food insecurity, 450 indicators are tested for each15
season, leading to over 1,300 indicators.
square statistic. For example, the critical value for a single test of association between abenchmark and an alternative indicator is 3.84; for two indicators, it rises to 5.02; and for three
or four indicators, it rises to 6.63 (see Table 6). Between 11 to 50 indicators, it rises to 10.83. 14
Beyond 50 indicators, the additional correction required rises rapidly, making it extremely
unlikely that any indicator will clear the Bonferroni-corrected chi-square value.
The multiple comparisons problem indicates that there is a large statistical cost to testing
more than a handful of indicators. More specifically, increasing the number of indicators testedraises the critical chi-square value, making it harder for an alternative indicator to demonstrate a
significant association with the benchmark. To overcome this difficulty, we randomly split the
sample into an "exploration" data set and a "confirmation" data set. The exploration data set
contained 35 percent of the sample and was used to screen the more than 450 potentialindicators for use in a second round of statistical testing. To do this, the exploration data set15
was first used to create two-by-two contingency tables for each alternative indicator (Snedecor
and Cochran 1989). Chi-square statistics indicating the strength of association between the
benchmark and the alternative indicator were calculated. If the chi-square statistic for anindicator exceeded 3.84 (the critical value for significant association [p < .05] assuming a single
comparison), then that indicator passed into the second round of testing. This initial screening
was designed to decrease the number of indicators tested during the second round and therefore
lessen the severity of the multiple comparisons problem.
Successful indicators were identified using two criteria. The first group of indicators,
designated the "double winners," included indicators that demonstrated a chi-square statisticexceeding the critical value of 3.84 in both rounds of testing. A second group of winners,
designated the "Bonferroni winners," included indicators that met stricter performance criteria.
This group demonstrated a chi-square statistic greater than 3.84 in the screening round and a
significant chi-square statistic using the Bonferroni adjustment in the second round. Resultsfrom both performance criteria are reported, as they illustrate the range of results that
arepossible, given different requirements for indicator performance. While the group of double
winners represents a group of indicators that succeeded under the least conservative criteria,

57
Among this group, we include per capita household expenditures, per capita household food16
expenditures, the share of the household budget spent on food, per capita area of agricultural landcontrolled by the household, per capita number of agricultural plots controlled by the household, percapita area of agricultural area cultivated, the dependency ratio (two formulations), and householdsize.
Table 6—The relationship between the number of indicators tested and the critical chi-square statistic needed to determine a significant relationship between thealternative indicator and the benchmark
Number of Indicators Tested Critical Chi-Square Value Using the Bonferroni Adjustment
1 3.842 5.02
3 to 5 6.636 to 9 7.88
10 to 50 10.83above 50 rises to infinity
the Bonferroni winners represent the group that succeeded under the most conservative criteria;
the double-winner group no doubt includes some indicators that are random winners, while the
Bonferroni group no doubt excludes indicators that are truly useful.
A QUANTITATIVE ASSESSMENT OF THE PERFORMANCE OF THE ALTERNATIVE
INDICATORS
A quantitative assessment of the performance of the alternative indicators is summarized
in the tables below. Each table reports the results of the statistical tests of association between
the core set of alternative indicators and one of the six benchmark indicators of food insecurity:
(1) chronic household food insecurity, (2) acute household food insecurity, (3) chronicpreschooler food insecurity, (4) acute preschooler food insecurity, (5) household vitamin A
insecurity, and (6) household iron insecurity. Since many indicators were tested, the
performance of only selected indicators are shown. Each table reports the chi-square statistics
for (1) indicators that passed the first screening test for significant association with thebenchmark (chi-square > 3.84) and (2) indicators that are commonly collected in field surveys
and are often used as proxies for low economic status. The last two columns indicate whether16
the alternative indicator was successful according to the Bonferroni or double winner criteria.
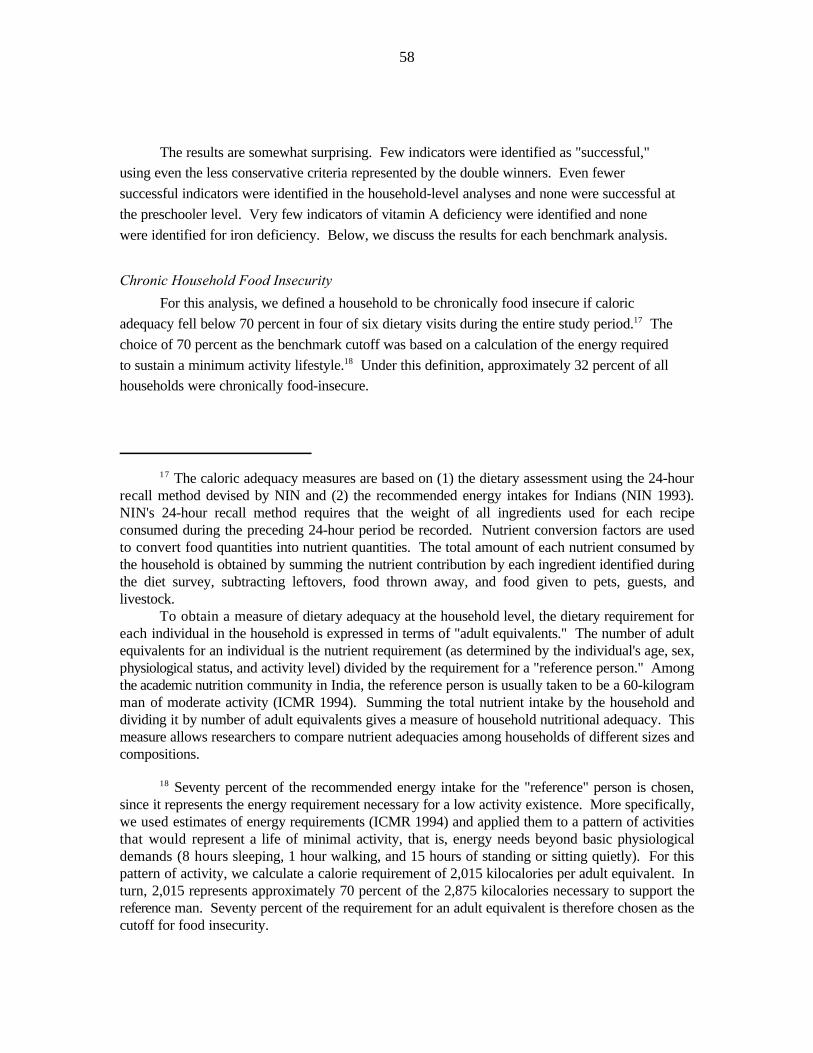
58
The caloric adequacy measures are based on (1) the dietary assessment using the 24-hour17
recall method devised by NIN and (2) the recommended energy intakes for Indians (NIN 1993).NIN's 24-hour recall method requires that the weight of all ingredients used for each recipeconsumed during the preceding 24-hour period be recorded. Nutrient conversion factors are usedto convert food quantities into nutrient quantities. The total amount of each nutrient consumed bythe household is obtained by summing the nutrient contribution by each ingredient identified duringthe diet survey, subtracting leftovers, food thrown away, and food given to pets, guests, andlivestock.
To obtain a measure of dietary adequacy at the household level, the dietary requirement foreach individual in the household is expressed in terms of "adult equivalents." The number of adultequivalents for an individual is the nutrient requirement (as determined by the individual's age, sex,physiological status, and activity level) divided by the requirement for a "reference person." Amongthe academic nutrition community in India, the reference person is usually taken to be a 60-kilogramman of moderate activity (ICMR 1994). Summing the total nutrient intake by the household anddividing it by number of adult equivalents gives a measure of household nutritional adequacy. Thismeasure allows researchers to compare nutrient adequacies among households of different sizes andcompositions.
Seventy percent of the recommended energy intake for the "reference" person is chosen,18
since it represents the energy requirement necessary for a low activity existence. More specifically,we used estimates of energy requirements (ICMR 1994) and applied them to a pattern of activitiesthat would represent a life of minimal activity, that is, energy needs beyond basic physiologicaldemands (8 hours sleeping, 1 hour walking, and 15 hours of standing or sitting quietly). For thispattern of activity, we calculate a calorie requirement of 2,015 kilocalories per adult equivalent. Inturn, 2,015 represents approximately 70 percent of the 2,875 kilocalories necessary to support thereference man. Seventy percent of the requirement for an adult equivalent is therefore chosen as thecutoff for food insecurity.
The results are somewhat surprising. Few indicators were identified as "successful,"using even the less conservative criteria represented by the double winners. Even fewer
successful indicators were identified in the household-level analyses and none were successful at
the preschooler level. Very few indicators of vitamin A deficiency were identified and none
were identified for iron deficiency. Below, we discuss the results for each benchmark analysis.
Chronic Household Food Insecurity
For this analysis, we defined a household to be chronically food insecure if caloric
adequacy fell below 70 percent in four of six dietary visits during the entire study period. The17
choice of 70 percent as the benchmark cutoff was based on a calculation of the energy required
to sustain a minimum activity lifestyle. Under this definition, approximately 32 percent of all18
households were chronically food-insecure.

59
Note that different questionnaires were administered that collected dietary information (see19
Table 4). The food frequency questionnaire inquired about the frequency with which certain foodswere consumed. In contrast to the 24-hour dietary recall, no attempt was made to quantify theamounts consumed.
"Frequent" consumption is a relative term. Respondents were asked to state how often they20
consumed a certain food (e.g., more than once daily, daily, two-to-three times a week, once a week,etc.). As with all indicators, the cutoff for each food varies according to the frequency of responsesfor that food. "More frequent" can therefore mean one time (e.g., festival foods), a week for foodsthat are rarely eaten, or >1 a day for foods that are eaten more often (e.g., rice).
The results of the chronic household analyses are shown in Table 7. Several alternativeindicators showed a strong association with the benchmark for chronic household food
insecurity. None, however, showed a significant association with the benchmark in every season.
The indicators that showed the strongest performance (i.e., that met the Bonferroni
criteria) came from the household food frequency questionnaire ; as such, they represent19
information about the frequency of consumption of various foods. A priori one would expect
that certain foods would be more commonly consumed by food-insecure groups and other foodsmore commonly consumed by more food-secure groups. The results, however, run counter to
this logic. First, most of the indicators that are successful in locating the food insecure represent
"more frequent" consumption of high-income elasticity foods, such as fats, oils, nuts, sugar,
wheat, and processed cereal foods (buns/bread). A priori we would expect that food-secure20
families would be more likely to consume these foods than food-insecure families. Yet, only one
dietary indicator appears to be consistent with economic theory; "infrequent consumption of
meat" is statistically correlated with chronic food insecurity. In addition, most of these
counterintuitive dietary indicators appear more successful at identifying the food insecure thanthose suggested by the conventional poverty literature (e.g., indicators representing household
expenditures, demographics, landholdings, and caste).
Previous analyses of the dietary data are helpful for interpreting these counterintuitive
results. More specifically, a recent study on dietary patterns split the sample by state
(Maharashtra vs. Andhra Pradesh) and then calculated the calories (per adult equivalent) derived
from different food sources (Chung and Bouis 1996). The results showed very different dietarypatterns between the two states (Table 8). More specifically, the villages located in Maharashtra
(Shirapur and Kanzara) consumed more energy from sorghum and wheat than the study villages
located in Andhra Pradesh (Aurepalle and Dokur). In addition, households in the Maharashtran
villages typically consumed more energy from fats, oils, nuts, and sugar.

60Table 7—Performance of selected alternative indicators of chronic household food insecurity
Exploration Data Set Confirmation Data Set Double BonferroniIndicator P Se +Sp n P Se +Sp n Winner? Winner?1 1 1 1 2 2 2 2
2 2
Alternative indicators screened in First RoundHousehold located in Shirapur 4.75 124 97 4.39 114 196 Yes NoHigh number of preschoolers in household, r1 5.04 127 97 4.57 116 196 Yes NoInfrequent consumption of meat, r2 11.96 139 96 11.90 126 195 Yes YesInfrequent consumption of eggs, r2 7.94 133 96 2.78 114 195 No NoFrequent consumption of wheat, r2 8.14 133 97 2.30 112 195 No NoFrequent consumption of fats or oils, r2 6.96 132 96 18.44 133 195 Yes YesFrequent consumption of sugar or jaggery, r2 6.38 131 97 14.23 129 195 Yes YesFrequent consumption of sorghum, r2 5.11 128 96 14.76 131 195 Yes YesFrequent consumption of tea with milk, r2 4.78 127 96 7.97 122 195 Yes NoFrequent consumption of nuts, r2 4.80 125 97 3.73 114 195 No NoFrequent consumption of wheat, r3 5.54 127 97 7.92 120 196 Yes NoFrequent consumption of sugar, r3 4.54 126 97 21.06 136 196 Yes YesFrequent consumption of fats or oils, r3 4.15 126 97 18.37 133 196 Yes YesFrequent consumption of pearl millet, r3 4.75 124 97 2.73 88 196 Yes NoFrequent consumption of buns/bread, r3 4.06 124 96 2.92 113 196 No NoHigh number of chickens owned, r2 4.27 124 96 3.68 114 192 No NoHigh percent of food consumed from gifts, r3 6.20 124 96 0.49 106 196 No No
Other commonly cited indicatorsLow per capita total expenditures (mean of 3 rounds) 1.53 115 95 6.52 118 192 No NoLow per capita food expenditures (mean of 3 rounds) 1.97 116 95 3.06 113 192 No NoHigh food share of total expenditures (mean of 3 rounds) 3.07 120 95 5.07 116 191 No NoForward caste 12.46 55 97 0.00 101 196 No NoBackward caste 1.05 44 97 0.12 103 196 No NoScheduled caste 6.35 75 97 0.36 95 196 No NoHigh household size ® 1) 0.17 93 97 0.73 107 196 No NoHigh dependency ratio 2 (r1): Number of preschoolers/total
number in household 2.72 118 97 2.92 113 196 No NoHigh dependency ratio 10 (r1): Total number in household/
(total number in household - number of disabled) 1.34 114 97 3.04 113 196 No NoLow per capita area of agricultural plots controlled by household
(mean of 3 rounds) 0.00 103 82 1.76 111 168 No NoLow per capita sum of cultivated land (mean of 3 rounds) 0.00 100 83 0.01 112 170 No NoLow per capita number of agricultural plots controlled by
household (mean of 3 rounds) 0.09 103 61 1.76 100 123
Se = SensitivitySp = Specificity

61
Note that if the second criteria is not included in the definition, then households that had21
low caloric adequacies in Round 2 (i.e., below 70 percent) and drop even further would be classifiedas food secure.
The set of dietary indicators shown in Table 8 mirrors the dietary trends shown in Table 7. When taken together, the set of "successful" dietary indicators describe the Maharashtran diets
relative to the Andhran diets; Maharashtran diets are higher in sorghum, wheat, oil, sugar, and
nut consumption relative to the Andhran diets. As a result, we interpret the joint performance of
these dietary indicators to be more representative of the location they represent rather than anycausal pathway involving any one of these foods per se. In short, each significant food
consumption variable is in effect acting as a proxy for a location or geographic indicator. The
plausibility of the geographic indicators is supported by the performance of the "Shirapur
village" indicator in identifying the chronically food insecure.
Aside from the Shirapur and food frequency indicators, the only other successful indicator
was the number of preschoolers in the household. This indicator, however, only succeededduring one season, using the more liberal double-winner criteria. Given that the number of
preschoolers is not expected to change drastically from round to round, it is doubtful that it is a
robust indicator of chronic household food insecurity. The lack of robustness of a relatively
"structural" indicator (one that is not expected to change in the short term) suggests that thisdouble winner may, in fact, be a random winner in both rounds of testing.
Acute Household Food Insecurity
For this analysis, we focus on abrupt changes in household caloric adequacy. To
construct a "benchmark" of acute household food insecurity, we identified households that
plunged from a state of food security into a state of food insecurity. To do this, we defined twopoints between which we could assess the changes in food security status. In this region,
seasonality varies among the villages, but the third round is a lean season for all (during this
time, the rains have not yet begun and little work is available). As such, the period between
round two (the post-rainy season) and round three (late summer, early kharif season) was a goodtime to assess acute changes in food security.
To construct a benchmark of acute household food security, we defined a household to beacutely food insecure if (1) its household caloric adequacy ratio drops below 70 percent between
rounds two and three OR (2) its calorie adequacy ratio is already below 70 percent in round two
and drops 10 percent or more in the subsequent round. Indicators collected in the second round21
(the post-rainy season) were tested for their ability to predict a fall into food insecurity during thethird round (late summer, early kharif season).

62
Table 8—Energy sources by food source and location of village
Energy Intakes Per Adult Equivalent Village/ Expenditure Tertile Food Group 1 2 3 All
(kilocalories)
Maharashtra villagesRice 53 83 96 77Sorghum 946 1,092 1,047 1,028Millets 18 1 13 11Other cereals 407 257 307 324Pulses 153 131 97 127Milk products 30 55 72 52Other vegetables 21 19 19 20Fruits 12 9 7 9Cooking ingredients 366 352 409 376Meat 6 5 5 5Green leafy vegetables 3 5 8 5All cereals 1,424 1,433 1,463 1,440
Total All 2,014 2,008 2,081 2,034
Andhra Pradesh villagesRice 1,774 1,714 1,602 1,696Sorghum 260 289 259 269Millets 23 72 54 50Other cereals 10 24 15 16Pulses 40 45 51 45Milk products 60 62 100 74Other vegetables 25 26 27 26Fruits 2 9 3 5Cooking ingredients 140 154 192 162Meat 8 11 10 10Green leafy vegetables 2 2 1 2All cereals 2,067 2,099 1,930 2,031
Total All 2,344 2,408 2,314 2,356
Source: Chung and Bouis (1996).

63
The results of the acute household analyses are shown in Table 9. Several alternativeindicators showed a strong association with the benchmark of acute household food insecurity.
Among the strong performers are the food frequency indicators representing frequent sugar,
sorghum, fats and wheat consumption. As with the chronic indicators, we interpret the joint
performance of these dietary indicators to be representative of the location they represent ratherthan any causal pathway involving any one of these foods per se. As explained earlier, we
believe that each of these indicators acts effectively as a proxy for a location or geographic
indicator.
In addition to the proposed geographic indicators, two other alternative indicators
performed well. Both involved the acquisition of foods: households that consumed a high
percentage of foods from gifts and households that obtained a high number of foods on a weeklybasis. These findings reflect behavior that is consistent with our expectations of food-insecure
households; households under stress consume foods from gifts (a local euphemism for a food
loan or a handout) and obtain many foods on a weekly basis (ostensibly because wages are paid
once a week in these villages). These findings are also consistent with accounts that came out ofthe ethnography. Food-insecure households often borrowed and loaned foods for short periods
of time and bought food immediately on wage days. The fact that these indicators are predictive
of households falling into food insecurity in the subsequent round indicates that coping strategies
for households "on the brink" begin long before the household actually drops into acute foodinsecurity.
Chronic Preschooler-level Food Insecurity
For this analysis, we defined a preschooler as chronically food insecure (PCFIS) if the Z-
score for height-for-age was below -3.0. This cutoff point corresponded to the bottom 30 percent
of sample distribution for height-for-age. A high level of chronic preschooler food insecuritywas evident in the study villages: 47 percent of the preschoolers in Kanzara were chronically
food insecure, 37 percent in Dokur, 27 percent in Shirapur, and 20 percent in Aurepalle.
The results for these analyses are shown in Table 10. Most striking is the fact that no
alternative indicators (at the household level) are successful at identifying the PCFIS. Two of
the alternative dietary indicators (frequent consumption of oils in rounds one and two) were
screened as potential indicators in the first round of testing, but appeared to be "randomwinners," since they failed to perform in the second round of testing. None of the more
conventional poverty indicators performed well at identifying the PCFIS either.

64Table 9—Performance of selected indicators of acute household food insecurity
Exploration Data Set Confirmation Data Set Double BonferroniIndicator P Se +Sp n P Se +Sp n Winner? Winner?1 1 1 1 2 2 2 2
2 2
Alternative indicators screened in First RoundHigh percentage of food consumed from gifts, r2 5.50 126 97 4.92 118 193 Yes NoHigh number of food consumed obtained on weekly basis, r2 4.08 124 97 8.33 124 194 Yes YesFrequent nuts/oilseeds consumption, r2 8.22 133 97 1.38 110 196 No NoFrequent tea with milk consumption, r2 6.17 131 96 9.29 127 196 Yes YesFrequent sugar consumption, r2 5.60 129 96 14.10 133 196 Yes YesFrequent sorghum consumption, r2 4.16 126 97 4.80 119 196 Yes NoFrequent fats/oils consumption, r2 4.07 125 96 10.66 129 196 Yes YesFrequent wheat consumption, r2 4.24 125 97 8.93 126 196 Yes YesLives in Shirapur (yes) 8.19 132 96 3.68 114 192 No NoHigh dependency ratio 2, r2 5.46 125 97 0.54 107 197 No NoHigh dependency ratio 5, r2 5.46 125 97 0.54 107 197 No NoHigh percent preschoolers in household, r2 5.46 125 97 0.54 107 192 No NoHigh value of food consumed as gifts, r2 5.49 126 97 3.04 115 194 No NoHousehold has a high number of loans, r2 4.66 124 97 1.16 111 197 No NoHigh number of foods consumed from gifts, r2 7.24 130 97 1.43 111 194 No No
Other commonly cited indicatorsLow per capita total expenditures (mean of 3 rounds) 1.03 113 95 0.09 105 192 No NoLow per capita food expenditures (mean of 3 rounds) 0.01 104 95 0.05 103 193 No NoHigh food share of total expenditures (mean of 3 rounds) 4.30 124 95 0.01 102 191 No NoForward caste 4.75 125 97 0.39 106 197 No NoBackward caste 0.62 88 97 1.87 87 197 No NoScheduled caste 1.54 87 97 0.63 107 197 No NoHigh household size (r1) 1.91 83 97 0.02 102 197 No NoHigh dependency ratio 2 (r1): Number of preschoolers/
total number in household 1.72 116 97 0.54 107 196 No NoHigh dependency ratio 10 (r1): Total number in household/
(total number in household - number of disabled) 5.46 125 97 0.24 105 197 No NoLow per capita area of agricultural plots controlled
by household (mean of 3 rounds) 0.01 98 82 1.41 89 168 No NoLow per capita sum of cultivated land (mean of 3 rounds) 3.69 72 61 1.75 86 123 No NoLow per capita number of agricultural plots controlled by
household (mean of 3 rounds) 0.03 95 83 0.00 98 170 No No
Notes: Se = SensitivitySp = Specificityr1 = Round 1, late kharif seasonr2 = Round 2, post-rainy seasonr3 = Round 3, late summer/early kharif season

65
Table 10—Performance of selected alternative indicators of chronic preschooler food insecurity
Exploration Data Set Confirmation Data Set Double BonferroniIndicator P Se +Sp n P Se +Sp n Winner? Winner?1 1 1 1 2 2 2 2
2 2
Alternative indicators screened in First RoundFrequent consumption of fats and oils by household, r1 5.34 123 122 1.58 109 239 No NoFrequent consumption of fats and oils by household, r2 5.66 126 115 1.02 108 225 No NoHousehold has more than one income source (yes), r1 4.54 122 122 0.13 103 241 No NoHigh number of household members engaged in a caste
occupation (yes), r2 4.17 117 119 0.14 2 139 No NoHigh number of household members engaged in a caste
occupation (yes), r3 3.92 116 114 0.05 102 134 No NoLow number of foods purchased per fortnight, r1 6.93 124 122 0.66 94 240 No NoHigh percent of foods consumed from stocks, r2 9.57 128 118 0.26 104 234 No NoLow number of foods purchased per week, r2 5.30 122 118 0.23 103 236 No NoLow number of nonfoods purchased per year, r1 7.88 125 122 0.09 103 239 No NoHousehold gave gifts, r2 4.39 0.00Low number of nonfoods purchased per week, r1 5.59 122 122 0.12 97 239 No NoHousehold does not have a vegetable garden, r1 5.73 118 122 0.02 102 241 No NoHousehold does not have a vegetable garden, r2 4.16 115 118 0.32 104 234 No NoLow number of kind loans given out, last month, r1 5.72 118 122 0.02 101 239 No NoDid not give gifts in r2 6.63 127 119 0.06 103 234 No No
Other commonly cited indicators (household level)Low per capita total expenditures (mean of 3 rounds) 0.21 106 112 0.67 93 233 No NoLow per capita food expenditures (mean of 3 rounds) 0.00 98 112 3.31 112 225 No NoHigh food share of total expenditures (mean of 3 rounds) 0.00 101 112 0.00 99 227 No NoForward caste 0.02 103 122 1.70 92 243 No NoBackward caste 0.10 95 122 0.07 103 243 No NoScheduled caste 0.00 102 122 0.75 106 243 No NoHigh household size (r1) 0.09 104 122 0.00 101 241 No NoHigh dependency ratio 2 (r1): Number of preschoolers/
total number in household 2.46 85 122 0.59 94 241 No NoHigh dependency ratio 10 (r1): Total number in
household/(total number in household - number of disabled) 0.02 103 122 0.35 105 241 No NoLow per capita area of agricultural plots controlled by
household (mean of 3 rounds) 0.58 110 92 0.08 97 203 No NoLow per capita sum of cultivated land (mean of 3 rounds) 1.13 116 65 0.01 99 142 No NoLow per capita number of agricultural plots controlled
by household (mean of 3 rounds) 0.35 92 92 0.69 107 203 No No
Notes: Se = SensitivitySp = Specificityr1 = Round 1, late kharif seasonr2 = Round 2, post-rainy season
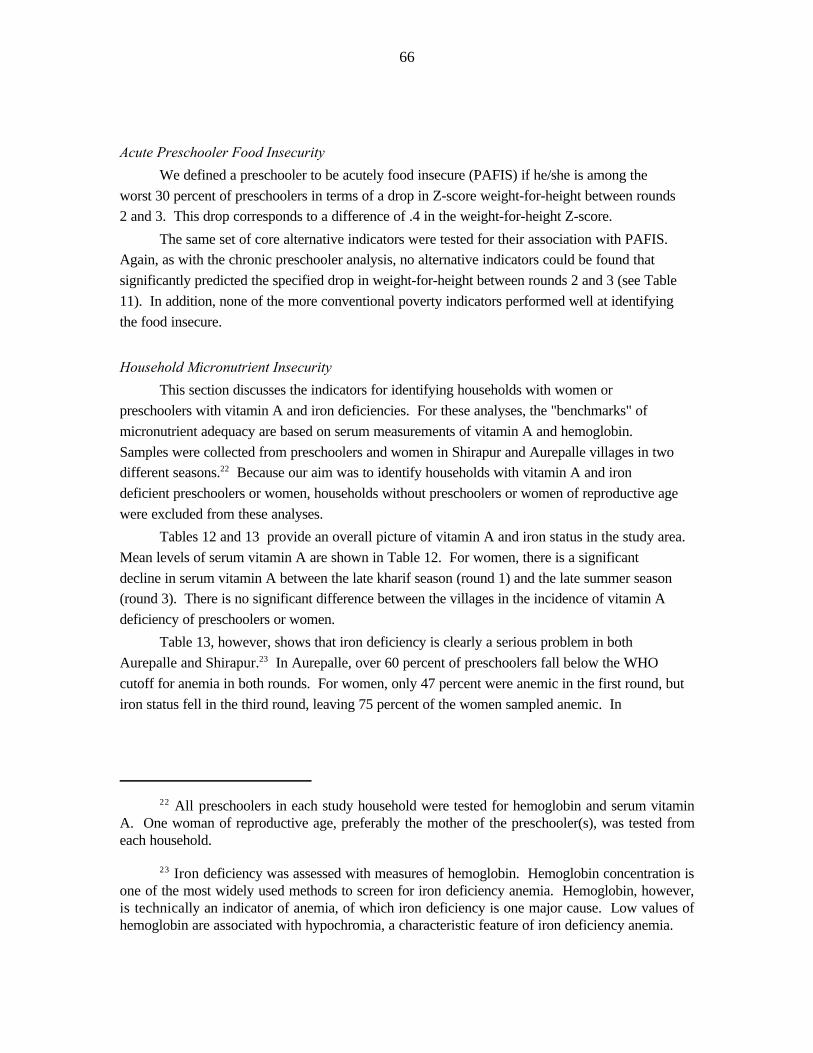
66
All preschoolers in each study household were tested for hemoglobin and serum vitamin22
A. One woman of reproductive age, preferably the mother of the preschooler(s), was tested fromeach household.
Iron deficiency was assessed with measures of hemoglobin. Hemoglobin concentration is23
one of the most widely used methods to screen for iron deficiency anemia. Hemoglobin, however,is technically an indicator of anemia, of which iron deficiency is one major cause. Low values ofhemoglobin are associated with hypochromia, a characteristic feature of iron deficiency anemia.
Acute Preschooler Food Insecurity
We defined a preschooler to be acutely food insecure (PAFIS) if he/she is among the
worst 30 percent of preschoolers in terms of a drop in Z-score weight-for-height between rounds2 and 3. This drop corresponds to a difference of .4 in the weight-for-height Z-score.
The same set of core alternative indicators were tested for their association with PAFIS. Again, as with the chronic preschooler analysis, no alternative indicators could be found that
significantly predicted the specified drop in weight-for-height between rounds 2 and 3 (see Table
11). In addition, none of the more conventional poverty indicators performed well at identifying
the food insecure.
Household Micronutrient Insecurity
This section discusses the indicators for identifying households with women or
preschoolers with vitamin A and iron deficiencies. For these analyses, the "benchmarks" of
micronutrient adequacy are based on serum measurements of vitamin A and hemoglobin.
Samples were collected from preschoolers and women in Shirapur and Aurepalle villages in twodifferent seasons. Because our aim was to identify households with vitamin A and iron22
deficient preschoolers or women, households without preschoolers or women of reproductive age
were excluded from these analyses.
Tables 12 and 13 provide an overall picture of vitamin A and iron status in the study area.
Mean levels of serum vitamin A are shown in Table 12. For women, there is a significant
decline in serum vitamin A between the late kharif season (round 1) and the late summer season(round 3). There is no significant difference between the villages in the incidence of vitamin A
deficiency of preschoolers or women.
Table 13, however, shows that iron deficiency is clearly a serious problem in both
Aurepalle and Shirapur. In Aurepalle, over 60 percent of preschoolers fall below the WHO23
cutoff for anemia in both rounds. For women, only 47 percent were anemic in the first round, but
iron status fell in the third round, leaving 75 percent of the women sampled anemic. In

67
Table 11—Performance of selected indicators of acute preschooler food insecurity
Exploration Data Set Confirmation Data Set Double BonferroniIndicator P Se +Sp n P Se +Sp n Winner? Winner?1 1 1 1 2 2 2 2
2 2
Alternative indicators screened in first round testingHousehold did not give gifts, r2 5.29 130 75 5.49 122 153 Yes NoHousehold did not give cash transfers, r2 6.68 134 75 1.31 112 153 No NoLow number not able to work, r2 7.95 134 75 0.29 106 154 No NoLow number dependency ratio #7, r2 8.61 132 75 1.50 111 154 No NoLow number dependency ratio #1, r2 5.67 130 75 0.92 109 154 No NoLow number dependency ratio #4, r2 5.48 126 75 0.93 109 154 No NoLow number dependency ratio #8, r2 4.37 124 ??? 1.27 113 154 No NoLow number dependency ratio #10, r2 4.00 112 75 1.07 110 154 No NoLow number dependency ratio #3, r2 4.00 122 75 1.07 110 154 No NoLow number dependency ratio #9, r2 4.00 122 75 0.09 104 154 No NoNumber of agricultural workers 5.84 132 75 1.77 117 91 No No
Other commonly cited indicatorsLow per capita total expenditures (mean of 3 rounds) 0.00 97 74 0.64 108 149 No NoLow per capita food expenditures (mean of 3 rounds) 1.71 83 74 0.03 103 149 No NoHigh food share of total expenditures (mean of 3 rounds) 0.17 107 74 0.04 97 149 No NoForward caste 0.36 85 75 0.02 97 154 No NoBackward caste 2.09 120 75 2.34 115 154 No NoScheduled caste 0.05 95 75 2.72 88 154 No NoHigh household size, (r2) 1.06 87 75 4.12 80 97 No NoHigh dependency ratio 2 (r2): Number of preschoolers/
total number in household 3.06 120 75 3.24 116 136 No NoHigh dependency ratio 10 (r2): Total number in
household/(total in household ! number of disabled) 4.01 122 75 1.07 110 97 No NoLow per capita area of agricultural plots controlled by
household (mean of 3 rounds) 0.07 99 75 1.08 90 154 No NoLow per capita sum of cultivated land (mean of 3 rounds) 0.20 87 75 0.00 102 154 No NoLow per capita number of agricultural plots controlled by
household (mean of 3 rounds) 0.33 112 75 0.66 91 154 No No
Notes: Se = SensitivitySp = Specificityr1 = Round 1, late kharif seasonr2 = Round 2, post-rainy season

6868Table 12—Mean serum vitamin A (ug/dL) and percentage below NHANES II cutoffs by season, age group and villagea
Round 1: Late Kharif Season Round 3: Late Summer Season Standard Percentage Standard Percentage
Village Mean Deviation Below Cutoff N Mean Deviation Below Cutoff N
AurepallePreschoolers 29.5 13.3 20.0 50 31.1 13.6 11.7 60b b
Women 41.3 15.1 4.8 62 35.4 10.3 4.2 48d dc
ShirapurPreschoolers 22.6 8.0 50.0 34 24.4 7.5 28.6 49b b
Women 34.3 12.3 11.1 54 28.8 10.1 14.0 43d dc
Pilch (1985).a
Significant difference in preschoolers' serum vitamin A values in Aurepalle and Shirapur.b
Significant difference in women's serum vitamin A values in Aurepalle and Shirapur.c
Significant decline in serum vitamin A values between seasons.d
Table 13—Mean blood hemoglobin (g/dL) with percentage below WHO cutoffs for anemia by season, age group and villagea
Round 1: Late Kharif Season Round 3: Late Summer Season Standard Percentage Standard Percentage
Village Mean Deviation Below Cutoff N Mean Deviation Below Cutoff N
AurepallePreschoolers 10.1 1.8 68.0 50 10.5 1.5 63.3 60Women 11.9 1.4 46.8 62 11.3 1.4 75.0 48b
ShirapurPreschoolers 10.7 1.3 64.7 34 9.6 1.8 83.7 49c c
Women 11.4 1.9 57.4 54 10.2 1.6 81.4 43c cb
World Health Organization (1972).a
Significant difference between blood hemoglobin levels in Aurepalle and Shirapur.b
Significant decline in blood hemoglobin values between seasons.c

69
Shirapur, anemia values also rose during the third round. In the first round, 57 percent of thewomen were anemic and, by the third round, 81 percent were anemic. Preschooler values
followed a similar trend: 65 percent were anemic in the first round, worsening to 84 percent in
the third round.
These high rates of anemia and vitamin A deficiency are characteristic of these parts of
South Asia (ACC/SCN 1992). As such, food aid programmers may be interested in identifying
households with micronutrient deficiencies. However, programmers may be hindered by theircapacity to collect individual-level measurements. To address this constraint, the micronutrient
indicator analyses focuses on testing the association between the core set of alternative indicators
and two different micronutrient benchmarks, both which are defined at the household level.
Separate analyses were undertaken for each micronutrient in each season. For the vitamin Awork, a household is considered vitamin A-insecure if at least one woman or preschooler in the
household falls below the WHO cutoffs. A similar benchmark indicator is derived for household
iron security. Households are considered to be iron-insecure if at least one woman or
preschooler in the household falls below the NHANES II cutoff (Pilch 1985).
Constructing micronutrient indicators at the household level is a novel idea, particularly
since individual serum measurements are already available. This strategy, however, is consistentwith the spirit of testing simple protocols for identifying targeting instruments. If successful,
these analyses could provide a basis for less complicated data collection protocols by targeting
agencies.
Vitamin A Deficiency. The results for the late-kharif season analyses (round one) are shown in
Table 14 and those for the late-summer season (round three) are shown in Table 15. For each
analysis, the benchmark for vitamin A insecurity was a simple dummy variable indicating
whether a household contained at least one woman or preschooler that was deficient in vitamin Aduring that round (as determined by the NHANES II cutoffs) (Pilch 1985).
For the late kharif-season, a number of alternative variables screened into the secondround of testing (Table 14). Many of them were indicators from the food frequency
questionnaire. Most of them, however, did not perform well in the second round of testing. Only
one of the screened indicators qualified as a double winner: household with a high number of
preschoolers.
For the late-summer season (round three), very few alternative indicators screened into the
second round of testing (Table 15). Only two alternative indicators qualified as double winners: households with a high number of preschoolers and households that had at least one preschooler
with diarrhea during the last 14 days. Of these two, only the latter qualified as a Bonferroni
winner.

70
Table 14—Performance of selected alternative indicators of vitamin A insecurity, round 1, late kharif season
Exploration Data Set Confirmation Data Set Double BonferroniIndicator P Se +Sp n P Se +Sp n Winner? Winner?1 1 1 1 2 2 2 2
2 2
Alternative indicators screened in first round testingFrequent consumption of nuts/oilseeds 8.31 148 45 2.47 124 75 No NoFrequent consumption of rice 7.52 144 45 0.07 106 75 No NoFrequent consumption of green leafy vegetables 7.52 144 45 0.43 112 75 No NoFrequent consumption of sorghum 4.54 138 45 0.22 110 75 No NoFrequent consumption of tea with milk 4.54 138 45 0.11 108 75 No NoFrequent consumption of pulses 5.31 137 45 2.13 121 75 No NoNumber of preschoolers in household, (r1) 8.95 153 45 4.47 131 75 Yes NoAt least one preschooler sick with diarrhea in the last 14 days, r1 4.06 134 45 4.56 131 75 Yes NoHigh dependency ratio #4, r1 10.01 151 45 2.13 121 75 No NoHigh dependency ratio #7, r1 5.61 142 45 0.93 93 75 No NoHigh dependency ratio #8, r1 4.78 478 45 0.93 93 75 No NoHousehold lives in Shirapur 4.54 138 45 0.22 110 75 No NoHigh number of foods consumed per week, r1 4.78 138 45 1.45 172 75 No NoDid not give cash transfer last month, r1 6.55 146 45 0.99 117 75 No No
Other commonly cited indicatorsLow per capita total expenditures (mean of 3 rounds) 0.80 118 43 0.73 86 70 No NoLow per capita food expenditures (mean of 3 rounds) 0.80 118 43 0.04 94 71 No NoHigh food share of total expenditures (mean of 3 rounds) 0.02 107 43 0.00 95 70 No NoForward caste 0.10 100 45 0.49 106 75 No NoBackward caste 0.72 100 45 0.11 108 75 No NoScheduled caste 0.09 99 45 1.24 86 75 No NoHigh household size, (r1) 0.32 114 45 1.06 106 75 No NoHigh dependency ratio 2 (r1): Number of preschoolers/total number in
household 3.04 131 45 0.43 112 75 No NoHigh dependency ratio 10 (r1): Total number in household/(total number
in household ! number of disabled) 3.04 131 45 0.74 114 75 No NoLow per capita area of agricultural plots controlled by
household (mean of 3 rounds) 0.02 108 39 0.15 109 61 No NoLow per capita sum of cultivated land (mean of 3 rounds) 0.00 107 28 0.09 110 46 No NoLow per capita number of agricultural plots controlled by
household (mean of 3 rounds) 3.58 134 39 0.02 102 61 No No
Notes: Se = SensitivitySp = Specificityr1 = Round 1, late kharif season

71
Table 15—Performance of selected alternative indicators of vitamin A security, round 3, late summer, early kharif
Exploration Data Set Confirmation Data Set Double BonferroniIndicator P Se +Sp n P Se +Sp n Winner? Winner?1 1 1 1 2 2 2 2
2 2
Alternative indicators screened in first round testingNumber of preschoolers in household, r3 3.89 143 44 3.89 130 71 Yes NoAt least 1 preschooler sick with diarrhea in the last 14 days, r3 4.56 141 43 8.23 139 71 Yes NoHigh number of preschoolers, r3 4.47 143 44 3.88 130 71 Yes No
Other commonly cited indicatorsLow per capita total expenditures (mean of 3 rounds) 0.14 101 42 0.24 90 68 No NoLow per capita food expenditures (mean of 3 rounds) 0.14 86 42 0.19 91 68 No NoHigh food share of total expenditures (mean of 3 rounds) 0.13 114 42 1.19 116 68 No NoForward caste 0.39 118 44 0.12 108 72 No NoBackward caste 1.09 77 44 0.01 102 72 No NoScheduled caste 0.00 108 44 0.41 90 72 No NoHigh household size, r3 0.91 124 44 0.13 116 71 No NoHigh dependency ratio 2 (r3):Number of preschoolers/total
number in household 0.47 119 44 0.13 116 71 No NoHigh dependency ratio 10 (r3): Total number in household/(total
number in household ! number of disabled) 0.77 122 44 0.13 108 71 No NoLow per capita area of agricultural plots controlled by household
(mean of 3 rounds) 0.00 108 38 1.56 80 58 No NoLow per capita sum of cultivated land (mean of 3 rounds) 0.18 96 28 0.81 82 45 No NoLow per capita number of agricultural plots controlled by
household (mean of 3 rounds) 0.03 95 38 0.09 100 58 No No
Notes: Se = SensitivitySp = Specificityr3 = Round 3, late summer/early kharif season

72
Few indicators were produced from the vitamin A analyses. Yet the two suggested fromthese analyses are related to a plausible causal pathway. Households with more preschoolers,
and households containing preschoolers with diarrhea, appear to be more likely to have vitamin
A-deficient women and children. These indicators are logical given our knowledge of (1) the
linkages between morbidity and vitamin A deficiency and (2) the competition for care and propernourishment within households with many preschoolers. Note, however, that only the latter
indicator (a more structural indicator) was robust across seasons. By contrast, the former
indicator appears to be more season-specific. Given that sickness is more prevalent during the
period following the rain, it is logical that the diarrhea indicator performs best during the late-kharif season (round 1).
Aside from these few successful alternative indicators, none of the more conventionalpoverty indicators performed well as a whole. None showed a significant association with the
benchmark indicator of vitamin A insecurity.
Iron Deficiency. The high levels of anemia in the area suggest that it may not be necessary totarget an iron-improvement program. However, under the assumption that intervention resources
will always be limited, we explored the possibility of developing alternative indicators of iron
deficiency. Again, because practitioners cannot always target at the individual level, we
searched for household-level indicators that could identify households containing no irondeficient preschoolers or women of reproductive age. The benchmark for iron deficiency was a
simple dummy variable, indicating whether the household contained at least a woman or
preschooler that was iron deficient (as determined by the WHO anemia cutoffs) (WHO 1972).
The results for the analysis of alternative indicators for iron security for rounds 1 and 3
are shown in Tables 16 and 17, respectively. No successful indicators could be found for iron
deficiency in either season.
HOW DO THE ALTERNATIVE INDICATORS SUGGESTED FROM THE QUALITATIVE
WORK COMPARE TO THOSE DERIVED FROM THE QUANTITATIVE WORK?
The indicators tested in the quantitative analyses were derived from a review of the food
security literature as well as our own qualitative work reported in Chapter 5. After completing
both the qualitative and quantitative analyses, a logical question remained: how similar were thelists of successful indicators derived from each method? How did the indicators identified in the
qualitative work perform in terms of their statistical association with the benchmark indicators?
What did this mean for indicator development and use?
Since we wanted contemporaneous information from the qualitative and quantitative
sections, the two data collections were launched simultaneously. However, doing so meant that

73
Table 16—Performance of selected alternative indicators of iron insecurity, round 1, late kharif season
Exploration Data Set Confirmation Data Set Double BonferroniIndicator P Se +Sp n P Se +Sp n Winner? Winner?1 1 1 1 2 2 2 2
2 2
Alternative indicators screened in first round testing
High number of female preschoolers, r1 9.57 153 45 0.06 106 75 No NoHigh number of females, r1 4.11 137 45 0.00 96 75 No NoHigh dependency ratio #10, r1 3.91 133 45 1.03 86 75 No NoHigh dependency ratio #3, r1 3.91 133 45 1.03 86 75 No NoHigh dependency ratio #9, r1 3.91 133 45 1.03 86 75 No NoHigh percent of persons incapable of work, r1 3.91 133 45 1.03 86 75 No NoAt least one child sick in past 14 days, r1 8.13 150 45 0.01 102 75 No NoNumber of sick children in past 7 days, r1 6.02 143 45 0.06 106 75 No No
Commonly cited indicators
Low per capita total expenditures (mean of 3 rounds) 0.06 98 43 0.78 87 70 No NoLow per capita food expenditures (mean of 3 rounds) 0.06 98 43 3.67 75 71 No NoHigh food share of total expenditures (mean of 3 rounds) 2.94 129 43 0.25 91 70 No NoForward caste 0.01 107 45 0.86 86 75 No NoBackward caste 0.28 87 45 0.00 102 75 No NoScheduled caste 0.01 107 45 1.00 112 75 No NoHigh household size, r1 2.81 130 45 0.22 108 75 No NoHigh dependency ratio 2 (r1): Number of preschoolers/
total number in household 7.15 143 45 0.00 96 75 No NoHigh dependency ratio 10 (r1): Total number in household/
(total number in household ! number of disabled) 3.91 133 45 1.03 86 75 No NoLow per capita area of agricultural plots controlled by household
(mean of 3 rounds) 0.78 119 39 1.00 85 50 No NoLow per capita sum of cultivated land (mean of 3 rounds) 0.00 109 28 0.02 94 61 No NoLow per capita number of agricultural plots (mean of 3 rounds) 0.76 119 28 0.06 99 46 No No
Notes: Se = SensitivitySp = Specificityr1 = Round 1, late kharif season

74
Table 17—Performance of selected alternative indicators of iron insecurity, round 3, late summer, early kharif
Exploration Data Set Confirmation Data Set Double BonferroniIndicator P Se +Sp n P Se +Sp n Winner? Winner?1 1 1 1 2 2 2 2
2 2
Alternative indicators screened in first round testing
High number of chickens owned 9.63 159 44 0.25 116 70 No No
Other Commonly Cited Indicators
Low per capita total expenditures (mean of 3 rounds) 0.01 105 42 0.02 94 68 No NoLow per capita food expenditures (mean of 3 rounds) 0.01 105 42 0.14 99 69 No NoHigh food share of total expenditures (mean of 3 rounds) 0.85 121 42 0.97 127 68 No NoForward caste 0.09 101 44 0.09 98 72 No NoBackward caste 0.02 91 44 0.02 95 72 No NoScheduled caste 0.00 107 44 0.00 106 72 No NoHigh household size, r3 0.72 121 44 0.34 118 71 No NoHigh dependency ratio 2 (r3): Number of preschoolers/total
number in household 0.13 112 44 0.30 116 71 No NoHigh dependency ratio 10 (r3): Total number in household/
(total number in household ! number of disabled) 0.98 122 44 0.00 117 71 No NoLow per capita area of agricultural plots controlled by household
(mean of 3 rounds) 0.00 108 38 0.00 110 58 No NoLow per capita sum of cultivated land (mean of 3 rounds) 0.23 100 28 0.03 108 45 No NoLow per capita number of agricultural plots controlled by
household (mean of 3 rounds) 0.51 121 38 0.06 96 58 No No
Notes: Se = SensitivitySp = Specificityr1 = Round 1, late kharif season

75
it was not possible to use the information derived from the qualitative work to inform our surveydesign. As such, many indicators suggested by the qualitative work did not appear on the survey
and could not be tested. Some of the "winners" from the qualitative work appeared
coincidentally in the survey and we were able to test them quantitatively. These indicators are
shown in Table 18.
However, of the indicators listed in Table 18 none were found to have a significant
association with chronic household food insecurity. What does this lack of "overlap" betweenthe qualitative and quantitative results mean?
Our primary explanation involves the fact that single indicators were tested in thequantitative analysis. In our qualitative work, however, villagers rarely identified a single reason
for which a household was food insecure, but rather a number of reasons. During the qualitative
exercises, the research team asked the villagers to identify the households that "constantly
struggle to feed their members." They then probed for the reasons why these families were foodinsecure. In every case, the villagers named more than one reason why they thought the
household struggled and, in most cases, it involved two or three reasons. Our ethnographic
reports of families also suggested that it was a combination of factors rather than any single
factor that predisposed a household toward chronic food insecurity. In short, more overlap mightbe found between the two sets of "successful" indicators if combinations of indicators were
tested in the quantitative analysis. A logical way to investigate this idea would be to perform a
stepwise logistic regression, using the core set of quantitative indicators. Once the stepwise was
complete, we could compare the "set" of indicators to that derived in the qualitative results.
A second reason why there might have been little overlap between the qualitative and
quantitative results involves the fact that relatively few successful indicators were identified inthe quantitative study. The low number of identified indicators might at first indicate that there
is little potential for alternative indicators or, at least, for indicators used singly. However,
further statistical tests indicate that most of the statistical tests of indicators reflected relatively
low statistical power at the sample sizes tested. The implication of low power in a hypothesistesting situation is that a statistical test may not reject the null hypothesis (i.e., may not find a
statistical association between an alternative indicator and the benchmark) when, in fact, it
should. In short, a statistical test conducted under conditions of low power may not identify an
alternative indicator as being successful when it truly is.
Power calculations for each one of our two-by-two contingency tables indicate that a vast
majority of the chi-square tests were conducted under conditions of low power. The implicationsof this are clear: We can be relatively sure that the indicators that are identified as "winners" are
indeed good indicators of the benchmarks. However, we cannot be sure that

76
Table 18—Indicators suggested by the Qualitative work that appeared in the survey andwere tested using quantitative performance criteria
Indicators of Household Chronic Food Insecurity Identified by Qualitative Techniques (Reported inChapter Five)
Corresponding Indicator from the Survey, TestedQuantitatively in this Chapter
Poor quality land Number of irrigated plots
Landless Landless
Distress sales of livestock Sold large livestock (since last round)?
Sold medium livestock (since last round)?
Sold small livestock (since last round)?
Distress sales of other valued assets Sold jewelry (since last round)?
Sold house (since last round)?
Sold land (since last round)?
High number of loans from informal sources Number of informal loans
Permanent Laborers Household has a permanent laborer
Few Income earners in a large family Dependency ratio (10 formulations)
Purchase staple grains on a more-than-once-a-week Purchases grain more than once a week
basis
Heavy reliance on wage work Number of members that are casual laborers
Number of members that are agricultural laborers

77
"losers" identified by the same process are truly "losers." Rather, under conditions of largersample sizes, significant associations may have been found.
As a result, we can say very little about the overlap between results generated usingqualitative and quantitative results, since our quantitative results most likely understate the
number of statistically valid alternative indicators. We do know, however, that future analyses
must consider the potential for combinations of alternative indicators and that they must use
sample sizes that make it more likely that statistically significant alternative indicators areidentified.
THE BENEFITS OF TARGETING
In this section, we undertake a number of simulations to illustrate the benefits of using
targeting indicators. Note, however, that the benefits associated with an indicator will vary
according to how it is used to improve the cost-effectiveness of the program. As such, evaluatingthe effectiveness of any given indicator requires a specification of the conditions and context in
which it will be used.
Consider, for example, three different scenarios under which targeting might be used to
improve the efficiency of a program:
1. A fixed-budget scenario: Under this situation, programmers have a fixed budget and canserve a fixed number of participants. Targeting is used to increase the proportion (and
hence absolute number) of truly food-insecure households participating in a program. The
total budget of the program remains fixed, but, relative to the untargeted situation, the
total number of truly food-secure participants rises;
2. A fixed-coverage scenario: Under this situation, programmers use targeting to decrease
the total number of participants in the program while still serving the same number ofhouseholds that are truly food insecure. Relative to an untargeted program, the total
budget of the program decreases, although the total number of truly food-insecure
households that are served remains the same.
3. A variable-benefits scenario: Under this scenario, programmers use targeting to serve the
same number of food-insecure households as in an untargeted intervention, but they
increase the value of goods or services provided to each participant. There is no increasein the overall budget, but the benefit to each food-insecure household rises.
When is it worthwhile to target? In general, if the prevalence of food insecurity is very
high, program leakage in an untargeted program will be fairly small. In this case, mostparticipants will be truly needy and efforts to improve targeting are likely to have a marginal

78
Because the variable benefits scenario is similar to the fixed budget scenario in terms of its24
impact on program leakage, an analysis for this scenario is not presented in Table 19.
benefit. Since there are non-zero costs associated with collecting and acting on targeting data, itis possible for a targeted program to be less cost-effective than an untargeted program.
On the other hand, when the prevalence of food insecurity is relatively low or there is aparticular interest in serving only a small number of the most food insecure in a population, then
targeting indicators may be particularly useful. In this case, an untargeted program would be
likely to have a high proportion of participants who are not truly food insecure and, therefore, a
high degree of program leakage. In general, as the prevalence of food insecurity declines (or theconcern for the most disadvantaged participants increases), the leakage of benefits to those who
are not truly food insecure is likely to increase in an untargeted program. In these cases, the use
of targeting indicators may be quite powerful in reducing program costs and maximizing its
social impact.
Illustrating the Use of Targeting Indicators to Reduce Program Leakage
In this section, each of the indicators identified as "double winners" in the quantitative
analysis are used to illustrate the potential reductions in program leakage that may be achieved
with targeting. Table 19 presents this analysis as a comparison of the benefits of targeting using
alternative indicators with the untargeted case, under both the fixed budget and fixed coveragescenarios. The budgetary implications of targeting are assessed, given assumptions of per24
capita intervention costs of US$10 and a program size of 100,000 participants.
Consider first the fixed-budget scenario. Column 1 of Table 19 shows the percent
increase in the number of true positives included in the program (i.e., truly food-insecure
participants) as a result of using a targeting indicator. Column 2 shows the percent reduction in
the leakage costs after a targeting indicator has been used. This value represents the decrease inmisallocated program resources once the program has been targeted with an alternative indicator.
Note that these calculations include only program costs; no provision is made in this analysis for
the social benefits associated with decreasing food insecurity, a subject which will be treated in
more detail in the section below.
Under the assumption of a fixed program budget, the results from Table 19 show that
targeting with selected alternative indicators increases the number of true positives in thehypothetical program by as much as 26 percent in the case of the indicators of acute preschooler
food insecurity and by as much as 97 percent in the case of vitamin A deficiency (based on data
from round 1). Given the relatively low prevalence of vitamin A deficiency in the population (28
percent) and the resulting high potential leakage from an untargeted

79
Table 19—The benefits from targeting with selected indicators, compared to no targeting
Fixed Budget Scenario Fixed Coverage Scenario Percentage Percentage Percentage Minimum DifferenceIncrease in Reduction in Reduction in Data Costs to
Indicator True Positives Leakage Costs in Budget Equate Net Savingsa
Chronic Household Food InsecurityHouseholds located in Shirapur 36.6 18.6 26.8 68,467High number of preschoolers 31.0 15.7 23.7 99,700Infrequent consumption of meat, r2 50.7 25.7 33.6 0Frequent consumption of fats/oils, r2 37.1 18.8 27.0 66,026Frequent consumption of sugar, r2 33.1 16.8 24.9 87,612Frequent consumption of sorghum, r2 42.2 21.4 29.7 39,836Frequent consumption of sugar, r3 44.2 22.5 30.7 29,712Frequent consumption of fat, r3 41.4 21.0 29.3 43,577
Acute Household Food InsecurityHigh percentage of food consumed from gifts 55.7 16.0 35.8 30,007High number of foods consumed weekly 63.4 18.0 38.8 0Frequent tea with milk consumption, r2 42.6 12.2 29.9 88,983Frequent consumption of sugar, r2 47.0 13.5 32.0 67,945Frequent fat/oil consumption, r2 40.7 11.7 28.9 98,370Frequent wheat consumption, r2 60.3 17.3 37.6 11,659
Acute Preschooler Food InsecurityHousehold did not give gifts, r2 26.3 10.3 20.8 n.a.
Vitamin A Deficiency (round 1)Number of preschoolers 57.9 19.6 36.7 126,667Preschoolers with diarrhea 97.4 33.0 49.3 0
Vitamin A Deficiency (round 2)Number of preschoolers 80.1 20.6 44.5 44,311Preschoolers with diarrhea 95.7 35.0 48.9 0
Based on given assumptions of program size and cost structure and relative to the indicator that is found to produce the greatesta
reduction in the program budget.
n.a. = not applicable.

80
program, the results suggest that large returns may be possible from targeting on the selectedindicators. These returns are the result of improved coverage of the truly food insecure.
The fixed-budget scenario also suggests potentially large reductions in the costs ofprogram leakage. Table 19 indicates that under the given set of assumptions, leakage costs may
be reduced by as much as 35 percent, as in the case of alternative indicators of vitamin A
deficiency.
Columns 3 and 4 of Table 19 illustrate the fixed-coverage scenario. In this scenario,
targeting indicators are used to reduce the number of program participants who are not truly food
insecure and, thereby, reduce the program’s overall budget. Through a reduction in the overallsize of the program, as reported in column 3, targeting can result in program savings of between
21 percent (in the case of acute preschooler food insecurity) and 49 percent (in the case of
vitamin A deficiency, round 1).
Given this set of program conditions, the results in Table 19 suggest that certain indicators
can out-perform others in reducing program leakage. Recall, however, that the correct criteria
for selecting targeting indicators is the size of the program savings net of data collection costs. The fourth column in Table 19 illustrates how data collection costs might inform the choice of
one indicator over another. This column shows the minimum difference in data collection costs
that would allow the indicator to be more cost-effective than the most successful indicator for
each benchmark analysis (i.e., the indicator that provides the highest program savings for eachbenchmark analysis).
Consider the case of chronic household food insecurity. In this simulation, the indicatorof "infrequent meat consumption" resulted in the greatest total reduction in program costs across
all the alternative "double winners" tested. Using this indicator, program savings were 33.6
percent of the assumed budget of US$1 million, or US$336,435 (see column 3 of Table 19) .
The next greatest reduction in program costs are obtained by targeting on the indicator "frequentconsumption of sugar (r3)." Targeting with this indicator results in a savings of nearly 31
percent, or US$306,723. Column 4 shows the minimum difference in data costs that would
equate the savings achieved using the two indicators (i.e., that would make us indifferent
between the two indicators). For this case, the difference is $29,712. This indicates that thesavings achieved using the sugar variable would be greater than the meat variable, as long as the
sugar variable costs at least $29,712 less to collect. After this point, the meat variable is more
cost-efficient.
If, however, the cost of collecting the two indicators were equal, then the "infrequent
consumption of meat (r2)" indicator would always be preferred for targeting programs designed
to address chronic household food insecurity. Column 4 contains similar comparisons for all thealternative "double winners" identified in the study. For example, the "frequent consumption of

81
Note that It is possible to control for social costs by comparing the performance of25
indicators at varying cutoffs that equate the number of false negatives produced by each indicator.In this case, the social costs of food insecurity are equal for each indicator and comparisons ofindicator performance can be made solely on the basis of program costs. The reasons for presentinga comparison of indicators at a fixed cutoff are presented in Section 3.
The same analysis may be done on an actual program if these figures are available.26
sorghum (r2)" indicator would be preferred only if the costs of data collection were at leastUS$39,836 less than that of the meat consumption indicator.
These examples are presented to underscore the fact that the appropriate criterion forindicator selection is savings net of data collection costs. Note, however, that the results in
column 4 are artifacts of the assumptions regarding program size and costs that were adopted for
this particular scenario. Varying the assumptions and matching them to the actual cost structure
of a program is likely to change the relative performance of these indicators and the ultimatechoice of the optimal indicator to use for targeting purposes.
Accounting for the Social Cost of Food Insecurity
The results in the previous section describe how targeting can reduce program leakage and
thus decrease program costs. These analyses, however, are silent on the issue of social costs.
Ideally, the choice of a targeting indicator should account for an indicator's ability to minimizethe social cost of food insecurity. More specifically, food aid programmers would choose
indicators that minimize the program and social costs, net of data costs.
Although it is difficult to determine a value for the social cost of food insecurity, it is
possible to identify a range of social costs over which one indicator might out-perform another.
In this case, selecting an indicator boils down to determining whether a given range of social
costs for one indicator is more realistic than those associated with another indicator. This25
assessment is not straightforward and it may not be always possible to identify a single-best
indicator for targeting purposes. It may be possible, however, to identify a set of preferred
indicators. An indicator in this preferred set can produce significant reductions in program and
social costs relative to the untargeted case.
To illustrate how the social costs of food insecurity might enter into the selection of a
targeting indicator, we undertake a targeting simulation (see Table 20). For this exercise, wemust make assumptions about the program, considering the targeting variables. We will assume
a program size, a per capita intervention cost, and the cost of collecting each alternative
indicator. In this example, programmers are seeking an alternative indicator to identify26
chronically food-insecure households. The exercise assumes a program with a population of
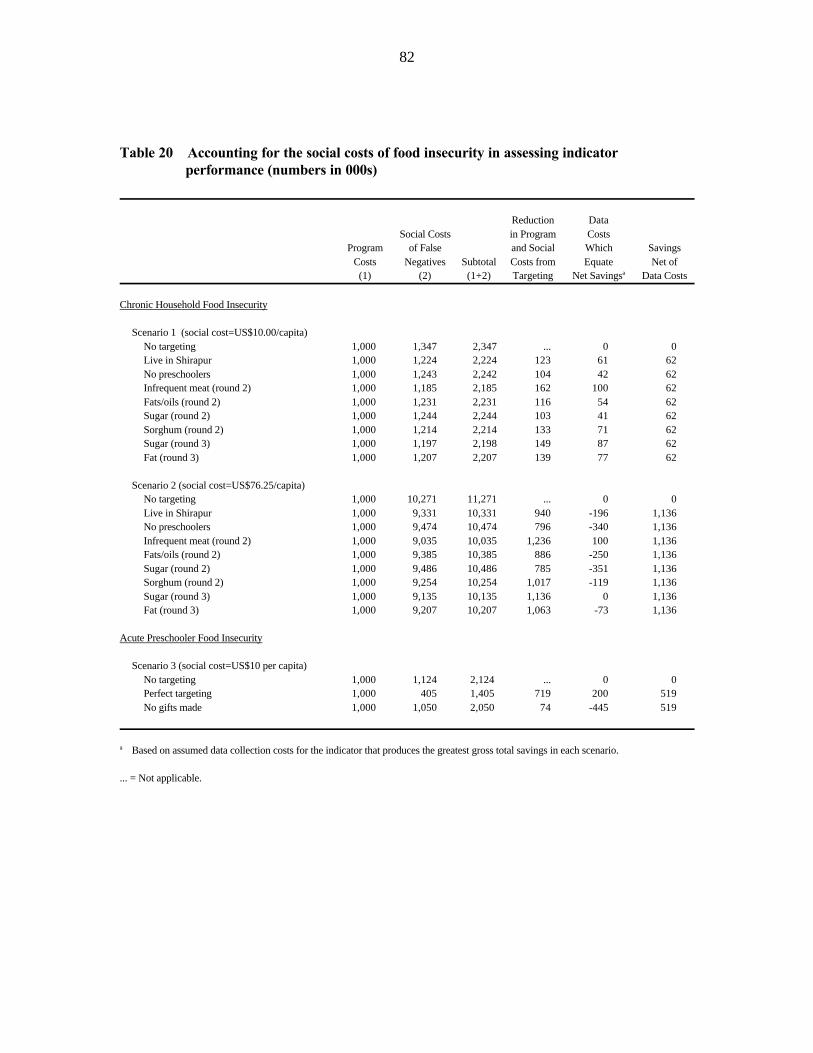
82
Table 20—Accounting for the social costs of food insecurity in assessing indicatorperformance (numbers in 000s)
Reduction DataSocial Costs in Program Costs
Program of False and Social Which SavingsCosts Negatives Subtotal Costs from Equate Net of(1) (2) (1+2) Targeting Net Savings Data Costsa
Chronic Household Food Insecurity
Scenario 1 (social cost=US$10.00/capita)No targeting 1,000 1,347 2,347 ... 0 0Live in Shirapur 1,000 1,224 2,224 123 61 62No preschoolers 1,000 1,243 2,242 104 42 62Infrequent meat (round 2) 1,000 1,185 2,185 162 100 62Fats/oils (round 2) 1,000 1,231 2,231 116 54 62Sugar (round 2) 1,000 1,244 2,244 103 41 62Sorghum (round 2) 1,000 1,214 2,214 133 71 62Sugar (round 3) 1,000 1,197 2,198 149 87 62Fat (round 3) 1,000 1,207 2,207 139 77 62
Scenario 2 (social cost=US$76.25/capita)No targeting 1,000 10,271 11,271 ... 0 0Live in Shirapur 1,000 9,331 10,331 940 -196 1,136No preschoolers 1,000 9,474 10,474 796 -340 1,136Infrequent meat (round 2) 1,000 9,035 10,035 1,236 100 1,136Fats/oils (round 2) 1,000 9,385 10,385 886 -250 1,136Sugar (round 2) 1,000 9,486 10,486 785 -351 1,136Sorghum (round 2) 1,000 9,254 10,254 1,017 -119 1,136Sugar (round 3) 1,000 9,135 10,135 1,136 0 1,136Fat (round 3) 1,000 9,207 10,207 1,063 -73 1,136
Acute Preschooler Food Insecurity
Scenario 3 (social cost=US$10 per capita)No targeting 1,000 1,124 2,124 ... 0 0Perfect targeting 1,000 405 1,405 719 200 519No gifts made 1,000 1,050 2,050 74 -445 519
Based on assumed data collection costs for the indicator that produces the greatest gross total savings in each scenario.a
... = Not applicable.
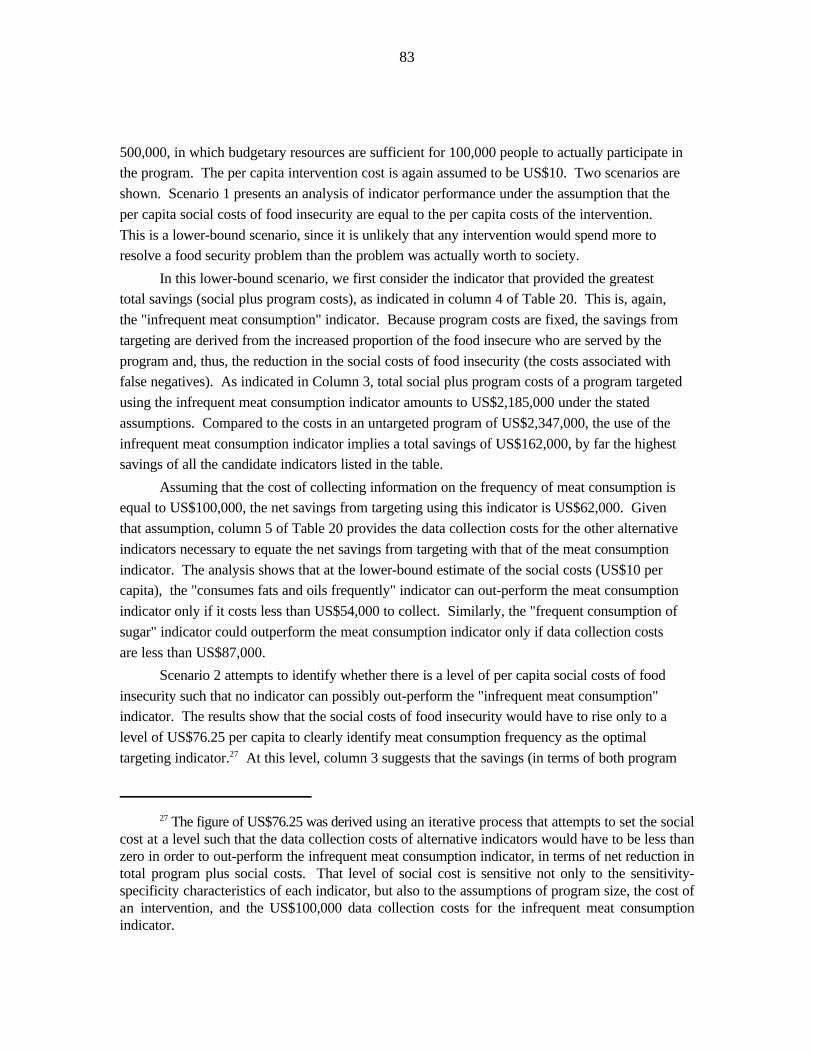
83
The figure of US$76.25 was derived using an iterative process that attempts to set the social27
cost at a level such that the data collection costs of alternative indicators would have to be less thanzero in order to out-perform the infrequent meat consumption indicator, in terms of net reduction intotal program plus social costs. That level of social cost is sensitive not only to the sensitivity-specificity characteristics of each indicator, but also to the assumptions of program size, the cost ofan intervention, and the US$100,000 data collection costs for the infrequent meat consumptionindicator.
500,000, in which budgetary resources are sufficient for 100,000 people to actually participate inthe program. The per capita intervention cost is again assumed to be US$10. Two scenarios are
shown. Scenario 1 presents an analysis of indicator performance under the assumption that the
per capita social costs of food insecurity are equal to the per capita costs of the intervention.
This is a lower-bound scenario, since it is unlikely that any intervention would spend more toresolve a food security problem than the problem was actually worth to society.
In this lower-bound scenario, we first consider the indicator that provided the greatesttotal savings (social plus program costs), as indicated in column 4 of Table 20. This is, again,
the "infrequent meat consumption" indicator. Because program costs are fixed, the savings from
targeting are derived from the increased proportion of the food insecure who are served by the
program and, thus, the reduction in the social costs of food insecurity (the costs associated withfalse negatives). As indicated in Column 3, total social plus program costs of a program targeted
using the infrequent meat consumption indicator amounts to US$2,185,000 under the stated
assumptions. Compared to the costs in an untargeted program of US$2,347,000, the use of the
infrequent meat consumption indicator implies a total savings of US$162,000, by far the highestsavings of all the candidate indicators listed in the table.
Assuming that the cost of collecting information on the frequency of meat consumption isequal to US$100,000, the net savings from targeting using this indicator is US$62,000. Given
that assumption, column 5 of Table 20 provides the data collection costs for the other alternative
indicators necessary to equate the net savings from targeting with that of the meat consumption
indicator. The analysis shows that at the lower-bound estimate of the social costs (US$10 percapita), the "consumes fats and oils frequently" indicator can out-perform the meat consumption
indicator only if it costs less than US$54,000 to collect. Similarly, the "frequent consumption of
sugar" indicator could outperform the meat consumption indicator only if data collection costs
are less than US$87,000.
Scenario 2 attempts to identify whether there is a level of per capita social costs of food
insecurity such that no indicator can possibly out-perform the "infrequent meat consumption"indicator. The results show that the social costs of food insecurity would have to rise only to a
level of US$76.25 per capita to clearly identify meat consumption frequency as the optimal
targeting indicator. At this level, column 3 suggests that the savings (in terms of both program27

84
Note that use of the term "perfect targeting" is not intended to deny the possibility of28
measurement error in the direct, benchmark indicator, only to imply that benchmark is presumablythe best possible measure of the food security dimension of concern and the standard against whichthe performance of other indicators are compared. The results reported in Table 20 suggest that thebenchmark indicator would likely be preferable to alternatives, even in the case of fairly significantmeasurement error.
and social costs) from targeting on the meat consumption indicator would rise to US$1,236,000compared to the no-targeting case. Again, the next greatest reduction in total costs could be
obtained by targeting on the "frequent consumption of sugar (r3)" indicator, which would result
in a savings of US$1,136,000. In this case, the difference in savings across the two indicators is
US$100,000.
Under the assumption that data collection costs for the "infrequent consumption of meat"
indicator are US$100,000, it is impossible for the "frequent sugar consumption" indicator or anyother indicator to provide a greater net savings. To do so, given the various assumptions under
this scenario, data collection costs for the sugar consumption indicator would have to be zero. In
this example, if the per capita social costs of food insecurity were thought to be US$76.25 or
higher, the "infrequent consumption of meat" would be the optimal indicator.
If it is determined that the social costs of food insecurity are lower than the critical value
of US$76.25, then there may not be a clear choice of indicators. It is important to recognize,however, that there are still benefits to be derived from targeting on any of a number of
indicators. Even under assumptions of minimum social costs described in Scenario 1, it is clear
that a number of indicators can provide some degree of net savings and that the impact of
targeting using any one indicator may still be positive.
Comparisons to "Perfect Targeting"
As stated previously, the use of the "gold standard" or benchmark indicator in selecting
candidates for program participation represents a case of "perfect targeting." The search for28
alternative indicators for targeting purposes is therefore justified only if the benchmark indicators
of food insecurity are considered to be unreliable or too costly to use in an operational context. An indicator, for example, might be considered unreliable if it is subject to a strategic bias in the
responses by those who perceive that some benefit might accrue to them if they misrepresent
their personal information. Alternatively, the costs of collecting a "gold standard" indicator may
be too high in the context of any given program to warrant its use as a screening tool.
In the latter case, where concerns are primarily cost-related, the performance of alternative
indicators should be evaluated vis-à-vis the performance of the benchmark itself, in addition tocomparisons to the no-targeting scenario. It is possible that, in spite of fairly high data collection
costs, use of the benchmark indicator may still prove more cost-effective than any alternative.
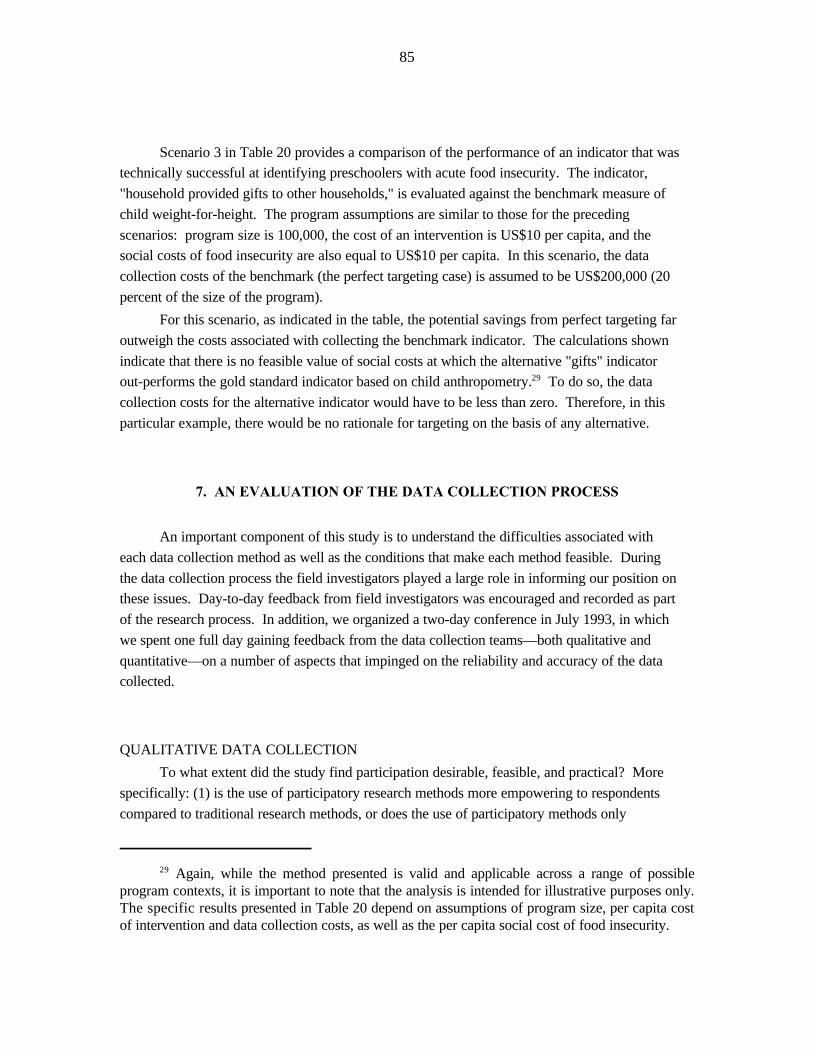
85
Again, while the method presented is valid and applicable across a range of possible29
program contexts, it is important to note that the analysis is intended for illustrative purposes only.The specific results presented in Table 20 depend on assumptions of program size, per capita costof intervention and data collection costs, as well as the per capita social cost of food insecurity.
Scenario 3 in Table 20 provides a comparison of the performance of an indicator that wastechnically successful at identifying preschoolers with acute food insecurity. The indicator,
"household provided gifts to other households," is evaluated against the benchmark measure of
child weight-for-height. The program assumptions are similar to those for the preceding
scenarios: program size is 100,000, the cost of an intervention is US$10 per capita, and thesocial costs of food insecurity are also equal to US$10 per capita. In this scenario, the data
collection costs of the benchmark (the perfect targeting case) is assumed to be US$200,000 (20
percent of the size of the program).
For this scenario, as indicated in the table, the potential savings from perfect targeting far
outweigh the costs associated with collecting the benchmark indicator. The calculations shown
indicate that there is no feasible value of social costs at which the alternative "gifts" indicatorout-performs the gold standard indicator based on child anthropometry. To do so, the data29
collection costs for the alternative indicator would have to be less than zero. Therefore, in this
particular example, there would be no rationale for targeting on the basis of any alternative.
7. AN EVALUATION OF THE DATA COLLECTION PROCESS
An important component of this study is to understand the difficulties associated with
each data collection method as well as the conditions that make each method feasible. During
the data collection process the field investigators played a large role in informing our position onthese issues. Day-to-day feedback from field investigators was encouraged and recorded as part
of the research process. In addition, we organized a two-day conference in July 1993, in which
we spent one full day gaining feedback from the data collection teams—both qualitative and
quantitative—on a number of aspects that impinged on the reliability and accuracy of the datacollected.
QUALITATIVE DATA COLLECTION
To what extent did the study find participation desirable, feasible, and practical? More
specifically: (1) is the use of participatory research methods more empowering to respondents
compared to traditional research methods, or does the use of participatory methods only

86
empower the researchers?, and (2) can research can be designed to incorporate local knowledge,share information, let respondents benefit from our findings, and generally improve the quality of
policy and program conclusions?
Did Participation Empower the Villagers?
Despite our best efforts, we have to conclude that the participatory research methods used
in our study were no more empowering for the villagers than our survey methods. In this sense,the participatory methods we used are more accurately described as qualitative rather than truly
participatory.
The participatory methods, however, did help to establish rapport with the villagers
quickly. They were far more interactive than the survey, and lent themselves more naturally to a
dialogue between respondents and researchers, rather than simple question and answer sessions.
In addition, the villagers widely agreed that the participatory methods (they called them "games")were of more interest than the survey data collection methods. Most villagers appreciated the
transparency of the visual representations, as well as the opportunity to express themselves
creatively through group activities (such as the village map and the food charts).
While certain definitions were not always determined by local people (e.g., "energy
expenditure" and "very high risk families"), the concepts needed for the project exercises were
adapted for local needs. For example, the local way of expressing percentages in terms of thenumber of paise in a rupee was frequently used. Open-ended discussions allowed researchers to
gain a better understanding of how emic (locally defined) perceptions differed from etic (defined
by outsiders) ones. However, we felt that respondents still provided information on the
researchers' terms, most often using the researchers' concepts expressed in local language. It isfor these reasons that we feel that the methods we used were no more participatory than the
survey methods employed. If there is a need to distinguish this type of data collection from the
survey, they are more accurately described as qualitative rather than participatory.
In some instances, however, the potential for nutrition education, community monitoring,
and community intervention was clear. The visual representations typical of participatory
methods gave the villagers the opportunity to reflect on the facilities available in theirneighborhoods, on the diversity of their diet, and the seasonality of village phenomena. Some
villagers were astonished by their own food charts; they had not imagined they ate so many kinds
of foods. Some spontaneously asked, "Are we eating OK? What should we eat?" These
experiences indicate that participatory methods carry great potential for starting an educationaldialogue on nutrition.

87
Feasibility: Problems with Participatory Approaches in the Context of Research
The participatory methods were not without their special problems. As these methods are
meant to elicit participation in group discussions about village problems, they tend to raiseexpectations that the research group will initiate a village development program. Questions that
seem simple in the office, such as "Who in this village is hungry?" were difficult to ask (let alone
answer) in the field as they carried political and economic implications for the villagers.
Even when investigators made it clear that they were not initiating a development
program, the perception that benefits might accrue to "the food insecure" created an incentive to
misinform investigators and bias responses. For example, the potential for receiving benefitsproduced apprehension in some women's groups as to whether or not identify certain households
as food insecure. This exercise often led to responses such as "Who isn't?" or "Everyone"!
During the participatory exercises we also faced the dilemma of facilitating the
participation of different caste groups and women, while not alienating dominant groups. We
found that this dilemma could be resolved to some extent by dealing separately with different
sections of the village as divided on caste lines. Even within families, however, it was difficultto obtain equal participation of all members. In certain households, men insisted on overriding
their wives' responses. In other households, mothers-in-law gave all the responses even though
their daughters-in-law were the cooks.
We noted that participatory methods are not necessarily rapid. Time is needed for
establishing rapport, playing with children, helping with chores, sensitivity in broaching
confidential topics, and in encouraging responses from shy or reluctant villagers. We found thateach household exercise took over an hour to complete (equal approximately to conducting a diet
survey) and the group exercises took approximately 2.5 hours. However, participatory data are
more transparent and less likely to require extensive computer entry and analysis.
The adaptation of participatory methods for research in the area of food security is
relatively new. Our experiences indicate that the participatory methods are more flexible than
survey methods, more respectful to local knowledge, and quicker for establishing rapportbetween investigators and villagers. Our participatory methods did not save us much time in the
field, but did save time in data entry and analysis. In addition, our participatory methods
provided us with a means of obtaining a broad overview of village-level phenomena in situations
where the research team is new to a village.
Finally, it should be noted that the quality of the participatory exercises rely heavily on the
skills of individuals facilitating the exercises. Staff members must have a keen understanding ofthe objectives of the participatory exercise and how to elicit this information from villagers.
They must be able to think on their feet and probe for clarifying answers. Furthermore, to make
the process truly participatory investigators must be given the opportunity to follow up research
plans with action plans designed by the participants.
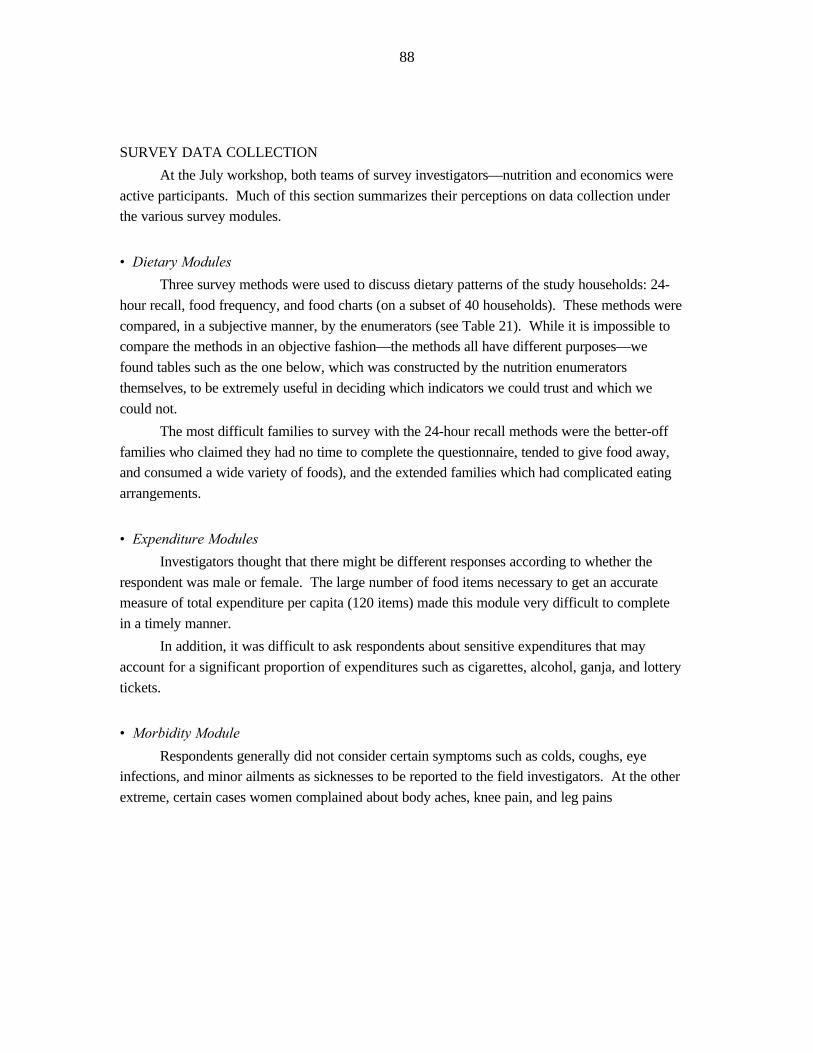
88
SURVEY DATA COLLECTION
At the July workshop, both teams of survey investigators—nutrition and economics were
active participants. Much of this section summarizes their perceptions on data collection underthe various survey modules.
• Dietary Modules
Three survey methods were used to discuss dietary patterns of the study households: 24-
hour recall, food frequency, and food charts (on a subset of 40 households). These methods were
compared, in a subjective manner, by the enumerators (see Table 21). While it is impossible tocompare the methods in an objective fashion—the methods all have different purposes—we
found tables such as the one below, which was constructed by the nutrition enumerators
themselves, to be extremely useful in deciding which indicators we could trust and which we
could not.
The most difficult families to survey with the 24-hour recall methods were the better-off
families who claimed they had no time to complete the questionnaire, tended to give food away,and consumed a wide variety of foods), and the extended families which had complicated eating
arrangements.
• Expenditure Modules
Investigators thought that there might be different responses according to whether the
respondent was male or female. The large number of food items necessary to get an accuratemeasure of total expenditure per capita (120 items) made this module very difficult to complete
in a timely manner.
In addition, it was difficult to ask respondents about sensitive expenditures that may
account for a significant proportion of expenditures such as cigarettes, alcohol, ganja, and lottery
tickets.
• Morbidity Module
Respondents generally did not consider certain symptoms such as colds, coughs, eyeinfections, and minor ailments as sicknesses to be reported to the field investigators. At the other
extreme, certain cases women complained about body aches, knee pain, and leg pains
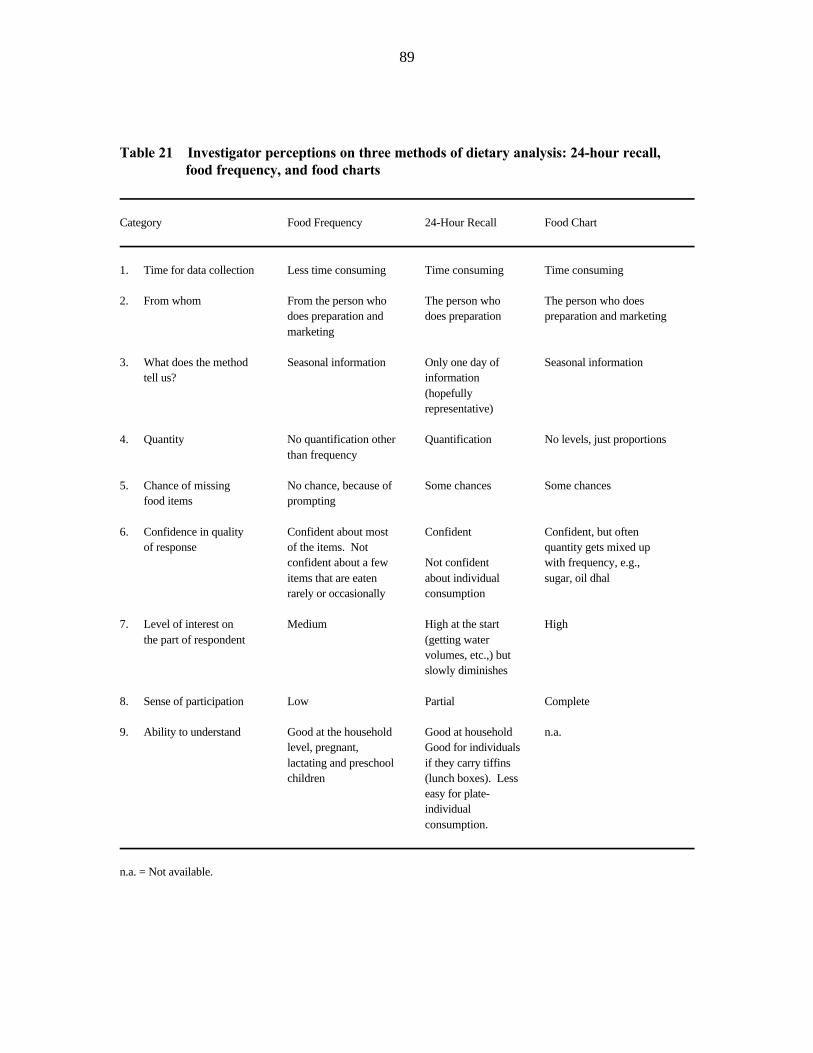
89
Table 21—Investigator perceptions on three methods of dietary analysis: 24-hour recall,food frequency, and food charts
Category Food Frequency 24-Hour Recall Food Chart
1. Time for data collection Less time consuming Time consuming Time consuming
2. From whom From the person who The person who The person who doesdoes preparation and does preparation preparation and marketingmarketing
3. What does the method Seasonal information Only one day of Seasonal informationtell us? information
(hopefullyrepresentative)
4. Quantity No quantification other Quantification No levels, just proportionsthan frequency
5. Chance of missing No chance, because of Some chances Some chancesfood items prompting
6. Confidence in quality Confident about most Confident Confident, but oftenof response of the items. Not quantity gets mixed up
confident about a few Not confident with frequency, e.g.,items that are eaten about individual sugar, oil dhalrarely or occasionally consumption
7. Level of interest on Medium High at the start Highthe part of respondent (getting water
volumes, etc.,) butslowly diminishes
8. Sense of participation Low Partial Complete
9. Ability to understand Good at the household Good at household n.a.level, pregnant, Good for individualslactating and preschool if they carry tiffinschildren (lunch boxes). Less
easy for plate-individualconsumption.
n.a. = Not available.

90
that had been on-going for at least ten years. In certain cases women were reluctant to discussgynecological problems. Finally, note that disease and symptom terminology differed from
village to village.
• Breast-feeding Module
In this module none of the questions were particularly difficult for the respondents to
understand, and they gave confident answers. Probing was necessary on two questions inparticular: (1) At what age did you start to give the child anything other than breast milk? and
(2) At what age did you start to give adult foods?
It was easy for the mother to list the names of weaning foods given to the child during the
weaning period.
• Questions about Perceptions Related to Food Security
This module was included to give a more qualitative feel to the survey, and to induce more
answers on own-perceptions of hunger and food security. Some of the questions werestraightforward for respondents to answer: number of meals adult has per day, number of meals
preschool child has per day, etc.
Some questions proved difficult to administer. Table 22 highlights the problem questions.
8. LESSONS LEARNED FROM THIS STUDY
This study presented two distinct methods for developing alternative indicators of foodinsecurity. In this section, we discuss our experience with these methods and the implications for
use of each method by various organizations. Issues of process, program objectives, and
available resources are discussed in the context of choosing a methodology for developing
alternative indicators.
1. Qualitative Methods Are a Viable Tool at the Community Level.
Our work with qualitative methods suggest that they are a promising tool for small-scale
organizations that do not have the human or financial capacity to engage in large-scale indicator
development exercises. Indicators suggested through qualitative techniques, however, are not
generalizable beyond the communities in which they are developed. Our qualitative experiencesuggests that many indicators represent coping strategies that are very location-specific; as such

91
Table 22—Problem questions on the food security perceptions module
Question Problem
1. If you had an extra Rs 100, what would you buy Respondents do not understand where the Rs 100 appearsmore of? from.
2. Which three foods would your family like to eat Respondents interrupt to say that they have no preferences,more of? no money, and they eat whatever they have to eat.
3. Does your family keep poor health due to a lack Was easier for respondents to understand if we ask theof healthy foods? same question, but in a positive sense, i.e., do you think
"healthy" foods are important in maintaining good health?
4. How many days supply of basic food do you A large number of days stock is misleading if the basichave? food is consumed with less frequency than the most basic
staple; e.g., a 50-day wheat store might lead to the incorrectconclusion that the family is food insecure when theysimply do not eat wheat very often.
an in-depth understanding of the local culture is needed to identify and interpret any given
indicator.
The location-specificity of these indicators is not likely to be a problem for small-scale
nongovernment organizations that have long-term commitments to certain communities. We
believe that these organizations can (and do) use many of the same types of participatory
exercises we used, as well as the more traditional ethnographic methods to develop community-specific indicators. In addition, organizations will be able to develop new participatory methods
that specifically meet their needs. In general, however, more attention needs to be paid to
particular combinations of indicators that are strong indicators of food insecurity. Our study did
not investigate locally determined combinations, but we anticipate that they would be much morevaluable than single indicators.
If indicators are identified in a qualitative fashion they can be validated over time using anNGOs "inside knowledge" of the community as well as the community's assessment of how the
indicator is working to target the food insecure. Given the location-specific nature of indicators
it is unlikely that "successful" indicators can be shared with other organizations without some
sort of validation (quantitative or qualitative) in the new location.
The qualitative methods we used to gather information about food security conditions
were simple and feasible at the community level. They did not require large amounts of dataentry and data analysis time. They will require adjustments for each new situation, however. In

92
addition these methods require investigators with solid training in ethnographic/participatorymethods. Investigators must have the capability to leave behind preconceived notions regarding
food security relationships. They must learn about community perceptions about food security
and observe patterns within the community. The skills necessary for this work were difficult to
glean from traditional resumes; but they became more obvious once we worked with individualsin the field. Although it is desirable to have investigators with prior experience in participatory
methods it is also possible to train a group of candidates in these methods and then choose the
ones that show the most promise during the field training exercises.
2. Quantitative Studies Are Feasible for Programmers in the Field, But ProgrammersNeed to Be Wary of Sample Size Issues.
Our chosen method to screen and test the alternative indicators was simple enough for a
well-trained research analyst (or statistician) to carry out in-country. The most time consuming
areas were (1) the determination of the most appropriate analytical method and (2) the data
cleaning. If clean secondary data are available (e.g., national census or DHS survey withbenchmark indicators) then it is feasible for staff analysts to undertake the same statistical tests
of association that we did. If, however, it is necessary to mount a data collection and cleaning
effort more personnel and funds will be needed. To the extent that indicator development
exercises can be linked to the baseline data collection of a program's monitoring and evaluationsystem there may be opportunities to defray the costs of indicator development.
The methods we used were relatively straightforward for identifying statistical associationbetween the candidate indicator and the benchmark. Nevertheless we found that issues of sample
size were important enough to render many of our tests of association statistically powerless.
Our survey, however, was not a small one; the total sample of 300 households represented over
17 percent of the total number of households in the four villages and included over 300households. As such, we recommend the quantitative methodology for organizations that have
access to large data sets (i.e.,. at least 500 observations and probably more) from the appropriate
population. These data sets are more likely to offer adequate power to determine significant
associations between the alternatives and the benchmarks (if they indeed exist).
This recommendation indicates that small-scale organizations may encounter analytical
problems if they attempt the quantitative method we report here. It also means that large "top-down" organizations (with sufficient human resources and relatively large program mandates
and data sets) are more likely to adopt this method with success.
Our recommendation is also based on the experience we had with this particular data set.
In theory, sample size calculations can be carried out at the outset of any indicator study.
However, it is difficult to make estimates of the variables needed for this calculation. Sample
size calculations require estimates of proportion sizes as well as some indication of what

93
difference in proportion is meaningful. For certain analytical problems (particularly medicalones), there is a good theoretical basis for estimating the size of certain proportions and the
difference between proportions that is (biologically) important. With social science indicators,
these proportions are difficult to predict and difficult to attach meaning to the size of the
difference in proportions. As such, accurate sample size calculations are difficult to achieve withthese data.
A priori there is no reason to believe that data from other populations will behavesimilarly to the data represented in this study. Therefore, a sensible option for those with
secondary data sets is to do the quantitative analysis and check whether there is sufficient power
to determine if a nonsignificant finding is indeed a nonrelationship between the alternative and
benchmark. This is the procedure we followed and we found that we did not have adequatepower to test several of our indicators. This, however, does not invalidate the relationships we
did find. It only tells us that we do not know whether an indicator "lost" because (1) it is truly
not a good indicator or (2) it did not get a fair statistical test. The same indicator may indeed be
a "winner" using a larger sample taken from the same population.
3. Does the Lack of Correspondence Between the Qualitative and Quantitative ResultsMean that the Suggested Indicators Are Not Valid?
Our experimentation with quantitative and qualitative methods for indicator development
indicated that there was little overlap between the results derived from each method. Does it
mean that one method failed and the other one succeeded?
We believe that this particular experience should not be seen as a failure of either method.
Rather problems with sample size in the quantitative survey and our inability to follow-upqualitatively on the role of combination indicators made it difficult to directly compare the
results from each method.
Does it mean that the indicators suggested by the quantitative or qualitative method are
not valid? No, it only means that we did not have enough statistical power (determined largely
by sample size) to properly test many of the indicators suggested by the qualitative study. Some
may have been validated statistically if the survey had been larger. On the other hand, some maynot have been validated and this might mean that villagers' and researchers' have different
perceptions about what food security really means. In either case this study in its present form
cannot answer this question.

94
4. Qualitative and Quantitative Methods Are Complementary for Selecting AlternativeIndicators.
The above recommendations are not meant to imply a lack of complementarity betweenthe two methods. Admittedly small-scale projects may not find the quantitative method we
suggested to be useful. However, with larger "top-down" projects there are many opportunities
to combine the use of qualitative and quantitative techniques that will improve the reliability of
the alternative indicators. Since this was a study of methods, we ran the qualitative andquantitative sections simultaneously. However, this need not be the case for a true indicator
development exercise. Specifically, qualitative techniques may first be used to narrow down the
list of candidate indicators. The quantitative analysis can follow, and the results may be
validated using qualitative techniques in the field. Qualitative techniques may also be used in theinterpretation of indicators that arise from the qualitative analysis. Our experience indicates that
a keen understanding of the local context is important for the interpretation of indicators
suggested by the quantitative analysis.
5. Combinations of Alternative Indicators May Be Necessary to Improve the Ability ofAlternatives to Proxy for Benchmark Indicators.
As stated above, our experience indicates that combinations of indicators may be
necessary to improve the performance of alternative indicators. More specifically, using
indicators in combination rather than singly might tighten the relationship between groups of
alternative indicators and the benchmark indicator.
This suggestion comes primarily from our ethnographic observations. In most cases we
found households to be food insecure when there were a combination of disadvantaging factors. However, due to lack of time and resources we have not explored the possibility of combinations
in this analysis. Nevertheless, this avenue holds the greatest potential for increasing the
performance of the alternative indicators. Future research efforts should address this possibility,
keeping in mind that simplicity is the key to a successful targeting program on the ground. Thenumber of "combined" indicators should not overly burden field personnel when they are
carrying out the targeting.
6. Simple Indicators with Modest Association with the Benchmark Indicator ShowedProgram Savings.
Simulations using the indicators identified in the quantitative study showed that indicatorswith significant associations with the benchmark also produced substantial savings in terms of
program costs. Alternative indicators that are feasible for use in the field can therefore reduce
program leakages. The examples also indicate that the program savings can be quite substantial.
We note however, that the correct criteria for indicator selection include (1) an estimate of the

95
social costs and benefits of the intervention and (2) the relative cost of collecting the alternativeand the benchmark. These net costs will vary according to each targeting situation. We
underscore that program costs are not the only cost-related issues at stake. Rather, the costs of
data collection and of making targeting "mistakes" must also be taken into account.
7. Qualitative Methods Are No More Participatory than Quantitative Methods if NoAction Agenda Is Planned.
Finally, we must add that despite our best intentions the research-based participatory
methods we used were no more empowering for the villagers than our survey methods. This is
more a testament to the objective of pursuing a predetermined research agenda rather than a
failure of participatory methods per se. Our experience leads us to believe that qualitativetechniques are truly participatory when employed with action-orientation interventions.
9. CONCLUSIONS AND NEXT STEPS
The objective of this report has been to present two different methods to identifyalternative indicators of chronic and acute food insecurity. A need for alternative indicators
exists since many benchmark indicators (such as household income or dietary intake) are often
too cumbersome to be of practical use in food aid targeting.
This study used data collected in four villages in the Indian Semi-Arid Tropics as way to
illustrate two methods for identifying alternative indicators. Because the data were collected in
only four villages it is unlikely that the results are generalizable to all of India or even the IndianSemi-Arid Tropics. With this caveat in mind the emphasis of this report is placed on our
experiences with the methods. Given that the results are likely to be location and context-
specific, less emphasis is placed on the indicators themselves.
The results from this study indicate that targeting with alternative indicators may be
viable at the household and individual levels. Our experience also suggests that the method of
indicator selection will vary according to the resources and objectives of the targetingorganization. For example, targeting at the household and individual level is likely to be a
component of an NGO's programming activities. Given that (1) NGOs often work intensively in
a limited number of communities and that (2) financial and human resources are generally
limited, the qualitative method appears to be the most viable option for these organizations. Fororganizations that plan to carry out a more centralized form of targeting, such as governments,
large-scale NGOs, or international organizations, a combination of qualitative and quantitative
methods might be more appropriate. Programmers in these organizations tend to have access to

96
large data bases for their area of concern as well as the human resources to coordinate aquantitative study.
There are advantages and disadvantages to each method chosen. The qualitative methodrequires less time for analysis, but does require staff with special talents for interpreting
qualitative information. Results, however, are not generalizable and are thus very location-
specific. The quantitative method requires staff with statistical skills as well as access to a large
data bases that will increase the probability of sufficient power for tests of statistical association. The results from quantitative studies are more generalizable to similar populations, but can be
puzzling if little is known about the program areas. As such, a combination of qualitative and
quantitative methods is recommended even when the primary data collection exercise is a
quantitative one.
SUGGESTED AREAS FOR FUTURE INVESTIGATION
1. Validate the quantitative methods developed here with a larger data set that provides moreobservations and hence more statistical power to test the alternative indicators.
Our work was limited analytically by the lack of adequate power for our statisticaltests. The same method should be attempted on a large data set to see if a more consistent
set of indicators is derived across seasons and across different formulations of the same
indicator.
2. Explore the power of combination indicators using the quantitative method.
This exercise is a natural "next step" in determining the real usefulness ofalternative indicators. Combinations are postulated to "tighten" the relationship between
the alternatives and the benchmarks and therefore illustrate the possibilities for using
combination indicators for targeting purposes.
3. Explore the relationship between indicators derived from the qualitative methods and
those derived from the quantitative method (that demonstrate sufficient power).
The lack of sample size rendered many of the statistical tests powerless to
determine the strength of the relationship between an alternative and a benchmark.
Conducting the same type of comparison between quantitative and qualitative results will
give researchers an idea whether there is a convergence between local perceptionsregarding food insecurity and perceptions of the research community.

97
4. Explore the relationship between alternative indicators and indicators taken from theconventional poverty literature (per capita expenditures, per capita food expenditures, and
the share of total budget spent on food).
Lack of power made it difficult for us to assess the strength of an alternative
indicator relative to more conventional poverty indicators. Nevertheless, this result is
consistent with the body of research that suggests that the mapping of poverty into food
insecurity is complex (Bouis and Haddad 1992).
5. Explore the robustness of alternative indicators over time and across different indicator
formulations. Again, lack of power made it difficult to assess these relationships. A
validation of these indicators is important over time, particularly in areas characterized byseasonality.

REFERENCES
ACC/SCN (Administrative Committee on Coordination–Sub-Committee on Nutrition). 1992. Second report on the world nutrition situation. Volume I, Global and regional results.
Geneva: UN ACC/SCN.
Asokan, M., V. Bhasker Rao, and Y. Mohan Rao. 1991. Agroeconomic profile of selected
villages in Mahbubnagar Region of Andhra Pradesh. International Crops Research
Institute for the Semi-Arid Tropics, Economics Group, Resource Management Program,
VLS Series, Patancheru, India.
Baker, J., and M. Grosh. 1994. Measuring the effects of geographic targeting on povertyreduction. LSMS Working Paper 99. Washington, D.C.: World Bank.
Bapna, S. 1991. Reaching the rural poor: India's experience with the public distribution of
foodgrains. Food and Nutrition Bulletin 13 (3): 230-240.
Behrman, J. 1987. Nutrition, birth order, and seasonality: Intrahousehold allocation in rural
India. Journal of Development Economics 28 (1): 43-62.
Bentley, M. 1988. The household management of childhood diarrhea in rural North India.
Social Science and Medicine 27 (1): 75-85.
Bhende, M. J. 1983. Agroeconomic profile of selected villages in Sholapur Region of
Maharashtra State. International Crops Research Institute for the Semi-Arid Tropics,Economics Program, VLS Series, Patancheru, India.
Bidinger, P. D., T. S. Walker, B. Sarkar, A. Ram Murthy, and P. Babu. 1990. Economic, health,and nutritional consequences of the mid-1980s drought on a tank-irrigated, Deccan
Village in South India. Progress Report 98. International Crops Research Institute for the
Semi-Arid Tropics, Resource Management Program, Economics Group, Patancheru,
India.
Bouis, H. E., and L. J. Haddad. 1992. Are estimates of calorie income elasticities too high?: A
recalibration of the plausible range. Journal of Development Economics 39 (2): 333-364.
Braun, J. von, H. Bouis, S. Kumar, and R. Pandya-Lorch. 1992. Improving food security of thepoor: Concept, policy, and programs. Washington, D.C.: International Food PolicyResearch Institute.
Brownie C., J.-P. Habicht, and B. Cogill. 1986. Comparing indicators of health or nutritionalstatus. American Journal of Epidemiology 124 (6): 1031-1044.
Campbell, C. C. 1991. Food insecurity: A nutritional outcome or a predictor variable? Journalof Nutrition 121 (3): 408-415.
Chambers, R. 1991. Rapid and participatory appraisal for health and nutrition. Proceedings ofthe Nutrition Society of India 37: 339-356.
Chopde, V. K. 1981. Educational institutions of Kanzara. Unpublished report.
Chopde, V. K. 1991. A note on Kanzara. Photocopied notes, updating Kshirsagar report.
Unpublished.

99
Chung, K., and H. Bouis. 1996. The determinants of household-level demand formicronutrients: An analysis of rural South Indian households. Draft manuscript.
International Food Policy Research Institute, Washington, D.C.
Cogill, B. 1994. Personal communication, October 1994.
Chung, K., L. Haddad, and J. Ramakrishna. 1994. Alternative approaches to locating the foodinsecure: Evidence from South India. Report to the United States Agency for
International Development. International Food Policy Research Institute, Washington,
D.C. Mimeo.
Dev, S. M., M. H. Suryanarayana, and K. S. Parikh. 1992. Rural poverty in India: Incidence,
issues, and policies. Asian Development Review 10 (1): 35-66.
Down To Earth. 1993, January, p. 15.
Drèze, J. 1988. Famine in India. Suntory Toyota International Development Center Discussion
Paper. London: London School of Economics.
Foster, J., J. Greer, and E. Thorbecke. 1984. A class of decomposable poverty measures.
Econometrica 52 (3): 761-765.
Glewwe, P., and O. Kanaan. 1989. Targeting assistance to the poor: A multivariate approach
using household survey data. Development Economics Research Centre Discussion Paper
94, Department of Economics. Coventry: University of Warwick.
Glewwe, P., and J. van der Gaag. 1990. Identifying the poor in developing countries: Do
definitions matter? World Development 18 (6): 803-814.
Gopalan, C. 1992. As cited in Down To Earth, January 1993.
Habicht, J.-P., and D. L. Pelletier. 1990. The importance of context in choosing nutritional
indicators. Journal of Nutrition 120 (11) (Supplement): 1519-1524.
Habicht, J.-P., L. D. Meyers, and C. Brownie. 1982. Indicators for identifying and counting the
improperly nourished. American Journal of Clinical Nutrition 35 (5) (Supplement):
1241-1254.
Haddad, L., and R. Kanbur. 1991. The value of intrahousehold data for age-based targeting.
World Bank Working Paper, PRE Series. Washington, D.C.: World Bank.
Haddad, L., K. Chung, and P. Yasoda Devi. 1993. Alternative approaches to locating the food
and nutrition insecure: Work in progress in South India. Economic and Political Weekly30 (7-8): 392-402.
Haddad, L., J. Sullivan, and E. Kennedy. 1992. Identification and evaluation of alternative
indicators of food and nutrition security: Some conceptual issues and an analysis ofextant data. Final report, Food and Nutrition Monitoring Project. International Food
Policy Research Institute, Washington, D.C. Mimeo.
100
Harriss, B. 1991. Child nutrition and poverty in South India: Noon meals in Tamil Nadu. NewDelhi: Concept Publishing Company.
ICMR (India Council of Medical Research). 1994. Nutrient requirements and recommendedallowances for Indians. Hyderabad, India: National Institute of Nutrition.
India. 1990. Approach to the eighth five-year plan: 1990-1995. Planning Commission, Centrefor Monitoring Indian Economy, Government of India, Bombay.
Jha, S. 1992. Consumer subsidies in India: Is targeting effective? Development and Change 23(4): 101-128.
Kennedy, E., and E. Payongayong. 1991. Patterns of macro- and micronutrient consumption andimplications for monitoring and evaluation. International Food Policy Research Institute,
Washington, D.C. Mimeo.
Kennedy, E., and A. Slack. 1993. The integrated child development services (ICDS) in India:
Lessons learned and implications for future policies. International Food Policy Research
Institute, Washington, D.C. Mimeo.
Kendall, A., C. M. Olson, and E. A. Frongillo. 1995. Validation of the Radimer/Cornell
measures of hunger and food insecurity. Journal of Nutrition 125: 2798-2801.
Khan, M., and F. Riely. 1995. A note on choice of indicators for food security and monitoring.
Food Policy 20 (1): 63-68.
Kshirsagar, K. G. 1983. Agroeconomic profile of selected villages in Akola Region of
Maharashtra State. International Crops Research Institute for the Semi-Arid Tropics,
Economics Program, VLS Series, Patancheru, India.
Maxwell, S., and T. Frankenberger. 1992. Household food security: Concepts, indicators,measurements: A technical review. Rome: International Fund for AgriculturalDevelopment/United Nations Children's Fund.
NIN (National Institute of Nutrition). 1986. Development of a field method for haemoglobin. Annual Report 1985-86. Hyderabad, India.
NIN (National Institute of Nutrition). 1993. Nutritive value of Indian foods. Indian Council ofMedical Research. Hyderabad, India.
NIPCCD (National Institute of Public Cooperation and Child Development). 1989. Stats ofnutrition component of the Integrated child Development Services. A report. New Delhi.
Paolisso, M., and S. C. Regmi. 1992. Gender and the commercialization of subsistenceagriculture in Nepal. Washington, D.C.: International Center for Research on Women.
Pilch, S. M., ed. 1985. Assessment of the vitamin A nutritional status of the U.S. populationbased on data collected in the Health and Nutrition Examinations Surveys. Life Sciences
Research Office, Federation of American Biological Societies, Bethesda, Maryland.
101
Radimer, K. L., C. M. Olson, and C. Campbell. 1990. Development of indicators to assesshunger. Journal of Nutrition 120 (11) (Supplement): 1544-1548.
Rao, P., G. Sastry, and N. Rao. 1987. NNMB: Achievements and constraints. New Delhi: ICMR.
Ravallion, M. 1990. On the coverage of public employment schemes for poverty alleviation. Journal of Development Economics 34 (½): 57-80.
Ravallion, M., and K. Subbarao. 1992. Adjustment and human development in India. WorldBank, Population and Human Resources Division, Washington, D.C. Mimeo.
Reardon, T., P. Matlon, and C. Delgado. 1988. Coping with household-level food insecurity indrought-affected areas of Burkina Faso. World Development 16 (9): 1065-1074.
Ross, J. S., D. L. Pelletier, K. M. Rasmussen, and J.-P. Habicht. 1995. Screening for risk ofenergy deficiency during lactation. Cornell University, Ithaca, N.Y., U.S.A. Mimeo.
Rossner, B. 1995. Fundamentals of biostatistics, 4th ed. Belmont, Calif., U.S.A.: DuxburyPress.
Ruel, M.T., J. Rivera, and J.-P. Habicht. 1995. Length screens better than weight in stuntedpopulations. Journal of Nutrition 125 (5): 1222-1228.
Ryan, J. G., P. Bidinger, N. Prahlad Rao, and P. Pushpamma. 1984. The determinants ofindividual diets and nutrition status in six villages of southern India. Research Bulletin
No. 7. Patancheru, India: International Crops Research Institute for the Semi-Arid
Tropics.
Sivakumar, B. 1977. Evaluation of microspectrofluorimetric method for serum vitamin A.
Clinica Chimica Acta 79: 189-195.
Snedecor, G. W., and W. G. Cochran. 1989. Statistical methods, 8th ed. Ames, Iowa, U.S.A.:
University of Iowa Press.
Strauss, J. A., and D. Thomas. 1995. Human resources: Empirical modeling of household and
family decisions. In Handbook of development economics, ed. T. N. Srinivasan and J.
Behrman. Amsterdam: North Holland.
Swets, J. A. 1979. ROC analysis applied to the evaluation of medical imaging techniques.
Investigative Radiology 14 (2): 109-121.

102
Swets, J., and R. M. Pickett. 1982. Evaluation of diagnostic systems. Methods from signaldetection theory. New York: Academic Press.
Szucko, J. J., and B. Kleinmuntz. 1981. Statistical versus clinical lie detection. AmericanPsychologist 36 (5): 488-496.
Tandon, B. N. 1993. Integrated child development services (ICDS): An assessment. NutritionFoundation of India Bulletin 14 (1).
Tucker, K., D. Pelletier, K. Rasmussen, J. P. Habicht, P. Pinstrup-Andersen, and F. Roche. 1989. Advances in nutritional surveillance: The Cornell Nutritional Surveillance Programme
1981-1987. Cornell Food and Nutrition Policy Programme Monograph 89-2. Ithaca,
N.Y., U.S.A.: Cornell University.
UNDP (United Nations Development Program). 1994. Human development report. New York:
Oxford University Press.
USAID (United States Agency for International Development). 1992. Definition of food
security. Policy Determination PNAAV468. U.S. Agency for International Development,
Office of the Administrator, Washington, D.C.
USAID (United States Agency for International Development). 1994. USAID India programsummary. Washington, D.C.
USAID (United States Agency for International Development). 1995. Food aid and foodsecurity. Policy paper. Washington, D.C.: United States Agency for InternationalDevelopment.
Vasantha, T. 1993. Interviews with Aganwadi workers in Aurepalle village. Unpublished data. International Crop Research Institute of the Semi-Arid Tropics, Andhra Pradesh, India.
Walker, T. S., and J. G. Ryan. 1990. Village and household economies in India's semi-aridtropics. Baltimore, Md., U.S.A.: Johns Hopkins University Press.
Watts, M., and H. G. Bohle. 1993. The space of vulnerability: The causal structure of hungerand famine. Progress in Human Geography 17 (1): 43-67.
Webb, P., E. Richardson, and J. von Braun. 1993. Conceptual framework for famine analysis: Ahousehold income approach. Report to USAID. International Food Policy Research
Institute, Washington, D.C. Mimeo.
Webb, P., E. Richardson, S. Seyoum, and Y. Yohannes. 1994. Vulnerability mapping and
geographical targeting: An exploratory methodology applied to Ethiopia. Report to
USAID, Health and Human Resources Analysis for Africa Project. International Food
Policy Research Institute, Washington, D.C. Mimeo.
WFP (World Food Programme). 1991. Agenda item 7: The Indian experience. 32nd session.
Rome.
WHO (World Health Organization). 1972. Nutritional anemia. WHO Technical Report Series
No. 3. Geneva: World Health Organization.