alterations of the brain microstructure and corresponding
TRANSCRIPT

Research ArticleAlterations of the Brain Microstructure and CorrespondingFunctional Connectivity in Early-Blind Adolescents
Zhifeng Zhou ,1,2,3 Jinping Xu ,2 Leilei Shi ,4 Xia Liu ,1 Fen Hou ,3 Jingyi Zhou ,3
Jinpei Luo ,3 Qingmao Hu ,2 and Hengguo Li 3
1Department of Radiology, Shenzhen Mental Health Center, Shenzhen Kangning Hospital, Shenzhen 518003, China2Institute of Biomedical and Health Engineering, Shenzhen Institutes of Advanced Technology, Chinese Academy of Sciences,Shenzhen 518055, China3Medical Imaging Center, The First Affiliated Hospital of Jinan University, Guangzhou 510630, China4Department of Mechanical Engineering, Sungkyunkwan University, Suwon 16419, Republic of Korea
Correspondence should be addressed to Xia Liu; [email protected] and Hengguo Li; [email protected]
Received 18 May 2018; Revised 17 October 2018; Accepted 27 December 2018; Published 24 February 2019
Academic Editor: Andrea Guzzetta
Copyright © 2019 Zhifeng Zhou et al. This is an open access article distributed under the Creative Commons Attribution License,which permits unrestricted use, distribution, and reproduction in any medium, provided the original work is properly cited.
Although evidence from studies on blind adults indicates that visual deprivation early in life leads to structural and functionaldisruption and reorganization of the brain, whether young blind people show similar patterns remains unknown. Therefore, thisstudy is aimed at exploring the structural and functional alterations of the brain of early-blind adolescents (EBAs) compared tonormal-sighted controls (NSCs) and investigating the effects of residual light perception on brain microstructure and functionin EBAs. We obtained magnetic resonance imaging (MRI) data from 23 EBAs (8 with residual light perception (LPs), 15without light perception (NLPs)) and 21 NSCs (age range 11-19 years old). Whole-brain voxel-based analyses of diffusion tensorimaging metrics and region-of-interest analyses of resting-state functional connectivity (RSFC) were performed to comparepatterns of brain microstructure and the corresponding RSFC between the groups. The results showed that structuraldisruptions of LPs and NLPs were mainly located in the occipital visual pathway. Compared with NLPs, LPs showed increasedfractional anisotropy (FA) in the superior frontal gyrus and reduced diffusivity in the caudate nucleus. Moreover, thecorrelations between FA of the occipital cortices or mean diffusivity of the lingual gyrus and age were consistent with thedevelopment trajectory of the brain in NSCs, but inconsistent or even opposite in EBAs. Additionally, we found functional, butnot structural, reorganization in NLPs compared with NSCs, suggesting that functional neuroplasticity occurs earlier thanstructural neuroplasticity in EBAs. Altogether, these findings provided new insights into the mechanisms underlying the neuralreorganization of the brain in adolescents with early visual deprivation.
1. Introduction
It is well established that early-blind adults, i.e., those indi-viduals who lose sight at birth or within a short period afterbirth, show alterations in the neural structure and functiondue to the absence of visual inputs. Structurally, the morpho-logical changes of the grey matter (GM) in early-blind adultshave been studied extensively and include decreased GM vol-ume in the primary visual area [1–5]; increased GM volumein the occipital, frontal, and entorhinal cortices [4] and theglobus pallidus [6]; and increased cortical thickness of theearly visual areas [2, 7, 8]. In addition to GM alterations,
white matter (WM) alterations were also identified basedon the diffusion tensor imaging (DTI) datasets of early-blind adults. In detail, microstructural alterations weremainly found in the optic radiation and the lateral geniculatenucleus with decreased WM volume [2, 9, 10] or density [9,11]. Other microstructural disruptions due to early visualdeprivation were also found in the inferior longitudinal fas-ciculus [12] and the occipital/temporal/parietal thalamocor-tical projections [4, 13]. In addition, Leporé et al. [3], usingtensor-based morphometry, reported interesting hypertro-phy in the prefrontal and parietal WM and in a section ofthe splenium of the corpus callosum in early-blind adults.
HindawiNeural PlasticityVolume 2019, Article ID 2747460, 12 pageshttps://doi.org/10.1155/2019/2747460
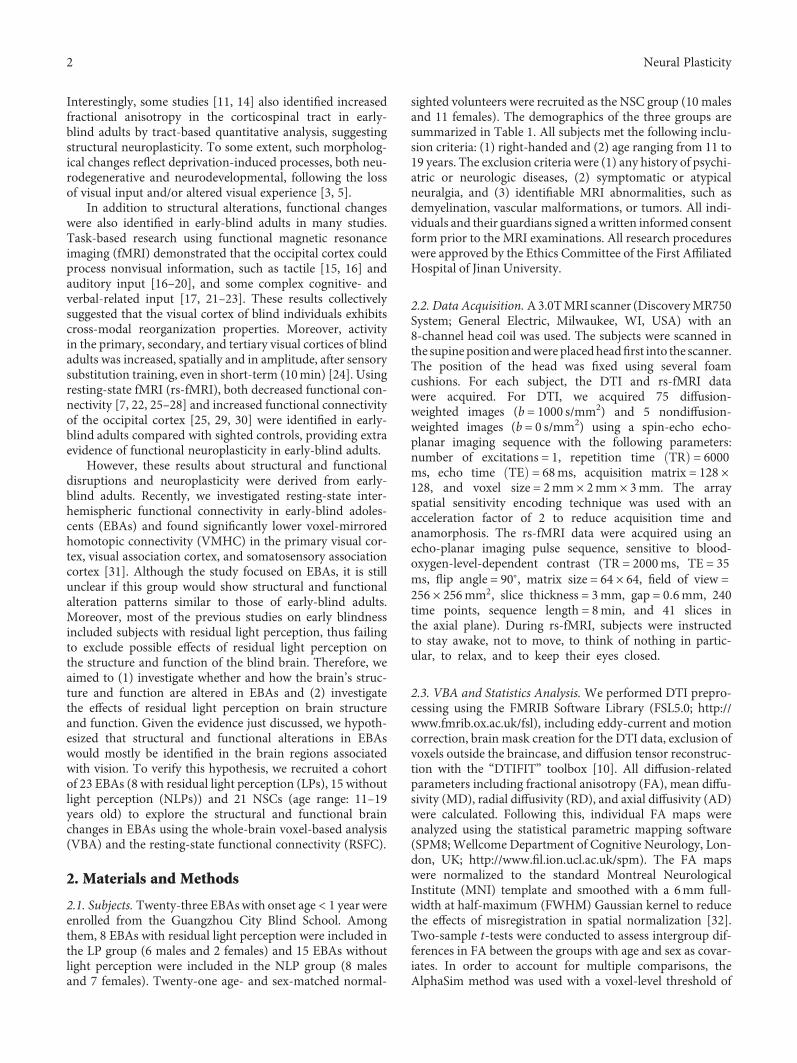
Interestingly, some studies [11, 14] also identified increasedfractional anisotropy in the corticospinal tract in early-blind adults by tract-based quantitative analysis, suggestingstructural neuroplasticity. To some extent, such morpholog-ical changes reflect deprivation-induced processes, both neu-rodegenerative and neurodevelopmental, following the lossof visual input and/or altered visual experience [3, 5].
In addition to structural alterations, functional changeswere also identified in early-blind adults in many studies.Task-based research using functional magnetic resonanceimaging (fMRI) demonstrated that the occipital cortex couldprocess nonvisual information, such as tactile [15, 16] andauditory input [16–20], and some complex cognitive- andverbal-related input [17, 21–23]. These results collectivelysuggested that the visual cortex of blind individuals exhibitscross-modal reorganization properties. Moreover, activityin the primary, secondary, and tertiary visual cortices of blindadults was increased, spatially and in amplitude, after sensorysubstitution training, even in short-term (10min) [24]. Usingresting-state fMRI (rs-fMRI), both decreased functional con-nectivity [7, 22, 25–28] and increased functional connectivityof the occipital cortex [25, 29, 30] were identified in early-blind adults compared with sighted controls, providing extraevidence of functional neuroplasticity in early-blind adults.
However, these results about structural and functionaldisruptions and neuroplasticity were derived from early-blind adults. Recently, we investigated resting-state inter-hemispheric functional connectivity in early-blind adoles-cents (EBAs) and found significantly lower voxel-mirroredhomotopic connectivity (VMHC) in the primary visual cor-tex, visual association cortex, and somatosensory associationcortex [31]. Although the study focused on EBAs, it is stillunclear if this group would show structural and functionalalteration patterns similar to those of early-blind adults.Moreover, most of the previous studies on early blindnessincluded subjects with residual light perception, thus failingto exclude possible effects of residual light perception onthe structure and function of the blind brain. Therefore, weaimed to (1) investigate whether and how the brain’s struc-ture and function are altered in EBAs and (2) investigatethe effects of residual light perception on brain structureand function. Given the evidence just discussed, we hypoth-esized that structural and functional alterations in EBAswould mostly be identified in the brain regions associatedwith vision. To verify this hypothesis, we recruited a cohortof 23 EBAs (8 with residual light perception (LPs), 15 withoutlight perception (NLPs)) and 21 NSCs (age range: 11–19years old) to explore the structural and functional brainchanges in EBAs using the whole-brain voxel-based analysis(VBA) and the resting-state functional connectivity (RSFC).
2. Materials and Methods
2.1. Subjects. Twenty-three EBAswith onset age < 1 year wereenrolled from the Guangzhou City Blind School. Amongthem, 8 EBAs with residual light perception were included inthe LP group (6 males and 2 females) and 15 EBAs withoutlight perception were included in the NLP group (8 malesand 7 females). Twenty-one age- and sex-matched normal-
sighted volunteers were recruited as the NSC group (10 malesand 11 females). The demographics of the three groups aresummarized in Table 1. All subjects met the following inclu-sion criteria: (1) right-handed and (2) age ranging from 11 to19 years. The exclusion criteria were (1) any history of psychi-atric or neurologic diseases, (2) symptomatic or atypicalneuralgia, and (3) identifiable MRI abnormalities, such asdemyelination, vascular malformations, or tumors. All indi-viduals and their guardians signed awritten informed consentform prior to the MRI examinations. All research procedureswere approved by the Ethics Committee of the First AffiliatedHospital of Jinan University.
2.2. Data Acquisition. A3.0TMRI scanner (DiscoveryMR750System; General Electric, Milwaukee, WI, USA) with an8-channel head coil was used. The subjects were scanned inthe supine position andwere placedheadfirst into the scanner.The position of the head was fixed using several foamcushions. For each subject, the DTI and rs-fMRI datawere acquired. For DTI, we acquired 75 diffusion-weighted images (b = 1000 s/mm2) and 5 nondiffusion-weighted images (b = 0 s/mm2) using a spin-echo echo-planar imaging sequence with the following parameters:number of excitations = 1, repetition time TR = 6000ms, echo time TE = 68ms, acquisition matrix = 128 ×128, and voxel size = 2mm × 2mm × 3mm. The arrayspatial sensitivity encoding technique was used with anacceleration factor of 2 to reduce acquisition time andanamorphosis. The rs-fMRI data were acquired using anecho-planar imaging pulse sequence, sensitive to blood-oxygen-level-dependent contrast (TR = 2000ms, TE = 35ms, flip angle = 90°, matrix size = 64 × 64, field of view =256 × 256mm2, slice thickness = 3mm, gap = 0 6mm, 240time points, sequence length = 8min, and 41 slices inthe axial plane). During rs-fMRI, subjects were instructedto stay awake, not to move, to think of nothing in partic-ular, to relax, and to keep their eyes closed.
2.3. VBA and Statistics Analysis. We performed DTI prepro-cessing using the FMRIB Software Library (FSL5.0; http://www.fmrib.ox.ac.uk/fsl), including eddy-current and motioncorrection, brain mask creation for the DTI data, exclusion ofvoxels outside the braincase, and diffusion tensor reconstruc-tion with the “DTIFIT” toolbox [10]. All diffusion-relatedparameters including fractional anisotropy (FA), mean diffu-sivity (MD), radial diffusivity (RD), and axial diffusivity (AD)were calculated. Following this, individual FA maps wereanalyzed using the statistical parametric mapping software(SPM8;Wellcome Department of Cognitive Neurology, Lon-don, UK; http://www.fil.ion.ucl.ac.uk/spm). The FA mapswere normalized to the standard Montreal NeurologicalInstitute (MNI) template and smoothed with a 6mm full-width at half-maximum (FWHM) Gaussian kernel to reducethe effects of misregistration in spatial normalization [32].Two-sample t-tests were conducted to assess intergroup dif-ferences in FA between the groups with age and sex as covar-iates. In order to account for multiple comparisons, theAlphaSim method was used with a voxel-level threshold of
2 Neural Plasticity

Table 1: Clinical characteristics of early-blind adolescents and normal-sighted controls.
No. Age (years) Gender Age of onset (months) Causes of blindness
LP01 11.8 M 2 ROP
LP02 14.7 M 2 Cataract
LP03 14.4 M 0 CG; EA
LP04 11.0 M 0 CRL
LP05 12.3 M 3 ROP
LP06 12.5 F 8 ROP
LP07 13.8 M 0 CRL
LP08 15.0 F 0 CRL
NLP01 14.3 M 3 ROP
NLP02 16.3 M 2 ROP
NLP03 17.2 M 8 OT
NLP04 11.0 M 0 ROP
NLP05 13.8 F 1 ROP; EA
NLP06 17.9 F 5 Cataract; EA
NLP07 12.3 F 3 ROP
NLP08 17.1 F 0 ROP; OA
NLP09 17.8 M 0 ROP
NLP10 14.5 F 1 ROP
NLP11 14.8 M 4 ROP
NLP12 14.9 M 0 CRL
NLP13 11.1 F 3 ET; EE
NLP14 13.2 M 0 CRL
NLP15 13.7 F 0 ROP
NSC01 12.5 F — —
NSC02 12.0 M — —
NSC03 14.0 M — —
NSC04 17.2 M — —
NSC05 13.6 M — —
NSC06 12.5 M — —
NSC07 13.3 M — —
NSC08 18.3 F — —
NSC09 12.1 M — —
NSC10 18.2 F — —
NSC11 15.5 M — —
NSC12 16.5 M — —
NSC13 13.9 M — —
NSC14 18.7 F — —
NSC15 17.6 F — —
NSC16 17.0 F — —
NSC17 15.4 F — —
NSC18 15.0 F — —
NSC19 11.0 F — —
NSC20 15.0 F — —
NSC21 13.0 F — —
Abbreviations: LP: early-blind adolescents with light perception; NLP: early-blind adolescents without light perception; NSC: normal-sighted controls; M: male;F: female; ROP: retinopathy of prematurity; OT: oxygen toxicity; EA: eyeball atrophy; CRL: congenital retinal lesions: CG, congenital glaucoma; OA: opticatrophy; ET: eyeball tumor; and EE: eyeball extraction.
3Neural Plasticity
p < 0 001 and a cluster-level threshold of p < 0 05. VBA of theMD, RD, and AD maps was performed similarly.
The clusters showing significant differences in the DTIparameters between the groups were identified according tothe standard brain atlas, and the DTI values from these sig-nificant clusters of the corresponding tensor parameter maps(FA, MD, RD, and AD) in the subjects were extracted. Subse-quently, correlation analysis followed by an independenttwo-sample t-test was performed using the Statistical Pack-age for the Social Sciences (SPSS) software (version 23.0;IBM Corporation, NY, USA). For correlations between DTImetric values and age, the Pearson correlation coefficientwas computed separately for each group. Two-sample t-tests were used to detect differences in the DTI valuesbetween the groups.
2.4. Resting-State fMRI Data Preprocessing. The rs-fMRI datawere preprocessed using the toolbox for Data Processing &Analysis for Brain Imaging (DPABI, http://rfmri.org/dpabi)[33]. The preprocessing steps were (1) discarding the first10 time points to avoid transient signal changes that occurredbefore magnetization reached the steady state and subjects’adaptation to the scanning noise; (2) slice timing correction;(3) head motion realignment; (4) normalization to the stan-dard MNI template in the DPABI package; (5) smoothingwith a 6mm Gaussian kernel; (6) linear regression to removeconfounding factors, including six head motion parameters,as well as the ventricle, WM, and global signals; (7) scrubbingwith interpolation to remove volumes with head motion spa-tial shift larger than 1.5mm and rotation greater than 1.5° inany direction; and (8) band-pass filtering from 0.01 to 0.1Hz.The resulting images were manually inspected by two experi-enced researchers for image quality.
2.5. RSFC and Statistics Analysis. To investigate the corre-sponding functional alterations, the clusters showing signifi-cant group difference in VBA were selected as the seed ROIsfor RSFC analysis. Firstly, the peak coordinates of each signif-icant cluster obtained from VBA were determined and usedto create a ROI with a radius of 6mm. Secondly, the RSFCwas examined with a seed-voxel correlation approach, inwhich the correlations of the mean time-course signal in aseed region with all other voxels in the whole brain were cal-culated. Before statistical analysis, the correlation coefficientswere transformed into z values using the Fisher r-to-z trans-formation to improve the normality. Two-sample t-testsbetween the groups were then performed using the DPABItoolbox, with age, sex, and head motion parameters as covar-iates. The statistical results were corrected for multiplecomparisons using the AlphaSim method, with a voxel-
level threshold of p < 0 001 and a cluster-level threshold ofp < 0 05. Finally, the results were projected onto a smoothedInternational Consortium for Brain Mapping (ICBM152)surface template using the BrainNet Viewer (http://www.nitrc.org/projects/bnv/) [34].
3. Results
3.1. Demographic Characteristics. Six male and two femalesubjects were included in the LP group and eight maleand seven female subjects in the NLP group; we alsorecruited 21 age- and sex-matched NSCs. Analysis ofvariance (ANOVA) followed by two-sample t-tests andchi-square tests were performed to detect age and sex differ-ences, respectively, between the various groups (Table 2). Nosignificant differences in the demographic characteristicswere identified between the three groups (age: t = −1 657,p = 0 112 comparing the LP and NLP groups; t = −1 883,p = 0 071, LP vs. NSC; t = 0 271, p = 0 788, NLP vs.NSC; sex: p = 0 400, LP vs. NLP; p = 0 238, LP vs. NSC;and p = 1 000, NLP vs. NSC).
3.2. VBA Results. The two-sample t-test revealed a reducedFA in the left occipital lobe/subgyral, right parahippocampalgyrus, and right superior occipital gyrus in NLPs comparedto NSCs. We also found higher MD in the bilateral lingualgyrus, as well as higher RD in the right lingual gyrus andright parahippocampal gyrus in NLPs, compared with NSCs(p < 0 001, AlphaSim corrected; Table 3 and Figure 1). Nosignificant AD alterations were observed between these twogroups. Compared with NSCs, LPs showed significant FAreduction in the bilateral middle occipital gyrus, left lingualgyrus, left cuneus, left parahippocampal gyrus, and rightparietal lobe/subgyral (p < 0 001, AlphaSim corrected;Table 3 and Figure 2). No significant differences in MD,RD, and AD were found when comparing the LP and NSCgroups. No elevated FA or reduced diffusivity parameterswere found for any of the clusters in NLPs or LPs comparedwith NSCs, even with a loose threshold (p < 0 01, AlphaSimcorrected). Unfortunately, the comparison of all diffusiontensor maps between the LP and NLP groups showed noresults at the voxel level, at AlphaSim-corrected p < 0 001.However, some voxels in the brain of the LP group exhibitedtrends (at a voxel-level AlphaSim-corrected p < 0 01)towards increased/decreased DTI parameters comparedwith NLPs, including reduced FA in the right fusiformgyrus, right middle temporal gyrus, and superior occipitalgyrus; increased FA in the right superior frontal gyrus;increased MD, RD, and AD in the right fusiform gyrusand middle temporal gyrus; and reduced MD, RD, and AD
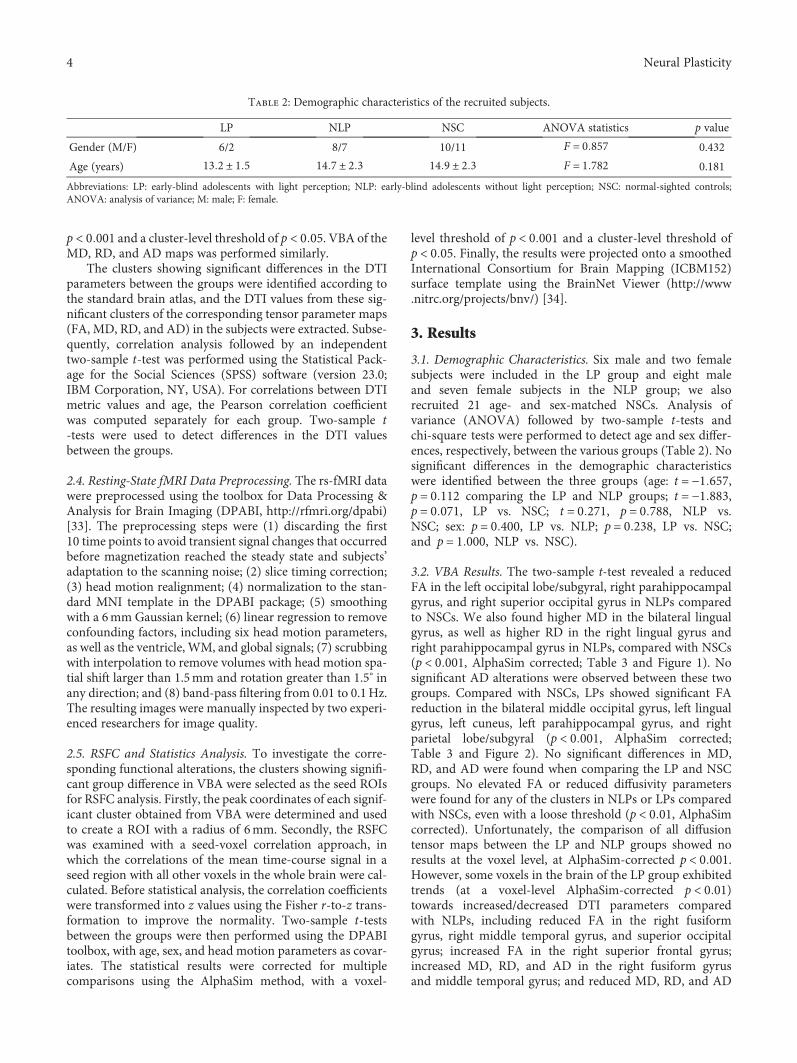
Table 2: Demographic characteristics of the recruited subjects.
LP NLP NSC ANOVA statistics p value
Gender (M/F) 6/2 8/7 10/11 F = 0 857 0.432
Age (years) 13 2 ± 1 5 14 7 ± 2 3 14 9 ± 2 3 F = 1 782 0.181
Abbreviations: LP: early-blind adolescents with light perception; NLP: early-blind adolescents without light perception; NSC: normal-sighted controls;ANOVA: analysis of variance; M: male; F: female.
4 Neural Plasticity

in the bilateral caudate (Table SI and Figure SI in theSupplementary Materials).
3.3. Correlation Analysis Results. Correlation analysisshowed positive and significant correlations between theMD and RD values of the right lingual gyrus and age in NLPs(MD: r = 0 601, p = 0 018; RD: r = 0 536, p = 0 040), but neg-ative and significant correlations in NSCs (MD: r = −0 488,p = 0 025; RD: r = −0 508, p = 0 019). In NSCs, the FA valuesof the left occipital lobe/subgyral (r = 0 538, p = 0 012) andthe right superior occipital gyrus (r = 0 560, p = 0 008) werepositively correlated with age, while the MD values of the leftlingual gyrus were negatively correlated with age (r = −0 508,p = 0 019) (Figure 3).
3.4. Head Motion Effects. Head motion time courses werecomputed by estimating the shift in each direction and therotations about each axis for each of the 230 consecutive vol-umes. To assess the head motion confounders, we calculatedthe mean framewise displacement among the three groups(LP: 0 35 ± 0 23mm; NLP: 0 22 ± 0 17mm; and NSC: 0 26± 0 27mm). Moreover, ANOVA was used to identify poten-tial differences in head motion between the 3 groups, butnone was found. (ANOVA: F = 0 845, p = 0 437).
3.5. RSFC Results. The whole-brain RSFC of the brain regionswith significant microstructural alterations was analyzed andcompared between the NLP and NSC groups. The leftoccipital lobe/subgyral of NLPs showed enhanced RSFC withthe left inferior frontal triangular areas, left middle frontalgyrus, and right inferior frontal opercular areas; the rightparahippocampal gyrus of NLPs showed enhanced RSFCwith the left superior frontal gyrus; the right superior occip-ital gyrus of NLPs showed enhanced RSFC with the right
supramarginal gyrus/left superior frontal gyrus anddecreased RSFC with the left fusiform gyrus (p < 0 001,AlphaSim corrected; Table 4 and Figure 4). When comparingLPs with NSCs, only the left middle occipital gyrus showed asignificantly decreased RSFC in LPs with the right middleoccipital gyrus, when setting the bilateral middle occipitalgyrus, left parahippocampal gyrus, left lingual gyrus, leftcuneus, and right parietal lobe/subgyral as ROI seeds(p < 0 001, AlphaSim corrected; Table 4).
To investigate the effects of residual light perception onthe brain function in blind brains, the differences in thewhole-brain RSFC of the brain regions showing microstruc-tural alterations between the LP and NLP groups were ana-lyzed and compared. A trend of RSFC change in LPsrelative to NLPs could also be observed and specificallyenhanced RSFC between the right fusiform gyrus and theright superior frontal orbital areas/right middle temporalgyrus and between the right superior frontal gyrus and theleft inferior temporal gyrus. On the contrary, the RSFCbetween the right superior frontal gyrus and the right post-central gyrus/superior frontal gyrus was decreased in the LPcompared to the NLP group (p < 0 01, AlphaSim-corrected;Table SII and Figure SII in the Supplementary Materials).
4. Discussion
We investigated the alterations of brain microstructure andtheir corresponding functional connectivity in EBAs withand without light perception using the DTI and rs-fMRIdatasets. Compared to NSCs, both EBA groups showed sig-nificant brain microstructural disruptions mainly in the pos-terior visual pathway of the occipital lobe and the extrastriatevisual cortex. Moreover, the correlations between bilateral
Table 3: Brain regions with significant changes in diffusion tensor imaging metrics.
Between-group comparisonDTI parameter
changesLocalizations of peak
voxelsAbbreviations
Cluster size(voxels)
T scorePeak MNIx y z
NLP vs. NSC (p < 0 001,AlphaSim corrected)
FA reduction
Left occipital lobe/subgyral OG.L 5196 -7.73 -32 -62 -2
Right parahippocampal ParaHIP.R 978 -10.06 12 2 -22
Right superior occipitalgyrus
SOG.R 255 -8.34 24 -92 32
MD elevationLeft lingual LING.L 3698 5.85 -28 -54 -4
Right lingual LING.R 3596 5.84 20 -54 2
RD elevationRight lingual LING.R 4030 6.74 14 -80 0
Right parahippocampal ParaHIP.R 7113 7.07 10 4 -18
LP vs. NSC (p < 0 001,AlphaSim corrected)
FA reduction
Left parahippocampal ParaHIP.L 319 -6.58 -12 2 -20
Left middle occipital gyrus MOG.L 198 -5.98 -26 -100 2
Left occipital lobe/subgyral OG.L 224 -5.71 -32 -68 -2
Left lingual LING.L 142 -5.11 -4 -74 -4
Right middle occipitalgyrus
MOG.R 62 -5.99 38 -70 0
Left cuneus CUN.L 154 -5.98 -8 -84 30
Right parietallobe/subgyral
PG.R 120 -6.65 32 -40 24
Abbreviations: LP: early-blind adolescents with residual light perception; NLP: early-blind adolescents without light perception; NSC: normal-sighted controls;FA: fractional anisotropy; MD: mean diffusivity; RD: radial diffusivity; and MNI: Montreal Neurological Institute.
5Neural Plasticity

occipital cortex FA or bilateral lingual gyrus MD and agewere consistent with the developmental trajectory of thebrain in NSCs, but inconsistent or even opposite in EBAs.Additionally, using brain regions with significant DTIparameter changes in our study as the ROIs, we identifiedenhanced RSFC in the occipital cortex with the bilateral fron-tal cortex and the homolateral parietal cortex and reducedintrahemispheric RSFC in the right visual cortex in NLPs,as well as reduced interhemispheric RSFC within the middleoccipital cortex in LPs compared with NSCs. Our findingsprovide additional evidence that early visual deprivationmay lead to functional neuroplasticity earlier than structuralneuroplasticity in EBAs.
4.1. Disruptions in the Brain Microstructure of EBAs. The FAreduction in the bilateral visual pathway of the occipital cor-tex in both EBA groups, elevated MD of the bilateral lingualgyrus, and elevated RD of the right lingual gyrus in NLPs vs.NSCs were consistent with the findings of previous researchon young or middle-aged blind adults [2, 9, 12, 35, 36]. Thesestructural disruptions were also supported by other evidenceof reduced anatomical connectivity associated with the visualcortex [12, 37] and decreased GM and WM volume in theoccipital cortex of blind individuals [6, 38]. Our study alsovalidated the GM and WM changes in the visual cortex ofEBAs at the microstructural level, which can be explainedby transneuronal degeneration and/or immaturity due toearly visual deprivation [9, 39]. Moreover, we found
diminished FA in the left parahippocampal gyrus of LPsand the right parahippocampal gyrus of NLPs comparedto NSCs. The right parahippocampal gyrus is importantfor learning and visuospatial configuration of objects [40],while the left parahippocampal gyrus is involved in cumu-lative verbal memory [41]. Considering the asymmetryfunction of the bilateral parahippocampal gyri during learn-ing, their inconsistent alteration in the two groups mayprovide evidence of different learning patterns betweenthe LP and NLP groups.
Furthermore, to investigate the effects of residual lightperception on brain microstructure, we compared the DTIparameters between LPs and NLPs. The results showedincreased FA in the right superior frontal gyrus and reduceddiffusivity parameters in the bilateral caudate nucleus in LPscompared with NLPs. Since the superior frontal gyrus is ana-tomically connected with the cognitive control network andfunctionally involved in complex cognitive processing [42,43], the increased FA of the right superior frontal gyrus inLPs vs. NLPs may suggest that residual light perception couldplay a role in complex cognitive function or reduce the dam-age to cognitive function induced in EBAs by the lack ofvisual information. As the caudate nucleus is known to inte-grate spatial information with motor behavior and is associ-ated with some learning processing [44–46], its decreaseddiffusivity parameters in LPs vs. NLPs demonstrate that thefunction of guiding motor performance and learning in thecaudate nucleus may be partly mediated by light perception.
Z
R
FA
MD
RD
AD
−24mm −16mm −8mm 0mm 8mm 16mm 24mm
L 7.34
6.19
5.32
4.44−4.44
−6.31
−8.19
−10.06T
Figure 1: Group differences of fractional anisotropy (FA), mean diffusivity (MD), radial diffusivity (RD), and axial diffusivity (AD) in NLPscompared to NSCs (p < 0 0001, AlphaSim corrected). Blue regions denote lower FA values and red regions denote higher diffusivity values.The numbers at the top indicate the z value of MNI coordinates.
6 Neural Plasticity

We also calculated the correlations between age and DTImetrics of the altered brain regions in the three groups. TheFA of the bilateral occipital cortex was positively correlatedwith age in NSCs but not in NLPs, and the MD and RD ofthe right lingual gyrus were negatively correlated with age
in NSCs, but positively in NLPs. The trends of DTI parame-ters alteration with age in NSCs were consistent with thedevelopmental trajectory of WM in the young [47–49], whilethese trends were not observed or were reversed in NLPs.This inconsistency suggests that microstructural disruptions
z
R
FA
MD
RD
AD
−24mm −16mm −8mm 0mm 8mm 16mm 24mm
L 7.34
6.19
5.32
4.44
−4.44
−6.31
−8.19
−10.06T
Figure 2: Group differences of fractional anisotropy (FA), mean diffusivity (MD), radial diffusivity (RD), and axial diffusivity (AD) in LPscompared to NSCs (p < 0 001, AlphaSim corrected). Blue and red regions denote lower and higher DTI parameters, respectively. Thenumbers at the top indicate the z value of MNI coordinates.
0.30
OG.L SOG.R LING.R LING.L
r = 0.538, p = 0.025
r = −0.121, p = 0.667
r = −0.488, p = 0.025 r = −0.508, p = 0.019r = 0.038, p = 0.892
r = 0.560, p = 0.008 r = 0.601, p = 0.018r = 0.536, p = 0.040
0.27
0.24FA FA MD
RD
0.21
0.18
10 12 14Age (years) Age (years) Age (years) Age (years)
1816 20
0.22
0.20
0.18
0.16
0.14
0.12
0.10
10 12 14 16 18 20 10
1.11.0−3
0.9
0.8
0.7
0.6
0.5
0.4
1.0
0.9
0.8
0.7
0.6
0.5
12 14 16 18 20 10 12 14 16 18 20
NLPGroup
NLPNSC
NSC
Figure 3: Pearson’s correlation analyses between age and DTI metrics of OG.L, SOG.R, LING.R, and LING.L, respectively, in the NLP andNSC groups. In the scatter plots, the DTI metrics of each significant region are displayed for each subject in the specific groups, with dots forNLPs shown in violet and NSCs in green. The correlation coefficients and p values are next to each scatter plot. All abbreviations of brainregions are shown in Table 3.
7Neural Plasticity

caused by early visual deprivation in the corresponding brainregions may progressively accumulate in adolescents. Giventhe continuous development of WM in adolescence, a
probably more reasonable explanation for the trend shownby the NLPs is the coexistence of blindness-induced damageand normal cerebral development.
Table 4: Brain regions with significant changes of RSFC between groups.
Between-group comparison ROI seeds Brain regions Abbreviations Cluster size (voxels) T scorePeak MNIx y z
NLPs vs. NSC
OG.L
Left inferior frontal gyrus,triangular part
IFGtri.L 77 5.12 -39 33 6
Right inferior frontal gyrus,opercular part
IFGoper.R 115 6.77 57 21 33
Left middle frontal gyrus MFG.L 97 5.68 -45 18 18
ParaHIP.R Left superior frontal gyrus SFG.L 67 5.96 67 -24 30
SOG.R
Left fusiform gyrus FG.L 188 -5.93 -24 -66 -15
Right supramarginal gyrus SMG.R 62 5.16 60 -33 39
Left superior frontal gyrus SFG.L 48 4.63 24 -93 6
LPs vs. NSC MOG.L Right middle occipital gyrus MOG.R 47 -5.15 24 -93 6
The results were corrected by the AlphaSim method at a voxel level of p < 0 001. Abbreviations: RSFC: resting-state functional connectivity; ROI: region ofinterest; OG.L: left occipital gyrus; ParaHIP.R: right parahippocampal gyrus; SOG.R: right superior occipital gyrus; MOG.L; left middle occipital gyrus; LP:early-blind adolescents with residual light perception; NLP; early-blind adolescents without light perception; NSC: normal-sighted controls; MNI: MontrealNeurological Institute.
L
MFG.LIFGoper.R
IFGtri.L
T valueOG.L
8−8
R
(a)
L
ParaHIP.R
SFG.L
8−8
R
(b)
L
SOG.R
SM.RFG.L
8−8
R
(c)
Figure 4: Brain regions that showed altered functional connectivity with OG.L (a), ParaHIP.R (b), and SOG.R (c), respectively, in NLPscompared to NSCs. Two-sample t-tests were performed to explore the between-group differences. The results were corrected by theAlphaSim method at a voxel level of p < 0 001. All abbreviations of the brain regions are shown in Tables 3 and 4.
8 Neural Plasticity

4.2. Alterations in Functional Connectivity. Changes in brainmicrostructure preferentially point to abnormalities in brainfunctional connectivity [50, 51]. Resting-state fMRI canreflect the integrated features of intrinsic functional connec-tivity in the brains of visually impaired persons [27]. Manyprevious studies reported changes in RSFC between theoccipital cortex and other sensory [7, 25–27, 52], somatosen-sory [25, 26, 28, 52, 53], and motor cortices [25, 26, 28] inearly-blind adults. In the current study, the occipital gyrusin NLPs showed enhanced RSFC with some frontal areas,including the left inferior frontal triangle, left middle frontalgyrus, left superior frontal gyrus, and right inferior frontalopercular areas. Such findings are consistent with those ofprevious studies [54, 55]. In healthy humans, these frontalregions are classically considered as high-level areas relatedto language and cognition and involved in verbal fluency[56, 57], single word and motor speech production [58, 59],and error detection and imitation [60, 61]. Beyond theseclassical functions, they also participate in verbal workingmemory [62, 63]. In blind individuals, the occipital visualcortex and the frontal language and cognitive areas wereactivated when performing Braille reading tasks [64, 65].These findings indicated that these frontal areas might playan important role, related to the language network, in theblind brain. Additionally, compared with sighted controls,early-blind participants had more extensive activity in theoccipital visual areas and frontal language areas when per-forming a vibrotactile memory task [64, 65]. All evidencemay explain why the RSFC between the occipital areasand frontal areas was increased in the NLPs. From anotherperspective, the elevated RSFC between the occipital visualareas and the frontal language regions can provide com-pelling evidence for the existence of functional neuroplas-ticity in NLPs.
We also observed reduced interhemispheric RSFCbetween the bilateral middle occipital gyrus in LPs andbetween the right superior occipital gyrus and the left fusi-form gyrus in NLPs compared with NSCs, extending thefindings of many previous studies [22, 25, 31, 66]. Accordingto some published reports, such reduced interhemisphericcommunication may be interpreted as extensive abnormali-ties in WM integrity, particularly in the corpus callosum[67, 68]. Many existing studies found WM abnormalities inthe splenium of the corpus callosum, thought to play a crucialrole in the communication between the two cerebral hemi-spheres, in early-blind young, middle-aged, or elderly adults[3, 10, 35, 69, 70]. However, no WM structural abnormalitieswere found in the splenium of the corpus callosum in thepresent study. One possible reason may be that the posteriorpart of the corpus callosum continues to develop during ado-lescence and increases in density [47, 48, 71, 72], likely coun-teracting the neurodegenerative effects of visual deprivation[73]. Based on prior and present findings, we speculated thatthe RSFC changes in EBAs might result not only from a com-bination mechanism of general loss and complementaryplasticity [25] but also from an antagonistic mechanism ofneural development. Thus, our findings provide new infor-mation regarding the functional profiles that emerge in theearly life of blind adolescents.
Furthermore, we evaluated the RSFC differences betweenthe LP and NLP groups to investigate the differences in func-tional connectivity patterns depending on residual light per-ception. Compared with NLPs, LPs showed enhanced RSFCin the right fusiform with the homolateral middle temporalgyrus and reduced RSFC in the right superior frontal gyruswith the right postcentral gyrus. In sighted subjects, the fusi-form and middle temporal gyri have been reported to beinvolved in the ventral and dorsal visual streams, respec-tively, and to be robustly activated during object shape/loca-tion detection and visual-motor tasks [74, 75]. There is nodoubt that light perception is crucial for such processing.Therefore, the residual perception of light in LPs mayaccount for the enhanced RSFC between these regions. Giventhat the postcentral gyrus is well-known as the primarysomatosensory area and is associated with fine touch sense,the decreased RSFC of this area in LPs may suggest that thetouch sense of early-blind individuals with residual light per-ception is not as strong as that of those without lightperception.
4.3. Limitation. Our findings of the effects of residual lightperception on brain microstructure and function in EBAswere derived at a loose level of statistical significance, pre-sumably due to the small sample size. Therefore, these resultsshould be interpreted with caution, and further studies withlarger sample size will be needed to provide solid evidenceof these phenomena.
5. Conclusion
The present study demonstrated significant microstructuraland functional alterations in EBAs with and without residuallight perception when compared to NSCs. Our findingsprovide additional evidence that early visual deprivationmay lead to functional neuroplasticity earlier than structuralneuroplasticity in EBAs. The structural alterations in EBAscontain complex mechanisms including general loss, com-plementary plasticity, and neural development. Collectively,these results provided new insights into the mechanismsunderlying the reorganization of the brain in adolescentswith early visual deprivation.
Data Availability
The datasets generated and/or analyzed during the currentstudy are available from the corresponding author Dr.Hengguo Li ([email protected]) on reasonable request.
Conflicts of Interest
The authors declare that the research was conducted in theabsence of any commercial or financial relationships thatcould be construed as a potential conflict of interest.
Authors’ Contributions
ZZ, XL, FH, JZ, and JL acquired and analyzed data. JX, XL,and HL conceived this study and designed the experiments.ZZ wrote the article with the help of JX, LS, and QH. All
9Neural Plasticity

authors were involved in data interpretation and criticallyrevising the manuscript.
Acknowledgments
This work was supported by the Shenzhen Sanming Project(SZSM201512038), the Science and Technology InnovationProgram of Shenzhen (JCYJ20160531184531506), and theNatural Science Foundation of Guangdong Province (Nos.2017A030313744 and 2016A030313180).
Supplementary Materials
Table SI: brain regions with significant changes in diffusiontensor imaging metrics between LPs and NLPs. Table SII:brain regions with significant changes of RSFC between theLP and NLP groups. Figure SI: group differences of fractionalanisotropy (FA), mean diffusivity (MD), radial diffusivity(RD), and axial diffusivity (AD) using voxel-based analysesin LPs compared to NLPs (AlphaSim corrected with avoxel-level threshold of p < 0 01 and a cluster-level thresholdof p < 0 05). Blue and red regions denote decreased andincreased DTI parameters, respectively. The numbers at thetop indicate the z value of MNI coordinates. Figure SII: brainregions that showed altered functional connectivity withFG.R (A) and SFG.R (B), respectively, in LPs compared toNLPs. Two sample t-tests were performed to explore theintergroup differences. The results were corrected by theAlphaSim method at a voxel level of p < 0 01. All abbrevia-tions of the brain regions are shown in Tables SI and SII.(Supplementary Materials)
References
[1] U. Noppeney, K. J. Friston, J. Ashburner, R. Frackowiak, andC. J. Price, “Early visual deprivation induces structural plastic-ity in gray and white matter,” Current Biology, vol. 15, no. 13,pp. R488–R490, 2005.
[2] H. Bridge, A. Cowey, N. Ragge, and K. Watkins, “Imagingstudies in congenital anophthalmia reveal preservation ofbrain architecture in ‘visual’ cortex,” Brain, vol. 132, no. 12,pp. 3467–3480, 2009.
[3] N. Leporé, P. Voss, F. Lepore et al., “Brain structure changesvisualized in early- and late-onset blind subjects,”NeuroImage,vol. 49, no. 1, pp. 134–140, 2010.
[4] S. Modi, M. Bhattacharya, N. Singh, R. P. Tripathi, andS. Khushu, “Effect of visual experience on structural organiza-tion of the human brain: a voxel based morphometric studyusing DARTEL,” European Journal of Radiology, vol. 81,no. 10, pp. 2811–2819, 2012.
[5] W. J. Pan, G. Wu, C. X. Li, F. Lin, J. Sun, and H. Lei, “Progres-sive atrophy in the optic pathway and visual cortex of earlyblind Chinese adults: a voxel-based morphometry magneticresonance imaging study,” NeuroImage, vol. 37, no. 1,pp. 212–220, 2007.
[6] C. Y. Wan, A. G. Wood, J. Chen, S. J. Wilson, and D. C. Reu-tens, “The influence of preterm birth on structural alterationsof the vision-deprived brain,” Cortex, vol. 49, no. 4,pp. 1100–1109, 2013.
[7] W. Qin, Y. Liu, T. Jiang, and C. Yu, “The development of visualareas depends differently on visual experience,” PLoS One,vol. 8, no. 1, article e53784, 2013.
[8] C. Mateus, O. C. d’Almeida, A. Reis, E. Silva, and M. Castelo-Branco, “Genetically induced impairment of retinal ganglioncellsat theaxonal level is linkedtoextrastriatecorticalplasticity,”Brain Structure and Function, vol. 221, no. 3, pp. 1767–1780,2016.
[9] N. Shu, J. Li, K. Li, C. Yu, and T. Jiang, “Abnormal diffusion ofcerebral white matter in early blindness,” Human Brain Map-ping, vol. 30, no. 1, pp. 220–227, 2009.
[10] J. S. Shimony, H. Burton, A. A. Epstein, D. G. McLaren, S. W.Sun, and A. Z. Snyder, “Diffusion tensor imaging reveals whitematter reorganization in early blind humans,” Cerebral Cortex,vol. 16, no. 11, pp. 1653–1661, 2006.
[11] D. Wang, W. Qin, Y. Liu, Y. Zhang, T. Jiang, and C. Yu,“Altered white matter integrity in the congenital and late blindpeople,” Neural Plasticity, vol. 2013, Article ID 128236, 8pages, 2013.
[12] N. Shu, Y. Liu, J. Li, Y. Li, C. Yu, and T. Jiang, “Alteredanatomical network in early blindness revealed by diffusiontensor tractography,” PLoS ONE, vol. 4, no. 9, article e7228,2009.
[13] N. H. Reislev, T. B. Dyrby, H. R. Siebner, H. Lundell, M. Ptito,and R. Kupers, “Thalamocortical connectivity and microstruc-tural changes in congenital and late blindness,” Neural Plastic-ity, vol. 2017, Article ID 9807512, 11 pages, 2017.
[14] C. Yu, N. Shu, J. Li, W. Qin, T. Jiang, and K. Li, “Plasticity ofthe corticospinal tract in early blindness revealed by quantita-tive analysis of fractional anisotropy based on diffusion tensortractography,” NeuroImage, vol. 36, no. 2, pp. 411–417, 2007.
[15] L. G. Cohen, P. Celnik, A. Pascual-Leone et al., “Functional rel-evance of cross-modal plasticity in blind humans,” Nature,vol. 389, no. 6647, pp. 180–183, 1997.
[16] L. A. Renier, I. Anurova, A. G. de Volder, S. Carlson,J. VanMeter, and J. P. Rauschecker, “Preserved functional spe-cialization for spatial processing in the middle occipital gyrusof the early blind,” Neuron, vol. 68, no. 1, pp. 138–148, 2010.
[17] M. Bedny, H. Richardson, and R. Saxe, ““Visual” cortexresponds to spoken language in blind children,” The Journalof Neuroscience, vol. 35, no. 33, pp. 11674–11681, 2015.
[18] C.C.H.Chan,A.W.K.Wong,K.H.Ting, S.Whitfield-Gabrieli,J. He, and T. M. C. Lee, “Cross auditory-spatial learning inearly-blind individuals,” Human Brain Mapping, vol. 33,no. 11, pp. 2714–2727, 2012.
[19] J. Föcker, A. Best, C. Hölig, and B. Röder, “The superiority invoice processing of the blind arises from neural plasticity atsensory processing stages,” Neuropsychologia, vol. 50, no. 8,pp. 2056–2067, 2012.
[20] G. Cappagli, S. Finocchietti, E. Cocchi, and M. Gori, “Theimpact of early visual deprivation on spatial hearing: a com-parison between totally and partially visually deprived chil-dren,” Frontiers in Psychology, vol. 8, p. 467, 2017.
[21] N. Raz, A. Amedi, and E. Zohary, “V1 activation in congeni-tally blind humans is associated with episodic retrieval,” Cere-bral Cortex, vol. 15, no. 9, pp. 1459–1468, 2005.
[22] M. Bedny, A. Pascual-Leone, D. Dodell-Feder, E. Fedorenko,and R. Saxe, “Language processing in the occipital cortex ofcongenitally blind adults,” Proceedings of the National Acad-emy of Sciences of the United States of America, vol. 108,no. 11, pp. 4429–4434, 2011.
10 Neural Plasticity

[23] M. Bedny, A. Pascual-Leone, S. Dravida, and R. Saxe, “A sen-sitive period for language in the visual cortex: distinct patternsof plasticity in congenitally versus late blind adults,” Brain andLanguage, vol. 122, no. 3, pp. 162–170, 2012.
[24] M. C. Murphy, A. C. Nau, C. Fisher, S. G. Kim, J. S. Schuman,and K. C. Chan, “Top-down influence on the visual cortex ofthe blind during sensory substitution,” NeuroImage, vol. 125,pp. 932–940, 2016.
[25] Y. Liu, C. Yu, M. Liang et al., “Whole brain functional connec-tivity in the early blind,” Brain, vol. 130, no. 8, pp. 2085–2096,2007.
[26] C. Yu, Y. Liu, J. Li et al., “Altered functional connectivity ofprimary visual cortex in early blindness,” Human Brain Map-ping, vol. 29, no. 5, pp. 533–543, 2008.
[27] H. Burton, A. Z. Snyder, andM. E. Raichle, “Resting state func-tional connectivity in early blind humans,” Frontiers in Sys-tems Neuroscience, vol. 8, p. 51, 2014.
[28] D. Wang, W. Qin, Y. Liu, Y. Zhang, T. Jiang, and C. Yu,“Altered resting-state network connectivity in congenitalblind,” Human Brain Mapping, vol. 35, no. 6, pp. 2573–2581,2014.
[29] M. Pelland, P. Orban, C. Dansereau, F. Lepore, P. Bellec, andO. Collignon, “State-dependent modulation of functional con-nectivity in early blind individuals,” NeuroImage, vol. 147,pp. 532–541, 2017.
[30] K. E. Watkins, A. Cowey, I. Alexander et al., “Language net-works in anophthalmia: maintained hierarchy of processingin ‘visual’ cortex,” Brain, vol. 135, no. 5, pp. 1566–1577,2012.
[31] F. Hou, X. Liu, Z. Zhou, J. Zhou, and H. Li, “Reduction ofinterhemispheric functional brain connectivity in early blind-ness: a resting-state fMRI study,” BioMed Research Interna-tional, vol. 2017, Article ID 6756927, 8 pages, 2017.
[32] D. K. Jones, M. R. Symms, M. Cercignani, and R. J. Howard,“The effect of filter size on VBM analyses of DT-MRI data,”NeuroImage, vol. 26, no. 2, pp. 546–554, 2005.
[33] C. G. Yan, X. D. Wang, X. N. Zuo, and Y. F. Zang, “DPABI:Data Processing & Analysis for (Resting-State) Brain Imag-ing,” Neuroinformatics, vol. 14, no. 3, pp. 339–351, 2016.
[34] M. Xia, J. Wang, and Y. He, “BrainNet viewer: a network visu-alization tool for human brain connectomics,” PLoS One,vol. 8, no. 7, article e68910, 2013.
[35] N. L. Reislev, T. B. Dyrby, H. R. Siebner, R. Kupers, andM. Ptito, “Simultaneous assessment of white matter changesin microstructure and connectedness in the blind brain,”Neural Plasticity, vol. 2016, Article ID 6029241, 12 pages,2016.
[36] G. K. Aguirre, R. Datta, N. C. Benson et al., “Patterns of indi-vidual variation in visual pathway structure and function inthe sighted and blind,” PLoS One, vol. 11, no. 11, articlee0164677, 2016.
[37] R. Manara, V. Citton, P. Maffei et al., “Degeneration andplasticity of the optic pathway in Alström syndrome,” Amer-ican Journal of Neuroradiology, vol. 36, no. 1, pp. 160–165,2015.
[38] A. Jiang, J. Tian, R. Li et al., “Alterations of regional spontane-ous brain activity and gray matter volume in the blind,”NeuralPlasticity, vol. 2015, Article ID 141950, 12 pages, 2015.
[39] R. M. Beatty, A. A. Sadun, L. E. H. Smith, J. P. Vonsattel, andE. P. Richardson Jr, “Direct demonstration of transsynapticdegeneration in the human visual system: a comparison of
retrograde and anterograde changes,” Journal of Neurology,Neurosurgery & Psychiatry, vol. 45, no. 2, pp. 143–146, 1982.
[40] V. D. Bohbot, J. J. B. Allen, A. Dagher et al., “Role of the para-hippocampal cortex in memory for the configuration but notthe identity of objects: converging evidence from patients withselective thermal lesions and fMRI,” Frontiers in Human Neu-roscience, vol. 9, p. 431, 2015.
[41] M. Bernier, C. Gauvreau, D. Theriault, S. Madrolle, J. F.Lepage, and K. Whittingstall, “Increased BOLD activation inthe left parahippocampal cortex after 1 year of medical school:an association with cumulative verbal memory learning,” Neu-roReport, vol. 27, no. 1, pp. 45–49, 2016.
[42] D. W. Campbell, M. G. Wallace, M. Modirrousta, J. O. Poli-meni, N. A. McKeen, and J. P. Reiss, “The neural basis ofhumour comprehension and humour appreciation: the rolesof the temporoparietal junction and superior frontal gyrus,”Neuropsychologia, vol. 79, Part A, pp. 10–20, 2015.
[43] W. Li, W. Qin, H. Liu et al., “Subregions of the human superiorfrontal gyrus and their connections,” NeuroImage, vol. 78,pp. 46–58, 2013.
[44] M. Carbon, Y. Ma, A. Barnes et al., “Caudate nucleus: influenceof dopaminergic input on sequence learning and brain activa-tion in Parkinsonism,” NeuroImage, vol. 21, no. 4, pp. 1497–1507, 2004.
[45] P. Gombkötő, A. Rokszin, A. Berényi et al., “Neuronal code ofspatial visual information in the caudate nucleus,” Neurosci-ence, vol. 182, pp. 225–231, 2011.
[46] B. A. Anderson, H. Kuwabara, D. F. Wong et al., “Linkingdopaminergic reward signals to the development of attentionalbias: a positron emission tomographic study,” NeuroImage,vol. 157, pp. 27–33, 2017.
[47] B. D. Peters, P. R. Szeszko, J. Radua et al., “White matter devel-opment in adolescence: diffusion tensor imaging andmeta-analytic results,” Schizophrenia Bulletin, vol. 38, no. 6,pp. 1308–1317, 2012.
[48] W. J. Moon, J. M. Provenzale, B. Sarikaya et al., “Diffusion-ten-sor imaging assessment of white matter maturation in child-hood and adolescence,” American Journal of Roentgenology,vol. 197, no. 3, pp. 704–712, 2011.
[49] Q. J. Yap, I. Teh, P. Fusar-Poli, M. Y. Sum, C. Kuswanto, andK. Sim, “Tracking cerebral white matter changes across thelifespan: insights from diffusion tensor imaging studies,” Jour-nal of Neural Transmission, vol. 120, no. 9, pp. 1369–1395,2013.
[50] M. Rubinov and O. Sporns, “Complex network measures ofbrain connectivity: uses and interpretations,” NeuroImage,vol. 52, no. 3, pp. 1059–1069, 2010.
[51] S. J. Teipel, A. L. W. Bokde, T. Meindl et al., “White mattermicrostructure underlying default mode network connectivityin the human brain,” NeuroImage, vol. 49, no. 3, pp. 2021–2032, 2010.
[52] C. M. Bauer, G. V. Hirsch, L. Zajac, B. B. Koo, O. Collignon,and L. B. Merabet, “Multimodal MR-imaging reveals large-scale structural and functional connectivity changes in pro-found early blindness,” PLoS ONE, vol. 12, no. 3, articlee0173064, 2017.
[53] O. Collignon, G. Vandewalle, P. Voss et al., “Functional spe-cialization for auditory-spatial processing in the occipital cor-tex of congenitally blind humans,” Proceedings of the NationalAcademy of Sciences of the United States of America, vol. 108,no. 11, pp. 4435–4440, 2011.
11Neural Plasticity

[54] L. Heine, M. A. Bahri, C. Cavaliere et al., “Prevalence ofincreases in functional connectivity in visual, somatosensoryand language areas in congenital blindness,” Frontiers in Neu-roanatomy, vol. 9, p. 86, 2015.
[55] W. Qin, Y. Xuan, Y. Liu, T. Jiang, and C. Yu, “Functional con-nectivity density in congenitally and late blind subjects,” Cere-bral Cortex, vol. 25, no. 9, pp. 2507–2516, 2015.
[56] J. Zhuang, D. J. Madden, X. Duong-Fernandez et al., “Lan-guage processing in age-related macular degeneration associ-ated with unique functional connectivity signatures in theright hemisphere,” Neurobiology of Aging, vol. 63, pp. 65–74,2018.
[57] J. Guardia-Olmos, D. Zarabozo-Hurtado, M. Peró-Cebollero,E. Gudayol-Farré, F. R. Gómez-Velázquez, and A. González-Garrido, “Analysis of pseudohomophone orthographic errorsthrough functional magnetic resonance imaging (fMRI),”The Spanish Journal of Psychology, vol. 20, article E74, 2017.
[58] N. Sollmann, N. Tanigawa, F. Ringel, C. Zimmer, B. Meyer,and S. M. Krieg, “Language and its right-hemispheric distribu-tion in healthy brains: an investigation by repetitive transcra-nial magnetic stimulation,” NeuroImage, vol. 102, Part 2,pp. 776–788, 2014.
[59] S. Bookheimer, “Functional MRI of language: new approachesto understanding the cortical organization of semantic pro-cessing,” Annual Review of Neuroscience, vol. 25, no. 1,pp. 151–188, 2002.
[60] W. J. Gehring and D. E. Fencsik, “Functions of the medialfrontal cortex in the processing of conflict and errors,” TheJournal of Neuroscience, vol. 21, no. 23, pp. 9430–9437, 2001.
[61] N. Nishitani, M. Schürmann, K. Amunts, and R. Hari, “Broca’sregion: from action to language,” Physiology, vol. 20, no. 1,pp. 60–69, 2005.
[62] I. Deschamps, S. R. Baum, and V. L. Gracco, “On the role ofthe supramarginal gyrus in phonological processing and verbalworking memory: evidence from rTMS studies,” Neuropsycho-logia, vol. 53, pp. 39–46, 2014.
[63] C. J. Fiebach, M. Schlesewsky, G. Lohmann, D. Y. von Cra-mon, and A. D. Friederici, “Revisiting the role of Broca’s areain sentence processing: syntactic integration versus syntacticworking memory,” Human Brain Mapping, vol. 24, no. 2,pp. 79–91, 2005.
[64] H. Burton, R. J. Sinclair, and D. G. McLaren, “Cortical activityto vibrotactile stimulation: an fMRI study in blind and sightedindividuals,” Human Brain Mapping, vol. 23, no. 4, pp. 210–228, 2004.
[65] R. J. Sinclair, S. Dixit, and H. Burton, “Recognition memoryfor vibrotactile rhythms: an fMRI study in blind and sightedindividuals,” Somatosensory & Motor Research, vol. 28,no. 3-4, pp. 48–62, 2011.
[66] O. H. Butt, N. C. Benson, R. Datta, and G. K. Aguirre, “Hierar-chical and homotopic correlations of spontaneous neuralactivity within the visual cortex of the sighted and blind,”Frontiers in Human Neuroscience, vol. 9, p. 25, 2015.
[67] Y. Zhou, M. Milham, X. N. Zuo et al., “Functional homotopicchanges in multiple sclerosis with resting-state functional MRimaging,” American Journal of Neuroradiology, vol. 34, no. 6,pp. 1180–1187, 2013.
[68] W. Ding, W. Cao, Y. Wang et al., “Altered functional connec-tivity in patients with subcortical vascular cognitive impair-ment—a resting-state functional magnetic resonance imagingstudy,” PLoS ONE, vol. 10, no. 9, article e0138180, 2015.
[69] M. Ptito, F. C. G. Schneider, O. B. Paulson, and R. Kupers,“Alterations of the visual pathways in congenital blindness,”Experimental Brain Research, vol. 187, no. 1, pp. 41–49, 2008.
[70] F. Tomaiuolo, S. Campana, D. L. Collins et al., “Morphometricchanges of the corpus callosum in congenital blindness,” PLoSONE, vol. 9, no. 9, article e107871, 2014.
[71] D. J. Simmonds, M. N. Hallquist, M. Asato, and B. Luna,“Developmental stages and sex differences of white matterand behavioral development through adolescence: a longitudi-nal diffusion tensor imaging (DTI) study,” NeuroImage,vol. 92, pp. 356–368, 2014.
[72] D. Imperati, S. Colcombe, C. Kelly et al., “Differential develop-ment of human brain white matter tracts,” PLoS One, vol. 6,no. 8, article e23437, 2011.
[73] C. Uggetti, M. G. Egitto, E. Fazzi et al., “Transsynaptic degen-eration of lateral geniculate bodies in blind children: in vivoMR demonstration,” American Journal of Neuroradiology,vol. 18, no. 2, pp. 233–238, 1997.
[74] V. Zachariou, R. Klatzky, and M. Behrmann, “Ventral anddorsal visual stream contributions to the perception of objectshape and object location,” Journal of Cognitive Neuroscience,vol. 26, no. 1, pp. 189–209, 2014.
[75] A. Puce, T. Allison, S. Bentin, J. C. Gore, and G. McCarthy,“Temporal cortex activation in humans viewing eye andmouth movements,” The Journal of Neuroscience, vol. 18,no. 6, pp. 2188–2199, 1998.
12 Neural Plasticity

Hindawiwww.hindawi.com Volume 2018
Research and TreatmentAutismDepression Research
and TreatmentHindawiwww.hindawi.com Volume 2018
Neurology Research International
Hindawiwww.hindawi.com Volume 2018
Alzheimer’s DiseaseHindawiwww.hindawi.com Volume 2018
International Journal of
Hindawiwww.hindawi.com Volume 2018
BioMed Research International
Hindawiwww.hindawi.com Volume 2018
Research and TreatmentSchizophrenia
Hindawi Publishing Corporation http://www.hindawi.com Volume 2013Hindawiwww.hindawi.com
The Scientific World Journal
Volume 2018Hindawiwww.hindawi.com Volume 2018
Neural PlasticityScienti�caHindawiwww.hindawi.com Volume 2018
Hindawiwww.hindawi.com Volume 2018
Parkinson’s Disease
Sleep DisordersHindawiwww.hindawi.com Volume 2018
Hindawiwww.hindawi.com Volume 2018
Neuroscience Journal
MedicineAdvances in
Hindawiwww.hindawi.com Volume 2018
Hindawiwww.hindawi.com Volume 2018
Psychiatry Journal
Hindawiwww.hindawi.com Volume 2018
Computational and Mathematical Methods in Medicine
Multiple Sclerosis InternationalHindawiwww.hindawi.com Volume 2018
StrokeResearch and TreatmentHindawiwww.hindawi.com Volume 2018
Hindawiwww.hindawi.com Volume 2018
Behavioural Neurology
Hindawiwww.hindawi.com Volume 2018
Case Reports in Neurological Medicine
Submit your manuscripts atwww.hindawi.com