alpan network paper no. 23
TRANSCRIPT

alpan _AFRICAN I I LIVESTOCK POLICY ANALYSIS NETV
Network Paper No.23
December 1989
CONSUMPTION OF DAIRY PRODUCTS IN WEST AFRICA:
PAST TRENDS AND FUTURE PROSPECTS
by
Senait Seyoum
Livestock Economics Division
ILCA, Addis Ababa
INTERNATIONAL LIVESTOCK CENTRE FOR AFRICA (ILCA)
P.O. Box 5689, Addis Ababa, Ethiopia • Tel: 61 32 15 • Telex: ADDIS 21 207


Consumption of Dairy Products in West Africa:
Past Trends and Future Prospects
by
Senait Seyoum
This paper draws heavily on on earlier version which appeared as a LED Working Paper
(No. It). The author wishes to thank Addis Anteneh for his encouragement, support and
useful comments.
Thi 8 On©
G1UD-EZY-2T30


Introduction
1. The 1974/76 - 1983/85 period saw a rapid growth in. both aggregate and per caput
consumption of dairy products in West Africa. Aggregate production in the region
grew at lower rates and partly in reflection of this, imports rose fast. In 1983/85 imports,
expressed in liquid milk equivalents (LME), accounted for an average 45% of dairy
consumption in the West African region.
2. Preliminary indications are that much of the consumption of dairy imports in West
Africa occurred in humid and sub-humid areas where most of the countries which
relatively are highly urbanised and have high incomes are located. A priori, this would
indicate an already established market for increased domestic production to capture.
And a recent policy response to the growing importance of dairy imports in total dairy
consumption has been for governments to encourage domestic milk production.
3. In practice, policies of this kind face several limitations. For one thing, there is little
empirical evidence on which to base them. For another, dairy demand and supply
situations are highly heterogeneous within West Africa. For instance, the importance,
pattern and distribution of dairy consumption, and the factors which motivate consumers
to use different types of dairy products or marketing channels vary sharply between
countries, ecological zones, rural and urban areas, and under different economic and
social circumstances. Another limitation relates to the comparative advantage of
domestic milk production. It is often argued that in the particular context of West
Africa, returns to dairying are not as attractive as those from other livestock and
cropping activities. However, there are also indications that for selected areas and
dairy products, cost-reducing investments, improvements in milk processing and
marketing, and appropriate pricing and exchange rate policies could significantly offset
the comparative disadvantage of domestic milk production. In view of the above, it
is difficult to endorse policies for promoting domestic milk production unequivocally
without looking into the specific milk supply and demand situations of West Africa.
4. Against this background, this article proposes to investigate whether critical assumptions
about the nature, scale and location of dairy demand and about the substitutability
of fresh liquid milk for imported dairy products are adequately based to launch milk
production programmes in the moist areas of West Africa. It describes past trends
in dairy production, imports and consumption and examines the evidence on factors
influencing dairy consumption patterns in West Africa. On this basis, it provides
projected 1988 estimates of dairy consumption by product type and origin, by ecological

zone and rural/urban category. It then compares these projections with actual figures
for 1985/87 and draws policy implications for increased dairy consumption and domestic
milk production in West Africa.
Past trends in production, import and consumption
Production trends
5. Data on milk production in Africa are scarce and often unreliable. Very little is in
fact known about the quantity of milk produced, left for calf feeding and human
consumption, processed into different types of dairy products, consumed at home or
sold through formal and/or informal marketing channels.
6. Nevertheless, aggregate FAO milk production statistics provide general indications
about regional production patterns. For the period from 1974/76 to 1985/87, the
following patterns were evident:
(i) A sharp distinction exists between drier and moister areas!/ with respect to levels
of domestic production. Drier areas exhibit relatively higher levels of production.
In 1983/85, the total volume of dairy produce amounted to 1,112,000 t LME2/
in dry areas and to 562,000 t LME in moist areas; the corresponding figures for
1985/87 were 1,070,000 t LME and 575,000 t LME respectively (FAO 1984a, 1985a
and 1987a);
(ii) Some differences are also apparent in the types of dairy products produced in
dry and moist areas. Fresh milk is clearly the major dairy produce in both areas.
Butter and cheese accounted for an average 11% of total 1983/85 dairy production
in dry areas and for 18% in moist areas, suggesting that the latter place relatively
more emphasis on the production of these items than do drier areas (FAO 1984a
and 1985a);
(iii) Between 1974/76 and 1983/85 growth in total dairy output was generally slow
in West Africa (2% p.a.). Over the same period, the growth rate in per caput dairy
production averaged -1% p.a. for the region as whole. Figures for 1985/87 indicate
a further decline in dairy production largely as a result of reduced production
in dry areas and only slight increases in moist areas.

Import trends
7. Imports of milk and milk products in West Africa have been substantial and have grown
fast. In 1983/85, total net imports of milk and milk products into West Africa were
valued at about US$ 266 million (average over 3 years) corresponding to a volume of
1,356,000 t LME. This volume of imports declined to 938,000 t LME in 1985/87 (FAO
1984b, 1985b and 1987b).
8. In sharp contrast to the picture drawn for milk production, moister countries imported
over twice the volume of dairy products imported by drier countries in 1983/85. This
picture appears to have changed in 1985/87 with the moister countries, and more
particularly Nigeria, having substantially cut down on imports (FAO 1984b, 1985b and
1987b).
9. In volume terms, dairy imports grew faster in drier compared to moister countries
during the 1974/76-1983/85 period, their annual growth rates being 12% and 9%
respectively. Furthermore, the growth in dairy imports exceeded by far the estimated
domestic production growth rates in almost all West African countries, suggesting
that increasing dairy demand was mostly met through imports.
Consumption trends
10. Aggregate consumption of milk and milk products in West Africa can roughly be
estimated by adding up aggregate dairy production and net import figures. On this
basis, aggregate dairy consumption in West Africa amounted to about 3 million t
LME in 1983/85 and to 2.6 million t LME in 1985/87.
11. Although these totals were almost equally distributed between drier and moister
areas, a sharp division can be seen in the extent to which dairy consumption in these
areas was supplied by domestic production or imports. While the majority of West
African countries were importers of dairy products, in 1983/85, net dairy imports
accounted for an average 62% of total dairy consumption in moister areas and for
only 28% of consumption in drier areas. The equivalent proportions for 1985/87 were
46% and 29% respectively.
12. Per caput consumption levels suggest that dairy consumption patterns roughly follow
production patterns though average per caput consumption of domestically produced
milk appears to be declining in most of West Africa. In 1983/85 per caput dairy

consumption averaged 11 kg LME in moister areas and 45 kg LME in drier areas.
Although per caput consumption was relatively low in moister areas, its growth rate
over the 1975-1985 decade, at 2% p. a., was the same as that calculated for the drier
areas during the same period. Thus, it seems that milk consumption has gained
importance in moister areas despite the considerable constraints posed on livestock
production (e.g. tsetse). But one should also stress that dairy imports in moist areas
were far more significant in total consumption than domestic milk production.
13. The trends outlined above give useful first indicators for what may be characteristic
differences in consumption between dry and moist zones of West Africa. The following
section will look more specifically at some of the factors which have affected
consumption in the region.
Factors determining aggregate demand for dairy products
Demographic trends
14. When estimating milk consumption in West Africa, it is important to take account
of the regional distribution and growth of human populations. Population growth tends
to increase the potential demand for milk. Similarly, since urban consumption is often
supplied through imports rather than domestic production, urbanisation can be expected
to boost the demand for imported dairy products, provided that incomes increase.
15. Based on UN population statistics, on Jahnke (1982) and on a review of "the allocation
of urban populations in West Africa to different ecological zones" (ILCA 1987), Table
1 presents projected 1988 estimates of rural and urban populations living in different
ecological zones of West Africa.
16. Thus, in 1988 about 190 million people were living in West Africa. While West Africa
as a whole was experiencing a major transformation from a largely rural to an urban
area, urban populations predominated in the sub-humid and humid zones where most
of the countries with relatively high incomes are located. Nigeria alone accounted
for 100% of the highland urban population, for almost 80% of the urban population
in the sub-humid zone, and for over 55% of the urban population in the humid zone.
Compared with these areas, arid and semi-arid zones remained very much rural.

Table 1. Aggregate distribution of West African human populations in 1988 by ecological
zone and rural/urban category (thousands and percentages)
Population living in
Arid Semi-arid Sub-humid Humid Highlands Total
zone zone zone zone
Rural 'mm 11898 51514 27023 45645 3165 139245
population (%) (91%) (82%) (65%) (66%) (92%) (73%)
Urban•(ii)ii
1177 11150 14905 23498 260 50990
population (%) (9%) (18%) (35%) (34%) (8%) (27%)
Total
13075 62664 41928 69143 3425 190235
population (%) (7%) (33%) (22%) (36%) (2%) (100%)
Source: Own calculations based on data from the UN (1986), Jahnke (1982) and ILCA
(1987).
17. Between 1980 and 1985, human populations increased by an average rate of 2.6%
in drier areas and by 3.2% in moister areas of West Africa, while urban population
growth rates in these areas approached 5 and 6% respectively (UN 1986). Over the
1974/76-1983/85 period, aggregate dairy consumption in West Africa increased at
an annual rate of 4% in drier areas and 6% in moister areas (FAO 1976a, 1976b, 1985a
and 1985b). Part of this increase in dairy consumption can be attributed to population
growth and to rapid urbanisation, especially in the case of moister areas.
Changes in incomes
18. Changes in income can be expected to cause significant shifts in the nature, scale
and location of demand for milk. One indicator of differences in expenditure patterns
of various income groups is provided by the calculation of the ratio of the value of
food and milk expenditures to total household consumption expenditure. Availnble
information from consumer surveys for selected West African countries indicates
that the proportion of total household expenditure spent on food declines as income
rises.
19. Though variable among countries and income groups located in differing areas, the
average share of expenditure on dairy products by urban households in West Africa
appears to be low, approximating 2% (within a range of 0.3% and 4%) as against 44%
for the proportion spent on all food items. The findings also suggest that, up to certain
income levels, increasing incomes do not necessarily result in increased expenditure
on dairy products.
20. To give but a few examples, the FAO/ISCDD (1975) reports that the income elasticity
of demand for all milk in Zaria (Nigeria) was 0.6 which implies that a 10% rise in
income in this area will result in a less than proportionate increase in milk consumption
of 6%. Household survey information for urban Chad (Enque'te budget 1972) also shows
that, at very low income levels « 10,000 FCFA/month), relative expenditure on milk
actually falls as income rises, suggesting that there are other food and/or household
priorities to fulfill. For income levels exceeding 10,000 FCFA/month, the proportion
of expenditure on milk increases consistently with income while at the same time
there appears to be a switch from curd towards more fresh milk consumption, and
supplementation with condensed milk as income goes up.
21. Thus, available evidence from consumer surveys in West Africa, though not providing
a definite picture about the exact relationship between income and milk consumption,
suggests that dairy consumption patterns are influenced by income growth and its
distribution between differing regions and consumer groups. Furthermore, past trends
in milk consumption and aggregate statistics for West Africa indicate that the demand
for dairy products rises with income. According to FAO 1975-2000 projections, income
elasticities of demand for milk are positive and appear to lie between 0.50 and 1.20
in most of West Africa (Jahnke 1982). From 1965 to 1980 the average annual growth
rate in GDP approximated 3.3% in sub-Saharan Africa though this sharply declined
to 0.4% between 1980 and 1987 (World Bank 1989). Part of these increases in incomes
would have occurred in West Africa, especially in the 1960s and 1970s when coastal
countries of the region were very prosperous. Purely in terms of these income
developments, it can thus be assumed that dairy demand in West Africa has increased
in the last two decades.
22. But even if one accepts this general conclusion, there is a need to take account of
the differential response of dairy demand to income growth and its distribution, and
to changes in supply and demand situations. In many West African countries, purchasing
power is concentrated in urban areas and government income policies have largely
been unsuccessful in significantly narrowing inter-sectoral income gaps. Under such
circumstances, one would hardly expect dairy demand to increase without any
disparities.
23. In fact, evidence for West Africa suggests that, except- for traditionally milk consuming
areas, dairy demand is strongly biased towards urban areas and relatively high income
consumers. For instance, consumer survey data for Nigeria suggest that self employed
households with lower incomes, spend more on food than wage earners but less on
dairy products (Nigeria 1983). In Mali, those employed in the private sector appear
to be the main consumers of milk (OMBEVI 1976). In cSte d'lvoire, civil servants
and qualified employees were found to be the major consumers of yoghurt, cheese
and fresh milk although consumption of packed milk was common among all
occupational groups in Abidjan (Enquete budget consommation 1979).
24. It is also important to note that income changes in West Africa have often been
accompanied by changes in the actual structure and composition of milk demand.
With rapid urbanisation and income growth, a certain attraction has taken form for
imported dairy products like dry, evaporated and condensed milk, which are now quite
widely consumed in urban areas. And there would appear to be good reasons for the
preference accorded such items. For one thing, they are more readily and regularly
available than the often small and seasonal volumes of milk supplied by the domestic
sector. For another, they can be processed into forms which can be purchased easily,
with the added advantages of better hygiene and preservation. But it seems unlikely
that their spread would have been so rapid had more regular, plentiful and better
quality local supplies been available or had past developments in income and policy
not been as favourable to their consumption.
25. On the whole, in the last two decades, West Africa's dairy demand has been
characterized by a virtual stagnation of rural milk consumption, even in the
traditionally milk producing areas, and by changes in the structure of demand which
have taken place in urban areas where incomes are higher. The 1970s was a period
of relative prosperity for some West African countries and most of urban demand
was then met through dairy imports which were mainly consumed by middle and high
income groups. In recent years, income growth has slowed down and the prosperous
oil-producing countries and primary commodity exporters of the 70s are now facing
sharp falls in world prices for their exports, the build-up of external debts and foreign
exchange shortages. It it is thus highly likely that large reductions in dairy imports
will occur in the future despite the fact that populations are large and urbanisation
increasing in West Africa. This will probably have a more negative impact on milk
consumption by lower income groups who have come to be used to imported dairy
products and who have no local milk supplies to fall back on.

Prices
26. Prices reflect not only underlying market forces but also qualitative differences in
consumption and in policy interventions, the effects of which are hard to quantify.
In the particular context of West Africa, differences in consumption habits, in milk
quality, in marketing and in price policies, render the measurement of milk consumer
price response a difficult task. An additional problem is the lack of reliable cross
country price data over a sufficient period of time. The following discussion is
therefore more indicative rather than in any way conclusive and will look, very
generally, at domestic and international dairy prices and at related developments
which might have influenced dairy demand in West Africa.
(i) Consumer prices
27. Prices are an important determinant of dairy demand. The little evidence that is
available on milk consumer prices in West Africa does not allow to discern a particular
direction to generalize for the region as a whole. Table 2 gives a few examples of
consumer and border equivalent prices per kg of LME2/ for some dairy products in
a number of West African countries. For convenience, all prices in the table are
expressed in US dollars converted at the official exchange rates prevailing in the
countries and years in question (FAO 1985b). Border price equivalents are unit c.i.f
import values calculated from FAO trade yearbooks (various years). For reconstituted
milk and yoghurt, the calculation of border prices takes into account the c.i.f price
of dry milk and the international f.o.b price of butter-oil in the corresponding years,
and the costs of marketing, processing and recombining milki/. No adjustments are
made for overvaluation of currencies and inflation.
28. Table 2 highlights the difficulties involved in an assessment of milk prices in West
Africa. In all four of the countries considered, the domestic retail prices of imported
dairy products were higher than their border price equivalents, implying that the
consumption of these products has been taxed. However, given the inadequacy of
the data on which the calculations in Table 2 are based, it is difficult to accept this
conclusion without reservations. The actual price situation may for instance be
different if more accurate, product and country specific, figures on processing and
marketing costs were used.

Table 2. Consumer and border equivalent prices of milk products in some West African
countries (in US $ per kg of LME).
Country
nature of
Consumer prices on: a>
Border
equivalentYear Local Official
milk product market market prices
Niger
- Local fresh milk 1982/83 0.46 n.R5
- Yoghurt b> 1982/83 0.59-0.68 0.79 0.59
Mali
- Local fresh milk 1984 0.52 0.46-
- Reconstituted milk 1983 -0.41 0.33
- Dry milk in cans 1983 - 0.17 0.14
C6te d'lvoire c>
- Local fresh milk 1985 11.39 - -
- Pasteurised and reconst. 1985 0.33 -0.26
- Sterilised milk 1985 0.58 -0.47
- Yoghurt 1985 0.54-0.73 - 0.41-54
Nigeria
- Local fresh milk d> 1981 0.75 1.117
- Local sour milk e> 1986 ii.i,ii - -
- Evaporated milk t> 1985 1.53 1.27 0.77
a> Urban retail prices of milk sold by traders direct to consumers (local market) or by
government dairies (official market).
b> Women in Niamey buy milk powder to manufacture yoghurt at home. Yoghurt of this
type is sold on a per ladle basis or in gourds (Sidibe 1982).
c> Average retail prices of various brands of pasteurised, reconstituted and sterilised
milk in different department stores. For yoghurt, the minimum and maximum of
observed prices are given (Atse-Atse 1987).
d> For fresh milk, the local market price is an average of retail prices in Funtua, Gusau,
Gombe, Abet and Kurimin Biri; the official market price is an average of factory gate
prices for milk processed by six government dairies (Nwoko 1986).
e> For sour milk, the 1986 litre price in Zonkwa rural town is indicated (Waters-Bayer
1986).
f> For evaporated milk, the local market price is the 1985 retail price of unsweetened
evaporated milk in Lagos (World Bank 1 987); the official market price is the 1984
government subsidised price of "Peak" evaporated milk to public institutions in Anambra
State (Nwoko 1986).
Sources: (i) von Massow (1985); (ii) Sidibe (1982); (iii) Atse-Atse (1987); (iv) Nwoko (1986);
(v) World Bank (1987); (vi) Waters-Bayer (1986).

29. In spite of their limitations, the data in Table 2 indicate that milk consumer prices
have varied widely across countries, markets and types of dairy products and over
time. In the cases of Mali and Cote d'lvoire, the prices of reconstituted and pasteurised
milk were lower than those of local fresh milk. On the other hand, sterilised milk and
yoghurt in Cote d'lvoire were expensive products while in Mali, dry milk in cans was
the cheapest form of dairy consumption. In Niger and Nigeria, prices of processed
local, and even imported dry milk, on the official market were also higher than prices
charged on the local market. In fact, the price of dry milk-based yoghurt sold on the
local market in Niamey was not only lower than its official market price but also close
to its border price equivalent. It is also to be noted that in some localities of Nigeria,
sour milk appears to be cheaper than fresh milk. But evaporated milk was, in all cases,
the most expensive product in Nigeria even if its price was lower on the official market.
30. These data can be supplemented with other information which show that the absolute
price of milk has often been high in West Africa. For example, Bachmann (1979) reports
that the production price of a litre of milk varied from 12% to 111% of the 1978 average
daily wages of skilled and and unskilled labourers in the urban areas of Chad and Niger.
Instances where powdered milk for infant feeding was overdiluted in order to make
it last longer have been observed in CSte d'lvoire and Ghana (FAO 1979). von Massow
(1989) also maintains that consumer welfare gains, resulting from the Malian
government's dairy import policy (e.g. subsidized retail prices on some imported items),
have been relatively small and have mainly been captured by higher income urban
consumers. Thus, it would appear that milk consumer prices in most of West Africa
are beyond the reach of the vast majority of urban, let alone rural, consumers.
31. Furthermore, the price of milk has been high relative to other food staples. As an
example, rough estimates by ILCA (1979) show that milk/cereals price ratios in Ghana,
Senegal and Mali ranged from 8.3 to 4.5 in 1975-76. Given the growing importance
of cereals in West African food diets, it is unlikely that this situation has been reversed
in recent years. However, it is worth noting that these price ratios were more favourable
for traditionally milk producing/consuming countries.
32. To a large extent, such prices are the result of West African governments' market,
trade and exchange rate policies. A number of studies have shown that government
policies, which result in subsidizing urban milk consumption with low priced imported
milk and in overvaluing exchange rates, have stimulated the demand for imported
dairy products in West Africa. According to von Massow (1989), as much as a third
of the changes in commercial dairy imports in sub-Saharan Africa during the 1970s
could be explained by factors other than increases in human population and per capita
income. These other factors were mainly related to import prices and government
10

policies. For the period 1984-86, Williams (1989) calculated average nominal protection
coefficients (NPCsl£/ of 0.59 and 3.27 for milk consumers in Mali and Nigeria
respectively, suggesting that consumers were subsidized in Mali. In Nigeria, consumers
were taxed in spite of the provision of milk at subsidized prices to public institutions
like schools, cooperatives and department stores (Nwoko 1986).
33. Trade and exchange rate policies pursued by West African governments should also
have favoured the consumption of imported dairy products, often at the expense of
locally produced milk products. For instance, explicit or implicit tariffs on imports,
though variable between countries and categories of milk products, have been kept
low on items like condensed and evaporated milk in Cote d'lvoire (Atse-Atse 1987),
in Mali (von Massow 1989) and in Nigeria (Nwoko 1986). At the same time, the
overvaluation of exchange rates, prevalent in several West African countries, will
have reduced the costs of dairy imports relative to domestically produced milk. The
failure of some West African countries to raise prices of dairy products in line with
their high inflation rates may also have contributed to declines in real domestic prices
and to increases in dairy imports.
34. While the foregoing implies that West African government policies have generally
favoured low consumer prices for imported milk products, it does not say much about
their actual effects on dairy consumption. The exact extent to which policy interventions
have influenced dairy prices, and subsequently consumption, has in fact not been
sufficiently analyzed. Only a few empirical studies, and these dealing mostly with
imports in a few West African countries, are available on these issues.
35. Despite the above, the evidence appears conclusive that government policies in West
Africa have, in the past, generated patterns of urban milk consumption which have
proved to be incompatible with domestic capacity to supply milk. In many cases, dairy
imports have enabled governments to keep prices to urban consumers relatively low,
without in any way improving the efficiency of local marketing channels or increasing
local milk supply.
36. All this underlines the need for considering differences in consumer preferences, in
the share of milk in consumption baskets, in the constraints to existing dairy production
systems, in marketing channels etc, when designing and implementing policies that
aim to influence dairy consumption through prices.
11

(ii) Internationa) prices
37. Changes in international prices for dairy products can be expected to affect dairy
import levels. As indicated earlier, a major feature of West African dairy consumption
has been a widespread tendency to import dairy products from developed countries.
World trade in dairy products is dominated by the EEC which, in 1985, accounted for
over 50% of world dairy exports, this proportion rising to as much as 70% for skim
milk powder (Raikes 1986).
38. In such a context, an important determinant of the pattern of world dairy trade relates
to EEC dairy policies. Thus, OECD (1987) simulation models showed that the impact
of reducing EEC assistance to the dairy sector by a modest 10% would be a 2.81%
rise in the world price of milk in 1979-1981. It is notable that the expected rise in
world prices in this study was greatest for milk among all other subsidized animal
products considered.
39. In the late 1970s and early 1980s, the world dairy market was characterised by heavy
EEC export surpluses and depressed prices for dairy products. As a case in point, the
world price of skim milk powder declined from US$ 800/t in 1976 to US$ 600/t in
1985 (Atse-Atse 1987). The late 1980s saw substantial changes in the world dairy market;
total world milk supplies decreased and in the first half of 1988 the price of skim milk
powder rose to a level approaching double the GATT minimum export price of US$
900/t (IDF 1988). In this period, EEC policies had acted to restrain dairy production
and to restore market balance through lower production quotas and reduced stocks
of butter, cheese and particularly skimmed milk powder.
40. Such developments appear to have influenced import demand in West Africa where
the aggregate volume of dairy imports more than doubled between 1974/76 and 1983/84
and fell sharply after 1983/85 as prices of dairy products rose on the world market
(FAO 1976b, 1985b and 1987b). Thus, in terms of international prices, the overall outlook
for West Africa is one of declining dairy imports, with the likelihood that domestic
milk production will grow in some countries to meet part of the unfulfilled demand
that will arise from reduced imports. Whether increased domestic production will
succeed in achieving this will largely depend on West African governments' commitment
and ability to design, adopt and implement appropriate policies.
12

Aggregate 1988 dairy demand
Levels of milk consumption
41. A quantitative assessment of aggregate dairy demand by ecological zone and by
rural/urban category requires precise information on milk consumption levels, human
populations, incomes and prices in the urban and rural areas of different ecological
zones. Detailed information of this kind is not available for West Africa. The following
estimation of levels of milk consumption in different areas of West Africa is mainly
based on aggregate FAO dairy production and import figures. As such, the estimates
should only be taken as indicative.
42. The major assumptions made in estimating rural/urban differences in per caput milk
consumption within each of the ecological zones of West Africa were that:
o Milk consumption is conditioned by milk availability which is determined by domestic
production and imports;
o Local milk production is predominantly rural and follows the distribution of milk
producing livestock populations by ecological zone;
o Consumption of imported dairy products follows the distribution of urban populations
by ecological zone since evidence for West Africa shows that a substantial proportion
of dairy imports (as much as 80% according to Mbogoh 1984) is consumed in urban
areas;
o Differences in the importance of milk in food consumption; in the availability and
marketing of local and imported milk products; in the state of storage, transport
and distribution prevailing in differing areas, determine the volume of milk actually
consumed in rural and urban areas of each ecological zone.6/
43. Average rural/urban per caput milk consumption levels, estimated on the basis of these
assumptions, are presented in Table 3. Since FAO milk production and import data,
for the period after 1985, were not available at the time of this study, the estimates
were calculated for 1983/85.
13

Table 3. Estimates of rural and urban per caput milk consumption levels in different
ecological zones of West Africa 1983/85.
Consumption balance a> Human populations Per caput consumption
('000 t LME) C000) (kg LME/pers.)
Ecological
zone Rural Urban Rural Urban Rural Urban Allb>
Arid 611 27 11025 896 55 30 54
Semi-arid 583 288 46938 9117 12 3 2 16
Sub-humid 197 314 24987 11850 8 27 14
Humid 259 421 41402 19048 t; 22 1 1
Highlands 16 12 2857 2117 6 58 9
All zones 1666 1062 127209 41118 13 26 16
a> Rural consumption balance calculated as aggregate 1983/85 milk production net of
losses (10% of production) and of production marketed in urban areas, plus imports
reaching rural areas.
Urban consumption balance calculated as net dairy imports in 1983/85 minus losses
(10% of imports) and imports marketed in rural areas plus production marketed in
urban areas.
Proportions of domestic production and net dairy imports marketed in urban and rural
areas based on certain considerations regarding the availability and marketing of milk
in different ecological zones of West Africa (see footnote 6/ at end of text for more
details).
b> Per caput consumption in urban and rural areas i.e. urban and rural consumption balances
divided by total population.
Source: Own calculations based on FAO (1985a and 1985b) and Jahnke (1982).
14

44. Though only approximations, these results highlight some of the prominent features
of milk consumption in West Africa, namely that:
(i) except possibly for the arid zone, overall milk consumption levels are low, by
developed and even by developing country standards;
(ii) imbalances in consumption occur between ecological zones, average milk
consumption levels being highest in the arid zone and lowest in the highland and
the humid zones;
(iii) the arid zone excluded, per caput consumption in all other zones is highest in
urban areas. On average, urban communities in West Africa consume twice as
much milk per caput as rural communities;
(iv) aggregate milk availability is diluted by population pressure, particularly in the
densely populated urban areas of the humid and sub-humid zones where per caput
milk consumption levels are relatively low.
Scale and nature of 1988 demand
45. Using the information in Table 1 on West African human populations in 1988 and
assuming that 1983/85 milk consumption levels will prevail until 1988, aggregate 1988
dairy demand by ecological zone and rural/urban category, can be roughly estimated.
On this basis, total 1988 demand for milk and milk products in West Africa amounts
to about 3.1 million t LME, almost 60% of this total occurring in rural areas and 40%
in urban areas.
46. Having got an idea of the scale of dairy demand in 1988, there is a need to determine
the composition of this demand. This cannot be done with any precision, but by using
aggregate FAO data and other sources of information, one can arrive at some
approximate figures for the distribution of dairy demand between different products.
IS

The following percentages were derived from product specific aggregate 1983/85 FAO
data for predominantly moist and dry countries of West Africa (FAO 1980b and 1985b):
Dry Moist All Dry Moist All
zone zone zones zone zone zones
Domestic prodE
(% of total LME)
Dairy imports
(% of total LME)
Fresh milk* 50 32 44 Fresh milk 2 2 2
Sour milk* 4 0 52 44 Dried milk 77 34 4S
Butter a 10 7 Evap./Cond.milk 8 61 44
Cheese 4 6 5 Butter/Ghee 12 2 6
Cheese and curd 0 1 1
Total
Total 100 100 100
* As FAO makes no distinction between sour and fresh milk production it is assumed that
50% of liquid milk production is consumed as fresh (largely by pastoralists and people
in dry areas) and the remaining 50% as sour (by urban consumers of the moist zone and
rural consumers of the dry zone).
47. Given these proportions, aggregate 1988 dairy demand in West Africa is disaggregated
by product type and origin, by ecological zone and by rural/urban category
in Figure 1. As is evident, dry and moist zones differ in the extent to which they
have resorted to imported and/or locally produced dairy products and have directed
available supply to urban and/or rural areas.
48. In the dry zone, a substantial amount of demand is supplied through domestic production
of fresh and sour milk which are largely consumed in rural areas. Dairy imports in
this zone mainly consist of dry milk, but are in no way as substantial as in the moist
zone. Nevertheless, it appears that imports of dry milk, a product usually reconstituted
into liquid milk, used for infant feeding and often donated as food aid, are widely
consumed in urban as well as in rural areas of the dry zone.
49. Unlike the dry zone, the moist zone primarily relies on imports of evaporated/condensed
and dry milk to satisfy its predominantly urban demand. Several studies also indicate
that the consumption of evaporated/condensed milk in moister areas is much higher
than that of dry milk. In Nigeria, for example, about 50% of the total population in
1978, mainly tea and coffee drinkers above 15 years of age, were assumed to be potential
consumers of evaporated tinned "Peak" milk (Claesson 1978).
16

Figure 1. Estimated distribution of aggregate 1988 demand for milk and milk-products
in West Africa.
Urbon demand I "j Rural demand
Typea of dairy products
MOIST ZONE r
Dairy imports
W///A
W////////A
Dry milk
Evap./cond. mill
Y/A 1
-a
\Butter/ghea
i
1 Cheese and curd i
0 Fresh milk ■
□
J-ocoJ_ products
Fresh milk
Sour milk
Butter/ghee
Cheese
a l
1 B az zd
□ D
D D
■ I I I I I I I I I I I 1 I I I I , I • I , I , I , I , I ,1600 MOO 1200 1000 000 600 400 200 0 0 200 400 600 BOO 1000 1200 1400 1600
Volume 0000 t LME) Volume ('000 t LME)
Source: Adapted from data in Tables 1 and 4.
50. Imported fresh milk, butter/ghee, cheese and curd are of minor importance in both
dry and moist zones, their consumption being closely related to consumers' means
and disposition to purchase them. Because of the small quantities involved and of
their generally prohibitive prices, the consumption of these products is often restricted
to classes of higher officials, private sector employees and foreigners in urban areas.
On the other hand, locally produced cheese, butter and ghee are consumed to a greater
extent, but these items are generally produced on a small scale and their consumption
is limited to certain localities and/or ethnic groups (e.g. the Western Yorubas in Nigeria).

Domestically unmet demand
51. Given the preceding picture of dairy demand in West Africa, the question arises as
to how it is to be met. Table 4 relates aggregate 1988 dairy demand estimates to
projected 1988 and actual 1985/87 milk supply figures. Domestic milk supply in 1988
is projected from FAO 1983/85 milk production data, at an assumed annual growth
rate of 2% (the rate that prevailed in West Africa between 1974/76 and 1983/85).
52. The figures in Table 4 give an idea of how milk supply in West Africa has evolved in
relation to dairy demand. Thus, for 1988, the magnitude of dairy demand unmet from
domestic supply is of the order of 1.3 million t LME in West Africa as a whole i.e.
roughly 42% of estimated total 1988 dairy demand. In terms of "domestically unmet
demand", the largest deficit is observed in the moist zone, no doubt reflecting the
low level of domestic milk supply in moister areas, and the traditional predominance
of livestock and low human population densities in the drier areas of the region.
53. In practical terms, the consumption of milk in the dry zone seems to have been
constrained by the slow growth of domestic milk production and the relatively low
incomes of countries in this zone. Though rural milk consumption has traditionally
been high in drier areas, the 1985/87 figures suggest that this is no more the case.
Compared to 1983/85, dairy imports rose modestly and domestic milk supply declined
substantially in 1985/87. Thus, the outlook for the dry zone is one of a general decline
in milk consumption, with dairy imports meeting a small part of, presumably urban,
dairy demand.
54. The substantial amount of domestically unmet dairy demand, calculated for the moist
zone should be interpreted with caution since a significant portion of total dairy demand
in this zone has until recently been met through imports. In the 1970s and early 1980s,
relatively high income countries located in the moist zone could afford to import dairy
products on a large scale. However, large deficits occur in 1985/87, as dairy imports
decline sharply and domestic milk supply, though increasing, still lags behind demand.
18

Table 4. Projected 1988 dairy demand, supply and deficits in dry and moist zones of West
Africa ('000 t LME)
Dry
zone
Moist
zone
All
zones
Projected 1988 figures a>
Total demand for milk
Domestic milk supply
Domestically unmet demand
1664 1443 3107
1457 354 1811
-207 -1089 -1296
FAQ 1985/87 figures
Total milk availability
Domestic milk supply
Dairy imports
1512 1071 2583
1070 575 1645
442 496 938
Balance 1985/87-1988 b>
Domestic milk supply
Domestically unmet demand
-387
-594
221
-868
-166
-1462
a> Total demand for milk in 1988 as in Figure 1. Figures for domestically unmet demand
are rough estimates calculated by deducting 1988 domestic milk supply from total
1988 demand.
b> Difference between 1988 projections and 1985/87 FAO figures.
Source: Calculations based on FAO (1987a and 1987b), Tables 1 and 3.
Conclusion and policy implications
55. This article has attempted to provide an overall picture of milk consumption patterns
in West Africa and to trace some of the factors which have influenced these patterns
in the past two decades. The most general conclusion that emerges is that West Africa's
dairy consumption situation derives from a variety of sources ranging from the specific
demand and supply conditions of different areas in the region to policies pursued at
both domestic and international levels.

56. The evidence presented suggests that domestic milk supply in West Africa has generally
failed to meet dairy demand, especially rising urban demand, which has mainly been
met through imports. There also appear to be basic differences in the nature and scale
of dairy consumption between rural and urban areas, moist and dry zones, and high
and low income countries and consumers.
57. In drier areas, milk consumption has traditionally relied on local rural dairy produce
mainly in the form of fresh and sour milk. However, recent indications are that this
pattern is changing with urbanisation and the decline of traditional dairying. In moister
areas, milk consumption is predominantly urban and very much dependent on imports.
Here too, milk consumption patterns are changing with the decline in incomes recently
experienced by many West African countries.
58. The picture of milk consumption in West Africa drawn in this paper is obviously not
sufficient to understand the important links existing between milk consumption and
supply in differing areas, and still less to draw policy implications. Clearly, further
research and more detailed information on factors affecting milk consumption patterns
in West Africa are required to come to valid conclusions regarding the future outlook
of milk consumption at a regional level.
59. Nevertheless, some tentative conclusions can be made with respect to the prospects
for meeting dairy demand in West Africa through increased domestic milk production
and/or substitution of local milk products for imported ones. As far as the dry zone
is concerned, the outlook seems bright. If domestic milk production is to be promoted
in this zone, there may at first be a case for protecting already established local milk
producers against heavily subsidized imports. Much could be done through the setting
up of rural milk collection centres to which producers in these areas could sell their
milk at attractive prices. Easier access to credit and to inputs e.g. provision of cattle
feed, veterinary services, cattle breed improvement, and improved milk marketing
and processing facilities, are all crucial issues to be considered if the domestic dairy
sector in this zone is to operate efficiently and increase its output. Traditional milk
producers at present consume/sell most of the milk they get from their low yielding
herds at household/village level. Given some incentives, they could produce reasonably
clean and easily distributed products like fresh and/or sour milk, which will find ready
markets in urban areas. Production growth may, of course, be slow in the initial stages.
But it will have the advantages of fulfilling part of urban demand, of ensuring higher
incomes and milk consumption levels to rural producers and of laying the ground for
a more sustained development of the traditional dairy sector in this zone.
20

60. The scope for increased domestic milk production and import substitution in the moist
zone appears more limited. Considerable constraints to increased domestic milk
production do exist in this zone, some technical (e.g. livestock nutrition, disease and
management problems), others socio-economic (e.g. high costs of domestic milk
production, orientation of urban consumption habits towards imported dairy products,
etc.). However, recent developments in the moist zone suggest increased opportunities
for domestic milk production, especially in the immediate vicinity of urban areas,
and for increased production of certain local dairy items. In some localities of this
zone, items like cheese and sour milk mixed with cereals are already marketed profitably
by small traditional dairy enterprises located in remote areas. With some encouragement,
e.g. marketing and processing improvements, measures to increase milk yields from
traditional herds etc., these items could be produced on a larger scale. Similarly,
production of standardised, hygienic, preserved and packaged local dairy products,
may well find a market among middle income urban consumers, or even lower-income
ones, if the consumption of such locally produced items were actively promoted in
public institutions e.g. schools, hospitals etc.
61. The preceding discussion assumes that the technical capacity (through extension and
research services) exists to support the expansion of domestic milk production. It also
assumes that there is a commitment on the part of West African governments to create
the conditions conducive to more sustained milk consumption patterns. Given this,
the means by which production and consumption goals are to be achieved should be
viewed in the wider socio-economic context of West Africa whereby milk consumption
patterns and factors underlying them vary considerably. In some areas of West Africa,
milk plays only a minor role in meeting food demand, in others it is the sole means
of sustenance. In most urban areas of West Africa, milk is consumed by relatively
high income consumers. Under such circumstances, it makes little sense to envisage
a single strategy for increasing milk consumption in the whole region. The important
thing to stress is that policies that aim to influence milk consumption patterns in West
Africa should be based on a sounder knowledge of the specific milk demand/supply
situations in the region and consider such aspects as the efficient utilisation of domestic
productive resources and the satisfaction of the needs of the large majority of milk
consumers.
21
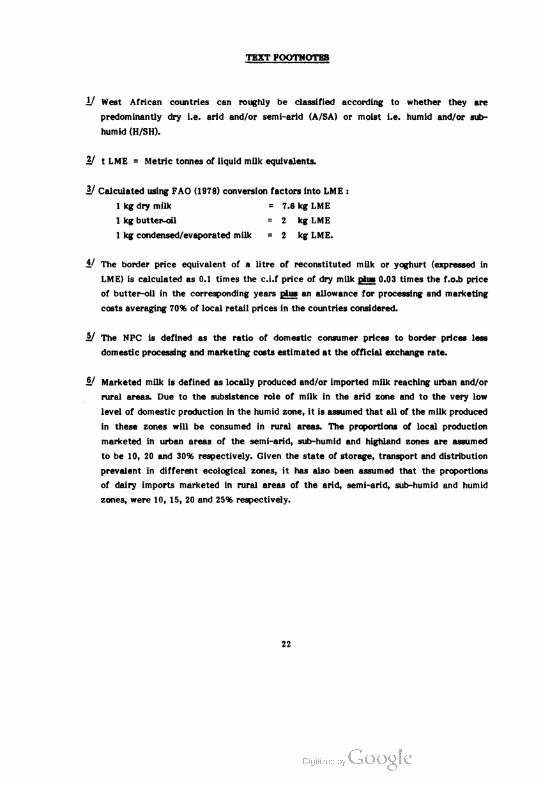
TEXT FOOTNOTES
II West African countries can roughly be classified according to whether they are
predominantly dry i.e. arid and/or semi-arid (A/SA) or moist i.e. humid and/or sub-
humid (H/SH).
y t LME = Metric tonnes of liquid milk equivalents.
U Calculated using FAO (1978) conversion factors into LME :
1 kg dry milk ■ 7.6 kg LME
1 kg butter-oil = 2 kg LME
1 kg condensed/evaporated milk = 2 kg LME.
1' The border price equivalent of a litre of reconstituted milk or yoghurt (expressed in
LME) is calculated as 0.1 times the c.i.f price of dry milk plus 0.03 times the f.o.b price
of butter-oil in the corresponding years plus an allowance for processing and marketing
costs averaging 70% of local retail prices in the countries considered.
fir The NPC is defined as the ratio of domestic consumer prices to border prices less
domestic processing and marketing costs estimated at the official exchange rate.
6/ Marketed milk is defined as locally produced and/or imported milk reaching urban and/or
rural areas. Due to the subsistence role of milk in the arid zone and to the very low
level of domestic production in the humid zone, it is assumed that all of the milk produced
in these zones will be consumed in rural areas. The proportions of local production
marketed in urban areas of the semi-arid, sub-humid and highland zones are assumed
to be 10, 20 and 30% respectively. Given the state of storage, transport and distribution
prevalent in different ecological zones, it has also been assumed that the proportions
of dairy imports marketed in rural areas of the arid, semi-arid, sub-humid and humid
zones, were 10, 15, 20 and 25% respectively.
22

REFERENCES
Atse-Atse P. 1987. Production laitiere en Cote d'lvoire: Possibilities de developpement.
These de doctorat veterinaire. Ecole Nationale Veterinaire de Toulouse, France.
Bachmann M. 1979. Adapted techniques for the collection, processing and marketing of
milk in developing countries. 1. Some reflections on the place of milk in the diet of
the people in developing countries. Milchwissenschaft 34(5): 267-271.
Chad (Ministere du Plan et de la Cooperation, Sous-direction de la Statistique). 1972.
Enquete budget 1972, Fort-Lamy. p.134.
Claesson O. 1978. Marketing of dairy products: demand for various product types, prices
and distribution. In: Proceedings of the First National Seminar on Dairy Development,
Vom, July 10-13. Federal Livestock Department, Lagos (Nigeria), pp. 237-249.
Cote d'lvoire (Ministere de l'Economie et des Finances, Direction Statistique). 1984. Enquete
budget consommation 1979: Resultats generaux sur la consommation des menages
africains de Cote d'lvoire. E.B.C. No. 1. Decembre 1984.
FAO. International Scheme for the Coordination of Dairy Development (ISCDD). 1975.
Nigeria report. FAO, Rome.
FAO. 1978. Milk and milk products: Supply, demand and trade projections 1985. Document
ESC:Proj/78/3. FAO, Rome.
FAO. 1979. The economic value of breast feeding. FAO Food and Nutrition Paper No.
11. FAO, Rome.
FAO. Various years. FAO Production Yearbook. 1976a, 1984a, 1985a and 1987a. FAO,
Rome.
FAO. Various years. FAO Trade Yearbook 1976b, 1980b, 1984b, 1985b and 1987b. FAO,
Rome.
IDF (International Dairy Federation). 1988. The world dairy situation. Report presented
at a conference held in Budapest, September 1988. IDF, Brussels.
23
ILCA. 1979. Economic trends: dairy products. ILCA Bulletin No. 4
ILCA. 1987. Allocation of West African urban populations in towns of 100, 000 or more
inhabitants to different ecological zones. Draft tables. Livestock Economics Division
(LED), Addis Ababa.
Jahnke H E. 1982. Livestock production systems and livestock development in tropical
Africa. Kieler Wissenschaftsverlag Vauk, Kiel, Federal Republic of Germany.
Mbogoh S G. 1984. Dairy development and internal dairy marketing in sub-Saharan Africa:
performance, policies and options. ILCA/LPU Working Paper No. 5. ILCA, Addis
Ababa.
Nigeria (Federal Office of Statistics). 1983. National integrated survey of households. Report
of National Consumer Survey, June 1980 - May 1981. pp. 11-12, 20-27.
Nwoko S G. 1986. The development of dairy imports in Nigeria. ILCA/LPU Working Paper
No. 10. ILCA, Addis Ababa.
OECI) (Organisation for Economic Cooperation and Development). 1987. National policies
and agricultural trade. OECD, Paris.
OMBEVI (Office Malien du Betail et de la Viande). 1976. Habitudes et niveaux de
consommation de produits d'origine animale a Bamako. Dec. 1974 - Sep. 1975.
Raikes P. 1986. Flowing with milk and money: agriculture and food in Africa and the EEC.
In: World Recession and the Food crisis in Africa. Lawrence, P (ed.). James Currey
Ltd, London.
Senait Seyoum. 1988. Patterns of consumption of dairy products in West Africa. ILC A/LED
Working Paper No. 11. ILCA, Addis Ababa.
Sidibe B S. 1982. Circuit de ramassage du lait: Organisation-cout-proposition. Niger.
Ministere du Developpement Rural. Ecole des Cadres de l'Elevage. Memoire de fin
d'ltudes: cycle assistant (Elevage).
UN (United Nations). 1986. World population prospects: estimates and projections as assessed
in 1984. UN. Department of International Economic and Social Affairs. Population Studies.
No. 86.
24

von Mossow V H. 1985. Dairy imports and import policy in Mali and their implications
for the dairy sector in the Bamako area. ILCA/LPU Working Paper No. 8. ILCA,
Addis Ababa.
von Massow V H. 1989. Dairy imports into sub-Saharan Africa: Problems, policies and
prospects. ILCA Research Report No. 17. ILCA, Addis Ababa.
World Bank. 1987. Nigeria dairy sector reconnaissance survey. Consultancy report.
Waters-Bayer A. 1986. Modernizing milk production in Nigeria: Who benefits? CERES 34(113).
Williams T. 1989. The impact of pricing policies on meat and milk output in sub-Saharan
Africa. ILCA/LED Draft. ILCA, Addis Ababa.
World Bank. 1989. World development report 1989. Oxford University Press, New York.


