ally bank cra strategic plan - federal reserve · officer is charged with overseeing the...
TRANSCRIPT

Ally Bank
Community Reinvestment Act Strategic Plan
January 2, 2017 – December 31, 2019

Table of Contents
SECTION I. INTRODUCTION………………………………………………………..…………………………………………………...…….1 A. Ally Bank Product Offerings and Business Strategy…..…………………………………………………………………1 B. Ally Bank Financial Information……………..………………………………………..……….…………………………………1
SECTION II. CRA STRATEGIC PLAN PROPOSAL…….…………………………………………………………………….…......2 A. Ally Bank’s Commitment to CRA………………………………………………………………………………………………….2 B. Overview of Strategic Plan, Effective Date and Term…………………………………………………………………..2
SECTION III. ASSESSMENT AREA…………………………………………………………………………………………………………….3 A. Median Family Income and Population Data………………………………………………………………………….……3 B. Housing Data………………………………………………………………………………………………………………………..…….4 C. Economic Outlook and Other Relevant Data……………………………………………………………………………….5
SECTION IV. NEEDS AND OPPORTUNITES IN THE ASSESSMENT AREA…………………………………………………...7 A. Needs in the Assessment Area…………………………………………………………………………………………….………7 B. Opportunities in the Assessment Area ……………………………………………………………………………………….9
SECTION V. PUBLIC PARTICIPATION........................................................………………………………………………12 A. Informal Public Suggestions………………………………………………………………………………………………….…..12 B. Formal Public Comment Solicitation………………………………………………………………………………………….12
SECTION VI. ALLY BANK STRATEGIC PLAN and MEASURABLE GOALS…………………..…………………………..…13 A. Definitions…………………………………………………………………………………………………………..………..………….13 B. Framework and Methodology...……………………………………………………………………..………….…………….14 C. Measurable Goals for “Outstanding” ……………………………..………………………………………………………..19 D. Measurable Goals for “Satisfactory” ……………………………..………………………………………….………….... 20 E. Strategic Plan Ratings System and Alternate Evaluation Method………………………………………………22
SECTION VII. REQUEST FOR APPROVAL AND CONTACT INFORMATION………………………………………………23 A. Regulatory Criteria for Approval…………………..…………………………………………………………..………………23 B. Request for Approval of Ally Bank CRA Strategic Plan 2017-2019 ………………………………………….…23 C. Contact Information ……………………………………….……………………………………………………………………….23
APPENDICES …………………………………………………………………………………………………………………………………………24 Appendix 1: Ally Bank Product, Deposit and Financial Information ………………………………………………………25 Appendix 2: Map of Assessment Area and Census Tracts…………………………………………………………………..…27 Appendix 3: Additional Demographic Information ….…………………………………………………..…………………..….29
: Additional Needs Assessment Information……………..………………….…………………….………………34 Appendix 4Appendix 5: Map of Broader Statewide or Regional Area ……………………………………….………..………..……….35 Appendix 6: Proof of Publication of Request for Public Comment…………………………..…….........................36 Appendix 7: Support Tables for “Outstanding” and “Satisfactory” Goal Levels……………………………………..37
CONFIDENTIAL EXHIBITS (Bound Under Separate Cover) Confidential Exhibit A: Ally Bank 2016-2018 Business Plan and Summary Projected Financials Confidential Exhibit B: Bases for Measurable Goals Confidential Exhibit C: Analysis of CRA Performance of Peer Banks

B. Ally Bank Financial Information
SECTION I. INTRODUCTION
Ally Bank (or “Bank”) is a Utah state-chartered commercial bank established in August 2004 that maintains its headquarters in Midvale, Utah. The Bank is a subsidiary of Ally Financial Inc.1 (“AFI” and, collectively with Ally Bank, “Ally”) and is regulated at the federal level by the Board of Governors of the Federal Reserve System (“Federal Reserve Board”) acting through the Federal Reserve Bank of Chicago (“Chicago FRB”). At the state level, the Bank is regulated by the Utah Department of Financial Institutions (“UDFI”). As a federally insured depository institution, Ally Bank is subject to the Community Reinvestment Act (“CRA”),2 which requires banks to help meet the credit needs of their entire community, including low- and moderate-income neighborhoods. In light of Ally Bank’s nationwide direct business model and lack of branches, the Bank has elected to be evaluated under the “strategic plan” option as provided in 12 C.F.R. § 228.27. The Bank has prepared this new CRA Strategic Plan for 2017-2019 (“this Strategic Plan” or “2017-2019 Plan”) because the Bank’s CRA Strategic Plan for 2014-2016 (“2014-2016 Plan”)3 expires on December 31, 2016.
A. Ally Bank Product Offerings and Business Strategy
Ally Bank is a leading online bank that offers banking products and services nationwide with no branches or ATMs.4 The Bank offers deposit and wealth management products, automotive (“auto”) vehicle financing (including lease financing) to consumers, financing for auto and RV dealerships, commercial financing to middle market companies, and engages in certain residential mortgage lending activities. The Bank’s premier online deposit business offers a broad range of products to customers, including checking accounts, savings accounts, money market deposit accounts, and certificates of deposit. The Bank, together with AFI, is the nation’s leading provider of automotive financing and leasing products. The Bank provides several financing solutions for automotive dealerships (including wholesale and dealer floorplan loans, real estate loans, and working capital loans), and purchases new and used consumer and small business retail installment sale contracts and leases as well as commercial financing to business customers. The Bank also manages a community development loan portfolio. See Appendix 1.A for a list of Ally Bank’s current product offerings.
Ally Bank’s core philosophy is to create a customer experience that is demonstrably better than competitors for offered products and services. The Bank’s strategy is designed to nurture long-term customer relationships and capitalize on the shift in consumer preference to direct banking. Ally Bank’s keen focus on providing a superior customer experience has resulted in numerous awards, including “Best Online Bank.”5 In the most recent Forrester US Customer Experience (CX) Index™, Ally Bank received a third consecutive “Best in Class” ranking, placing it in the top 15 of all 319 brands covered in the survey. Consistent with the overall industry trend toward digitally-based financial services, Ally Bank will continue its direct banking business model and will focus on strengthening and expanding existing relationships with its auto and deposit customers, in addition to attracting new customers with an expanded suite of consumer products. In that regard, Ally Bank recently added digital brokerage and wealth management services through its acquisition of TradeKing Group, Inc., and also launched the “Ally Cashback Credit Card,” a co-branded credit card.
Ally Bank is profitable, growing and well-capitalized. As of June 30, 2016, Ally Bank had $114.6 billion in total assets, $72.7 billion in total deposits, $17.3 billion of total equity capital, and 1,522 full-time employees. Additional financial information, including a link to the Bank’s Consolidated Reports of Condition and Income (Call Report) as of June 30, 2016, are included at Appendix 1.D.
1 AFI is a leading automotive financial services company that offers a full spectrum of financial products and services related to the auto industry. 2 Codified at 12 U.S.C. §2901 et seq. 3 The 2014-2016 Plan was approved by the Federal Deposit Insurance Corporation (“FDIC”) on December 23, 2013. The Federal Reserve Board accepted the 2014-2016 Plan as part of the approval for Ally Bank’s Federal Reserve membership in March of 2016.4 In addition to the Bank’s headquarters in Midvale, Utah, Ally has primary operations in Detroit, Michigan; Charlotte, North Carolina; Fort Washington, Pennsylvania; New York, New York; and Lewisville, Texas. 5These awards include Money® Magazine Best Banks in America issue: Ally Bank named “Best Online Bank” for 5th straight year (2011 – 2015), and Kiplinger’s Personal Finance, “The Best List” 2015: Ally Bank named “best” online bank.
Ally Bank CRA Strategic Plan 2017-2019 1
SECTION II. CRA STRATEGIC PLAN PROPOSAL
A. Ally Bank’s Commitment to CRA
Ally Bank embraces its obligations under the CRA as an extension of its strong LEAD6 corporate culture of being an “Ally” to its customers and to its communities, and has devoted significant effort to complying with both the letter and the spirit of the CRA. Ally Bank’s Board of Directors (“Ally Bank Board”) and senior management are deeply committed to achieving meaningful impact in its communities. To this end, Ally Bank has established a comprehensive CRA Program that involves participation from the Ally Bank Board, senior management, the Bank’s CRA Department, and Bank employees.
Ally Bank’s CRA Program is under the direction of the Ally Bank Board, with a Bank-wide management CRA Committee comprised of members of senior management from the businesses, Finance, Risk, Compliance, Corporate Communications and Treasury. The CRA Committee is responsible for oversight of the Bank’s CRA activities as set forth in the Bank’s CRA Policy, the Bank’s approved CRA Strategic Plan7 and applicable regulations. The CRA Credit & Investment Subcommittee is responsible for the management of the Bank’s Community Development (“CD”) transaction approval process, portfolio performance, and servicing processes.
Ally Bank has demonstrated its ongoing commitment to CRA by building a strong CRA Department that consists of individuals with extensive experience in the banking industry, particularly in the areas of affordable housing, community development finance, community services, and legal and regulatory compliance. The Bank’s CRA Officer is charged with overseeing the development and implementation of the Bank’s CRA Strategic Plan, coordinating all CRA activities, and for reporting to the CRA Committee and the Ally Bank Board on a regular basis. The Bank’s CRA Department has developed deep ties in the community, and is actively engaged with community members, with an emphasis on finding and developing new or expanded ways to help meet community needs in a safe and sound manner. The CRA Department performs extensive due diligence regarding all proposed CRA loans and investments, and all approvals follow a rigorous Delegation of Authority, in compliance with the Bank’s CRA Policy.
B. Overview of Strategic Plan, Effective Date and Term
Ally Bank’s strong commitment to CRA is further evidenced by the extent and breadth of its measurable goals set forth in this Strategic Plan: Ally Bank will make $2.5 billion in loans and investments over the three-year plan period and will provide 2,000 volunteer hours of CD services to earn an “Outstanding” CRA rating. The overall $2.5 billion goal amount is significantly higher than the aggregate amount of the measurable goals for “Outstanding” set forth in the Bank’s 2014-2016 Plan. The $2.5 billion goal amount is comprised of CRA-qualifying loans and CD investments, with annual interim goals expressed in ranges from $600 million to $1.1 billion, and also specific assessment area goals for auto loans, mortgage loans, and CD loans/investments. This considerable volume of CRA loans and investments will allow the Bank to respond to critical community needs and implement responsive, flexible, and innovative loans and investments. In developing this 2017-2019 Plan and goals, the Bank sought and received input from numerous entities representing a wide array of community partners. The goals are set forth and described in greater detail in Section VI below.
The effective date of this Strategic Plan is January 2, 2017, and the term is three years: 2017-2019.
If during the term of this Strategic Plan there is a material change in circumstance, Ally Bank may request an amendment to this Strategic Plan as provided for in 12 C.F.R. § 228.27(h).
6 Ally’s LEAD values include “Look Externally,” “Execute with Excellence,” “Act with Professionalism,” and “Deliver Results.” 7 The CRA Committee also has responsibility to review and approve the proposed CRA Strategic Plan and then make a recommendation for approval to the Ally Bank Board.
Ally Bank CRA Strategic Plan 2017-2019 2

A. Median Family Income and Population Data
-
SECTION III. ASSESSMENT AREA
The Federal Reserve Board’s regulation implementing the CRA requires a bank to delineate one or more assessment areas within which the bank’s record of helping to meet the credit needs of its community will be examined. The assessment area must include the geographies in which the bank has its main office, its branches and its deposit-taking ATMs (12 C.F.R. § 228.41(c)(2)). Because Ally Bank operates no physical branches or deposit-taking ATMs, the Bank delineates its assessment area based on its Midvale, Utah headquarters located in Salt Lake County. The Bank’s CRA assessment area in Utah (“UTAA”) includes Salt Lake County and seven surrounding counties in Utah: Davis, Morgan, Summit, Tooele, Utah, Wasatch, and Weber (see map at Appendix 2.A). In compliance with 12 C.F.R. § 228.41(c) – (e), the UTAA includes only whole geographies or political subdivisions (counties), does not reflect illegal discrimination, and does not arbitrarily exclude low- or moderate-income (“LMI”) geographies. In fact, three of these counties – Morgan, Summit and Wasatch – are new to Ally Bank’s UTAA, and reflect the Bank’s efforts to extend its core CRA impact to more rural areas, which often have lower median family incomes and do not receive as much benefit from CRA activities as the more metropolitan areas such as Salt Lake County (see Table 1 below).8 The three new counties are contiguous to Salt Lake County to the East.
All of the counties in the UTAA except Wasatch County are included in the Salt Lake City-Provo-Orem Combined Statistical Area (“CSA”) as defined by the Office of Management and Budget. Both Wasatch and Summit Counties are designated as “non-metropolitan areas” and contain some of the more rural areas in Utah. The 2016 population and income data by county, as reported by the Federal Financial Institutions Examination Council (“FFIEC”), is set forth in Table 1.
Table 1: UTAA Median Family Income Data
UTAA Median Family Income Data
County Combined Statistical Area Code
Metro politan
Statistical Area Code
2016 FFIEC Est. MSA/MD
and non-MSA/MD Median Family Income ("MFI")
Low Income <50% of MFI or
below
Moderate Income 50% to 80% of MFI
Middle Income 80% to 120% of
MFI
Upper Income
>120% MFI or above
Salt Lake 482 41620 $72,800 $0 - $36,399 $36,400 - $58,239 $58,240 - $87,359 $87,360 Tooele 482 41620 $72,800 $0 - $36,399 $36,400 - $58,239 $58,240 - $87,359 $87,360 Davis 482 36260 $72,500 $0 - $36,249 $36,250 - $57,999 $58,000 - $86,999 $87,000
Weber 482 36260 $72,500 $0 - $36,249 $36,250 - $57,999 $58,000 - $86,999 $87,000 Morgan 482 36260 $72,500 $0 - $36,249 $36,250 - $57,999 $58,000 - $86,999 $87,000
Utah 482 39340 $67,600 $0 - $33,799 $33,800 - $54,079 $54,080 - $81,119 $81,120 Summit 482 99999 $64,100 $0 - $32,049 $32,050 - $51,279 $51,280 - $76,919 $76,920 Wasatch NA 99999 $64,100 $0 - $32,049 $32,050 - $51,279 $51,280 - $76,919 $76,920
8 Summit and Wasatch Counties are the location of several ski and summer resorts (such as Park City and Deer Valley), but are experiencing such a shortage of affordable housing that most resort employees cannot afford to live near their work and must commute from long distances. Ally Bank has been exploring opportunities to finance affordable rental workforce housing to help meet the needs of LMI individuals who work in Summit and Wasatch Counties.
Ally Bank CRA Strategic Plan 2017-2019 3

Table 3: UTAA Census Tract Demographics
-
-
-
-
-
-
The Bank’s UTAA contains 476 census tracts and has a population of approximately 2.4 million (Table 2).9 The income breakdown of the 476 census tracts is set forth in Table 3.
Table 2: UTAA Population Data
UTAA Population Data
County 2010 Population 2015 Population
Estimate Salt Lake 1,029,665 1,107,314 Utah 516,564 575,205 Davis 306,479 336,043 Weber 231,236 243,645 Tooele 58,218 62,952 Summit 36,324 39,633 Wasatch 23,530 29,161 Morgan 9,469 11,065 Total 8 Counties: 2,211,485 2,405,018 Total State of Utah 2,995,919
UTAA Census Tract Demographics
County
# of Low Income Tracts
# of Moderate
Income Tracts
# of Middle Income Tracts
# of Upper-Income Tracts
Unknown Tracts
Total # of Census Tracts
Salt Lake 11 41 98 60 2 212 Tooele 0 1 8 1 1 11 Davis 1 10 24 19 0 54
Weber 4 14 25 7 0 50 Morgan 0 0 2 1 0 3
Utah 8 19 63 37 1 128 Summit 0 0 3 10 0 13 Wasatch 0 0 2 3 0 5 TOTALS: 24 85 225 138 4 476
% of Total: 5% 18% 47% 29% 1% 100% Source: FFIEC Census and Demographic Data (last updated 06/30/2016)
B. Housing Data
Following the recession that began in 2008 (“Great Recession”), Utah’s housing market has continued to trend upward keeping pace with national rates. Salt Lake City’s median home price reflects that finding with the first quarter 2016 median home price of $261,300, which is a 7.4% increase from the year prior10. Per the 2016 Economic Report to the Governor Compendium (Appendix 3.H), residential construction is the largest sector in the state’s construction industry. Forecasts show a rise in residential construction with approximately 1,500 additional single family homes to be built in 2016.
Utah continues to be one of the fastest growing states in the nation and will likely continue to experience increased population growth from in-migration and natural increases. Utah families also tend to be larger and live longer (Appendix 3.H, pp 3-4). As the market demand for housing increases with the pace of growth, it will continue to outpace available inventory and the rise in home prices will remain a barrier to home ownership for lower-income households. Housing data for each county in the UTAA is set forth in Table 4.
Table 4: UTAA Housing Data
UTAA Housing Data
County Total # of Housing
Units
Total # of 1 to 4 Family
Units
% of Occupied 1-to 4 Family
Units
% of Owner Occupied
Units
% of Vacant Units
% Renter Occupied
Salt Lake 357,013 287,569 80% 64% 6% 30% Tooele 18,822 17,984 74% 71% 6% 23% Davis 94,974 85,416 82% 75% 5% 21%
Weber 84,196 75,563 74% 67% 8% 25% Morgan 5,796 5,776 83% 83% 6% 11%
Utah 142,770 123,472 74% 66% 5% 29% Summit 25,021 19,169 51% 40% 46% 14%
Wasatch 19,966 18,778 59% 56% 28% 16% Source: FFIEC Census and Demographic Data (last updated 06/30/2016)
9 All population data used herein is from the United States Census Bureau /American FactFinder Annual Estimates of the Resident Population: April 1, 2010 to July 1, 2015 (2015 Population Estimates Program) at http://factfinder2.census.gov 10 http://www.realtor.org/topics/metropolitan-median-area-prices-and-affordability
Ally Bank CRA Strategic Plan 2017-2019 4
x
x
x
x
Nearly 31% of homeowners with a mortgage and 51.8% of renters are considered cost burdened; that is, they spend more than 30% of their income on housing. As of 2014, housing inventory had an estimated 42,601-unit shortage in available affordable housing for extremely low-income households (0-30% of the area median income (“AMI”)) - 22% of renter households in Utah fall into this category. Fair market rent for a two-bedroom apartment in Utah is $813 per month. A minimum wage worker earns an hourly wage of $7.25. In order to afford that level of rent and utilities, that worker must work 86 hours per week, 52 weeks per year. In June 2016, the number of properties that received a foreclosure filing was one in every 1,439 housing units, which was slightly better than the national average; however, it was 30% higher than the previous month and 21% lower than the same time last year.
The following are key statistics to housing affordability in Utah (see Appendix 3.B, pp.35-36), as well as highlights relating to Utah’s current market and foreclosure trends11:
C. Economic Outlook and Other Relevant Data
Utah’s economy has continued to recover and grow since the Great Recession. In 2015, Utah added an estimated 49,100 jobs, a 3.7 % annual job growth rate (Appendix 3.H). Utah’s economic strength can be attributed to a diverse makeup of industry sectors, a young and educated workforce, a fiscally responsible legislature, and the low cost of doing business. Utah also enjoys a lower than national average unemployment rate that has been below 4% for over 24 consecutive months. While the national rate remains around 4.7%, the State of Utah’s Department of Workforce Services reported that as of June 2016 Utah’s unemployment rate was 3.8% (Appendix 3.C).
According to the Bureau of Economic Analysis,12 the largest industries in Utah were finance, insurance, real estate, rental, and leasing. These industries accounted for 21.2% of Utah Gross Domestic Product (“Utah GDP”) and had 3.1% real growth during Fourth Quarter of 2015. The next largest industry category was government, which accounted for 13.2% of Utah GDP and had 0.4% real growth. Utah’s largest employers include: University of Utah (including U of U HealthCare), Intermountain Healthcare, State of Utah, Wal-Mart, Hill Air Force Base, Smith’s Food & Drug Stores, Larry H. Miller Group of Companies, Utah Valley University, Brigham Young University, and Zions Bancorporation.13
The technology and venture capital industries are also a major contributor to transforming many areas of the state. In a 2015 article published in the New Yorker, Utah was dubbed as the “Silicon Slopes” for its diversity of tech sector companies backed by venture capital funding (Appendix 3.I). A few months earlier, an Inc.com article titled “Move Over, Silicon Valley, Utah Has Arrived” examined the rising prominence of Utah in the venture capital finance industry (Appendix 3.J). Significant amounts of venture capital investments are usually seen as indicative of the market’s confidence in the tech industry. In 2014, several large venture capital deals in the state surpassed the $100 million mark, making Utah the sixth most popular destination for venture capital investments.
Other relevant data includes the following information from the 2016 Economic Report to the Governor Compendium (Appendix 3.H) and the Community Action Partnership of Utah Annual Report on Poverty in Utah 2015 (Appendix 3.B):
11 http://www.realtytrac.com/statsandtrends/ut 12 Bureau of Economic Analysis Regional Facts. 13 http://business.utah.gov/wp-content/uploads/UtahFactsBook2016.compressed.pdf
Ally Bank CRA Strategic Plan 2017-2019 5

x
x
x
x
x
Personal Income: Utah’s total personal income in 2015 was an estimated $115.9 billion, a 4.5% increase from $110.8 billion in 2014. Utah's estimated 2015 per capita income was $38,641, up 2.6% from the 2014 level of $37,664; since the early 1980s, Utah’s per capita income has averaged about 20% less than the national per capital income (Appendix 3.H, p.26).
Public Education: In fiscal year 2012 (the most recent year for which state-by-state figures were available), Utah's current expenditure per pupil was $6,650, the nation’s lowest, where it has ranked for many years. Utah’s public education finances are heavily influenced by its demographics: it has had the highest number of school-age children per working-age person for many years. Utah also has the nation’s highest number of pupils per teacher at 22, a consequence of the low per-pupil expenditure rate (Appendix 3.H, p.75).
Construction: Utah’s construction sector improved in 2015, with the dollar value of permit authorized construction estimated at $6.75 billion, the highest level in eight years and 16% higher than in 2014. Residential construction is the largest sector and the value of residential construction accounts for more than 56% of total permit authorized construction valuation at $3.8 billion. The number of residential units receiving building permits dropped from 2014 to 2015, with an increase in single family units from 8,600 units in 2014 to 9,500 units in 2015, while the number of multifamily units decreased from 9,800 units in 2014 to 7,700 units in 2015 (Appendix 3.H, p.109).
Nonprofit Sector: According to IRS records there were 8,844 nonprofit organizations filing as tax exempt in the state of Utah in 2015. Charitable organizations accounted for $8 billion (6%) of Utah’s GDP and employed more than 6.7% of Utah’s private sector workforce. While Utah’s economic outlook is good, nonprofit organizations still see demand for services exceeding capacity. Of Utah nonprofits surveyed in 2015, 82% report that service/program demand increased, and 55% reported that they were unable to meet those demands (Appendix 3.H, p.135-136).
Poverty: Despite economic growth in Utah, overall poverty has grown (Appendix 3.E, p.6). The number of Utahns living in poverty has increased in recent years. The U.S. Census Bureau estimates that 13.2% of all Utahns now live in poverty. The percentage of children in Utah growing up in poverty is 15.7% – almost one in every six children. Poverty among children living in single-parent families is significantly higher than in two-parent households, with 35% of single-parent families living in poverty. Further, the data related to families caught in the cycle of poverty and welfare dependence demonstrate that there are significant barriers beyond income that jeopardize their ability to emerge from the cycle (Appendix 3.B).
Research shows that living in poverty has multiple negative implications, including higher risk of experiencing homelessness, lower levels of educational attainment, higher rates of unemployment or underemployment, and lack of health insurance. Research also shows that affordable, decent housing is a basis from which families can begin to break the cycle of poverty; however, Utah currently lacks the appropriate inventory of housing to meet the needs of this population. In Utah, where the minimum wage is $7.25 per hour, low income families pay a larger share of their income toward housing costs than higher income households, making financial stability harder to achieve (Appendix 3.B, pp.35-36).
Ally Bank CRA Strategic Plan 2017-2019 6

SECTION IV. NEEDS AND OPPORTUNITIES IN THE ASSESSMENT AREA
As detailed in Ally Bank’s 2014-2016 Plan, the Bank engages in several ongoing needs assessment activities, including regular meetings and calls with several community partners (as discussed below) for the purpose of determining community needs. In formulating this 2017-2019 Plan, Ally Bank has built upon its previous needs assessment efforts with updates through both informal processes and a more formal survey process described below.
A. Needs in the Assessment Area
1. Informal Needs Assessment Process: Several Ally Bank employees are actively involved in leadership roles with local community organizations, the missions of which include serving the needs of LMI individuals within the UTAA. Information derived from these informal interactions facilitates ongoing access to timely information relevant to community needs and the related gaps in services. The Bank also engages in regular communication with several additional entities operating within the Bank’s UTAA, including affordable housing developers, affordable housing loan funds, nonprofit community service providers (including healthcare and substance abuse treatment providers), small business capital and loan funds, and local municipalities.
The Ally Bank Board and senior management have also participated in the Bank’s needs assessment process through meetings with various nonprofit and for-profit entities to learn about needs within the Bank’s UTAA, as well as related challenges and opportunities. In June of 2014, the Ally Bank Board heard from leaders in the Utah nonprofit community regarding needs and also the ways in which CD charitable donations and CD service hours play a vital role in helping local nonprofit organizations meet community needs. In April of 2015, the Ally Bank Board heard directly from individuals representing Utah’s local small business ecosystem. Those representatives related the challenges associated with creating, growing, and sustaining businesses, and the critical need for access to capital, especially in seed stage, early stage, and growth stage financing. In May of 2016, the Ally Bank Board heard directly from organizations that are engaged in CD lending that supports affordable homeownership, affordable rental housing, small business micro-lending, and revitalization and stabilization in the UTAA. The Ally Bank Board also learned about the unique needs of each sector and the challenges faced by CD lenders in addressing those needs.
In addition to direct communication with community partners, Ally Bank also reviewed and analyzed several informative reports provided by government entities, as well as community development organizations, to help identify needs within the UTAA (links to these reports are included in Appendices 3 and 4.B).
2. Formal Needs Assessment Process: As part of updating its needs assessment, the Bank developed a needs assessment survey and invited participation from numerous community-based agencies and other organizations that are engaged in qualifying community development activities. Forty-two (42) organizations responded to the survey (see Appendix 4.A. for list of survey participants) and provided information regarding:
x x x x x x
Organizational mission Geography and populations served Greatest organizational challenges Greatest needs within their primary service area Largest gaps in service Top barriers to achieving organizational mission
3. Needs Assessment Findings and Conclusions: The top four greatest needs consistently identified by the organizations responding to the Bank’s survey were as follows:
Ally Bank CRA Strategic Plan 2017-2019 7
a. Affordable Housing b. Employment Opportunities c. Educational Opportunities d. Affordable Healthcare
The four areas of greatest need identified through the Bank’s survey overlap to a significant extent with the issues identified in the various government and nonprofit economic reports and needs assessments analyzed by the Bank (see Appendices 3.A-H and 4.B).
a. Affordable Housing: Organizations representing a broad cross section of the survey respondents most often cited shortage of access to safe, decent, affordable housing as a top need, particularly for (i) lower-income individuals and families, including special needs populations such as homeless individuals and families; (ii) persons with disabilities; (iii) individuals coming out of the criminal justice system; and (iv) individuals receiving mental health and substance abuse treatment. Affordable rental housing, including multifamily housing, is critical and remains in short supply, with more than half of renters spending more than 30% of household income on housing. Since the end of the Great Recession, home prices and rental rates have risen much more quickly than wages across Utah, further increasing the housing affordability gap for lower income households, as illustrated by the housing cost burden described in Section III.B. above. The Bank has actively supported, and will continue to support, the creation and preservation of affordable housing through direct loan originations, loan purchases, loan participations, lines of credit to loan funds such as the Rocky Mountain Community Reinvestment Corporation (“RMCRC”), and investment in Low Income Housing Tax Credits (“LIHTC”).
b. Employment Opportunities: Survey respondents also cited employment opportunities as one of the greatest needs among the populations they serve. While unemployment is relatively low in the Bank’s UTAA, the unemployment rate does not account for individuals who are employed but face challenges such as (i) employment is not secure; (ii) employment may be temporary or part-time; (iii) low wage jobs that provide insufficient income to meet family needs; and (iv) lack of benefits such as health insurance or paid sick leave.
Additionally, respondents noted that for many individuals, including refugees, the path to better economic stability may be self-employment. Because small businesses are a significant source of job creation, support for the formation and expansion of small businesses helps address the need for more and better jobs. The Bank has provided, and will continue to provide, access to capital and technical assistance programs for small businesses through charitable grants, loans, and investments. The Bank has worked with organizations such as The Suazo Business Center and the Utah Microenterprise Loan Fund, and has also made investments through several Small Business Investment Company (“SBIC”) funds (both debt and equity) and community development venture capital funds.
c. Educational Opportunities: The lack of educational opportunities was frequently cited by survey respondents, in particular (i) education relating to financial literacy; (ii) early childhood education; (iii) homeownership preparation; and (iv) English as a Second Language. Studies confirm that children living in poverty have a higher risk of absenteeism at school and are seven times more likely to drop out of high school. Earnings potential and financial security are highly correlated to the level of education completed by an individual, with those lacking a high school diploma at a much higher risk of living in poverty. Early childhood education can help to address this issue. The rapidly growing ethnic and cultural diversity in Utah, including the growth of immigrant and refugee populations, has created a need for services to facilitate English language proficiency, the ability to access basic needs, secure employment, and integrate into the local community. The Bank has actively supported these types of educational programs through charitable donations and services, as well as loan participations to support agencies such as Salt Lake CAP Head Start, Guadalupe Schools, NeighborWorks Provo and the Community Development Corporation of Utah.
Ally Bank CRA Strategic Plan 2017-2019 8

d. Affordable Healthcare: The fourth most frequently cited need was access to affordable healthcare, including (i) dental care; (ii) vision services; (iii) mental health treatment; and (iv) substance abuse treatment. A recent healthcare study in Utah revealed lower rates of healthcare coverage and an increased number of individuals reporting cost as a barrier to obtaining healthcare. Utah residents who live in poverty and who lack education are most likely to be without health insurance. Approximately 12.5% of the Utah population does not have health insurance. Despite gains in the number of children who have healthcare coverage, Utah has one of the highest rates of uninsured children in the nation (ranks 47th). Nearly one in four Hispanic children in Utah is uninsured (the worst rate in the nation). Without healthcare coverage, those with lower incomes tend to delay or avoid treatment for medical conditions, which ultimately results in more critical illness and increased costs of treatment. The Bank has facilitated access to healthcare through charitable donations to agencies such as Wasatch Homeless Healthcare, Friends for Sight, and Utah Partners for Health.
The Bank’s survey also asked responding organizations to identify the greatest challenges to achieving their respective missions. The top two barriers cited were insufficient funding and limited organizational capacity. The challenges cited by most organizations include: (i) decline in funding resources due to cuts in Federal programming; (ii) the recent exit from Utah of two large banks that had made consistent donations; (iii) the unwillingness of many funding sources to provide funds for operations; (iv) increased demand by funders for data tracking and impact reporting; and (v) limited staffing with inability to pay an adequate wage and provide competitive benefits.
The portion of the Governor’s Economic Report regarding the Utah nonprofit sector supports these claims. Despite Utah’s positive economic outlook, nonprofit organizations still see demand for services exceeding budget capacity, with more than half of Utah nonprofits reporting that they were unable to meet service demands in 2015. The Bank supports capacity building through a diversified charitable donation program, as well as services and technical assistance, all of which provide broad nonprofit support within the Bank’s UTAA.
Ally Bank has taken these needs into consideration in formulating this Strategic Plan, and will continue to focus on the issues identified through the Bank’s community needs assessment process – specifically, affordable housing, job opportunities through economic development, educational opportunities, and access to healthcare. The Bank plans to continue working with existing community partners, as well as identifying new organizations and community development opportunities, in an effort to remain aware of community needs and opportunities.
B. Opportunities in the Assessment Area
Ally Bank has drawn upon numerous sources to assess both the needs and opportunities in the UTAA. While there are unmet needs in the UTAA as discussed above, many of the needs are not readily addressed through CD loans and investments (most requests from LMI service providers are for charitable donations). Ally Bank continues to work diligently with community partners in the UTAA to develop additional ways to meet the UTAA’s needs other than through donations, but opportunities to deploy significant amounts of capital in the form of CD loans or investments are limited because of Utah’s relatively small population base (less than 3 million people) and the disproportionately large number of banks with CRA assessment areas (“AAs”) in Utah. These two combined factors create an extraordinarily competitive environment for CRA-qualifying loans and investments.
1. Small Population in UTAA: The population of Ally Bank’s UTAA is only 2.4 million people. A small population means fewer federal tax credit allocations, fewer strong nonprofits to which Ally Bank can extend CD loans, and fewer CD investments, including CRA-qualifying bonds. For example, affordable housing is a strong need in the UTAA, but most multifamily affordable housing projects in Utah rely on some level of federal
Ally Bank CRA Strategic Plan 2017-2019 9
or local government subsidy in order to keep rents low enough to be affordable for LMI individuals.14 Federal housing subsidies are typically based on state population. The average amount of federal LIHTC allocated to Utah, and awarded by the state housing finance agency, over the last five years is relatively small: just over $65 million (which resulted in an average of 12 multifamily affordable housing projects per year and the addition of 540 new affordable housing units per year). The addition of 540 new affordable housing units per year is a positive step, but does not come close to alleviating the 42,000+ unit shortage in available affordable housing units. State subsidies also play a smaller role in affordable housing, but can be restricted by state budget constraints in any given year. In the area of single family affordable housing, over the last three years the state housing finance agency has issued an average of under $64 million in CRA-qualifying taxable housing revenue bonds annually.
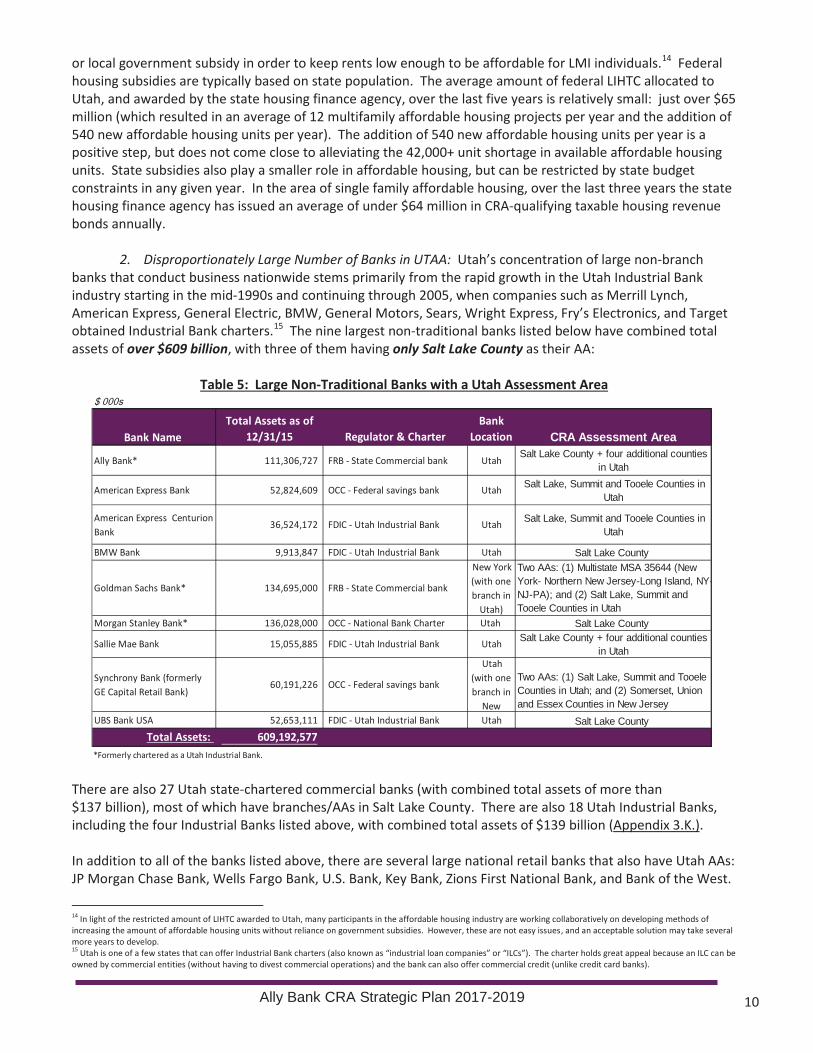
2. Disproportionately Large Number of Banks in UTAA: Utah’s concentration of large non-branch banks that conduct business nationwide stems primarily from the rapid growth in the Utah Industrial Bank industry starting in the mid-1990s and continuing through 2005, when companies such as Merrill Lynch, American Express, General Electric, BMW, General Motors, Sears, Wright Express, Fry’s Electronics, and Target obtained Industrial Bank charters.15 The nine largest non-traditional banks listed below have combined total assets of over $609 billion, with three of them having only Salt Lake County as their AA:
Table 5: Large Non-Traditional Banks with a Utah Assessment Area $ 000s
Bank Name Total Assets as of
12/31/15 Regulator & Charter Bank
Location CRA Assessment Area
Ally Bank* 111,306,727 FRB - State Commercial bank Utah Salt Lake County + four additional counties
in Utah
American Express Bank 52,824,609 OCC - Federal savings bank Utah Salt Lake, Summit and Tooele Counties in Utah
American Express Centurion Bank
36,524,172 FDIC - Utah Industrial Bank Utah Salt Lake, Summit and Tooele Counties in Utah
BMW Bank 9,913,847 FDIC - Utah Industrial Bank Utah Salt Lake County
Goldman Sachs Bank* 134,695,000 FRB - State Commercial bank
New York (with one branch in
Utah)
Two AAs: (1) Multistate MSA 35644 (New York- Northern New Jersey-Long Island, NY-NJ-PA); and (2) Salt Lake, Summit and Tooele Counties in Utah
Morgan Stanley Bank* 136,028,000 OCC - National Bank Charter Utah Salt Lake County
Sallie Mae Bank 15,055,885 FDIC - Utah Industrial Bank Utah Salt Lake County + four additional counties in Utah
Synchrony Bank (formerly GE Capital Retail Bank)
60,191,226 OCC - Federal savings bank
Utah (with one branch in
New
Two AAs: (1) Salt Lake, Summit and Tooele Counties in Utah; and (2) Somerset, Union and Essex Counties in New Jersey
UBS Bank USA 52,653,111 FDIC - Utah Industrial Bank Utah Salt Lake County Total Assets: 609,192,577
*Formerly chartered as a Utah Industrial Bank.
There are also 27 Utah state-chartered commercial banks (with combined total assets of more than $137 billion), most of which have branches/AAs in Salt Lake County. There are also 18 Utah Industrial Banks, including the four Industrial Banks listed above, with combined total assets of $139 billion (Appendix 3.K.).
In addition to all of the banks listed above, there are several large national retail banks that also have Utah AAs: JP Morgan Chase Bank, Wells Fargo Bank, U.S. Bank, Key Bank, Zions First National Bank, and Bank of the West.
14 In light of the restricted amount of LIHTC awarded to Utah, many participants in the affordable housing industry are working collaboratively on developing methods of increasing the amount of affordable housing units without reliance on government subsidies. However, these are not easy issues, and an acceptable solution may take several more years to develop.15 Utah is one of a few states that can offer Industrial Bank charters (also known as “industrial loan companies” or “ILCs”). The charter holds great appeal because an ILC can be owned by commercial entities (without having to divest commercial operations) and the bank can also offer commercial credit (unlike credit card banks).
Ally Bank CRA Strategic Plan 2017-2019 10

In the June 30, 2015 FDIC Summary of Deposits, there were 44 FDIC-insured banking or savings institutions with 236 office/branch locations in Salt Lake County alone.
The presence of so many banks in such a small state (in both population and area) results in stiff competition for the limited supply of even the most routine CD loans and investments, such as mortgage-backed securities (“MBS”) or bonds issued by the Utah Housing Corporation (Utah’s largest financer of affordable housing). Because Ally Bank has less than 1% of its consumer loans in the UTAA, CD loans and investments made up the largest dollar amount of the Bank’s measurable goals in its 2014-2016 Plan.
The combination of the UTAA’s small population and the large number of banks competing for the same CD loans and investments has resulted in the Salt Lake area becoming known as a CRA “hot spot,” with significantly higher pricing and “CRA premiums” on CD investments such as LIHTC and MBS. For example, with the large number of banks in Utah competing to purchase about $69 million of available new LIHTC investments per year, in many instances LIHTC are being bid up to over $1.20 per credit, which is one measure of market saturation. There is also fierce competition for CRA-qualifying MBS in the UTAA, resulting in significant “CRA premiums.” Simply put, Utah does not have enough capacity to absorb the combined billions of dollars per year of CD loans and investments the banks listed above seek to deploy.
Ally Bank’s highest CRA priority has always been – and will continue to be – to demonstrate responsiveness to the needs and opportunities in its UTAA. In light of the challenges in obtaining sufficient amounts of CD loans and investments in the UTAA, and in accordance with the 2013 revisions to the Interagency Questions and Answers Regarding CRA (“Interagency Q&A”), Ally Bank began actively seeking CD opportunities in the broader statewide or regional area (“BSRA”) that includes the UTAA. In order to deploy the $2.5 billion in new loan and investment originations under this Strategic Plan, Ally Bank will need to continue the strategy of making CD loans and investments in the BSRA. For purposes of this Strategic Plan, Ally Bank’s BSRA will include the following 11 contiguous states of the West Region of the United States: Arizona, California, Colorado, Idaho, Montana, Nevada, New Mexico, Oregon, Utah, Washington and Wyoming (see map at Appendix 5).
Ally Bank CRA Strategic Plan 2017-2019 11
SECTION V. PUBLIC PARTICIPATION
A. Informal Public Suggestions
Ally Bank has sought informal suggestions and input from members of the public in the UTAA, as required by 12 C.F.R. § 228.27(d)(1). The Bank works with numerous community partners (both Utah-based and also national) in the development and refinement of its overall strategy to provide responsive loans, investments, and services and also regarding measurable goals. Many of those community partners participated in the Bank’s needs assessment survey discussed above. The categories of entities providing informal suggestions include the following:
x x x x x x x x x x x x x x x
Affordable Housing Developers (both nonprofit and for-profit) State Housing Finance Agency Local Housing Authorities Community Development Financial Institutions (“CDFIs”) Affordable Housing Loan Funds Nonprofit Community Service Providers Healthcare Providers (including Substance Abuse Treatment Providers) Local Food Banks and Homeless Shelters Educational Service Providers Financial Literacy and Individual Development Account (“IDA”) Providers Small Business Capital and Loan Funds Small Business Development Centers Community Development Representatives Entities involved in New Markets Tax Credit (“NMTC”) Projects State, County, and Local Municipalities
Regarding categories of needs to be addressed, the informal suggestions closely mirrored the needs identified in the Bank’s formal survey results. In addition, several community partners requested that the Bank continue to be active in providing capital to small businesses and in helping to establish new and innovative ways to finance small businesses and foster entrepreneurism. Other community partners suggested that the Bank increase its amount of CD lending from the amounts in the 2014-2016 Plan, and that the Bank pursue goals with flexibility that would allow the Bank to respond to needs without regard to whether financing is structured as a loan or as an investment. Regarding the proposed amounts of specific UTAA goals, partners expressed support, especially in light of the competitive CRA environment in Utah.
B. Formal Public Comment Solicitation
Ally Bank solicited formal public comment on this Strategic Plan for 30 days by publishing notice in at least one newspaper of general circulation in the UTAA, as required by 12 C.F.R. § 228.27(d)(2), and made copies of this Strategic Plan available to members of the public who requested it during the 30-day timeframe (a copy of the proof of publication is set forth at Appendix 6). The Bank’s request for comment was published on August 31, 2016, and the 30-day public comment period concluded on September 30, 2016. Ally Bank received eight public comments, which have been placed in the Bank’s public file. The public comments are all supportive of the 2017-2019 Plan, and Ally Bank did not make any subsequent changes to the 2017-2019 Plan in response to the public comments. Prior to submission, the 2017-2019 Plan was approved by Ally Bank’s CRA Committee and the Ally Bank Board.
Ally Bank CRA Strategic Plan 2017-2019 12
SECTION VI. ALLY BANK CRA STRATEGIC PLAN AND MEASURABLE GOALS
This Strategic Plan and its measurable goals reflect thorough analyses of the credit needs and opportunities in Ally Bank’s UTAA (including public input); the Bank’s business strategy, capacity, and constraints; the Bank’s 2014-2016 Plan; the Bank’s past CRA performance; the CRA performance of peer banks; and recently approved CRA Strategic Plans of other banks. Ally Bank’s measurable goals reflect the latitude described in the Federal Reserve Board’s Guidelines for Requesting Approval for a Strategic Plan Under the Community Reinvestment Act (“FRB Strategic Plan Guidelines”), which provide as follows:
The strategic plan evaluation option in the regulation provides a bank with the opportunity to tailor its CRA objectives to the needs of its community and to its own capacities, business strategies and expertise. Therefore, not all of the factors described in the regulation would necessarily apply to each strategic plan. A bank has a great deal of latitude in constructing a strategic plan, but it is expected that public participation in development of the plan will provide a bank access to the fullest possible information about the needs of its community and how those needs might be met.
Ally Bank’s measurable goals also reflect the regulatory flexibility regarding a bank’s measurable goals, both in how the goals are expressed and regarding the three performance categories (loans, investments, and services). For example, although the regulations provide that a bank should address in its plan all three performance categories and emphasize lending and lending-related activities, they also provide:
Nevertheless, a different emphasis, including a focus on one or more performance categories, may be appropriate if responsive to the characteristics and credit needs of its assessment area(s), considering public comment and the bank’s capacity and constraints, product offerings, and business strategy. 12 C.F.R. § 228.27(f)(ii).
Ally Bank has developed its two main measurable goals based upon these regulatory guidelines. Ally Bank believes strongly that the construct of the combined loans and investments goal, in particular, will provide the Bank with the critical flexibility necessary to be much more responsive to community needs and opportunities as they arise.
Certain goals in this Strategic Plan were partially derived from confidential, proprietary non-public information and analyses. Therefore, where noted, the basis for the goals is contained in Confidential Exhibits that are bound separately from this Strategic Plan.
A. Definitions
As used in this Strategic Plan, the following definitions16 shall apply:
x “Auto Loan” includes: (1) loans to LMI consumers for the purchase of a vehicle (“LMI Consumer Auto Loan”), and
(2) closed-end loans of $1,000,000 or less to businesses located in an LMI census tract for the purchase of a vehicle (“Small Business Auto Loan”).
x “Broader Statewide or Regional Area” or “BSRA” shall include, for purposes of Ally Bank’s CD activities, the 11 contiguous states of the West Region of the United States: Arizona, California, Colorado, Idaho, Montana, Nevada, New Mexico, Oregon, Utah, Washington and Wyoming (Appendix 5).
16 For all defined terms, the LMI qualification shall be determined based on AMI/ MFI figures applicable as of the date of origination or purchase by Ally Bank or AFI, regardless of any subsequent changes in AMI/MFI.
Ally Bank CRA Strategic Plan 2017-2019 13

x “CRA-Qualifying Loan” includes the following loans either originated or purchased by Ally Bank (or, at the Bank’s election, AFI): (1) CD Loans; (2) Mortgages to LMI Borrowers as defined below; and (3) Auto Loans as defined above.
x “Community Development” (“CD”) has the meaning set forth in 12 C.F.R. § 228.12(g)(1) – (5), with sections (1) through (4) as follows:
1. Affordable housing (including multifamily rental housing) for low- or moderate-income individuals;
2. Community services targeted to low- or moderate-income individuals; 3. Activities that promote economic development by financing businesses or farms that meet the
size eligibility standards of the Small Business Administration’s Development Company or Small Business Investment Company programs (13 CFR 121.301) or have gross annual revenues of $1 million or less; or
4. Activities that revitalize or stabilize: (i) low- or moderate-income geographies; (ii) designated disaster areas; or (iii) distressed or underserved nonmetropolitan middle-income geographies designated by the
Board of Governors of the Federal Reserve System, FDIC, and the Office of the Comptroller of the Currency . . . .
x “CD Loan” has the meaning set forth in 12 C.F.R. § 228.12(h): a loan that has as its primary purpose community development and . . . benefits the bank’s assessment areas(s) or a broader statewide or regional area that includes the bank’s assessment area(s).
x “CD Investment” has the same meaning as “Qualified Investment” set forth in 12 C.F.R. § 228.12(t): a lawful investment, deposit, membership share, or grant that has as its primary purpose community development.
x “CD Service” has the meaning set forth in 12 C.F.R. § 228.12(i): a service that has as its primary purpose community development and is related to the provision of financial services
x “Mortgage Loan to LMI Borrower” means a loan to an LMI borrower for the purchase or refinance of a residence.
x “New Originations” for a calendar year will include new CD Investments, new CRA-Qualifying Loans either originated or purchased by Ally Bank, and existing CD Loans that are renewed and credit underwritten that year (can only count each loan once per year).
B. Framework and Methodology
Ally Bank will make $2.5 billion in loans and investments and provide 2000 volunteer hours of CD Services over the three-year plan period to earn an “Outstanding” CRA rating. There will be two main goals: the first goal is for combined CRA-Qualifying Loans & CD Investments and the second goal is for CD Services. The framework and methodology for each of these two goals are discussed below.
1. Goal for Combined CRA-Qualifying Loans & CD Investments: There is one overall combined goal for new originations of CRA-Qualifying Loans & CD Investments (“Combined Loans & Investments Goal”), which is more than double the Bank’s actual CRA performance in 2014 and 2015. There are also annual interim goals expressed in terms of “ranges” from $600 million to $1.1 billion (see Table 6 below). In order to allow Ally Bank
Ally Bank CRA Strategic Plan 2017-2019 14

-
sufficient time to implement such significant CRA Portfolio increases in a safe and sound manner, the annual interim goal amount range is lowest in 2017 (Plan Year 1), then increases gradually in 2018 (Plan Year 2), and culminates with the highest annual interim goal range being in 2019 (Plan Year 3):
Table 6: Annual Interim Goal Ranges Ally Bank CRA Strategic Plan 2017-2019 Goals for "Outstanding"
I. Combined Goal for CRA Qualifying Loans & CD Investments for "Outstanding" Three-year plan goal for 2017-2019 for "Outstanding": $2.5 billion in New Originations
Annual Interim Goals for "Outstanding":
2017 $600 million - $900 million 2018 $700 million - $1.0 billion 2019 $800 million - $1.1 billion
The Combined Loans & Investments Goal also contains the following features:
x UTAA goals: Because Ally Bank’s highest CRA priority is responding to the needs and opportunities in the UTAA, there are three specific UTAA lending and investment goals that must be achieved through CRA-Qualifying Loans or CD Investments that benefit the UTAA, including activities in the BSRA that directly benefit the UTAA and entities whose purpose, function, or mandate includes serving geographies or individuals located within the UTAA (Interagency Q&A §___.12(h)-6)). The three specific UTAA goals include:
o
o
o
Auto Loans: This goal encompasses both LMI Consumer Auto Loans and Small Business Auto Loans, and is appropriate in light of Ally’s position as a national leader in auto finance. This goal contains a requirement that at least 90% of the Small Business Auto Loans must be $100,000 or under. The Auto Loans goal is a continuation of the auto-related goals in the Bank’s 2014-2016 Plan, and the goal amounts are incrementally higher than in the 20142016 Plan.
Mortgage Loans to LMI Borrowers: This goal is reflective of Ally’s commitment to affordable single family housing for LMI individuals, with the goal amount being based upon the Bank’s actual 2015 and YTD 2016 UTAA Mortgage Loans to LMI Borrowers in the UTAA, as further described in Confidential Exhibit B.
CD Loans/Investments: This goal is appropriate because CD Loans and CD Investments have historically made up the vast majority of the dollar amounts of Ally Bank’s CRA performance in the UTAA, primarily because Ally Bank’s nationwide business model results in the Bank having small dollar amounts of its consumer/small business loans in the UTAA. The CD Loans/Investments goal amount is based upon the Bank’s 2014-2016 Plan and represents an increase over the Bank’s performance in 2014-15 (further basis for the CD Loans/Investments goal amount is set forth in Confidential Exhibit B).
x UTAA or BSRA: The Combined Loans & Investments Goal framework provides that if Ally Bank achieves the three specific UTAA goals for a calendar year, then Ally Bank will also receive credit for amounts deployed in that same calendar year as (a) either CD Investments, CD Loans or Mortgage Loans to LMI Borrowers that will benefit (b) either the UTAA or the BSRA (CD activities in the BSRA do not have to benefit the UTAA). Pursuant to applicable regulations, Mortgages to LMI Borrowers are not subject to the BSRA geographic restrictions on CD Loans/Investments/Services. Accordingly, if the UTAA goals for LMI Mortgage Loans are met, LMI Mortgage Loans anywhere in the United States will count toward the total goal amounts.
x Any amount in excess of the designated “annual interim goal” amount in one calendar year for a certain asset category may be applied toward the next calendar year’s “annual interim goal” for that same
Ally Bank CRA Strategic Plan 2017-2019 15

asset category. This will allow Ally Bank the flexibility to meet needs that arise late in a calendar year without concern about significantly exceeding the annual interim goal amount for that year.
x For purposes of this Strategic Plan and all defined terms herein, the LMI qualification shall be determined based on AMI/MFI figures applicable as of the date of origination or purchase by Ally Bank or AFI, regardless of any subsequent changes in AMI/MFI.
x As allowed under CRA regulations, Ally Bank may, but is not required to, choose to take credit for CRA-Qualifying Loans and CD Investments originated or purchased by AFI or any subsidiary of AFI.
The overall construct of the Combined Loans & Investments Goal allows Ally Bank the important flexibility to structure transactions in ways that are most responsive to community needs, which may differ from year to year. For example, in one specific calendar year there may be an opportunity to extend large amounts of CD Loans, but the next year there may be few such opportunities. Additionally, pricing and availability of certain types of CD Investments (both equity and debt) may vary widely from year to year. The flexible framework of the Combined Loans & Investments Goal will be critical for Ally Bank as it seeks to deploy between $600 million - $1.1 billion of CRA-Qualifying Loans and CD Investments each year in a safe and sound manner. The framework will also allow Ally Bank to more effectively manage its increasingly large and complex CRA Portfolio.
Ally Bank’s goal amounts for “Outstanding“ are set forth in Section VI.C. below. These goal amounts build upon Ally Bank’s CRA performance under its 2014-2016 Plan (approximately $354 million of new CD Loan and Investment originations in 2014 and approximately $366 million in 2015). Ally Bank’s Total Assets have increased by approximately 21% (from $94.8 billion to $114.6 billion) since it submitted its 2014-2016 Plan, but the $2.5 billion total goal amount of new originations for “Outstanding” represents an increase of more than 100% over the aggregate amount of the Bank’s 2014-2016 Plan goals for “Outstanding.”
Ally Bank’s 2017-2019 Plan also contains a Combined Loans & Investments Goal for “Satisfactory” (broken into “High Satisfactory” and “Low Satisfactory,” as set forth in Section VI.D. below). In establishing goal levels for “Outstanding” and “Satisfactory,” Ally Bank followed regulatory guidance that the goals must be “measurable” (12 C.F.R. § 228.27(f)(3)). From a performance context perspective, Ally Bank also considered its own past performance and goals, and also those of similarly situated lenders (Utah-based banks operating under approved CRA Strategic Plans). Ally Bank’s 2014-2016 Plan contained an increase of approximately 22% from “Satisfactory” to “Outstanding.” For its 2017-2019 Plan, Ally Bank has increased that difference to 31.58%, which is reflective of setting a higher bar for an “Outstanding” rating. The 31.58% difference is also more commensurate with (a) the 31.17% average increase from “Satisfactory” to “Outstanding” of the Utah-based banks with approved CRA Strategic Plans (see Appendix Table 7.1.), and (b) the approximately 31.25% weighted average increase from “Satisfactory” to “Outstanding” of the representative non-traditional banks with CRA Strategic Plans approved by the FDIC, FRB and OCC (see Appendix Table 7.2.).
Ally Bank has sought and received informal input regarding the 2017-2019 Plan goals, including the overall goal amount of $2.5 billion and also the specific amounts for the three UTAA goals, from several community partners. These community partners expressed support for both the overall goal amount and the specific UTAA goals, especially in light of the increase over the Bank’s past performance and 2014-2016 goal amounts. The 2017-2019 goal amounts are also appropriate in light of the CRA performance of almost 20 peer banks (including those listed in Table 5 above) with assets of $10 billion or more and nationwide lending and deposits but few or no branches or ATMs. Those peer banks had a weighted average of CD Loans/Investments new originations per year of approximately .50 % of average Total Assets while Ally Bank’s $2.5 billion overall goal amount represents approximately .66%, which is significantly higher (see extensive analyses at Confidential Exhibit C).
Ally Bank CRA Strategic Plan 2017-2019 16

In executing the Combined Loans & Investments Goal, Ally Bank’s CD Loans and Investments will likely include the following:
x x
x x x
x
x x x
x
Loans to financial intermediaries such as CDFIs Loans to organizations engaged in affordable housing construction or rehabilitation, including multifamily rental housing, targeted to benefit LMI individuals Loans to or equity investments in LIHTC projects Loans to or equity investments in NMTC projects Loans to or equity investments in SBICs and community development venture capital funds that promote economic development by financing small businesses Loans to or equity investments in community facilities that provide services targeted to benefit LMI individuals Loans to or equity investments in projects that revitalize or stabilize LMI geographies Purchase of mortgage-backed securities with underlying loans to LMI individuals Purchase of state and municipal obligations, such as revenue bonds, that specifically support affordable housing or other categories of community development Charitable donations to entities providing services to LMI individuals
Ally Bank will also seek to develop innovative and complex loans and investments such as the University Growth Fund I (“UGF”) and Kickstart Seed Fund III (“Kickstart”). Ally Bank served as the lead investor ($10 million) in UGF, a highly innovative and complex community development venture capital fund that provides much needed equity capital to small businesses while also giving LMI student associates an unparalleled educational experience through real-world experience in venture capital and private equity investing. The vast majority of the labor to perform due diligence and run UGF is provided by student associates, who commit to at least 20 hours per week over a two-year period. UGF partners with prominent venture capital firms throughout the U.S. to perform due diligence and other value add projects in return for the opportunity to co-invest in portfolio companies that promote economic development. With over $30 million in committed capital from institutional and accredited investors, UGF has become the largest student-led fund in the world and is the first such fund to apply for an SBIC license. The formation of UGF involved multiple layers of collaboration across several industries, including the venture capital, academia, banking, economic development and nonprofit industries.
Ally Bank continued its focus on innovative student participation in the venture capital industry by investing in Kickstart, which formed the Campus Founders Fund (“CFF”) in 2014 with an initial allocation of $500,000. The mission of CFF is to provide investment funds to student “founders” of new companies that originate from any campus (educational institution) in Utah. CFF is managed entirely by a team of eight to ten university students (mostly LMI) who are responsible for identifying and approving investments in small companies founded by students. CFF makes investments of up to $20,000 to help these small student-run companies test an idea and develop an initial product. The Kickstart team provides ongoing training, technical assistance, mentoring and valuable networking opportunities to the students running CFF and also to the student founders of the companies in which CFF invests. CFF has made investments in 10 newly formed companies, many of which have since raised additional capital. Kickstart has been an active seed investor in Utah, and sees CFF as a logical extension of Kickstart’s efforts to help grow Utah’s small business ecosystem, develop young talent and encourage entrepreneurism in general. Ally Bank has worked with Kickstart to further develop and expand the CFF program to make it available to more students throughout Utah. Additional innovative and complex CD Loans and CD Investments currently in development are described in Confidential Exhibit B.
2. Goal for CD Services: There is one goal for CD Services, which is expressed in terms of the number of hours spent performing qualifying CD Services. The Bank’s goals for number of CD Service hours for “Outstanding“ are set forth in Section VI.C. below, and represent Ally Bank’s strong commitment to serving its
Ally Bank CRA Strategic Plan 2017-2019 17

community. The goal for “Outstanding” represents almost 17 hours for each Ally Bank employee located in Utah (an increase of almost 3 hours per Utah employee over the 2014-2016 Plan levels). Ally Bank strives to engage in a variety of types of CD Services. The largest components of the Bank’s CD Service hours are (a) service on qualifying nonprofit Boards of Directors (or Committees) that focus on affordable housing or community services targeted to benefit LMI individuals, and (b) teaching financial literacy to LMI individuals. Ally Bank anticipates that these two categories of services will remain major components of the Bank’s overall CD Services efforts in the future.
Historically, almost all of the Bank’s CD Service hours have been performed by Utah-based Bank employees (currently 40 FTE). Under this Strategic Plan, the CD Service hours may be performed by Bank employees, members of the Ally Bank Board, or by employees of AFI or any subsidiary of AFI. At least 50% of the CD Service hours must be within the UTAA, with the remaining 50% benefitting either the UTAA or the BSRA. Any CD Service Hours in excess of the designated “annual interim goal” in one calendar year may be applied toward the next calendar year’s “annual interim goal.” This goal is appropriate in light of the Bank’s relatively small Utah-based staff, and is significantly higher than the average CD Service hours of peer banks (additional basis for the CD Services goal is set forth in Confidential Exhibit B).
In carrying out the CD Services goal, Ally Bank’s CD Services will likely include one or more of the following:
x Providing technical assistance on financial matters to nonprofit, tribal, or government organizations serving LMI housing or economic revitalization and development needs
x Developing or teaching financial education or literacy to LMI individuals and in LMI geographies x Providing foreclosure prevention programs to LMI homeowners who are facing foreclosure on their
primary residence with the objective of providing affordable, sustainable, long-term loan modifications and restructurings
x Supporting organizations and facilities providing education and services for LMI children, students, and adults
x Providing credit counseling, homebuyer and home-maintenance counseling, financial planning, or other financial services education to promote community development and affordable housing
x Other qualified service opportunities that may be identified in the future
Ally Bank will also seek to develop innovative CD Service opportunities such as the UGF Institute, a 501(c)(3) nonprofit organization that Ally Bank helped develop. The UGF Institute was formed in conjunction with UGF and is dedicated solely to UGF’s LMI student associates and to maintaining the quality of the real-world venture capital and private equity investment educational experience. The UGF Institute Board consists of representatives of the educational, banking, and venture capital sectors; a member of the Ally Bank CRA Department serves on the UGF Institute Board of Directors.
Ally Bank will continue to seek to be responsive to CD Service opportunities that will have an impact on targeted LMI populations. With the high need for technical assistance to community development organizations, Ally Bank’s employee base actively participates in serving on multiple boards of directors or committees for local nonprofits that serve the LMI community. For example, one member of the Ally Bank CRA Department serves as Chair of the Board for a relatively new nonprofit dedicated to serving the unique needs of women refugees who are living in Utah. Annually, Utah accepts more than 500 refugees for resettlement from all over the world (www.rescue.org), and Utah communities have been faced with unique challenges that require innovative solutions and investment of human capital. Ally Bank has also provided financial education outreach to low-income populations using Wallet Wise, Ally’s premier financial literacy program. Wallet Wise provides financial education either online or in-person, in English or in Spanish, to help individuals meet their financial goals.
Ally Bank CRA Strategic Plan 2017-2019 18
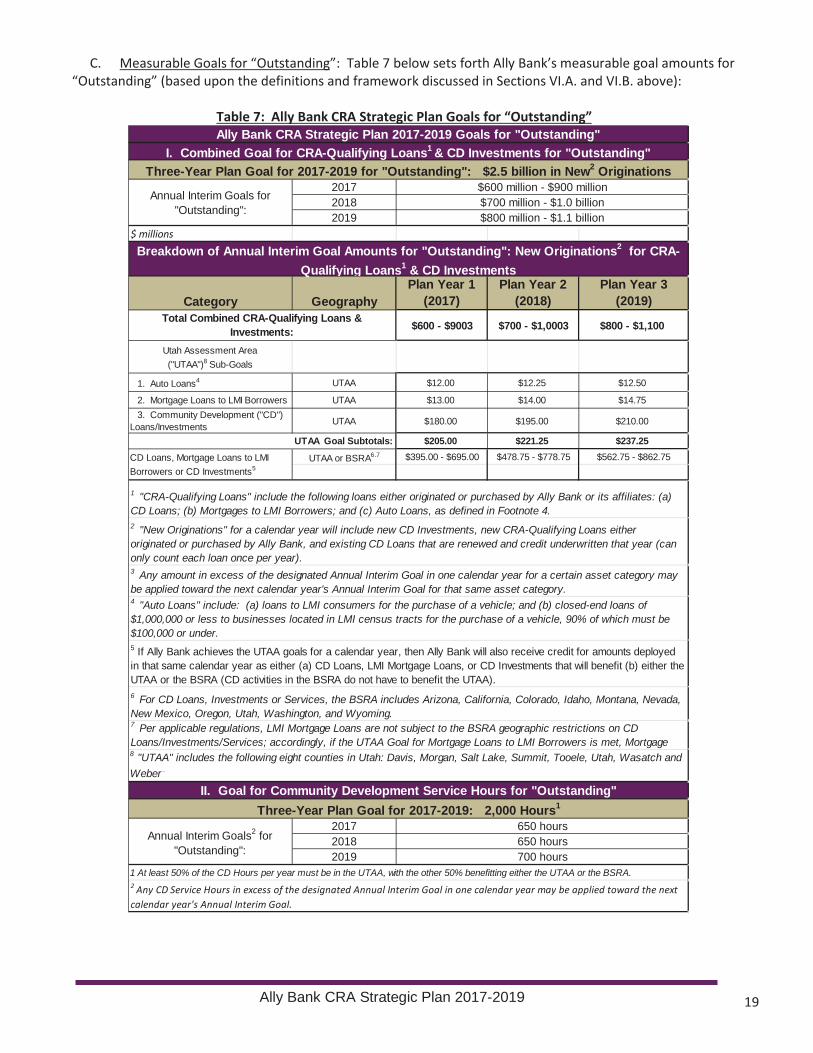
C. Measurable Goals for “Outstanding”: Table 7 below sets forth Ally Bank’s measurable goal amounts for “Outstanding” (based upon the definitions and framework discussed in Sections VI.A. and VI.B. above):
Table 7: Ally Bank CRA Strategic Plan Goals for “Outstanding” Ally Bank CRA Strategic Plan 2017-2019 Goals for "Outstanding"
I. Combined Goal for CRA-Qualifying Loans1 & CD Investments for "Outstanding" Three-Year Plan Goal for 2017-2019 for "Outstanding": $2.5 billion in New2 Originations
Annual Interim Goals for "Outstanding":
2017 $600 million - $900 million 2018 $700 million - $1.0 billion 2019 $800 million - $1.1 billion
$ millions Breakdown of Annual Interim Goal Amounts for "Outstanding": New Originations2 for CRA-
Qualifying Loans1 & CD Investments
Category Geography Plan Year 1
(2017) Plan Year 2
(2018) Plan Year 3
(2019) Total Combined CRA-Qualifying Loans &
Investments: $600 - $9003 $700 - $1,0003 $800 - $1,100
Utah Assessment Area ("UTAA")8 Sub-Goals
1. Auto Loans4 UTAA $12.00 $12.25 $12.50
2. Mortgage Loans to LMI Borrowers UTAA $13.00 $14.00 $14.75 3. Community Development ("CD")
Loans/Investments UTAA $180.00 $195.00 $210.00
UTAA Goal Subtotals: $205.00 $221.25 $237.25 CD Loans, Mortgage Loans to LMI Borrowers or CD Investments5
UTAA or BSRA6.7 $395.00 - $695.00 $478.75 - $778.75 $562.75 - $862.75
8 "UTAA" includes the following eight counties in Utah: Davis, Morgan, Salt Lake, Summit, Tooele, Utah, Wasatch and Weber .
1 "CRA-Qualifying Loans" include the following loans either originated or purchased by Ally Bank or its affiliates: (a) CD Loans; (b) Mortgages to LMI Borrowers; and (c) Auto Loans, as defined in Footnote 4. 2 "New Originations" for a calendar year will include new CD Investments, new CRA-Qualifying Loans either originated or purchased by Ally Bank, and existing CD Loans that are renewed and credit underwritten that year (can only count each loan once per year). 3 Any amount in excess of the designated Annual Interim Goal in one calendar year for a certain asset category may be applied toward the next calendar year's Annual Interim Goal for that same asset category. 4 "Auto Loans" include: (a) loans to LMI consumers for the purchase of a vehicle; and (b) closed-end loans of $1,000,000 or less to businesses located in LMI census tracts for the purchase of a vehicle, 90% of which must be $100,000 or under. 5 If Ally Bank achieves the UTAA goals for a calendar year, then Ally Bank will also receive credit for amounts deployed in that same calendar year as either (a) CD Loans, LMI Mortgage Loans, or CD Investments that will benefit (b) either the UTAA or the BSRA (CD activities in the BSRA do not have to benefit the UTAA). 6 For CD Loans, Investments or Services, the BSRA includes Arizona, California, Colorado, Idaho, Montana, Nevada, New Mexico, Oregon, Utah, Washington, and Wyoming. 7 Per applicable regulations, LMI Mortgage Loans are not subject to the BSRA geographic restrictions on CD Loans/Investments/Services; accordingly, if the UTAA Goal for Mortgage Loans to LMI Borrowers is met, Mortgage
II. Goal for Community Development Service Hours for "Outstanding" Three-Year Plan Goal for 2017-2019: 2,000 Hours1
Annual Interim Goals2 for "Outstanding":
2017 650 hours 2018 650 hours 2019 700 hours
1 At least 50% of the CD Hours per year must be in the UTAA, with the other 50% benefitting either the UTAA or the BSRA. 2 Any CD Service Hours in excess of the designated Annual Interim Goal in one calendar year may be applied toward the next calendar year's Annual Interim Goal.
Ally Bank CRA Strategic Plan 2017-2019 19
-
-
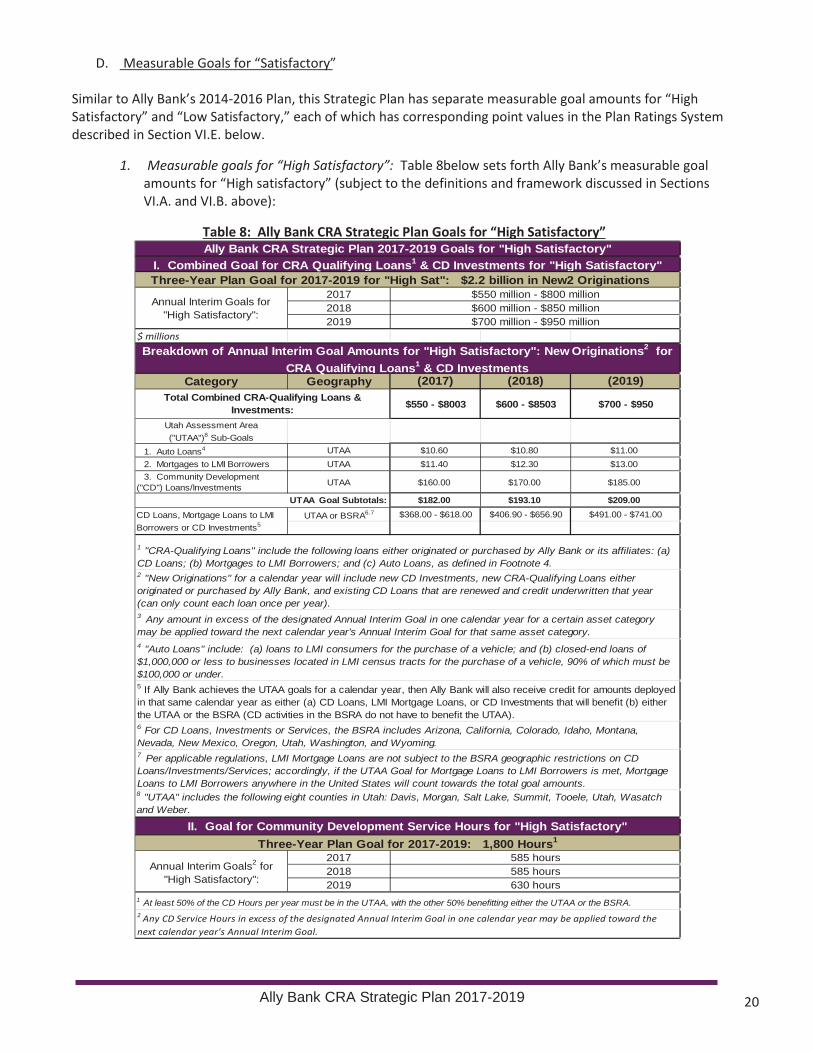
D. Measurable Goals for “Satisfactory”
Similar to Ally Bank’s 2014-2016 Plan, this Strategic Plan has separate measurable goal amounts for “High Satisfactory” and “Low Satisfactory,” each of which has corresponding point values in the Plan Ratings System described in Section VI.E. below.
1. Measurable goals for “High Satisfactory”: Table 8 below sets forth Ally Bank’s measurable goal amounts for “High satisfactory” (subject to the definitions and framework discussed in Sections VI.A. and VI.B. above):
Table 8: Ally Bank CRA Strategic Plan Goals for “High Satisfactory” Ally Bank CRA Strategic Plan 2017-2019 Goals for "High Satisfactory"
I. Combined Goal for CRA Qualifying Loans1 & CD Investments for "High Satisfactory" Three-Year Plan Goal for 2017-2019 for "High Sat": $2.2 billion in New2 Originations
Annual Interim Goals for "High Satisfactory":
2017 $550 million - $800 million 2018 $600 million - $850 million 2019 $700 million - $950 million
$ millions Breakdown of Annual Interim Goal Amounts for "High Satisfactory": New Originations2 for
CRA Qualifying Loans1 & CD Investments Category Geography (2017) (2018) (2019)
Total Combined CRA-Qualifying Loans & Investments: $550 - $8003 $600 - $8503 $700 - $950
Utah Assessment Area ("UTAA")8 Sub-Goals
1. Auto Loans4 UTAA $10.60 $10.80 $11.00 2. Mortgages to LMI Borrowers UTAA $11.40 $12.30 $13.00 3. Community Development
("CD") Loans/Investments UTAA $160.00 $170.00 $185.00
UTAA Goal Subtotals: $182.00 $193.10 $209.00 CD Loans, Mortgage Loans to LMI Borrowers or CD Investments5
UTAA or BSRA6.7 $368.00 - $618.00 $406.90 - $656.90 $491.00 - $741.00
1 "CRA-Qualifying Loans" include the following loans either originated or purchased by Ally Bank or its affiliates: (a) CD Loans; (b) Mortgages to LMI Borrowers; and (c) Auto Loans, as defined in Footnote 4. 2 "New Originations" for a calendar year will include new CD Investments, new CRA-Qualifying Loans either originated or purchased by Ally Bank, and existing CD Loans that are renewed and credit underwritten that year (can only count each loan once per year). 3 Any amount in excess of the designated Annual Interim Goal in one calendar year for a certain asset category may be applied toward the next calendar year's Annual Interim Goal for that same asset category. 4 "Auto Loans" include: (a) loans to LMI consumers for the purchase of a vehicle; and (b) closed-end loans of $1,000,000 or less to businesses located in LMI census tracts for the purchase of a vehicle, 90% of which must be $100,000 or under. 5 If Ally Bank achieves the UTAA goals for a calendar year, then Ally Bank will also receive credit for amounts deployed in that same calendar year as either (a) CD Loans, LMI Mortgage Loans, or CD Investments that will benefit (b) either the UTAA or the BSRA (CD activities in the BSRA do not have to benefit the UTAA). 6 For CD Loans, Investments or Services, the BSRA includes Arizona, California, Colorado, Idaho, Montana, Nevada, New Mexico, Oregon, Utah, Washington, and Wyoming. 7 Per applicable regulations, LMI Mortgage Loans are not subject to the BSRA geographic restrictions on CD Loans/Investments/Services; accordingly, if the UTAA Goal for Mortgage Loans to LMI Borrowers is met, Mortgage Loans to LMI Borrowers anywhere in the United States will count towards the total goal amounts. 8 "UTAA" includes the following eight counties in Utah: Davis, Morgan, Salt Lake, Summit, Tooele, Utah, Wasatch and Weber.
II. Goal for Community Development Service Hours for "High Satisfactory" Three-Year Plan Goal for 2017-2019: 1,800 Hours1
Annual Interim Goals2 for "High Satisfactory":
2017 585 hours 2018 585 hours 2019 630 hours
2 Any CD Service Hours in excess of the designated Annual Interim Goal in one calendar year may be applied toward the next calendar year's Annual Interim Goal.
1 At least 50% of the CD Hours per year must be in the UTAA, with the other 50% benefitting either the UTAA or the BSRA.
Ally Bank CRA Strategic Plan 2017-2019 20

-
2. Measurable goals for “Low Satisfactory”: Table 9 below sets forth Ally Bank’s measurable goal amounts for “Low Satisfactory” (subject to the definitions and framework discussed in Sections VI.A. and VI.B. above):
Table 9: Ally Bank CRA Strategic Plan Goals for “Low Satisfactory” Ally Bank CRA Strategic Plan 2017-2019 Goals for "Low Satisfactory"
I. Combined Goal for Qualifying Loans1 & CD Investments for "Low Satisfactory" Three-Year Plan Goal for 2017-2019 for "Low Sat": $1.9 billion in New2 Originations
Annual Interim Goals for "Low Satisfactory":
2017 $450 million - $650 million 2018 $550 million - $750 million 2019 $600 million - $800 million
$ millions
Breakdown of Annual Interim Goal Amounts for "Low Satisfactory": New Originations2 for CRA Qualifying Loans1 & CD Investments
Category Geography Plan Year 1
(2017) Plan Year 2
(2018) Plan Year 3
(2019) Total Combined CRA-Qualifying Loans &
Investments: $450 - $6503 $550 - $7503 $600 - $800
Utah Assessment Area ("UTAA")8 Sub-Goals
1. Auto Loans4 UTAA $9.10 $9.30 $9.50 2. Mortgages to LMI Borrowers UTAA $9.90 $10.60 $11.20 3. Community Development
("CD") Loans/Investments UTAA $135.00 $150.00 $160.00
UTAA Goal Subtotals: $154.00 $169.90 $180.70 CD Loans, Mortgage Loans to LMI Borrowers or CD Investments5
UTAA or BSRA6.7 $296.00 - $496.00 $380.10 - $580.10 $419.30 - $619.30
8 "UTAA" includes the following eight counties in Utah: Davis, Morgan, Salt Lake, Summit, Tooele, Utah, Wasatch and Weber.
1 "CRA-Qualifying Loans" include the following loans either originated or purchased by Ally Bank or its affiliates: (a) CD Loans; (b) Mortgages to LMI Borrowers; and (c) Auto Loans, as defined in Footnote 4. 2 "New Originations" for a calendar year will include new CD Investments, new CRA-Qualifying Loans either originated or purchased by Ally Bank, and existing CD Loans that are renewed and credit underwritten that year (can only count each loan once per year). 3 Any amount in excess of the designated Annual Interim Goal in one calendar year for a certain asset category may be applied toward the next calendar year's Annual Interim Goal for that same asset category.
4 "Auto Loans" include: (a) loans to LMI consumers for the purchase of a vehicle; and (b) closed-end loans of $1,000,000 or less to businesses located in LMI census tracts for the purchase of a vehicle, 90% of which must be $100,000 or under. 5 If Ally Bank achieves the UTAA goals for a calendar year, then Ally Bank will also receive credit for amounts deployed in that same calendar year as either (a) CD Loans, LMI Mortgage Loans, or CD Investments that will benefit (b) either the UTAA or the BSRA (CD activities in the BSRA do not have to benefit the UTAA).
6 For CD Loans, Investments or Services, the BSRA includes Arizona, California, Colorado, Idaho, Montana, Nevada, New Mexico, Oregon, Utah, Washington, and Wyoming. 7 Per applicable regulations, LMI Mortgage Loans are not subject to the BSRA geographic restrictions on CD Loans/Investments/Services; accordingly, if the UTAA Goal for Mortgage Loans to LMI Borrowers is met, Mortgage Loans to LMI Borrowers anywhere in the United States will count towards the total goal amounts.
II. Goal for Community Development Service Hours for "Low Satisfactory" Three-Year Plan Goal for 2017-2019: 1,600 Hours1
Annual Interim Goals2 for "Low Satisfactory":
2017 520 hours 2018 520 hours 2019 560 hours
1 At least 50% of the CD Hours per year must be in the UTAA, with the other 50% benefitting either the UTAA or the BSRA. 2 Any CD Service Hours in excess of the designated Annual Interim Goal in one calendar year may be applied toward the next calendar year's Annual Interim Goal.
Ally Bank CRA Strategic Plan 2017-2019 21

-
E. Strategic Plan Ratings System and Alternate Evaluation Method
1. Strategic Plan Ratings System: Evaluation of the Bank’s performance under this Strategic Plan will be based upon the Strategic Plan Ratings System set forth below in Table 10 (same as the one used in Ally Bank’s 2014-2016 Plan). This system is similar to the rating system used by federal regulators to evaluate large banks, except that the Strategic Plan Rating System below was modified to increase the rating thresholds by one point each to receive an “Outstanding” or a “Satisfactory” rating.
Table 10: Overall Ratings and Points Rating Points
Outstanding 21+ Satisfactory 12-20 Needs to Improve 5-11 Substantial Noncompliance 0-4
The four overall ratings draw from the five-tiered Component Ratings set forth in Table 11 below, with 24 points being available each year. The Combined CRA-Qualifying Loans & CD Investments performance accounts for 75% of the evaluation and CD Services accounts for 25%.
Table 11: Component Ratings
Rating Combined CRA Qualifying Loans & CD Investments
CD Services
Outstanding 18 points 6 points High Satisfactory 13 points 4 points Low Satisfactory 9 points 3 points Needs to Improve 4 points 1 point Substantial Noncompliance 0 points 0 points
2. Alternate Evaluation Method: Ally Bank is committed, at the very minimum, to meeting this Strategic Plan’s measurable goals for a “Satisfactory” rating. However, as provided for in 12 C.F.R. § 228.27(f)(4), if the Bank does not “meet substantially its plan goals for a satisfactory rating,” Ally Bank may elect to be evaluated under the Lending, Investment and Service tests for large banks.
Ally Bank CRA Strategic Plan 2017-2019 22

SECTION VII. REQUEST FOR APPROVAL AND CONTACT INFORMATION
A. Regulatory Criteria for Approval
Ally Bank respectfully submits that it has fulfilled all of the regulatory requirements for CRA strategic plans, including those governing development of the plan, public participation in the plan, and the plan’s measurable goals. As established herein, Ally Bank’s CRA performance context (12 C.F.R. § 228.21(b)(1) – (7)) thoroughly supports the Bank’s measurable goals. Ally Bank believes that Federal Reserve Board approval of the Bank’s Strategic Plan and its measurable goals set forth in Section VI above are appropriate under applicable criteria for evaluation of a strategic plan outlined in 12 C.F.R. § 228.27(g)(3)(i) – (iii) as follows:
(3) Criteria for evaluating plan. The Board evaluates a plan’s measurable goals using the following criteria, as appropriate:
(i) The extent and breadth of lending or lending-related activities, including, as appropriate, the distribution of loans among different geographies, businesses and farms of different sizes, and individuals of different income levels, the extent of community development lending, and the use of innovative or flexible lending practices to address credit needs;
(ii) The amount and innovativeness, complexity, and responsiveness of the bank’s qualified investments; and
(iii) The availability and effectiveness of the bank’s systems for delivering retail banking services and the extent and innovativeness of the bank’s community development services.
The extent and breadth of Ally Bank’s combined lending and investment measurable goals meet these requirements in a number of ways, including the more than 100% increase from the Bank’s total measurable goals for “Outstanding” in its 2014-2016 Plan. Ally Bank will continue to seek out and create new lending, investment and service opportunities that will benefit the UTAA and the BSRA, in accordance with this Strategic Plan’s measurable goals.
B. Request for Approval of Ally Bank CRA Strategic Plan 2017-2019
For the reasons set forth above, Ally Bank respectfully requests Federal Reserve Board approval of this CRA Strategic Plan 2017-2019.
C. Contact Information
Questions regarding this Strategic Plan may be directed to the following:
Jan M. Bergeson Community Reinvestment Act Officer
Ally Bank 6985 Union Park Center
Suite #435 Midvale, UT 84047
Phone: (801) 790-5048 Email: [email protected]
Ally Bank CRA Strategic Plan 2017-2019 23
APPENDICES
Appendix 1: Ally Bank Product, Deposit and Financial Information
Appendix 2: Map of Utah Assessment Area and Census Tracts
Appendix 3: Additional Demographic Information
Appendix 4: Additional Needs Assessment Information
Appendix 5: Map of Broader Statewide or Regional Area
Appendix 6: Proof of Publication of Request for Public Comment
Appendix 7: Support Tables for “Outstanding” and “Satisfactory” Goals Levels
Ally Bank CRA Strategic Plan 2017-2019 24

Appendix 1: Ally Bank Product, Deposit and Financial Information
A. Ally Bank Product Offerings (as of June 30, 2016)
Deposit Products Lending Products Consumer Consumer
Interest Checking Accounts
Savings Accounts
Money Market Savings Accounts
Indirect Automotive Financing
Credit Cards
Certificates of Deposit Commercial Individual Retirement Accounts Wholesale Floorplan Loans
Real Estate Loans Working Capital Loans Equipment Loans Commercial Loans to Business Customers Community Development Loans
B. Ally Bank Loan and Lease Portfolio (as of June 30, 2016)
Loans and Leases As of June 30, 2016
Product Type $000s % of Total Construction $249,725 0.29% 1-4 Family Open-end $1,445,409 1.69% 1-4 Family Closed-end First Liens $9,346,169 10.93% 1-4 Family Closed-end Junior Liens $286,443 0.34% Commercial Real Estate $3,120,348 3.65% Commercial & Industrial $38,898,107 45.51% Automobile $31,855,862 37.27% Other Consumer $33,998 0.04% Loans to nondepository financial institutions $182,086 0.21% Lease financing receivables $55,286 0.06% Total $85,473,433 100.00%
Source: Ally Bank's 06/30/2016 Call Report
Ally Bank CRA Strategic Plan 2017-2019 25

C. Ally Bank Deposits
Ally Bank has established a strong and growing online retail deposit business that has differentiated itself in the financial services industry with consumer-focused best practices such as products with no hidden fees, rules or penalties; straightforward and clear disclosures; low, flat-rate overdraft charges; and an ATM fee reimbursement feature. The following is a summary of Ally Bank’s retail deposits as of June 30, 2016:
Retail Deposit Mix As of June 30, 2016
Product Group Balances ($) % of Total Retail CDs $19,202,980,906 31.36% Online Savings $31,560,170,820 51.55% MMA $6,550,390,037 10.70% Checking $1,313,786,717 2.15% IRA $2,596,038,337 4.24% Total Retail Deposits $61,223,366,817 100.00%
Ally Bank also had approximately $11.3 billion of brokered deposits as of 6/30/2015.
D. Ally Bank Consolidated Reports of Condition and Income - June 30, 2016
Ally Bank’s Consolidated Reports of Condition and Income as June 30, 2016 may be accessed at the following link (after accessing the link, in the Search function select “Call Report” and “6/30/16” and then type in Ally Bank):
https://cdr.ffiec.gov/public/ManageFacsimiles.aspx
E. Projected Financials
A summary of Ally’s projected financials are set forth in Confidential Exhibit A to this Strategic Plan.
Ally Bank CRA Strategic Plan 2017-2019 26
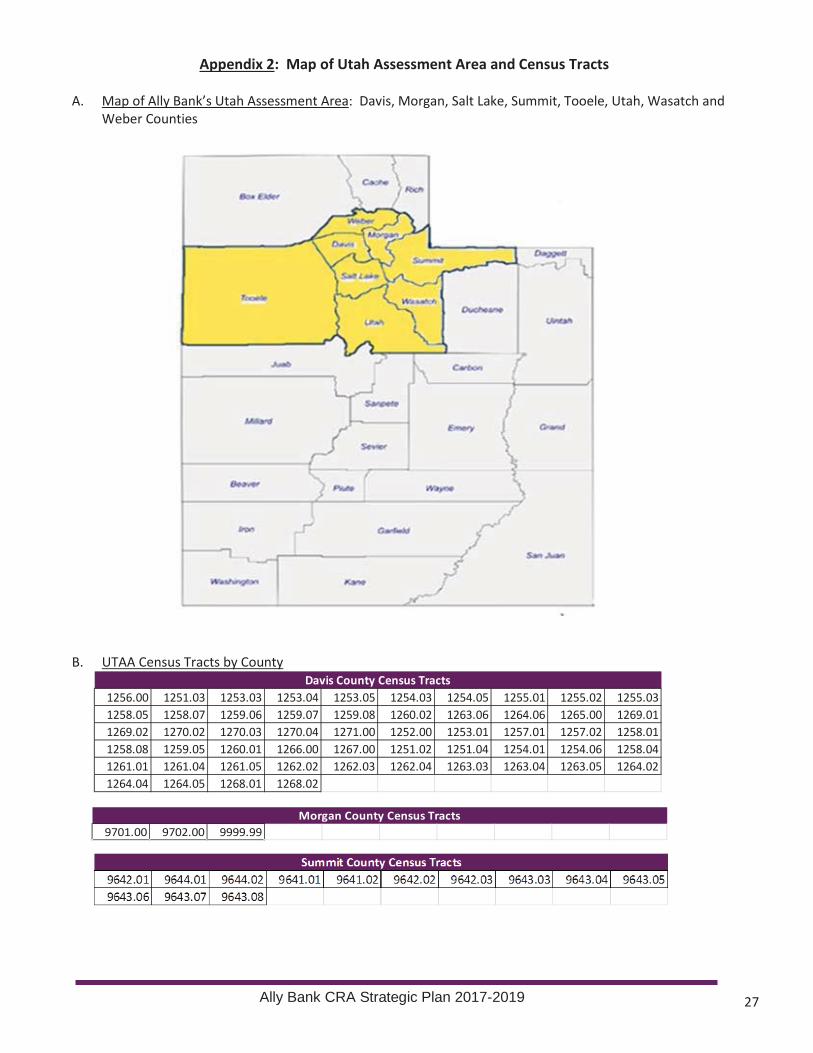
Appendix 2: Map of Utah Assessment Area and Census Tracts
A. Map of Ally Bank’s Utah Assessment Area: Davis, Morgan, Salt Lake, Summit, Tooele, Utah, Wasatch and Weber Counties
B. UTAA Census Tracts by County Davis County Census Tracts
1256.00 1251.03 1253.03 1253.04 1253.05 1254.03 1254.05 1255.01 1255.02 1255.03 1258.05 1258.07 1259.06 1259.07 1259.08 1260.02 1263.06 1264.06 1265.00 1269.01 1269.02 1270.02 1270.03 1270.04 1271.00 1252.00 1253.01 1257.01 1257.02 1258.01 1258.08 1259.05 1260.01 1266.00 1267.00 1251.02 1251.04 1254.01 1254.06 1258.04 1261.01 1261.04 1261.05 1262.02 1262.03 1262.04 1263.03 1263.04 1263.05 1264.02 1264.04 1264.05 1268.01 1268.02
Morgan County Census Tracts 9701.00 9702.00 9999.99
Ally Bank CRA Strategic Plan 2017-2019 27
Summit County Census Tracts 9642.01 9644.01 9644.02 9641.01 9641.02 9642.02 9642.03 9643.03 9643.04 9643.05 9643.06 9643.07 9643.08
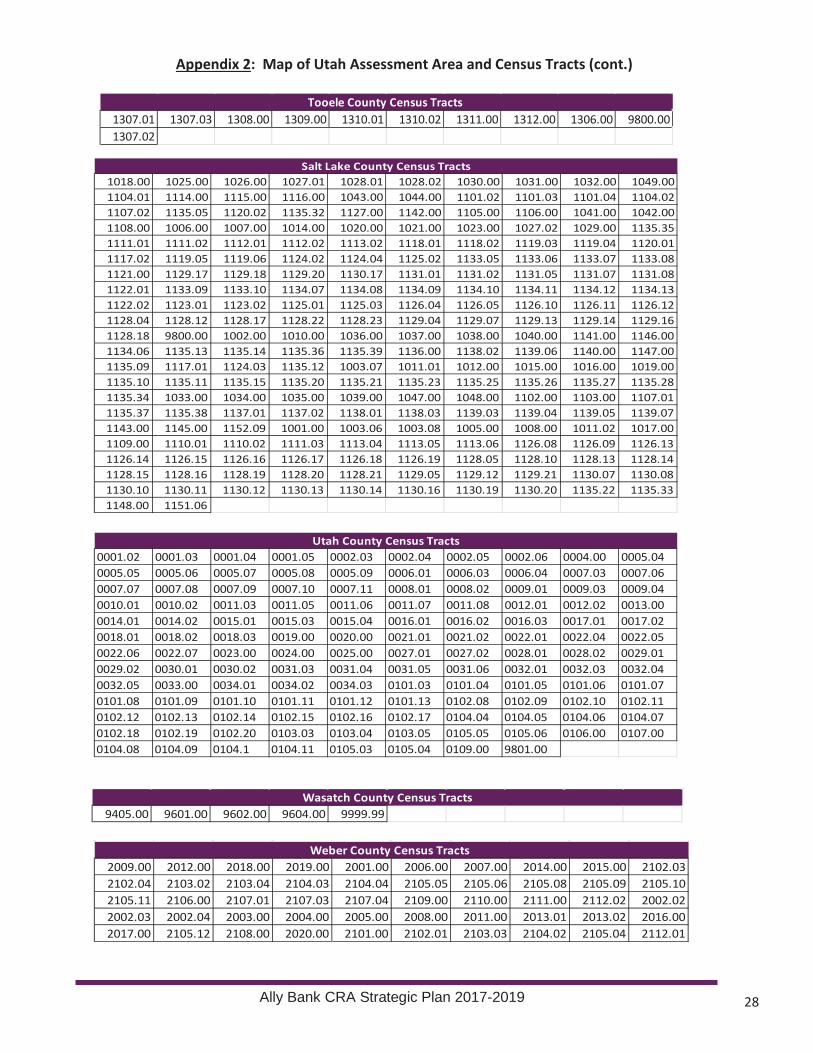
Appendix 2: Map of Utah Assessment Area and Census Tracts (cont.)
Tooele County Census Tracts 1307.01 1307.03 1308.00 1309.00 1310.01 1310.02 1311.00 1312.00 1306.00 9800.00 1307.02
Salt Lake County Census Tracts 1018.00 1025.00 1026.00 1027.01 1028.01 1028.02 1030.00 1031.00 1032.00 1049.00 1104.01 1114.00 1115.00 1116.00 1043.00 1044.00 1101.02 1101.03 1101.04 1104.02 1107.02 1135.05 1120.02 1135.32 1127.00 1142.00 1105.00 1106.00 1041.00 1042.00 1108.00 1006.00 1007.00 1014.00 1020.00 1021.00 1023.00 1027.02 1029.00 1135.35 1111.01 1111.02 1112.01 1112.02 1113.02 1118.01 1118.02 1119.03 1119.04 1120.01 1117.02 1119.05 1119.06 1124.02 1124.04 1125.02 1133.05 1133.06 1133.07 1133.08 1121.00 1129.17 1129.18 1129.20 1130.17 1131.01 1131.02 1131.05 1131.07 1131.08 1122.01 1133.09 1133.10 1134.07 1134.08 1134.09 1134.10 1134.11 1134.12 1134.13 1122.02 1123.01 1123.02 1125.01 1125.03 1126.04 1126.05 1126.10 1126.11 1126.12 1128.04 1128.12 1128.17 1128.22 1128.23 1129.04 1129.07 1129.13 1129.14 1129.16 1128.18 9800.00 1002.00 1010.00 1036.00 1037.00 1038.00 1040.00 1141.00 1146.00 1134.06 1135.13 1135.14 1135.36 1135.39 1136.00 1138.02 1139.06 1140.00 1147.00 1135.09 1117.01 1124.03 1135.12 1003.07 1011.01 1012.00 1015.00 1016.00 1019.00 1135.10 1135.11 1135.15 1135.20 1135.21 1135.23 1135.25 1135.26 1135.27 1135.28 1135.34 1033.00 1034.00 1035.00 1039.00 1047.00 1048.00 1102.00 1103.00 1107.01 1135.37 1135.38 1137.01 1137.02 1138.01 1138.03 1139.03 1139.04 1139.05 1139.07 1143.00 1145.00 1152.09 1001.00 1003.06 1003.08 1005.00 1008.00 1011.02 1017.00 1109.00 1110.01 1110.02 1111.03 1113.04 1113.05 1113.06 1126.08 1126.09 1126.13 1126.14 1126.15 1126.16 1126.17 1126.18 1126.19 1128.05 1128.10 1128.13 1128.14 1128.15 1128.16 1128.19 1128.20 1128.21 1129.05 1129.12 1129.21 1130.07 1130.08 1130.10 1130.11 1130.12 1130.13 1130.14 1130.16 1130.19 1130.20 1135.22 1135.33 1148.00 1151.06
Utah County Census Tracts 0001.02 0001.03 0001.04 0001.05 0002.03 0002.04 0002.05 0002.06 0004.00 0005.04 0005.05 0005.06 0005.07 0005.08 0005.09 0006.01 0006.03 0006.04 0007.03 0007.06 0007.07 0007.08 0007.09 0007.10 0007.11 0008.01 0008.02 0009.01 0009.03 0009.04 0010.01 0010.02 0011.03 0011.05 0011.06 0011.07 0011.08 0012.01 0012.02 0013.00 0014.01 0014.02 0015.01 0015.03 0015.04 0016.01 0016.02 0016.03 0017.01 0017.02 0018.01 0018.02 0018.03 0019.00 0020.00 0021.01 0021.02 0022.01 0022.04 0022.05 0022.06 0022.07 0023.00 0024.00 0025.00 0027.01 0027.02 0028.01 0028.02 0029.01 0029.02 0030.01 0030.02 0031.03 0031.04 0031.05 0031.06 0032.01 0032.03 0032.04 0032.05 0033.00 0034.01 0034.02 0034.03 0101.03 0101.04 0101.05 0101.06 0101.07 0101.08 0101.09 0101.10 0101.11 0101.12 0101.13 0102.08 0102.09 0102.10 0102.11 0102.12 0102.13 0102.14 0102.15 0102.16 0102.17 0104.04 0104.05 0104.06 0104.07 0102.18 0102.19 0102.20 0103.03 0103.04 0103.05 0105.05 0105.06 0106.00 0107.00 0104.08 0104.09 0104.1 0104.11 0105.03 0105.04 0109.00 9801.00
Wasatch County Census Tracts 9405.00 9601.00 9602.00 9604.00 9999.99
Weber County Census Tracts 2009.00 2012.00 2018.00 2019.00 2001.00 2006.00 2007.00 2014.00 2015.00 2102.03 2102.04 2103.02 2103.04 2104.03 2104.04 2105.05 2105.06 2105.08 2105.09 2105.10 2105.11 2106.00 2107.01 2107.03 2107.04 2109.00 2110.00 2111.00 2112.02 2002.02 2002.03 2002.04 2003.00 2004.00 2005.00 2008.00 2011.00 2013.01 2013.02 2016.00 2017.00 2105.12 2108.00 2020.00 2101.00 2102.01 2103.03 2104.02 2105.04 2112.01
Ally Bank CRA Strategic Plan 2017-2019 28
Appendix 3: Additional Demographic Information
A. Salt Lake Housing Forecast 2016, Salt Lake Board of Realtors, located at the following link: http://slrealtors.com/wp-content/uploads/2016/02/2016_Housing_Forecast.pdf
B. Annual Report on Poverty in Utah 2015, Community Action Partnership of Utah, located at the following link:
http://caputah.org/images/poverty-reports-full/2015_Poverty_Report.pdf
C. Department of Workforce Services, located at the following link: https://jobs.utah.gov/wi/press/2001press/ratecurrent.pdf
D. Bureau of Economic Analysis, located at the following link: http://www.bea.gov/regional/bearfacts/pdf.cfm?fips=49000&areatype=STATE&geotype=3
E. Utah’s Fourth Annual Report on Intergenerational Poverty, Welfare Dependency and the Use of Public Assistance 2015, located at the folowing link:
https://jobs.utah.gov/edo/intergenerational/igp15.pdf
F. Utah Governor’s Office of Economic Development, located at the following link: http://business.utah.gov/wp-content/uploads/UtahFactsBook2016.compressed.pdf
G. Economic Development Corporation of Utah’s Economic Overviews (proprietary research reports will be made available upon request)
H. 2016 Economic Report to the Governor Compendium (Summary pages set forth below, with full 155page document being available at the following link:
http://gardner.utah.edu/wp-content/uploads/2016/02/2016_ERG_Compendium.pdf
Ally Bank CRA Strategic Plan 2017-2019 29

Appendix 3: Additional Demographic Information (cont.)
Ally Bank CRA Strategic Plan 2017-2019 30

Appendix 3: Additional Demographic Information (cont.)
Ally Bank CRA Strategic Plan 2017-2019 31
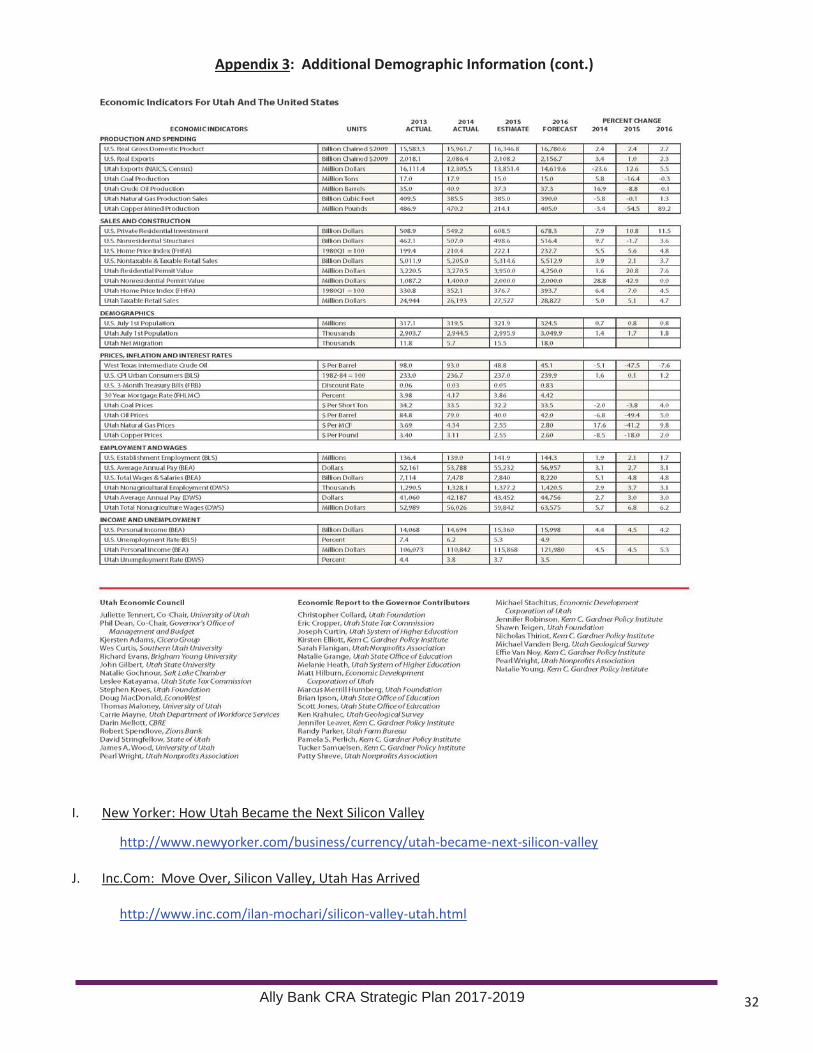
Appendix 3: Additional Demographic Information (cont.)
I. New Yorker: How Utah Became the Next Silicon Valley
http://www.newyorker.com/business/currency/utah-became-next-silicon-valley
J. Inc.Com: Move Over, Silicon Valley, Utah Has Arrived
http://www.inc.com/ilan-mochari/silicon-valley-utah.html
Ally Bank CRA Strategic Plan 2017-2019 32
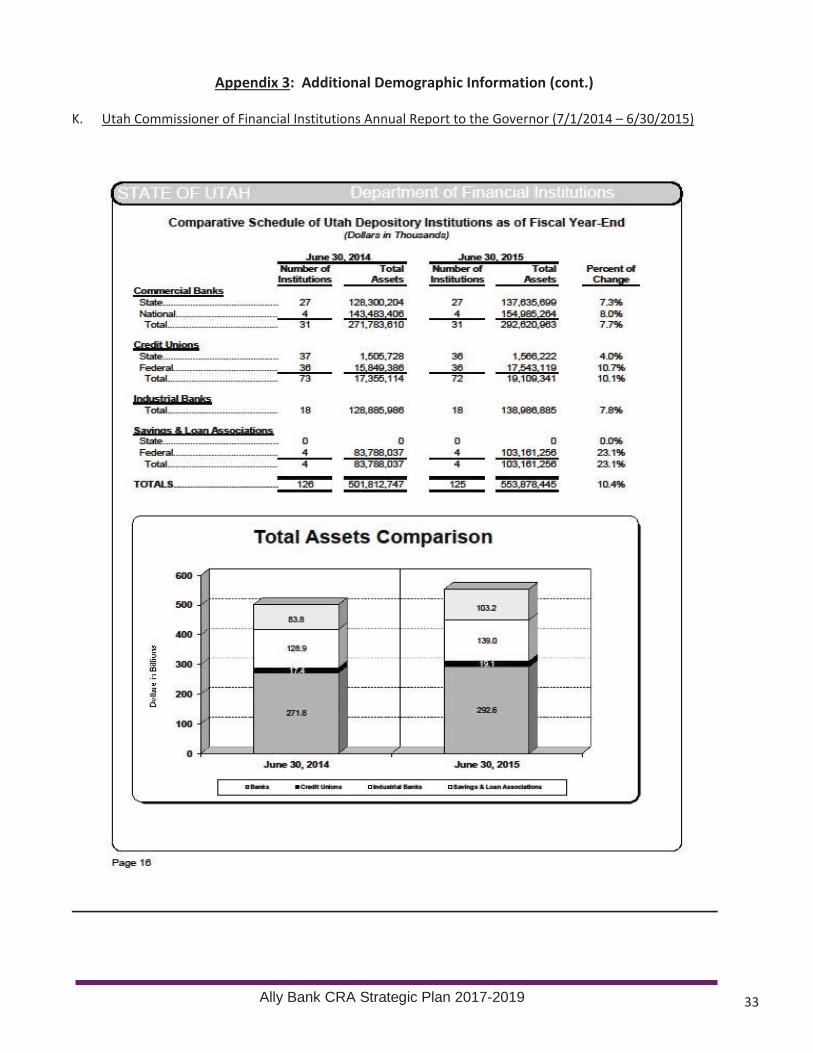
Appendix 3: Additional Demographic Information (cont.)
K. Utah Commissioner of Financial Institutions Annual Report to the Governor (7/1/2014 – 6/30/2015)
Ally Bank CRA Strategic Plan 2017-2019 33

Appendix 4: Additional Needs Assessment Information
A. List of Needs Assessment Survey Particpants:
Ally Bank 2016 Needs Assessment Survey Participants
AAA Fair Credit Foundation (Provides IDA Accounts) NeighborWorks Salt Lake
Artspace (Developer in LMI/Revitalization areas) Quatere (Small Business Technical Assistant)
Bountiful Community Food Pantry Rural Community Assistance Corporation Community Action Services and Food Bank Rural Housing Development Corporation
Community Development Corporation of Utah Rural LISC
Community Foundation of Utah Salt Lake County Office of Community Innovation
Community Nursing Services Small Business Community Capital Christian Center of Park City St. Anne’s Center dba Lantern House (Homeless Shelter) Crossroads Urban Center Sustainable Startups (Support for Small Businesses)
Family Connection Center The INN Between (Hospice for Homeless Individuals)
Family Support Center The Road Home (Homeless Shelter) First Step House (Substance Abuse Treatment) The Suazo Center (Small Business Development) Friends for Sight TURN Community Services (Supportive Services and Guadalupe School Utah Housing Coalition Journey of Hope (Women at Risk for Incarceraton) Utah Microenterprise Loan Fund Junior Achievement of Utah Utah Partners for Health Kentlands Initiative (LMI Neighborhood Revitalization) Utah Shakespeare Festival (Educational Outreach Kickstart Seed Fund Wasatch Community Gardens Maliheh Free Clinic Wasatch Homeless Healthcare dba Fourth Street Clinic
Mountainlands Community Housing Trust Women of the World (Services for International Refugees) NeighborWorks Provo The YMCA of Northern Utah
B. Additional Needs Assessment References
1. Salt Lake Housing Forecast 2016, Salt Lake Board of Realtors, located at the following link: http://slrealtors.com/wp-content/uploads/2016/02/2016_Housing_Forecast.pdf
2. Policy Brief, February 2016, Homeless in Utah: Challenges and Opportunities, The University of Utah, Kem C. Gardner Policy Institute, located at the following link:
http://gardner.utah.edu/wp-content/uploads/2016/02/SLCO-Homelessness-V8.pdf
3. 2015 Results Report of the Promise Partnership Regional Council, located at the following link: http://www.uw.org/our-work/reports-pdfs/2015-promise-partnership-brochure_r5.pdf
4. Community Health Needs Assessment Implementation Plan 2014-2017, University of Utah HealthCare, located at the following link:
https://healthcare.utah.edu/about/chna-uuhc-public-report-2014v2.pdf
5. Salt Lake County Consortium Consolidated Plan 2016, located at the following link: http://slco.org/crd/pdf/slco-consortium2016-.pdf
Ally Bank CRA Strategic Plan 2017-2019 34

Appendix 5: Map of Ally Bank’s Broader Statewide or Regional Area
Ally Bank’s broader satewide or regional area includes the following states (shaded in dark yellow on the map below): Arizona, California, Colorado, Idaho, Montana, Nevada, New Mexico, Oregon, Utah, Washington and Wyoming.
Ally Bank CRA Strategic Plan 2017-2019 35
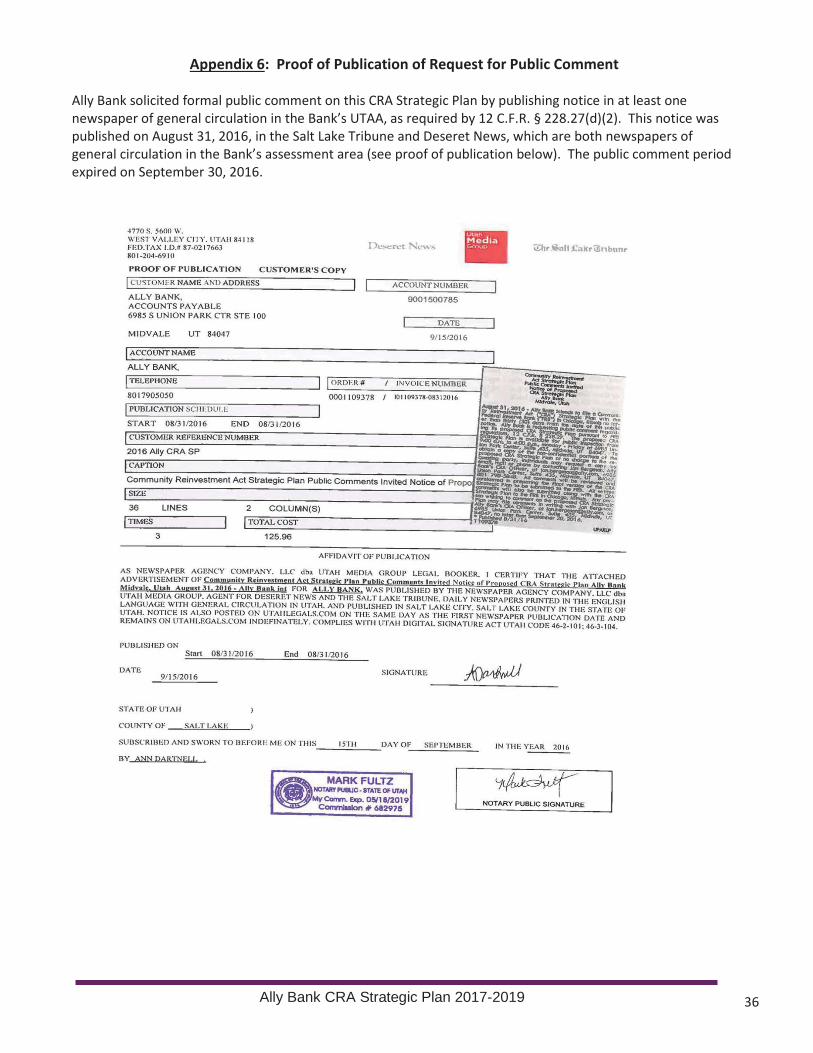
Appendix 6: Proof of Publication of Request for Public Comment
Ally Bank solicited formal public comment on this CRA Strategic Plan by publishing notice in at least one newspaper of general circulation in the Bank’s UTAA, as required by 12 C.F.R. § 228.27(d)(2). This notice was published on August 31, 2016, in the Salt Lake Tribune and Deseret News, which are both newspapers of general circulation in the Bank’s assessment area (see proof of publication below). The public comment period expired on September 30, 2016.
Ally Bank CRA Strategic Plan 2017-2019 36

2 These banks have one or more goals expressed in specific dollar amounts (some of which are converted to % of assets above per either
3 Ally Bank gave greater consideration to the Simple Average without Department Stores National Bank (the smallest in Total Assets) because of its disproportionately large 100% difference between "Satisfactory" and "Outstanding"
2 These banks have one or more goals expressed in specific dollar amounts (some of which are converted to % of assets above per either description in the plan or obtained from corresponding Call Reports)
Appendix 7: Support Tables for “Outstanding” and “Satisfactory” Goal Levels
Appendix Table 7.1: “Satisfactory” vs. “Outstanding” in Approved CRA Strategic Plans of Utah-based Banks $ in 000s
Bank Name Bank Location Total Assets as of
12/31/15
Plan Approved
by Plan Effective
Date Satisfactory
Goal 1 Outstanding
Goal1
% Increase from Satisfactory to Outstanding
BMW Bank2 Utah 9,913,847 FDIC 7/1/2016 $31,500 $46,500 47.62% CIT Bank3 Utah 43,804,359 FDIC 1/1/2013 0.32% 0.42% 31.25% Enerbank USA2 Utah 1,252,887 FDIC 1/1/2013 $2,600 $3,500 34.62% GE Capital Bank3 Utah 21,174,221 FDIC 1/1/2013 0.32% 0.43% 34.38% Green Dot Bank Utah 941,501 FRB 1/1/2015 1.25% 1.50% 20.00% Medallion Bank Utah 1,082,419 FDIC 1/1/2015 0.40% 0.60% 50.00% Merrick Bank Utah 2,597,970 FDIC 1/1/2012 1.05% 1.15% 9.52% Optum Bank Utah 4,694,941 FDIC 1/1/2014 0.30% 0.40% 33.33% Prime Alliance Bank Utah 205,718 FDIC 12/1/2015 0.50% 1.00% 100.00% Sallie Mae Bank Utah 15,055,885 FDIC 7/1/2016 1.20% 1.45% 20.83% Transportation Alliance Bank Utah 690,799 FDIC 6/1/2013 0.30% 0.40% 33.33% UBS Bank USA Utah 52,653,111 FDIC 1/1/2015 0.50% 0.60% 20.00% WebBank Utah 327,521 FDIC 1/1/2014 0.30% 0.40% 33.33% Wright Express (WEX) Bank Utah 1,493,454 FDIC 1/1/2015 0.30% 0.40% 33.33%
Simple Average 35.82% Simple Average w/o Prime Alliance4 31.17% Weighted Average 28.09% Ally Bank Utah 111,306,727 RB (pending 1/1/2017 $1.9B $2.5B 31.58%
3 CIT Bank is no longer located in Utah, and GE Capital Bank has closed
1 CD Loans and Investment goals from final year of Strategic Plan (the percentages are typically of Total Assets or Average Total Assets; some
4 Ally Bank gave greater consideration to the Simple Average without Prime Alliance Bank (the smallest in Total Assets) because of its
Appendix Table 7.2: “Satisfactory” vs. “Outstanding” in Non-traditional Banks with CRA Strategic Plans Approved by the FDIC, FRB and OCC
The following table reflects all three OCC-approved CRA Strategic Plans for non-traditional banks, the two FRB-approved CRA Strategic Plans for non-traditional banks (Silicon Valley Bank not included because its CRA Strategic Plan only has goals for “Satisfactory”), and all FDIC-approved CRA Strategic Plans for non-traditional banks with total assets over $1 billion.
$ in 000s
Bank Name Bank Location Total Assets as of
12/31/15 Plan Approved
by Plan Effective
Date Satisfactory Goal1 Outstanding Goal1
% Increase from Satisfactory to Outstanding
BMW Bank2 Utah 9,913,847 FDIC 7/1/2016 $31,500 $46,500 47.62% Charles Schwab Bank2 Nevada 139,069,000 OCC 1/1/2016 0.27% 0.37% 37.04% Department Stores National Bank South Dakota 367,568 OCC 1/1/2016 0.80% 1.60% 100.00% Discover Bank 2 Delaware 85,747,508 FDIC 1/1/2016 0.50% 0.60% 20.00% Green Dot Bank Utah 941,501 FRB 1/1/2015 1.25% 1.50% 20.00% Medallion Bank Utah 1,082,419 FDIC 1/1/2015 0.40% 0.60% 50.00% Merrick Bank Utah 2,597,970 FDIC 1/1/2012 1.05% 1.15% 9.52% Morgan Stanley Private Bank2 New York 42,042,000 OCC 7/1/2014 $215,000 $322,552 50.02% Optum Bank Utah 4,694,941 FDIC 1/1/2014 0.30% 0.40% 33.33% Sallie Mae Bank Utah 15,055,885 FDIC 7/1/2016 1.20% 1.45% 20.83% Stifel Bank & Trust2 Missouri 7,273,809 FRB 7/1/2015 0.67% 0.84% 25.37% TriState Capital Bank Pennsylvania 3,236,756 FDIC 1/1/2015 1.00% 1.35% 35.00% UBS Bank USA Utah 52,653,111 FDIC 1/1/2015 0.50% 0.60% 20.00%
Simple Average 36.06% Simple Average excluding Department Stores National Bank 3 30.57%
Weighted Average 31.25% Ally Bank Utah 111,306,727 FRB (Pending) 1/1/2017 $1.9B $2.5B 31.58% 1 CD Loans and Investment goals from final year of Strategic Plan (the percentages are typically of Total Assets or Average Total Assets; some Banks have goals for new originations only, while other Banks have goals for total/cumulative loans and investments, and some Banks have both).
Ally Bank CRA Strategic Plan 2017-2019 37