alliance city nebraska profile volume iii
TRANSCRIPT

Alliance city
NEBRASKA PROFILE
VOLUME III

Volume III: City Profiles Alliance city
N E B R A S K A I N V E S T M E N T F I N A N C E A U T H O R I T Y
Nebraska Profile III.1.1 Final Report: March 26, 2021
Please visit the Nebraska State Profile Dashboard:
http://www.NEstats.org
For an online version of this profile with many additional
features including:
• Mapping • Interactive Charts and Tables • Data Downloads • Interactive Long Read • Interactive Tour • Jurisdiction to Jurisdiction Comparison • Download Additional Reports • And More

Volume III: City Profiles Alliance city
N E B R A S K A I N V E S T M E N T F I N A N C E A U T H O R I T Y
Nebraska Profile III.1.2 Final Report: March 26, 2021
Alliance city
DEMOGRAPHICS
Population Estimates
Table III.1.1 shows the population for Alliance city. The
population in Alliance city decreased from 8,491 persons
in 2010 to 8,092 persons in 2019, or by -4.7 percent.
Several pieces of data presented in the profile are only
available at the county level. A subset of the county level
data are presented here to give a more complete view of
Alliance city. Although a city may span several counties, for
the county level data pieces, Box Butte County was
selected. For a more in-depth county level view, please
refer to Box Butte County in Volume II of this profile.
Table III.1.1 Population Estimates
Alliance city Census Population Estimates
Year Population Percent Yearly
Change
2000 8,991 .
2001 8,884 -1.2%
2002 8,871 -0.1%
2003 8,711 -1.8%
2004 8,582 -1.5%
2005 8,515 -0.8%
2006 8,465 -0.6%
2007 8,530 0.8%
2008 8,598 0.8%
2009 8,510 -1%
2010 8,491 -0.2%
2011 8,500 0.1%
2012 8,466 -0.4%
2013 8,494 0.3%
2014 8,488 -0.1%
2015 8,512 0.3%
2016 8,394 -1.4%
2017 8,138 -3%
2018 8,053 -1%
2019 8,092 0.5%

Volume III: City Profiles Alliance city
N E B R A S K A I N V E S T M E N T F I N A N C E A U T H O R I T Y
Nebraska Profile III.1.3 Final Report: March 26, 2021
Diagram III.1.1
Population Alliance city

Volume III: City Profiles Alliance city
N E B R A S K A I N V E S T M E N T F I N A N C E A U T H O R I T Y
Nebraska Profile III.1.4 Final Report: March 26, 2021
Box Butte County Population Migration Trends
The Nebraska Department of Transportation (NDOT) collects data on drivers who move to Nebraska
and exchange licenses from other states as well as those surrendering Nebraska driver’s licenses when
relocating to a different state. The NDOT data do not represent a precise count of migration, as they
show only the net change in the number of driver’s licenses, but the data indicate the general
direction of population movement.
Shown in Table III.1.2, the most recent first half of
2020 data saw a total net out-migration of 98 persons,
with a total of 78 persons entering Box Butte County
and 176 persons leaving Box Butte County.
Diagram III.1.2 shows the in- and out-migration in Box
Butte County between 2002 and 2020 as shaded areas,
with net migration depicted as a white line. The
maximum net migration occurred in 2011 with 83
people entering and the lowest net-migration occurred
in 2019 with 89 people leaving Box Butte County.
Table III.1.2 Net In-migration by Year
Box Butte County Nebraska DOT Data
Year In-
Migration Out-
Migration Net
Migration
2002 203 249 -46 2003 172 228 -56 2004 215 226 -11 2005 198 198 0 2006 248 244 4 2007 270 236 34 2008 158 167 -9 2009 208 200 8 2010 218 178 40 2011 253 170 83 2012 251 225 26 2013 233 206 27 2014 240 225 15 2015 235 223 12 2016 181 220 -39 2017 178 243 -65 2018 188 203 -15 2019 173 262 -89 2020 (p) 78 176 -98

Volume III: City Profiles Alliance city
N E B R A S K A I N V E S T M E N T F I N A N C E A U T H O R I T Y
Nebraska Profile III.1.5 Final Report: March 26, 2021
Diagram III.1.2 Migration Trends
Box Butte County Nebraska DOT Data: 2002 – 2020 (p)
The NDOT data also collects gender and age information. Table III.1.3 shows in- and out- migration
by gender. In the most recent first half of 2020 data, 52 percent of net migrants were male and the
remaining 48 percent were female.
Table III.1.3 Net In-migration by Gender
Box Butte County Nebraska DOT Data
Gender 2009 2010 2011 2012 2013 2014 2015 2016 2017 2018 2019 2020-
First Half
In
Male 85 101 105 108 113 105 116 96 90 78 74 36
Female 123 117 148 143 120 135 119 85 88 110 99 42
Total 208 218 253 251 233 240 235 181 178 188 173 78
Out
Male 94 83 77 106 94 102 95 95 120 102 119 87
Female 106 95 93 119 112 123 128 125 123 101 143 89
Total 200 178 170 225 206 225 223 220 243 203 262 176
Net
Male -9 18 28 2 19 3 21 1 -30 -24 -45 -51
Female 17 22 55 24 8 12 -9 -40 -35 9 -44 -47
Total 8 40 83 26 27 15 12 -39 -65 -15 -89 -98

Volume III: City Profiles Alliance city
N E B R A S K A I N V E S T M E N T F I N A N C E A U T H O R I T Y
Nebraska Profile III.1.6 Final Report: March 26, 2021
Table III.1.4 shows net migration for Box Butte County by age range. In the first half of 2020, the 45
to 54 cohort saw 5 persons leaving Box Butte County, while the 25 to 34 cohort saw 26 persons
leaving Box Butte County.
Table III.1.4 Migration by Age Range
Box Butte County Nebraska DOT Data
Age Range
2009 2010 2011 2012 2013 2014 2015 2016 2017 2018 2019 2020 –
First Half
In
14-24 53 51 60 61 54 57 57 29 27 31 33 8
25-34 58 53 83 86 69 79 76 60 49 71 48 28
35-44 43 53 48 50 48 52 35 36 46 37 36 9
45-54 28 28 36 33 32 16 33 15 26 23 25 10
55-64 17 19 15 16 16 15 21 32 17 17 10 14
65 + 9 14 11 5 14 21 13 9 13 9 21 9
Total 208 218 253 251 233 240 235 181 178 188 173 78
Out
14-24 55 51 47 53 54 58 63 42 58 45 50 29
25-34 57 39 44 68 56 69 55 80 73 61 75 54
35-44 32 38 32 34 30 32 36 36 37 35 49 30
45-54 20 20 19 27 21 26 31 23 20 16 33 15
55-64 28 26 21 33 28 24 26 25 35 25 31 24
65 + 8 4 7 10 17 16 12 14 20 21 24 24
Total 200 178 170 225 206 225 223 220 243 203 262 176
Net
14-24 -2 0 13 8 0 -1 -6 -13 -31 -14 -17 -21
25-34 1 14 39 18 13 10 21 -20 -24 10 -27 -26
35-44 11 15 16 16 18 20 -1 0 9 2 -13 -21
45-54 8 8 17 6 11 -10 2 -8 6 7 -8 -5
55-64 -11 -7 -6 -17 -12 -9 -5 7 -18 -8 -21 -10
65 + 1 10 4 -5 -3 5 1 -5 -7 -12 -3 -15
Total 8 40 83 26 27 15 12 -39 -65 -15 -89 -98

Volume III: City Profiles Alliance city
N E B R A S K A I N V E S T M E N T F I N A N C E A U T H O R I T Y
Nebraska Profile III.1.7 Final Report: March 26, 2021
Table III.1.5 shows migration data for Box Butte County between 2012 and 2018. This data comes
from the IRS, which tracks address changes between filing years. As a result, this dataset might
underrepresent low-income people who are less likely to file taxes. This dataset also excludes tax
returns filed after late September. Taxpayers who file after late September are likely to have complex
returns that report high income, which means this dataset will also underreport the very wealthy.
Box Butte County saw a net out migration of -3 persons in 2018, compared to a net out migration of
-119 persons in 2017.
Table III.1.5 IRS Migration Trends
Box Butte County IRS Data
Year In-Migration Out-Migration Net Migration
2012 nan nan nan 2013 nan nan nan 2014 nan nan nan 2015 nan nan nan 2016 65 172 -107 2017 85 204 -119 2018 69 72 -3

Volume III: City Profiles Alliance city
N E B R A S K A I N V E S T M E N T F I N A N C E A U T H O R I T Y
Nebraska Profile III.1.8 Final Report: March 26, 2021
Census Demographic Data
Census data is presented in one of four Summary Files (SF). In the 1980, 1990, and 2000 decennial
censuses, the Census Bureau released the full SF1 100 percent count data1, along with additional
tabulations including the one-in-six SF3 sample. The Census Bureau did not collect additional sample
data such as the SF3 in the 2010 decennial census, so many important housing and income concepts
are not available in the 2010 Census.
To study these important housing and income concepts, the Census Bureau distributes the American
Community Survey (ACS) every year to a sample of the population, then quantifies the results as one-
, three- and five-year averages. The one-year sample only includes responses from the year the survey
was implemented, while the five-year sample includes responses over a five-year period. The five-
year estimates are more robust than the one- or three-year samples because they include more
responses and can be tabulated down to the Census tract level.
The Census Bureau collects race data according to U.S. Office of Management and Budget guidelines,
and these data are based on self-identification. Ancestry refers to one’s ethnic origin or descent,
"roots," or heritage, or the place of birth of the person or the person’s parents or ancestors before
their arrival in the United States. Ethnic identities may or may not represent geographic areas. People
may choose to report more than one race group and people of any race may be of any ethnic origin.
Hispanic origin can be viewed as the heritage, nationality, lineage, or country of birth of the person
or the person’s parents or ancestors before arriving in the United States. People who identify as
Hispanic, Latino, or Spanish may be any race.
.

Volume III: City Profiles Alliance city
N E B R A S K A I N V E S T M E N T F I N A N C E A U T H O R I T Y
Nebraska Profile III.1.9 Final Report: March 26, 2021
Population Characteristics
The Alliance city population by race and ethnicity is shown in Table III.1.6. The white population
represented 90.9 percent of the population in 2019, compared with black populations accounting
for 1.8 percent of the population in 2019. Hispanic households represented 15.1 percent of the
population in 2019.
Table III.1.6 Population by Race and Ethnicity
Alliance city 2010 Census & 2019 Five-Year ACS
Race 2010 Census 2019 Five-Year ACS
Population % of Total Population % of Total
White 7,429 87.5% 7,489 90.9%
Black 45 0.5% 149 1.8%
American Indian 390 4.6% 234 2.8%
Asian 27 0.3% 110 1.3%
Native Hawaiian/ Pacific Islander 2 0% 0 0%
Other 355 4.2% 33 0.4%
Two or More Races 243 2.9% 220 2.7%
Total 8,491 100.0% 8,235 100.0%
Non-Hispanic 7,443 87.7% 6,990 84.9%
Hispanic 1,048 12.3% 1,245 15.1%
The change in race and ethnicity between 2010 and 2019 is shown in Table III.1.7. During this time,
the total non-Hispanic population was 6,990 persons in 2019, while the Hispanic population was
1,245.
Table III.1.7 Population by Race and Ethnicity
Alliance city 2010 Census & 2019 Five-Year ACS
Race 2010 Census 2019 Five-Year ACS
Population % of Total Population % of Total
Non-Hispanic
White 6,905 92.8% 6,375 91.2%
Black 42 0.6% 149 2.1%
American Indian 317 4.3% 205 2.9%
Asian 27 0.4% 110 1.6%
Native Hawaiian/ Pacific Islander 1 0% 0 0%
Other 1 0% 0 0%
Two or More Races 150 2% 151 2.2%
Total Non-Hispanic 7,443 100.0% 6,990 100.0%
Hispanic
White 524 50% 1,114 89.5%
Black 3 0.3% 0 0%
American Indian 73 7% 29 2.3%
Asian 0 0% 0 0%
Native Hawaiian/ Pacific Islander 1 0.1% 0 0%
Other 354 33.8% 33 2.7%
Two or More Races 93 8.9% 69 5.5%
Total Hispanic 1,048 100.0 1,245 100.0%
Total Population 8,491 100.0% 8,235 100.0%

Volume III: City Profiles Alliance city
N E B R A S K A I N V E S T M E N T F I N A N C E A U T H O R I T Y
Nebraska Profile III.1.10 Final Report: March 26, 2021
Cohorts
Table III.1.8 shows the population distribution in Alliance city by age. In 2010, children under the
age of 5 accounted for 7.1 percent of the total population, which compared to 6.4 percent in 2019.
Table III.1.8 Population Distribution by Age
Alliance city 2019 Five-Year ACS Data
Age 2010 Census 2019 Five-Year ACS
Number of Persons Percent Number of Persons Percent
Under 5 606 7.1 523 6.4
5 to 19 1,798 21.2 1,862 22.6
20 to 24 371 4.4 429 5.2
25 to 34 998 11.8 916 11.1
35 to 54 2,262 26.6 1,992 24.2
55 to 64 1,190 14 1,222 14.8
65 or Older 1,266 14.9 1,291 15.7
Total 8,491 100% 8,235 100%
Table III.1.9 shows the population in Alliance city by age and gender. In 2010, there were 998 people
aged 25 to 34, made up of 485 men, and 513 women. In comparison, in 2019, there were 916
people in the 25 to 34 age cohort, with 430 men and 486 women.
Table III.1.9 Population by Age and Gender
Alliance city 2010 Census & 2019 Five-Year ACS Data
Age 2010 Census 2019 Five Year ACs
Male Female Total Percent Male Female Total Percent
Under 5 298 308 606 7.1% 204 319 523 6.4%
5 to 19 911 887 1,798 21.2% 1,126 736 1,862 22.6%
20 to 24 183 188 371 4.4% 208 221 429 5.2%
25 to 34 485 513 998 11.8% 430 486 916 11.1%
35 to 54 1,111 1,151 2,262 26.6% 966 1,026 1,992 24.2%
55 to 64 624 566 1,190 14% 678 544 1,222 14.8%
65 and Older 497 769 1,266 14.9% 544 747 1,291 15.7%
Total 4,109 4,382 8,491 100% 4,156 4,079 8,235 100%

Volume III: City Profiles Alliance city
N E B R A S K A I N V E S T M E N T F I N A N C E A U T H O R I T Y
Nebraska Profile III.1.11 Final Report: March 26, 2021
Diagram III.1.3 Population Distribution by Age
Alliance city 2010 Census and 2019 Five-Year ACS Data

Volume III: City Profiles Alliance city
N E B R A S K A I N V E S T M E N T F I N A N C E A U T H O R I T Y
Nebraska Profile III.1.12 Final Report: March 26, 2021
Diagram III.1.4 Population Distribution by Age and Gender
Alliance city 2019 Five-Year ACS

Volume III: City Profiles Alliance city
N E B R A S K A I N V E S T M E N T F I N A N C E A U T H O R I T Y
Nebraska Profile III.1.13 Final Report: March 26, 2021
Group Quarters Population
The group quarters population includes the institutionalized population, who live in correctional
institutions, juvenile facilities, nursing homes, and other institutions, and the non-institutionalized
population, who live in college dormitories, military quarters, and other group living situations. As
seen in Table III.1.10, between 2000 and 2010, the institutionalized population changed -14.1
percent in Alliance city, from 149 people in 2000 to 128 in 2010. The non-institutionalized
population changed -9.1 percent, from 33 in 2000 to 30 in 2010.
Table III.1.10 Group Quarters Population
Alliance city 2000 & 2010 Census SF1 Data
Group Quarters Type 2000 Census 2010 Census % Change
00–10 Population % of Total Population % of Total
Institutionalized
Correctional Institutions 14 9.4% 11 8.6% -21.4%
Juvenile Facilities . . 0 0% .
Nursing Homes 134 89.9% 117 91.4% -12.7%
Other Institutions 1 0.7% 0 0% -100%
Total 149 100.0% 128 100.0% -14.1%
Noninstitutionalized
College Dormitories 0 0% 0 0% 0%
Military Quarters 0 0% 0 0% 0%
Other Noninstitutionalized 33 100% 30 100% -9.1%
Total 33 100.0% 30 100.0% -9.1%
Group Quarters Population 182 100.0% 158 100.0% -13.2%
Volume III: City Profiles Alliance city
N E B R A S K A I N V E S T M E N T F I N A N C E A U T H O R I T Y
Nebraska Profile III.1.14 Final Report: March 26, 2021
Foreign-born Populations
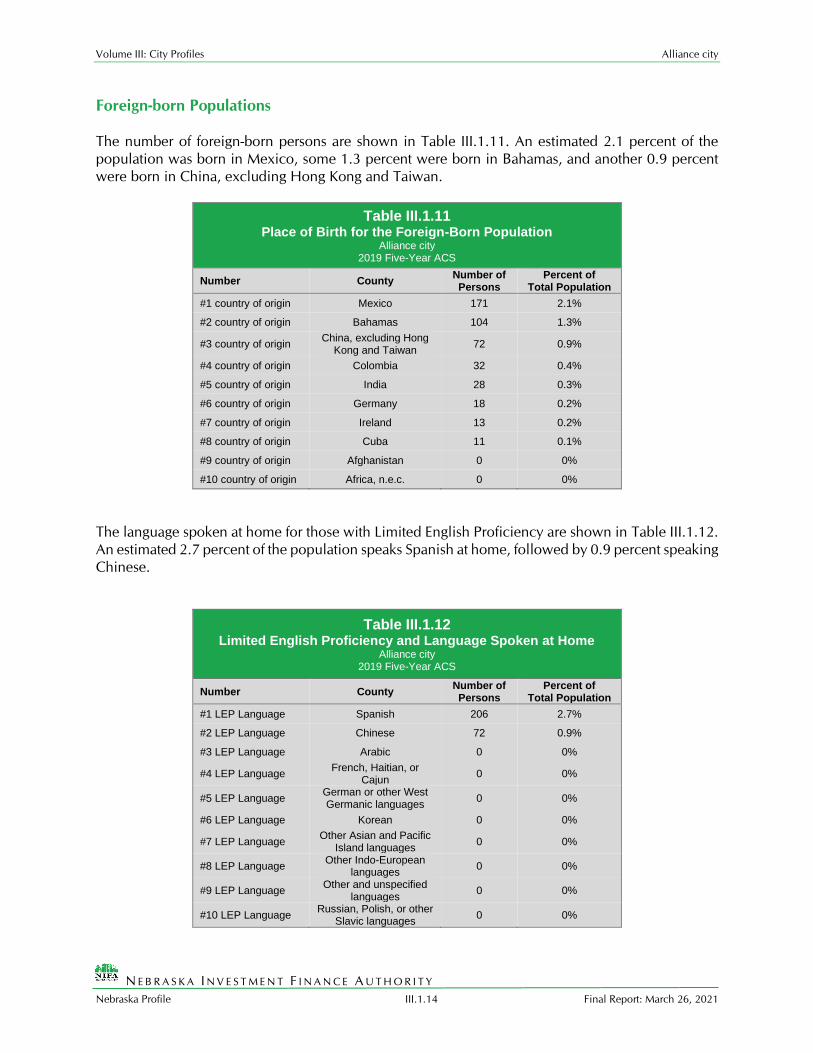
The number of foreign-born persons are shown in Table III.1.11. An estimated 2.1 percent of the
population was born in Mexico, some 1.3 percent were born in Bahamas, and another 0.9 percent
were born in China, excluding Hong Kong and Taiwan.
Table III.1.11 Place of Birth for the Foreign-Born Population
Alliance city 2019 Five-Year ACS
Number County Number of Persons
Percent of Total Population
#1 country of origin Mexico 171 2.1%
#2 country of origin Bahamas 104 1.3%
#3 country of origin China, excluding Hong
Kong and Taiwan 72 0.9%
#4 country of origin Colombia 32 0.4%
#5 country of origin India 28 0.3%
#6 country of origin Germany 18 0.2%
#7 country of origin Ireland 13 0.2%
#8 country of origin Cuba 11 0.1%
#9 country of origin Afghanistan 0 0%
#10 country of origin Africa, n.e.c. 0 0%
The language spoken at home for those with Limited English Proficiency are shown in Table III.1.12.
An estimated 2.7 percent of the population speaks Spanish at home, followed by 0.9 percent speaking
Chinese.
Table III.1.12 Limited English Proficiency and Language Spoken at Home
Alliance city 2019 Five-Year ACS
Number County Number of Persons
Percent of Total Population
#1 LEP Language Spanish 206 2.7%
#2 LEP Language Chinese 72 0.9%
#3 LEP Language Arabic 0 0%
#4 LEP Language French, Haitian, or
Cajun 0 0%
#5 LEP Language German or other West Germanic languages
0 0%
#6 LEP Language Korean 0 0%
#7 LEP Language Other Asian and Pacific
Island languages 0 0%
#8 LEP Language Other Indo-European
languages 0 0%
#9 LEP Language Other and unspecified
languages 0 0%
#10 LEP Language Russian, Polish, or other
Slavic languages 0 0%

Volume III: City Profiles Alliance city
N E B R A S K A I N V E S T M E N T F I N A N C E A U T H O R I T Y
Nebraska Profile III.1.15 Final Report: March 26, 2021
Disability
Disability by age, as estimated by the 2019 ACS, is shown in Table III.1.13, below. The disability rate
for females was 11.9 percent, compared to 11.8 percent for males. The disability rate grew
precipitously higher with age, with 47 percent of those over 75 experiencing a disability.
Table III.1.13 Disability by Age
Alliance city 2019 Five-Year ACS Data
Age Male Female Total
Disabled Population
Disability Rate
Disabled Population
Disability Rate
Disabled Population
Disability Rate
Under 5 0 0% 0 0% 0 0%
5 to 17 84 8.2% 0 0% 84 4.9%
18 to 34 114 15.6% 13 1.7% 127 8.5%
35 to 64 156 9.6% 231 14.9% 387 12.2%
65 to 74 71 21.1% 60 16.3% 131 18.6%
75 or Older 63 32.1% 169 56.7% 232 47%
Total 488 11.8% 473 11.9% 961 11.9%
The number of disabilities by type, as estimated by the 2019 ACS, is shown in Table III.1.14. Some
7.1 percent have an ambulatory disability, 6.2 have an independent living disability, and 3.3 percent
have a self-care disability.
Table III.1.14 Total Disabilities Tallied: Aged 5 and Older
Alliance city 2019 Five-Year ACS
Disability Type Population with
Disability Percent with
Disability
Hearing disability 255 3.1%
Vision disability 216 2.7%
Cognitive disability 338 4.5%
Ambulatory disability 539 7.1%
Self-Care disability 253 3.3%
Independent living disability 365 6.2%

Volume III: City Profiles Alliance city
N E B R A S K A I N V E S T M E N T F I N A N C E A U T H O R I T Y
Nebraska Profile III.1.16 Final Report: March 26, 2021
Education and Employment
Education and employment data from the Alliance city 2019 Five-Year ACS is presented in Table
III.1.15, Table III.1.16, and Table III.1.17. In 2019, 4,100 people were in the labor force, including
3,857 employed and 243 unemployed people. The unemployment rate for Alliance city was
estimated at 5.9 percent in 2019.
Table III.1.15 Employment, Labor Force
and Unemployment Alliance city
2019 Five-Year ACS Data
Employment Status 2019 Five-Year ACS
Employed 3,857
Unemployed 243
Labor Force 4,100
Unemployment Rate 5.9%
Table III.1.16 and Table III.1.17 show educational attainment in Alliance city. In 2019, 87.8 percent
of households had a high school education or greater, including 34.1 percent with a high school
diploma or equivalent, 38.5 percent with some college, 11.2 percent with a Bachelor’s Degree, and
4 percent with a graduate or professional degree.
Table III.1.16 High School or Greater Education
Alliance city 2019 Five-Year ACS Data
Education Level Households
High School or Greater 5,269
Total Households 3,543
Percent High School or Above 87.8%
Table III.1.17 Educational Attainment
Alliance city 2019 Five-Year ACS Data
Education Level 2019 Five-Year ACS Percent
Less Than High School 733 12.2%
High School or Equivalent 2,044 34.1%
Some College or Associates Degree 2,311 38.5%
Bachelor’s Degree 673 11.2%
Graduate or Professional Degree 241 4%
Total Population Above 18 years 6,002 100.0%

Volume III: City Profiles Alliance city
N E B R A S K A I N V E S T M E N T F I N A N C E A U T H O R I T Y
Nebraska Profile III.1.17 Final Report: March 26, 2021
Commuting Patterns
Table III.1.18 shows the place of work by county of residence. In 2010 96.2 percent of residents
worked within the county they reside with 1.7 percent working outside their home county but still
within the state. This compares to 97.7 percent of residents in 2019 who worked within the county
in which they resided and 2 percent of residents worked outside their home county but still within
the state.
Table III.1.18 Place of Work
Alliance city 2010 and 2019 Five-Year ACS Data
Place of work 2010 Five-Year ACS % of Total 2019 Five-Year ACS % of Total
Worked in county of residence 4,024 96.2% 3,670 97.7%
Worked outside county of residence 71 1.7% 77 2%
Worked outside state of residence 88 2.1% 11 0.3%
Total 4,183 100.0% 3,758 100.0%
Table III.1.19 shows the aggregate travel time to work based on place of work and residence. In
Alliance city the total aggregate travel time was 0 minutes, with residents working in their home
county spending a total of 0 minutes traveling.
Table III.1.19 Aggregate Travel Time to Work (in Minutes)
Alliance city 2010 & 2019 Five-Year ACS Data
Place of Work 2010 Five-Year ACS % of Total 2019 Five-Year ACS % of Total
Worked in county of residence 35,505 84.1% 0 0%
Worked outside county of residence 5,620 13.3% 0 0%
Worked outside State of residence 1,080 2.6% 0 0%
Aggregate travel time to work (in minutes):
42,205 100.0% 0 100.0%
Table III.1.20 shows the average travel time to work based on place of work and residence. In 2019
the overall aggregate travel time was 42,205 minutes. Residents working within their home county
spent an average of 0 minutes commuting to work, with those working outside their county of
residence spending an average of 0 minutes on their commute.

Volume III: City Profiles Alliance city
N E B R A S K A I N V E S T M E N T F I N A N C E A U T H O R I T Y
Nebraska Profile III.1.18 Final Report: March 26, 2021
Table III.1.20 Average Travel Time to Work (in Minutes)
Alliance city 2010 & 2019 Five-Year ACS Data
Place of Work 2010 Five-Year ACS 2019 Five-Year ACS
Worked in county of residence 8.8 0
Worked outside county of residence 79.2 0
Worked outside State of residence 12.3 0
Average travel time to work (in minutes): 10.1 0
Table III.1.21 shows the means of transportation to work. In 2019, 83.9 percent of commuters drove
alone in a car, truck, or van. Only 12.1 percent carpooled, with an additional 0 percent taking public
transportation. Also, there were 79 persons or 2.1 percent who worked from home.
Table III.1.21 Means of Transportation to Work
Alliance city 2010 & 2019 Five-Year ACS Data
Means 2010 Five-Year
ACS % of Total
2019 Five-Year ACS
% of Total
Car, truck, or van: Drove alone 3,497 83.6% 3,154 83.9%
Car, truck, or van: Carpooled: 304 7.3% 454 12.1%
Public transportation (excluding taxicab): 28 0.7% 0 0%
Taxicab 0 0% 0 0%
Motorcycle 23 0.5% 9 0.2%
Bicycle 35 0.8% 13 0.3%
Walked 251 6% 33 0.9%
Other means 0 0% 16 0.4%
Worked at home 45 1.1% 79 2.1%
Total 4,183 100.0% 3,758 100.0%

Volume III: City Profiles Alliance city
N E B R A S K A I N V E S T M E N T F I N A N C E A U T H O R I T Y
Nebraska Profile III.1.19 Final Report: March 26, 2021
Table III.1.22 shows the breakdown of the means of transportation by tenure. In 2019, 62 percent of
commuters owned their home and commuted alone by car, which compares to 61.8 percent in 2010.
There were also 832 renters who drove alone in 2019 and accounted for 22.2 percent of the total
commuter population. Commuters who owned their own home and took public transportation
represented 0 percent of the population, which compares to 0 renters, or 0 percent taking public
transportation.
Table III.1.22 Means Of Transportation To Work By Tenure
Alliance city 2010 & 2019 Five-Year ACS Data
Tenure 2010 Five-Year
ACS % of Total
2019 Five-Year ACS
% of Total
Car, truck, or van - drove alone:
Owner 2,587 61.8% 2,321 62% Renter 910 21.8% 832 22.2%
Car, truck, or van - carpooled:
Owner 130 3.1% 291 7.8%
Renter 174 4.2% 163 4.4%
Public transportation (excluding taxicab):
Owner 0 0% 0 0% Renter 28 0.7% 0 0%
Walked:
Owner 103 2.5% 20 0.5%
Renter 148 3.5% 8 0.2%
Taxicab, motorcycle, bicycle, or other means:
Owner 58 1.4% 28 0.7%
Renter 0 0% 0 0%
Worked at home:
Owner 45 1.1% 79 2.1% Renter 0 0% 0 0%
Total: 4,183 100.0% 3,742 100.0%

Volume III: City Profiles Alliance city
N E B R A S K A I N V E S T M E N T F I N A N C E A U T H O R I T Y
Nebraska Profile III.1.20 Final Report: March 26, 2021
ECONOMICS
Labor Force
Table III.1.23 shows the labor force statistics for Box Butte County from 1990 to 2019. Over the
entire series the lowest unemployment rate occurred in 2018 with a rate of 2.9 percent while the
highest level of unemployment occurred during 2009 at 6.6 percent. This compared to a statewide
low of 2.3 in 1990 and a statewide high of 4.6 percent in 2009. Over the last year, the unemployment
rate in Box Butte County increased from 2.9 percent in 2018 to 3.2 percent in 2019, which compared
to a statewide increase to 3 percent.
Table III.1.23 Labor Force Statistics
Box Butte County 1990 - 2019 BLS Data
Year
Box Butte County Statewide
Unemployment Rate Unemployment Employment Labor Force Unemployment
Rate
1990 192 6,139 6,331 3% 2.3%
1991 234 5,965 6,199 3.8% 2.7%
1992 209 6,000 6,209 3.4% 2.9%
1993 205 6,051 6,256 3.3% 2.8%
1994 238 6,005 6,243 3.8% 2.6%
1995 285 6,050 6,335 4.5% 2.6%
1996 343 5,843 6,186 5.5% 2.7%
1997 321 6,088 6,409 5% 2.5%
1998 319 6,340 6,659 4.8% 2.6%
1999 315 6,306 6,621 4.8% 2.8%
2000 252 6,170 6,422 3.9% 2.8%
2001 254 5,559 5,813 4.4% 3.1%
2002 269 5,433 5,702 4.7% 3.6%
2003 267 5,392 5,659 4.7% 3.9%
2004 224 5,362 5,586 4% 3.9%
2005 222 5,392 5,614 4% 3.8%
2006 169 5,358 5,527 3.1% 3.1%
2007 180 5,433 5,613 3.2% 3%
2008 210 5,420 5,630 3.7% 3.3%
2009 372 5,269 5,641 6.6% 4.6%
2010 291 5,561 5,852 5% 4.6%
2011 253 5,728 5,981 4.2% 4.4%
2012 240 5,737 5,977 4% 4%
2013 231 5,757 5,988 3.9% 3.8%
2014 179 5,557 5,736 3.1% 3.3%
2015 170 5,487 5,657 3% 3%
2016 203 5,435 5,638 3.6% 3.1%
2017 177 5,240 5,417 3.3% 2.9%
2018 156 5,245 5,401 2.9% 2.9%
2019 172 5,247 5,419 3.2% 3%

Volume III: City Profiles Alliance city
N E B R A S K A I N V E S T M E N T F I N A N C E A U T H O R I T Y
Nebraska Profile III.1.21 Final Report: March 26, 2021
Diagram III.1.5 shows the employment and labor force for Box Butte County. The difference between
the two lines represents the number of unemployed persons. In the most recent year, employment
stood at 5,247 persons, with the labor force reaching 5,419, indicating there were a total of 172
unemployed persons.
Diagram III.1.5
Employment and Labor Force Box Butte County
1990 – 2019 BLS Data

Volume III: City Profiles Alliance city
N E B R A S K A I N V E S T M E N T F I N A N C E A U T H O R I T Y
Nebraska Profile III.1.22 Final Report: March 26, 2021
Unemployment
Diagram III.1.6 shows the unemployment rate for both the State and Box Butte County. During the
1990s the average rate for Box Butte County was 4.2, which compared to 2.6 statewide. Between
2000 and 2010 the Box Butte County unemployment rate had an average of 4.2, which compared to
3.5 statewide. Since 2010 the average unemployment rate in Box Butte County was 3.6. Over the
course of the entire period Box Butte County had an average unemployment rate higher than the
state, 4 percent for Box Butte County, versus 3.2 statewide.
Diagram III.1.6
Annual Unemployment Rate Box Butte County
1990 – 2019 BLS Data

Volume III: City Profiles Alliance city
N E B R A S K A I N V E S T M E N T F I N A N C E A U T H O R I T Y
Nebraska Profile III.1.23 Final Report: March 26, 2021
Employment
Table III.1.24 shows employment and median earnings by industry for Alliance city from the 2019
Five-Year ACS. In 2019 the largest industry by number of people employed in Alliance city was
Transport, which employed 640 people and paid a median salary of 73,103 dollars. The highest
paying industry in Alliance city was also the Transport industry, which paid a median salary of 73,103
dollars in 2019.
Table III.1.24 City Level Employment by Industry
Alliance city 2018 Five Year ACS Data
Industry Total
Employment Percent of
Employment Median
Earnings
Admin 41 2% $36,553
Arts 29 1% $32,788
Construction 263 10% $43,030
Education 138 5% $35,405
Farming 129 5% $67,837
Finance 93 3% $32,750
Food 191 7% $16,250
Health Care 307 11% $55,438
Info 0 0% $0
Management 0 0% $0
Manufacturing 330 12% $55,286
Mining 9 0% $0
Other 86 3% $26,161
Prof Service 71 3% $37,321
Government 95 4% $36,295
Real Estate 15 0% $0
Retail 213 8% $40,287
Transport 640 23% $73,103
Utilities 38 1% $64,688
Wholesale 45 2% $53,185

Volume III: City Profiles Alliance city
N E B R A S K A I N V E S T M E N T F I N A N C E A U T H O R I T Y
Nebraska Profile III.1.24 Final Report: March 26, 2021
Diagram III.1.7 displays employment and earnings data for 2019 in Alliance city. Only industries that
employed more than 0.0 percent of people and had accurate median earnings data are included in
Diagram III.1.7.
Diagram III.1.7
Employment and Median Earnings by Industry Alliance city
2018 Five-Year ACS Data

Volume III: City Profiles Alliance city
N E B R A S K A I N V E S T M E N T F I N A N C E A U T H O R I T Y
Nebraska Profile III.1.25 Final Report: March 26, 2021
Box Butte County Earnings
The Bureau of Economic Analysis (B.E.A.) produces regional economic accounts which provide a
consistent framework for analyzing and comparing individual state and local area economies.
Diagram III.1.8 shows real average earnings per job for Box Butte County from 1990 to 2019. Over
this period the average earnings per job for Box Butte County was 53,469 dollars, which was higher
than the statewide average of 49,686 dollars over the same period.
Diagram III.1.8 Real Average Earnings Per Job
Box Butte County BEA Data 1990 - 2019

Volume III: City Profiles Alliance city
N E B R A S K A I N V E S T M E N T F I N A N C E A U T H O R I T Y
Nebraska Profile III.1.26 Final Report: March 26, 2021
Diagram III.1.9 shows real per capita income for Box Butte County from 1990 to 2019, which is
calculated by dividing total personal income from all sources by population. Per capita income is a
broader measure of wealth than real average earnings per job, which only captures the working
population. Over this period the real per capita income for Box Butte County was 39,544 dollars,
which was lower than the statewide average of 44,217 dollars over the same period.
Diagram III.1.9
Real Per Capita Income Box Butte County
BEA Data 1990 - 2019
Volume III: City Profiles Alliance city
N E B R A S K A I N V E S T M E N T F I N A N C E A U T H O R I T Y
Nebraska Profile III.1.27 Final Report: March 26, 2021
Nebraska Department of Revenue: Box Butte County
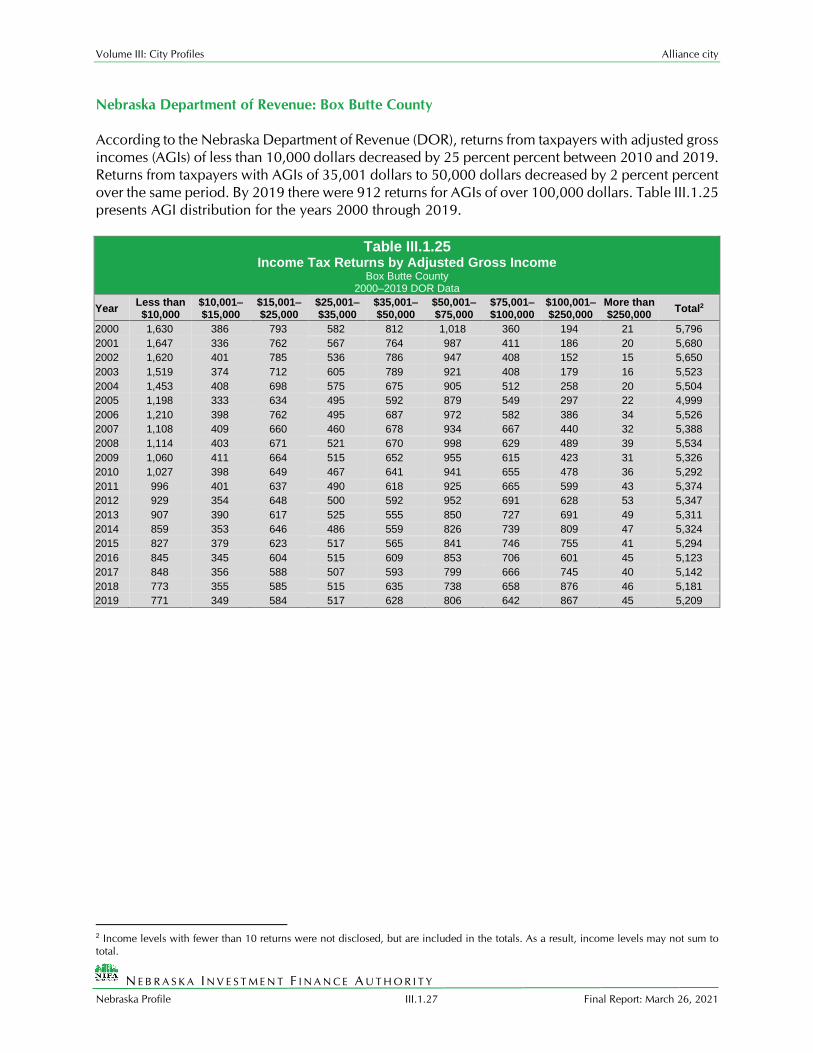
According to the Nebraska Department of Revenue (DOR), returns from taxpayers with adjusted gross
incomes (AGIs) of less than 10,000 dollars decreased by 25 percent percent between 2010 and 2019.
Returns from taxpayers with AGIs of 35,001 dollars to 50,000 dollars decreased by 2 percent percent
over the same period. By 2019 there were 912 returns for AGIs of over 100,000 dollars. Table III.1.25
presents AGI distribution for the years 2000 through 2019.
Table III.1.25 Income Tax Returns by Adjusted Gross Income
Box Butte County 2000–2019 DOR Data
Year Less than $10,000
$10,001–$15,000
$15,001–$25,000
$25,001–$35,000
$35,001–$50,000
$50,001–$75,000
$75,001–$100,000
$100,001–$250,000
More than $250,000
Total2
2000 1,630 386 793 582 812 1,018 360 194 21 5,796
2001 1,647 336 762 567 764 987 411 186 20 5,680
2002 1,620 401 785 536 786 947 408 152 15 5,650
2003 1,519 374 712 605 789 921 408 179 16 5,523
2004 1,453 408 698 575 675 905 512 258 20 5,504
2005 1,198 333 634 495 592 879 549 297 22 4,999
2006 1,210 398 762 495 687 972 582 386 34 5,526
2007 1,108 409 660 460 678 934 667 440 32 5,388
2008 1,114 403 671 521 670 998 629 489 39 5,534
2009 1,060 411 664 515 652 955 615 423 31 5,326
2010 1,027 398 649 467 641 941 655 478 36 5,292
2011 996 401 637 490 618 925 665 599 43 5,374
2012 929 354 648 500 592 952 691 628 53 5,347
2013 907 390 617 525 555 850 727 691 49 5,311
2014 859 353 646 486 559 826 739 809 47 5,324
2015 827 379 623 517 565 841 746 755 41 5,294
2016 845 345 604 515 609 853 706 601 45 5,123
2017 848 356 588 507 593 799 666 745 40 5,142
2018 773 355 585 515 635 738 658 876 46 5,181
2019 771 349 584 517 628 806 642 867 45 5,209
2 Income levels with fewer than 10 returns were not disclosed, but are included in the totals. As a result, income levels may not sum to
total.

Volume III: City Profiles Alliance city
N E B R A S K A I N V E S T M E N T F I N A N C E A U T H O R I T Y
Nebraska Profile III.1.28 Final Report: March 26, 2021
Diagram III.1.10
Tax Returns by Income Bracket Box Butte County
1991 – 2019 DOR Data

Volume III: City Profiles Alliance city
N E B R A S K A I N V E S T M E N T F I N A N C E A U T H O R I T Y
Nebraska Profile III.1.29 Final Report: March 26, 2021
Poverty
Poverty is the condition of having insufficient resources or income.
In its extreme form, poverty is a lack of basic human needs, such
as adequate and healthy food, clothing, housing, water, and health
services. According to the Census Bureau’s Small Area Income and
Poverty Estimates Program, the number of individuals in poverty
decreased from 1,455 in 2010 to 1,096 in 2019, with the poverty
rate reaching 10.3 percent in 2019. This compared to a state
poverty rate of 9.9 percent and a national rate of 12.3 percent in
2019. Table III.1.26 presents poverty data for Box Butte County.
The rate of poverty for Alliance city is shown in Table III.1.27. In
2019, the poverty rate was 15.2 percent meaning there were an
estimated 1,229 people living in poverty, compared to 1,423
percent living in poverty in 2010. In 2019, some 26.8 percent of
those in poverty were under age 6 and 8.8 percent were 65 or
older.
Table III.1.27 Poverty by Age
Alliance city 2010 & 2019 Five-Year ACS Data
Age 2010 Five-Year ACS 2019 Five-Year ACS
Persons in Poverty
% of Total Persons in
Poverty % of Total
Under 6 309 41.9% 165 26.8%
6 to 17 397 26.8% 172 10.8%
18 to 64 506 10.2% 787 16.9%
65 or Older 211 17.4% 105 8.8%
Total 1,423 100.0% 1,229 100.0%
Poverty Rate 16.9% . 15.2% .
Table III.1.26 Persons in Poverty
Box Butte County 2000–2019 SAIPE Estimates
Year Persons in
Poverty Poverty
Rate
2000 1,204 10.3% 2001 1,240 10.6% 2002 1,288 11.1% 2003 1,288 11.4% 2004 1,288 11.4% 2005 1,374 12.4% 2006 1,275 11.7% 2007 1,393 12.9% 2008 1,153 10.7% 2009 1,237 11.6% 2010 1,455 13.1% 2011 1,886 16.9% 2012 1,520 13.7% 2013 1,428 12.9% 2014 1,274 11.4% 2015 1,295 11.6% 2016 1,269 11.5% 2017 1,241 11.6% 2018 1,454 13.7% 2019 1,096 10.3%

Volume III: City Profiles Alliance city
N E B R A S K A I N V E S T M E N T F I N A N C E A U T H O R I T Y
Nebraska Profile III.1.30 Final Report: March 26, 2021
Diagram III.1.11 Poverty Rate Box Butte County
U.S. Census Small Area Income Poverty Estimates

Volume III: City Profiles Alliance city
N E B R A S K A I N V E S T M E N T F I N A N C E A U T H O R I T Y
Nebraska Profile III.1.31 Final Report: March 26, 2021
Household Income
Table III.1.28 shows the HUD Area Median Family Income (HAMFI/MFI) for a family of four for Box
Butte County. In 2019 the MFI was 75,200 dollars, which compared to 78,100 dollars for the State
of Nebraska.
Table III.1.28 Median Family Income
Box Butte County 2000–2019 HUD MFI
Year MFI State of Nebraska
MFI
2000 46,900 50,400 2001 50,500 53,400 2002 51,900 55,100 2003 54,700 55,400 2004 54,900 56,300 2005 55,700 57,400 2006 57,600 59,400 2007 56,500 59,400 2008 58,200 59,000 2009 60,200 62,000 2010 60,800 62,600 2011 57,400 63,500 2012 58,200 64,400 2013 56,800 64,600 2014 58,300 66,000 2015 56,600 66,800 2016 60,100 66,500 2017 61,100 68,200 2018 67,900 74,900 2019 75,200 78,100

Volume III: City Profiles Alliance city
N E B R A S K A I N V E S T M E N T F I N A N C E A U T H O R I T Y
Nebraska Profile III.1.32 Final Report: March 26, 2021
HOUSING
Housing Production
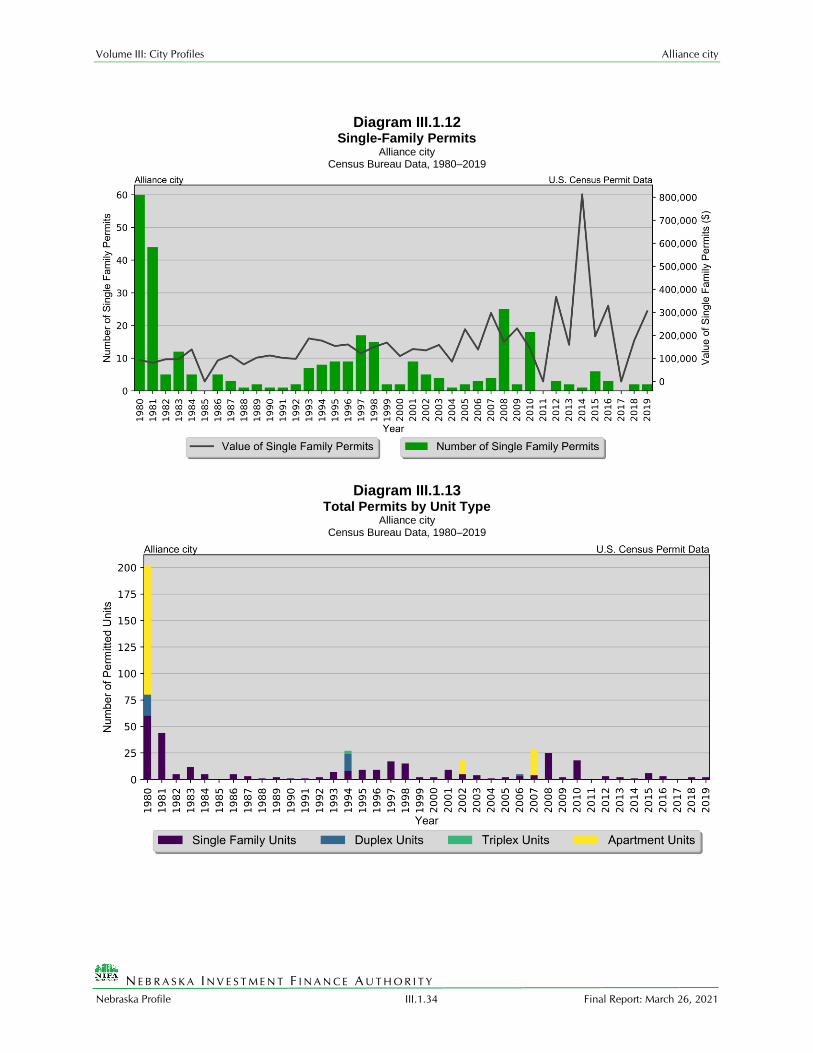
The Census Bureau reports building permit authorizations and “per unit” valuation of building
permits by county annually. Single-family construction usually represents most residential
development in the county. Single-family building permit authorizations in Alliance city remained
unchanged from 2 authorizations in 2018 to 2 in 2019.
The real value of single-family building permits increased from 178,063 dollars in 2018 to 305,000
dollars in 2019 This compares to a decrease in permit value statewide, with values dropping by 5,137
dollars from 223,902 dollars in 2018 to 218,765 dollars in 2019. Additional details are given in Table
III.1.29 and presented in Diagram III.1.12. Diagram III.1.13 shows total permits by unit type from
1980 to 2019.

Volume III: City Profiles Alliance city
N E B R A S K A I N V E S T M E N T F I N A N C E A U T H O R I T Y
Nebraska Profile III.1.33 Final Report: March 26, 2021
Table III.1.29
Building Permits and Valuation Alliance city
Census Bureau Data, 1980–2019
Year
Authorized Construction in Permit Issuing Areas Per Unit Valuation,
(Real 2019$)
Single- Family
Duplex Units
Tri- and Four-Plex
Multi-Family Units
Total Units
Single-Family Units
Multi-Family Units
1980 60 20 0 122 202 93,301 61,116
1981 44 0 0 0 44 81,129 0 1982 5 0 0 0 5 96,501 0 1983 12 0 0 0 12 96,739 0 1984 5 0 0 0 5 139,337 0 1985 0 0 0 0 0 0 0 1986 5 0 0 0 5 91,221 0 1987 3 0 0 0 3 112,928 0 1988 1 0 0 0 1 74,201 0 1989 2 0 0 0 2 103,606 0 1990 1 0 0 0 1 112,935 0 1991 1 0 0 0 1 102,407 0 1992 2 0 0 0 2 98,465 0 1993 7 0 0 0 7 186,780 0 1994 8 16 3 0 27 177,294 0 1995 9 0 0 0 9 154,193 0 1996 9 0 0 0 9 160,883 0 1997 17 0 0 0 17 122,164 0 1998 15 0 0 0 15 149,384 0 1999 2 0 0 0 2 169,192 0 2000 2 0 0 0 2 110,448 0 2001 9 0 0 0 9 141,008 0 2002 5 0 0 13 18 135,284 63,978 2003 4 0 0 0 4 158,615 0 2004 1 0 0 0 1 86,138 0 2005 2 0 0 0 2 226,835 0 2006 3 2 0 0 5 138,947 0 2007 4 0 0 24 28 297,557 80,985 2008 25 0 0 0 25 172,545 0 2009 2 0 0 0 2 230,660 0 2010 18 0 0 0 18 142,883 0 2011 0 0 0 0 0 0 0 2012 3 0 0 0 3 367,777 0 2013 2 0 0 0 2 159,545 0 2014 1 0 0 0 1 813,096 0 2015 6 0 0 0 6 195,994 0 2016 3 0 0 0 3 329,192 0 2017 0 0 0 0 0 0 0 2018 2 0 0 0 2 178,063 0 2019 2 0 0 0 2 305,000 0
Volume III: City Profiles Alliance city
N E B R A S K A I N V E S T M E N T F I N A N C E A U T H O R I T Y
Nebraska Profile III.1.34 Final Report: March 26, 2021
Diagram III.1.12
Single-Family Permits Alliance city
Census Bureau Data, 1980–2019
Diagram III.1.13 Total Permits by Unit Type
Alliance city Census Bureau Data, 1980–2019
Volume III: City Profiles Alliance city
N E B R A S K A I N V E S T M E N T F I N A N C E A U T H O R I T Y
Nebraska Profile III.1.35 Final Report: March 26, 2021
Housing Characteristics
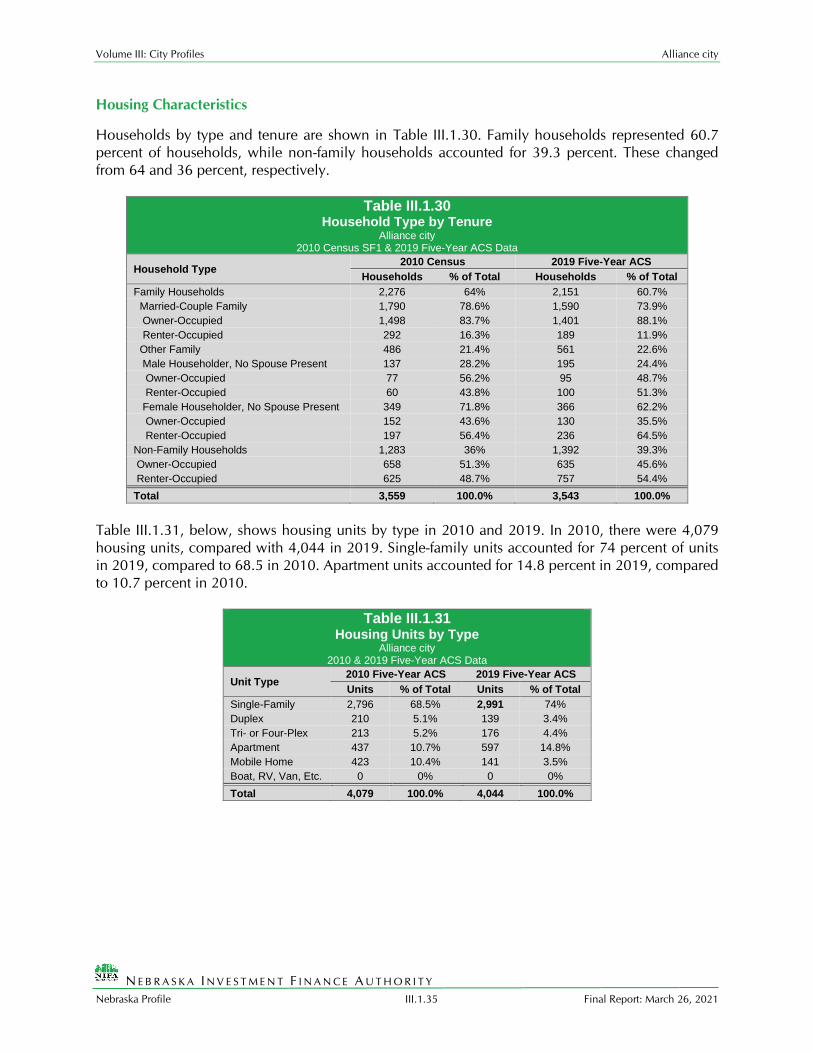
Households by type and tenure are shown in Table III.1.30. Family households represented 60.7
percent of households, while non-family households accounted for 39.3 percent. These changed
from 64 and 36 percent, respectively.
Table III.1.30
Household Type by Tenure Alliance city
2010 Census SF1 & 2019 Five-Year ACS Data
Household Type 2010 Census 2019 Five-Year ACS
Households % of Total Households % of Total
Family Households 2,276 64% 2,151 60.7%
Married-Couple Family 1,790 78.6% 1,590 73.9%
Owner-Occupied 1,498 83.7% 1,401 88.1%
Renter-Occupied 292 16.3% 189 11.9%
Other Family 486 21.4% 561 22.6%
Male Householder, No Spouse Present 137 28.2% 195 24.4%
Owner-Occupied 77 56.2% 95 48.7%
Renter-Occupied 60 43.8% 100 51.3%
Female Householder, No Spouse Present 349 71.8% 366 62.2%
Owner-Occupied 152 43.6% 130 35.5%
Renter-Occupied 197 56.4% 236 64.5%
Non-Family Households 1,283 36% 1,392 39.3%
Owner-Occupied 658 51.3% 635 45.6%
Renter-Occupied 625 48.7% 757 54.4%
Total 3,559 100.0% 3,543 100.0%
Table III.1.31, below, shows housing units by type in 2010 and 2019. In 2010, there were 4,079
housing units, compared with 4,044 in 2019. Single-family units accounted for 74 percent of units
in 2019, compared to 68.5 in 2010. Apartment units accounted for 14.8 percent in 2019, compared
to 10.7 percent in 2010.
Table III.1.31 Housing Units by Type
Alliance city 2010 & 2019 Five-Year ACS Data
Unit Type 2010 Five-Year ACS 2019 Five-Year ACS
Units % of Total Units % of Total
Single-Family 2,796 68.5% 2,991 74%
Duplex 210 5.1% 139 3.4%
Tri- or Four-Plex 213 5.2% 176 4.4%
Apartment 437 10.7% 597 14.8%
Mobile Home 423 10.4% 141 3.5%
Boat, RV, Van, Etc. 0 0% 0 0%
Total 4,079 100.0% 4,044 100.0%
Volume III: City Profiles Alliance city
N E B R A S K A I N V E S T M E N T F I N A N C E A U T H O R I T Y
Nebraska Profile III.1.36 Final Report: March 26, 2021
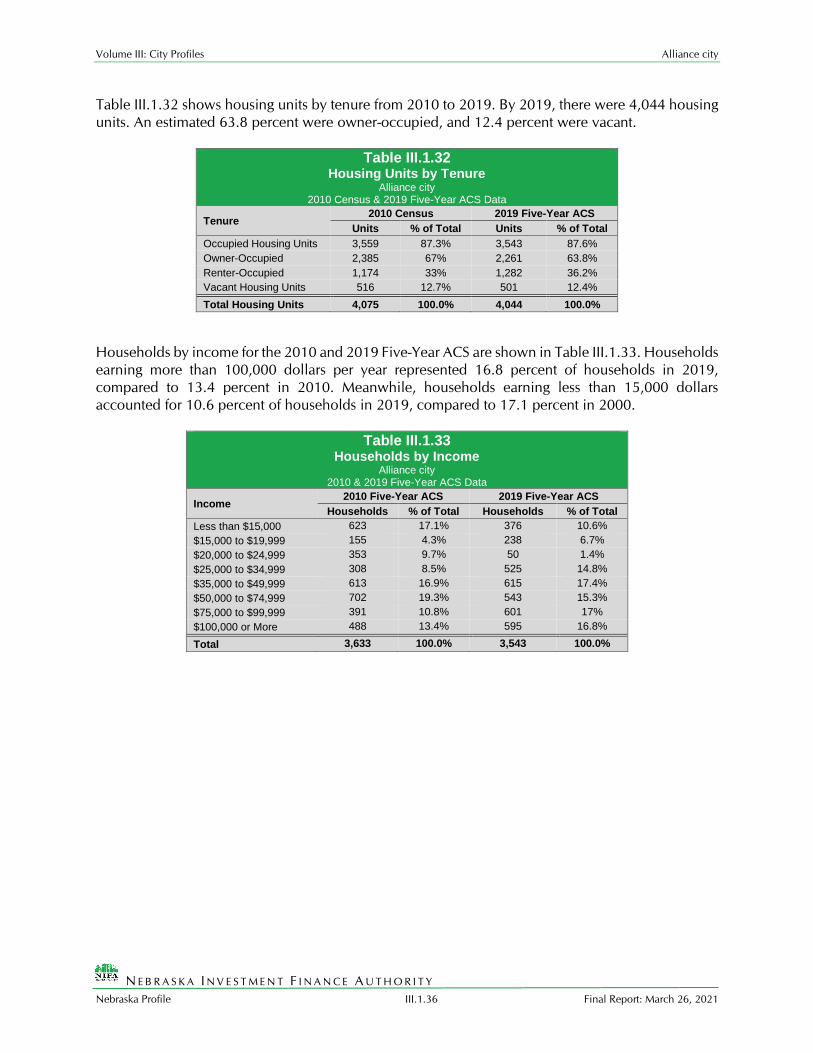
Table III.1.32 shows housing units by tenure from 2010 to 2019. By 2019, there were 4,044 housing
units. An estimated 63.8 percent were owner-occupied, and 12.4 percent were vacant.
Table III.1.32 Housing Units by Tenure
Alliance city 2010 Census & 2019 Five-Year ACS Data
Tenure 2010 Census 2019 Five-Year ACS
Units % of Total Units % of Total
Occupied Housing Units 3,559 87.3% 3,543 87.6%
Owner-Occupied 2,385 67% 2,261 63.8%
Renter-Occupied 1,174 33% 1,282 36.2%
Vacant Housing Units 516 12.7% 501 12.4%
Total Housing Units 4,075 100.0% 4,044 100.0%
Households by income for the 2010 and 2019 Five-Year ACS are shown in Table III.1.33. Households
earning more than 100,000 dollars per year represented 16.8 percent of households in 2019,
compared to 13.4 percent in 2010. Meanwhile, households earning less than 15,000 dollars
accounted for 10.6 percent of households in 2019, compared to 17.1 percent in 2000.
Table III.1.33 Households by Income
Alliance city 2010 & 2019 Five-Year ACS Data
Income 2010 Five-Year ACS 2019 Five-Year ACS
Households % of Total Households % of Total
Less than $15,000 623 17.1% 376 10.6%
$15,000 to $19,999 155 4.3% 238 6.7%
$20,000 to $24,999 353 9.7% 50 1.4%
$25,000 to $34,999 308 8.5% 525 14.8%
$35,000 to $49,999 613 16.9% 615 17.4%
$50,000 to $74,999 702 19.3% 543 15.3%
$75,000 to $99,999 391 10.8% 601 17%
$100,000 or More 488 13.4% 595 16.8%
Total 3,633 100.0% 3,543 100.0%

Volume III: City Profiles Alliance city
N E B R A S K A I N V E S T M E N T F I N A N C E A U T H O R I T Y
Nebraska Profile III.1.37 Final Report: March 26, 2021
Table III.1.34 shows households by year home built for the 2010 and 2019 Five-Year ACS Data.
Housing units built between 2000 and 2009, account for 1.8 percent of households in 2010 and 3.3
percent of households in 2019. Housing units built in 1939 or earlier represented 26.8 percent of
households in 2019 and 25.5 percent of households in 2010.
Table III.1.34 Households by Year Home Built
Alliance city 2010 & 2019 Five-Year ACS Data
Year Built 2010 Five-Year ACS 2019 Five-Year ACS
Households % of Total Households % of Total
1939 or Earlier 926 25.5% 950 26.8%
1940 to 1949 352 9.7% 294 8.3%
1950 to 1959 449 12.4% 341 9.6%
1960 to 1969 391 10.8% 187 5.3%
1970 to 1979 905 24.9% 1,015 28.6%
1980 to 1989 316 8.7% 401 11.3%
1990 to 1999 229 6.3% 176 5%
2000 to 2009 65 1.8% 116 3.3%
2010 or Later . . 63 1.8%
Total 3,633 100.0% 3,543 100.0%
The distribution of unit types by race are shown in Table III.1.35. An estimated 76.5 percent of white
households occupy single-family homes, compared to 30 percent of black households. Some 11.8
percent of white households occupied apartments, compared to 70 percent of black households. An
estimated 100 percent of Asian, and 100 percent of American Indian households occupy single-
family homes.

Volume III: City Profiles Alliance city
N E B R A S K A I N V E S T M E N T F I N A N C E A U T H O R I T Y
Nebraska Profile III.1.38 Final Report: March 26, 2021
Table III.1.35 Distribution of Units in Structure by Race
Alliance city 2019 Five-Year ACS Data
Unit Type White Black American
Indian Asian
Native Hawaiian/Pacifi
c Islanders Other
Two or More Races
Single-Family 76.5% 30% 100% 100% 0% 0% 47.3%
Duplex 4.2% 0% 0% 0% 0% 0% 0%
Tri- or Four-Plex
3.3% 0% 0% 0% 0% 0% 0%
Apartment 11.8% 70% 0% 0% 0% 0% 52.7%
Mobile Home 4.2% 0% 0% 0% 0% 0% 0%
Boat, RV, Van, Etc.
0% 0% 0% 0% 0% 0% 0%
Total 100.0% 100.0% 100.0% 100.0% 100.0% 100.0% 100.0%
The disposition of vacant units between 2010 and 2019 are shown in Table III.1.36. An estimated
53.7 percent of vacant units were for rent in 2010. In addition, some 10.5 percent of vacant units
were for sale. “Other” vacant units represented 27.7 percent of vacant units in 2010. “Other” vacant
units are not for sale or rent, or otherwise available to the marketplace. These units may be
problematic if concentrated in certain areas and may create a “blighting” effect.
By 2019, for rent units accounted for 18.6 percent of vacant units, while for sale units accounted for
2.6 percent. “Other” vacant units accounted for 46.1 percent of vacant units, representing a total of
231 “other” vacant units.
Table III.1.36 Disposition of Vacant Housing Units
Alliance city 2010 Census & 2019 Five-Year ACS Data
Disposition 2010 Census 2019 Five-Year ACS
Units % of Total Units % of Total
For Rent 277 53.7% 93 18.6%
For Sale 54 10.5% 13 2.6%
Rented Not Occupied 4 0.8% 27 5.4%
Sold Not Occupied 9 1.7% 0 0%
For Seasonal, Recreational, or Occasional Use 26 5% 137 27.3%
For Migrant Workers 3 0.6% 0 0%
Other Vacant 143 27.7% 231 46.1%
Total 516 100.0% 501 100.0%
Table III.1.37 shows the number of households in the county by number of bedrooms and tenure.
There were 14 rental households with no bedrooms, otherwise known as studio apartments. Two-
bedroom households accounted for 28.93 percent of total households in Alliance city. In Alliance
city the 1,141 households with three-bedrooms accounted for 32.2 percent of all households, and
there were 334 five-bedroom or more households, which accounted for 9.43 percent of all
households.

Volume III: City Profiles Alliance city
N E B R A S K A I N V E S T M E N T F I N A N C E A U T H O R I T Y
Nebraska Profile III.1.39 Final Report: March 26, 2021
Table III.1.37 Households by Number of Bedrooms
Alliance city 2019 Five-Year ACS Data
Number of Bedrooms
Tenure % of Total
Own Rent Total
None 0 14 14 0.4
One 98 329 427 12.05
Two 507 518 1,025 28.93
Three 828 313 1,141 32.2
Four 494 108 602 16.99
Five or more 334 0 334 9.43
Total 2,261 1,282 3,543 100.0
The age of a structure influences its value. As shown in Table III.1.38, structures built in 1939 or
earlier had a median value of 73,300 dollars while structures built between 1950 and 1959 had a
median value of 138,200 dollars, and those built between 1990 and 1999 had a median value of 0
dollars. The newest structures tended to have the highest values and those built between 2010 and
2013 and from 2014 or later had median values of 0 dollars and, 0 dollars, respectively. The total
median value in Alliance city was 105,600 dollars.
Table III.1.38 Owner Occupied Median Value by Year
Structure Built Alliance city
2019 Five-Year ACS Data
Year Structure Built Median Value
1939 or earlier 73,300
1940 to 1949 67,200
1950 to 1959 138,200
1960 to 1969 137,900
1970 to 1979 136,600
1980 to 1989 138,400
1990 to 1999 0
2000 to 2009 342,200
2010 to 2013 0
2014 or later 0
Median Value 105,600

Volume III: City Profiles Alliance city
N E B R A S K A I N V E S T M E N T F I N A N C E A U T H O R I T Y
Nebraska Profile III.1.40 Final Report: March 26, 2021
Household mortgage status is reported in Table III.1.39. In, Alliance city households with a mortgage
accounted for 49.4 percent of all households or 1,118 housing units, and the remaining 46.1 percent
or 1,042 units had no mortgage. Of those units with a mortgage, 76 had either a second mortgage or
home equity loan, 0 had both a second mortgage and home equity loan, and 1,042 or 46.1 percent
had no second mortgage or no home equity loan.
Table III.1.39 Mortgage Status
Alliance city 2019 Five-Year ACS Data
Mortgage Status Alliance city
Households % of Households
Housing units with a mortgage, contract to purchase, or similar debt 1,118 49.4
With either a second mortgage or home equity loan, but not both 76 3.4
Second mortgage only 0 0
Home equity loan only 76 3.4
Both second mortgage and home equity loan 0 0
No second mortgage and no home equity loan 1,042 46.1
Housing units without a mortgage 1,143 50.6
Total 2,261 100.0%
Table III.1.40 lists the Alliance city median rent as 496 dollars and the median home value as 105,600
dollars in 2019.
Table III.1.40 Median Rent
Alliance city 2019 Five-Year ACS Data Place Rent
Median Rent $496
Median Home Value $105,600
Volume III: City Profiles Alliance city
N E B R A S K A I N V E S T M E N T F I N A N C E A U T H O R I T Y
Nebraska Profile III.1.41 Final Report: March 26, 2021
Housing Problems
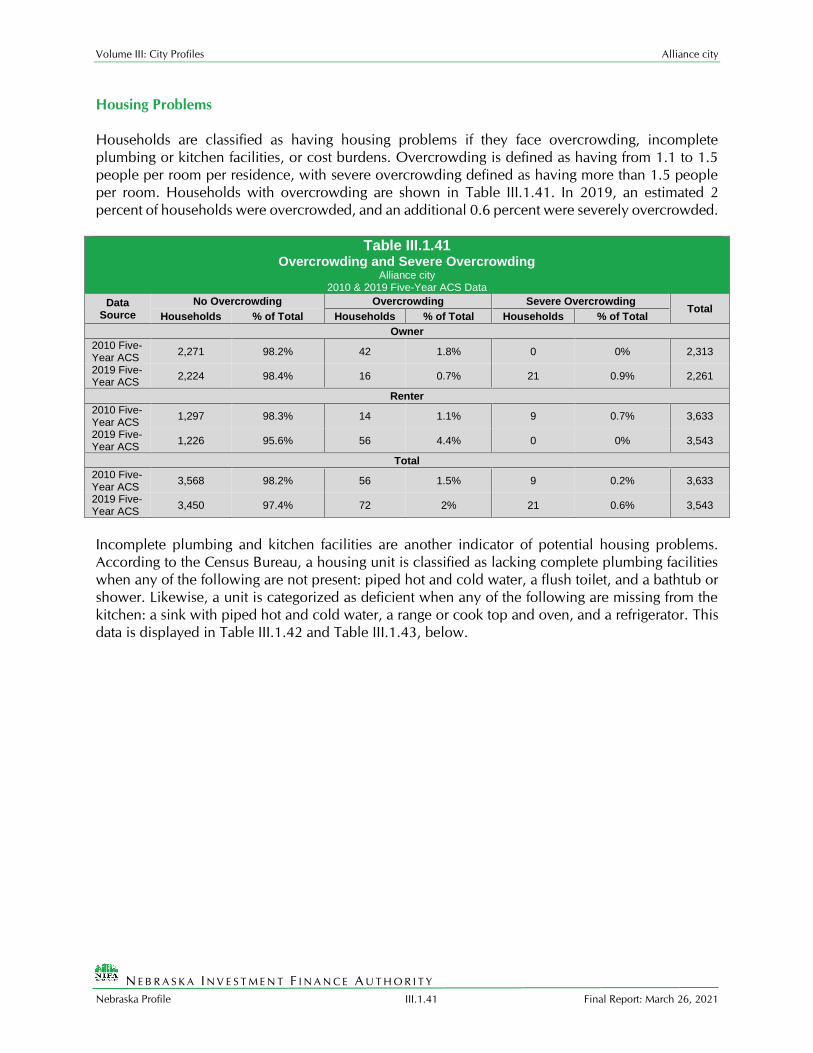
Households are classified as having housing problems if they face overcrowding, incomplete
plumbing or kitchen facilities, or cost burdens. Overcrowding is defined as having from 1.1 to 1.5
people per room per residence, with severe overcrowding defined as having more than 1.5 people
per room. Households with overcrowding are shown in Table III.1.41. In 2019, an estimated 2
percent of households were overcrowded, and an additional 0.6 percent were severely overcrowded.
Table III.1.41 Overcrowding and Severe Overcrowding
Alliance city 2010 & 2019 Five-Year ACS Data
Data Source
No Overcrowding Overcrowding Severe Overcrowding Total
Households % of Total Households % of Total Households % of Total
Owner
2010 Five-Year ACS
2,271 98.2% 42 1.8% 0 0% 2,313
2019 Five-Year ACS
2,224 98.4% 16 0.7% 21 0.9% 2,261
Renter
2010 Five-Year ACS
1,297 98.3% 14 1.1% 9 0.7% 3,633
2019 Five-Year ACS
1,226 95.6% 56 4.4% 0 0% 3,543
Total
2010 Five-Year ACS
3,568 98.2% 56 1.5% 9 0.2% 3,633
2019 Five-Year ACS
3,450 97.4% 72 2% 21 0.6% 3,543
Incomplete plumbing and kitchen facilities are another indicator of potential housing problems.
According to the Census Bureau, a housing unit is classified as lacking complete plumbing facilities
when any of the following are not present: piped hot and cold water, a flush toilet, and a bathtub or
shower. Likewise, a unit is categorized as deficient when any of the following are missing from the
kitchen: a sink with piped hot and cold water, a range or cook top and oven, and a refrigerator. This
data is displayed in Table III.1.42 and Table III.1.43, below.

Volume III: City Profiles Alliance city
N E B R A S K A I N V E S T M E N T F I N A N C E A U T H O R I T Y
Nebraska Profile III.1.42 Final Report: March 26, 2021
There were a total of 0 households with incomplete plumbing facilities in 2019, representing 0
percent of households in Alliance city. This is compared to 0.6 percent of households lacking
complete plumbing facilities in 2010.
Table III.1.42 Households with Incomplete Plumbing Facilities
2010 and 2019 Five-Year ACS Data
Households 2010 Five-Year ACS 2019 Five-Year ACS
With Complete Plumbing Facilities 3,613 3,543
Lacking Complete Plumbing Facilities 20 0
Total Households 3,633 3,543
Percent Lacking 0.6% 0%
There were 78 households lacking complete kitchen facilities in 2019, compared to 0 households in
2010. This was a change from 0 percent of households in 2010 to 2.2 percent in 2019.
Table III.1.43 Households with Incomplete Kitchen Facilities
Alliance city 2010 and 2019 Five-Year ACS Data
Households 2010 Five-Year ACS 2019 Five-Year
ACS
With Complete Kitchen Facilities 3,633 3,465
Lacking Complete Kitchen Facilities 0 78
Total Households 3,633 3,543
Percent Lacking 0% 2.2%
Cost burden is defined as gross housing costs that range from 30.0 to 50.0 percent of gross household
income; severe cost burden is defined as gross housing costs that exceed 50.0 percent of gross
household income. For homeowners, gross housing costs include property taxes, insurance, energy
payments, water and sewer service, and refuse collection. If the homeowner has a mortgage, the
determination also includes principal and interest payments on the mortgage loan. For renters, this
figure represents monthly rent and selected electricity and natural gas energy charges.
Volume III: City Profiles Alliance city
N E B R A S K A I N V E S T M E N T F I N A N C E A U T H O R I T Y
Nebraska Profile III.1.43 Final Report: March 26, 2021
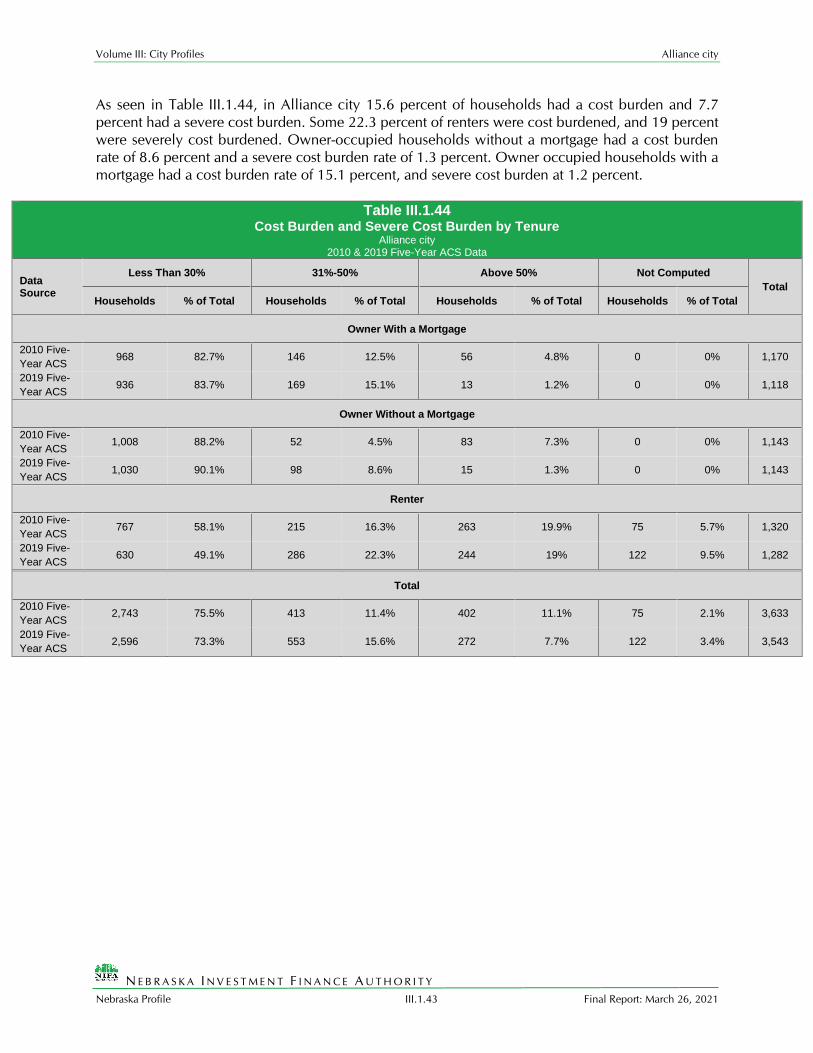
As seen in Table III.1.44, in Alliance city 15.6 percent of households had a cost burden and 7.7
percent had a severe cost burden. Some 22.3 percent of renters were cost burdened, and 19 percent
were severely cost burdened. Owner-occupied households without a mortgage had a cost burden
rate of 8.6 percent and a severe cost burden rate of 1.3 percent. Owner occupied households with a
mortgage had a cost burden rate of 15.1 percent, and severe cost burden at 1.2 percent.
Table III.1.44 Cost Burden and Severe Cost Burden by Tenure
Alliance city 2010 & 2019 Five-Year ACS Data
Data Source
Less Than 30% 31%-50% Above 50% Not Computed
Total
Households % of Total Households % of Total Households % of Total Households % of Total
Owner With a Mortgage
2010 Five-
Year ACS 968 82.7% 146 12.5% 56 4.8% 0 0% 1,170
2019 Five-
Year ACS 936 83.7% 169 15.1% 13 1.2% 0 0% 1,118
Owner Without a Mortgage
2010 Five-
Year ACS 1,008 88.2% 52 4.5% 83 7.3% 0 0% 1,143
2019 Five-
Year ACS 1,030 90.1% 98 8.6% 15 1.3% 0 0% 1,143
Renter
2010 Five-
Year ACS 767 58.1% 215 16.3% 263 19.9% 75 5.7% 1,320
2019 Five-
Year ACS 630 49.1% 286 22.3% 244 19% 122 9.5% 1,282
Total
2010 Five-
Year ACS 2,743 75.5% 413 11.4% 402 11.1% 75 2.1% 3,633
2019 Five-
Year ACS 2,596 73.3% 553 15.6% 272 7.7% 122 3.4% 3,543

Volume III: City Profiles Alliance city
N E B R A S K A I N V E S T M E N T F I N A N C E A U T H O R I T Y
Nebraska Profile III.1.44 Final Report: March 26, 2021
Comprehensive Housing Affordability Strategy (CHAS)
The following table set shows Comprehensive Housing Affordability Strategy (CHAS) data. If a data
point is not available or is missing, a “.” or “%” will be present in its place. To make this dataset more
accessible to the average user the income brackets were replaced with actual HUD Area Median
Family Income (HAMFI/MFI) from Box Butte County. Below is a table showing the MFI breakdown:
Box Butte County MFI
Income Bracket Actual Income
0 – 30% MFI $0 to $22,560
30.1 – 50% MFI $22,561 to $37,600
50.1 – 80% MFI $37,601 to $60,160
80.1 – 100% MFI $60,161 to $75,200
Above 100% MFI Above $75,200

Volume III: City Profiles Alliance city
N E B R A S K A I N V E S T M E N T F I N A N C E A U T H O R I T Y
Nebraska Profile III.1.45 Final Report: March 26, 2021
Housing Problems by Income, Race, and Tenure
Table III.1.45 through Table III.1.50 show households with housing problems by race/ethnicity.
These tables can be used to determine if there is a disproportionate housing need for any racial or
ethnic groups. If any racial/ethnic group faces housing problems at a rate of ten percentage points or
high than the jurisdiction average, then they have a disproportionate share of housing problems.
Housing problems are defined as any household that has overcrowding, inadequate kitchen or
plumbing facilities, or are cost burdened (pay more than 30 percent of their income on housing). In
Alliance city, housing problems are faced by 280 White homeowner households, 0 Black
homeowner households, 0 Asian homeowner households, and 15 Hispanic homeowner households.
Table III.1.45 Percent of Homeowner Households with Housing Problems by Income and Race
Alliance city 2013–2017 HUD CHAS Data
Income
Non-Hispanic by Race Hispanic (Any
Race) Total
White Black Asian American
Indian Pacific
Islander Other Race
With Housing Problems
$0 to $22,560 84% 0% 0% 0% 0% 0% 0% 75%
$22,561 to $37,600 73.3% 0% 0% 0% 0% 0% 0% 73.3%
$37,601 to $60,160 22.8% 0% 0% 0% 0% 0% 100% 26.7%
$60,161 to $75,200 11.8% 0% 0% 0% 0% 0% 0% 9.8%
Above $75,200 1.9% 0% 0% 0% 0% 0% 0% 1.6%
Total 13.4% 0% 0% 0% 0% 0% 6.2% 12.5%
Without Housing Problems
$0 to $22,560 16% 0% 0% 0% 0% 0% 100% 25%
$22,561 to $37,600 26.7% 0% 0% 0% 0% 0% 0% 26.7%
$37,601 to $60,160 77.2% 0% 0% 0% 0% 0% 0% 73.3%
$60,161 to $75,200 88.2% 100% 0% 0% 0% 0% 100% 90.2%
Above $75,200 98.1% 0% 0% 0% 0% 0% 100% 98.4%
Total 86.6% 100% 0% 0% 0% 0% 93.8% 87.5%

Volume III: City Profiles Alliance city
N E B R A S K A I N V E S T M E N T F I N A N C E A U T H O R I T Y
Nebraska Profile III.1.46 Final Report: March 26, 2021
Table III.1.46 Homeowner Households with Housing Problems by Income and Race
Alliance city 2013–2017 HUD CHAS Data
Income
Non-Hispanic by Race Hispanic (Any Race)
Total White Black Asian
American Indian
Pacific Islander
Other Race
With Housing Problems
$0 to $22,560 105 0 0 0 0 0 0 105
$22,561 to $37,600 55 0 0 0 0 0 0 55
$37,601 to $60,160 65 0 0 0 0 0 15 80
$60,161 to $75,200 30 0 0 0 0 0 0 30
Above $75,200 25 0 0 0 0 0 0 25
Total 280 0 0 0 0 0 15 295
Without Housing Problems
$0 to $22,560 20 0 0 0 0 0 15 35
$22,561 to $37,600 20 0 0 0 0 0 0 20
$37,601 to $60,160 220 0 0 0 0 0 0 220
$60,161 to $75,200 225 25 0 0 0 0 25 275
Above $75,200 1,325 0 0 0 0 0 185 1,510
Total 1,810 25 0 0 0 0 225 2,060
Not Computed
$0 to $22,560 0 0 0 0 0 0 0 0
$22,561 to $37,600 0 0 0 0 0 0 0 0
$37,601 to $60,160 0 0 0 0 0 0 0 0
$60,161 to $75,200 0 0 0 0 0 0 0 0
Above $75,200 0 0 0 0 0 0 0 0
Total 0 0 0 0 0 0 0 0
Total
$0 to $22,560 125 0 0 0 0 0 15 140
$22,561 to $37,600 75 0 0 0 0 0 0 75
$37,601 to $60,160 285 0 0 0 0 0 15 300
$60,161 to $75,200 255 25 0 0 0 0 25 305
Above $75,200 1,350 0 0 0 0 0 185 1,535
Total 2,090 25 0 0 0 0 240 2,355

Volume III: City Profiles Alliance city
N E B R A S K A I N V E S T M E N T F I N A N C E A U T H O R I T Y
Nebraska Profile III.1.47 Final Report: March 26, 2021
In total, some 490 renter households face housing problems in Alliance city. Of these, some 390
white renter households, 15 black renter households, 0 Asian renter households, and 10 Hispanic
renter households face housing problems.
Table III.1.47 Renter Households with Housing Problems by Income and Race
Alliance city 2013–2017 HUD CHAS Data
Income Non-Hispanic by Race Hispanic
(Any Race)
Total White Black Asian
American Indian
Pacific Islander
Other Race
With Housing Problems
$0 to $22,560 185 0 0 0 0 20 0 205
$22,561 to $37,600 110 0 0 55 0 0 10 175
$37,601 to $60,160 70 15 0 0 0 0 0 85
$60,161 to $75,200 25 0 0 0 0 0 0 25
Above $75,200 0 0 0 0 0 0 0 0
Total 390 15 0 55 0 20 10 490
Without Housing Problems
$0 to $22,560 0 0 0 0 0 0 0 0
$22,561 to $37,600 85 0 0 0 0 0 0 85
$37,601 to $60,160 180 0 0 0 0 0 0 180
$60,161 to $75,200 55 0 0 0 30 0 35 120
Above $75,200 185 0 0 0 0 0 10 195
Total 505 0 0 0 30 0 45 580
Not Computed
$0 to $22,560 0 0 0 0 0 0 50 50
$22,561 to $37,600 0 0 0 0 0 0 0 0
$37,601 to $60,160 0 0 0 0 0 0 0 0
$60,161 to $75,200 0 0 0 0 0 0 0 0
Above $75,200 0 0 0 0 0 0 0 0
Total 0 0 0 0 0 0 50 50
Total
$0 to $22,560 185 0 0 0 0 20 50 255
$22,561 to $37,600 195 0 0 55 0 0 10 260
$37,601 to $60,160 250 15 0 0 0 0 0 265
$60,161 to $75,200 80 0 0 0 30 0 35 145
Above $75,200 185 0 0 0 0 0 10 195
Total 895 15 0 55 30 20 105 1,120

Volume III: City Profiles Alliance city
N E B R A S K A I N V E S T M E N T F I N A N C E A U T H O R I T Y
Nebraska Profile III.1.48 Final Report: March 26, 2021
Table III.1.48 Percent of Renter Households with Housing Problems by Income and Race
Alliance city 2013–2017 HUD CHAS Data
Income Non-Hispanic by Race
Hispanic (Any Race)
Total White Black Asian
American Indian
Pacific Islander
Other Race
With Housing Problems
$0 to $22,560 100% 0% 0% 0% 0% 100% 0% 80.4%
$22,561 to $37,600 56.4% 0% 0% 100% 0% 0% 100% 67.3%
$37,601 to $60,160 28% 100% 0% 0% 0% 0% 0% 32.1%
$60,161 to $75,200 31.2% 0% 0% 0% 0% 0% 0% 17.2%
Above $75,200 0% 0% 0% 0% 0% 0% 0% 0%
Total 43.6% 100% 0% 100% 0% 100% 9.5% 43.8%
Without Housing Problems
$0 to $22,560 0% 0% 0% 0% 0% 0% 0% 0%
$22,561 to $37,600 43.6% 0% 0% 0% 0% 0% 0% 32.7%
$37,601 to $60,160 72% 0% 0% 0% 0% 0% 0% 67.9%
$60,161 to $75,200 68.8% 0% 0% 0% 100% 0% 100% 82.8%
Above $75,200 100% 0% 0% 0% 0% 0% 100% 100%
Total 56.4% 0% 0% 0% 100% 0% 42.9% 51.8%
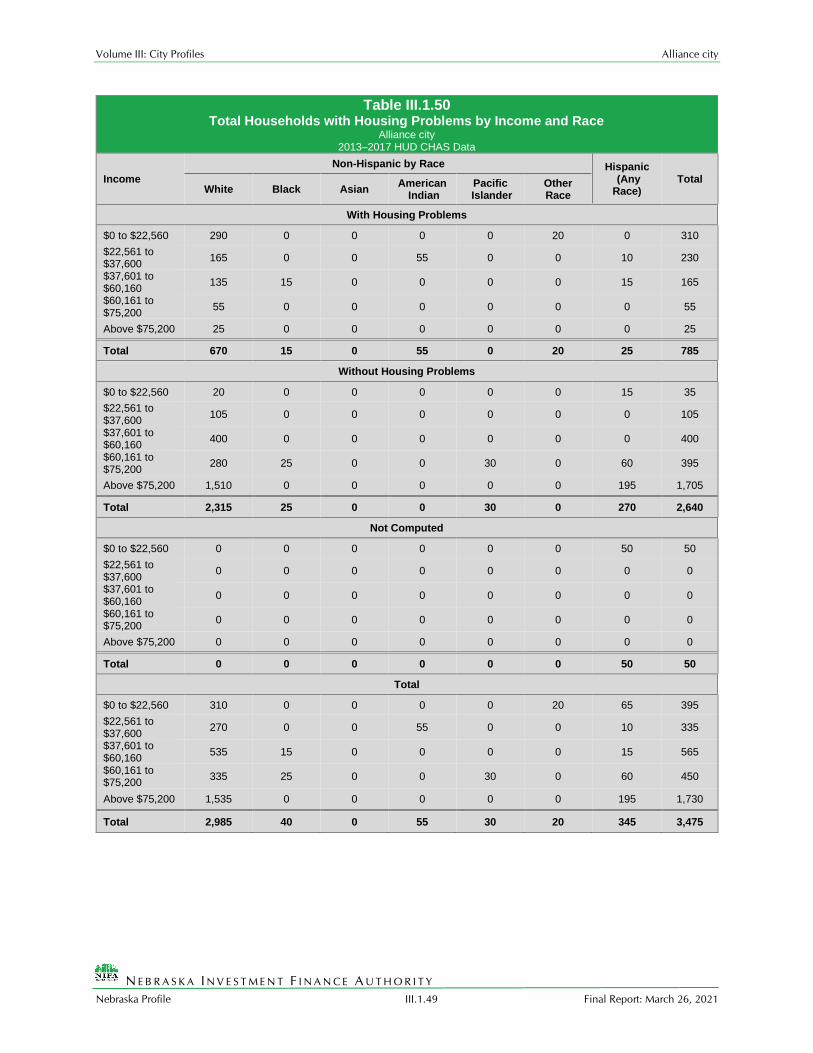
Overall, there are 785 households, or 22.6 percent of households with housing problems in Alliance
city. This includes 670 White households, 15 Black households, 0 Asian households, 55 American
Indian, 0 Pacific Islander, and 20 “other” race households with housing problems. In addition, there
are 25 Hispanic households with housing problems. This is shown in Table III.1.50.
Table III.1.49 Percent of Total Households with Housing Problems by Income and Race
Alliance city 2013–2017 HUD CHAS Data
Income
Non-Hispanic by Race Hispanic
(Any Race) Total
White Black Asian American
Indian Pacific
Islander Other Race
With Housing Problems
$0 to $22,560 93.5% 0% 0% 0% 0% 100% 0% 78.5% $22,561 to $37,600 61.1% 0% 0% 100% 0% 0% 100% 68.7% $37,601 to $60,160 25.2% 100% 0% 0% 0% 0% 100% 29.2% $60,161 to $75,200 16.4% 0% 0% 0% 0% 0% 0% 12.2% Above $75,200 1.6% 0% 0% 0% 0% 0% 0% 1.4%
Total 22.4% 37.5% 0% 100% 0% 100% 7.2% 22.6%
Without Housing Problems
$0 to $22,560 6.5% 0% 0% 0% 0% 0% 23.1% 8.9% $22,561 to $37,600 38.9% 0% 0% 0% 0% 0% 0% 31.3% $37,601 to $60,160 74.8% 0% 0% 0% 0% 0% 0% 70.8% $60,161 to $75,200 83.6% 100% 0% 0% 100% 0% 100% 87.8% Above $75,200 98.4% 0% 0% 0% 0% 0% 100% 98.6%
Total 77.6% 62.5% 0% 0% 100% 0% 78.3% 76%
Volume III: City Profiles Alliance city
N E B R A S K A I N V E S T M E N T F I N A N C E A U T H O R I T Y
Nebraska Profile III.1.49 Final Report: March 26, 2021
Table III.1.50 Total Households with Housing Problems by Income and Race
Alliance city 2013–2017 HUD CHAS Data
Income
Non-Hispanic by Race Hispanic (Any Race)
Total White Black Asian
American Indian
Pacific Islander
Other Race
With Housing Problems
$0 to $22,560 290 0 0 0 0 20 0 310
$22,561 to $37,600
165 0 0 55 0 0 10 230
$37,601 to $60,160
135 15 0 0 0 0 15 165
$60,161 to $75,200
55 0 0 0 0 0 0 55
Above $75,200 25 0 0 0 0 0 0 25
Total 670 15 0 55 0 20 25 785
Without Housing Problems
$0 to $22,560 20 0 0 0 0 0 15 35
$22,561 to $37,600
105 0 0 0 0 0 0 105
$37,601 to $60,160
400 0 0 0 0 0 0 400
$60,161 to $75,200
280 25 0 0 30 0 60 395
Above $75,200 1,510 0 0 0 0 0 195 1,705
Total 2,315 25 0 0 30 0 270 2,640
Not Computed
$0 to $22,560 0 0 0 0 0 0 50 50
$22,561 to $37,600
0 0 0 0 0 0 0 0
$37,601 to $60,160
0 0 0 0 0 0 0 0
$60,161 to $75,200
0 0 0 0 0 0 0 0
Above $75,200 0 0 0 0 0 0 0 0
Total 0 0 0 0 0 0 50 50
Total
$0 to $22,560 310 0 0 0 0 20 65 395
$22,561 to $37,600
270 0 0 55 0 0 10 335
$37,601 to $60,160
535 15 0 0 0 0 15 565
$60,161 to $75,200
335 25 0 0 30 0 60 450
Above $75,200 1,535 0 0 0 0 0 195 1,730
Total 2,985 40 0 55 30 20 345 3,475

Volume III: City Profiles Alliance city
N E B R A S K A I N V E S T M E N T F I N A N C E A U T H O R I T Y
Nebraska Profile III.1.50 Final Report: March 26, 2021
Table III.1.51 through Table III.1.53 show the percent of households with a severe housing problem
by tenure and race.
Table III.1.51 Percent of Homeowner Households with Severe Housing Problems by Income and Race
Alliance city 2013–2017 HUD CHAS Data
Income
Non-Hispanic by Race Hispanic
(Any Race) Total
White Black Asian American
Indian Pacific
Islander Other Race
With A Severe Housing Problem
$0 to $22,560 62.5% 0% 0% 0% 0% 0% 0% 55.6%
$22,561 to $37,600
20% 0% 0% 0% 0% 0% 0% 20%
$37,601 to $60,160
0% 0% 0% 0% 0% 0% 100% 5%
$60,161 to $75,200
0% 0% 0% 0% 0% 0% 0% 0%
Above $75,200 0% 0% 0% 0% 0% 0% 0% 0%
Total 4.3% 0 0% 0% 0% 0% 6.2% 4.5%
Without A Severe Housing Problems
$0 to $22,560 37.5% 0% 0% 0% 0% 0% 100% 44.4%
$22,561 to $37,600
80% 0% 0% 0% 0% 0% 0% 80%
$37,601 to $60,160
100% 0% 0% 0% 0% 0% 0% 95%
$60,161 to $75,200
100% 100% 0% 0% 0% 0% 100% 100%
Above $75,200 100% 0% 0% 0% 0% 0% 100% 100%
Total 95.7% 100% 0% 0% 0% 0% 93.8% 95.5%
Table III.1.52 Percent of Renter Households with Severe Housing Problems by Income and Race
Alliance city 2013–2017 HUD CHAS Data
Income
Non-Hispanic by Race Hispanic
(Any Race) Total
White Black Asian American
Indian Pacific
Islander Other Race
With A Severe Housing Problem
$0 to $22,560 100% 0% 0% 0% 0% 100% 0% 80.4%
$22,561 to $37,600 7.9% 0% 0% 0% 0% 0% 0% 5.9%
$37,601 to $60,160 0% 0% 0% 0% 0% 0% 0% 0%
$60,161 to $75,200 31.2% 0% 0% 0% 0% 0% 0% 17.2%
Above $75,200 0% 0% 0% 0% 0% 0% 0% 0%
Total 25.1% 0% 0% 0% 0% 100% 0% 21.9%
Without A Severe Housing Problems
$0 to $22,560 0% 0% 0% 0% 0% 0% 0% 0%
$22,561 to $37,600 92.1% 0% 0% 100% 0% 0% 100% 94.1%
$37,601 to $60,160 100% 100% 0% 0% 0% 0% 0% 100%
$60,161 to $75,200 68.8% 0% 0% 0% 100% 0% 100% 82.8%
Above $75,200 100% 0% 0% 0% 0% 0% 100% 100%
Total 74.9% 100% 0% 100% 100% 0% 52.4% 73.7%

Volume III: City Profiles Alliance city
N E B R A S K A I N V E S T M E N T F I N A N C E A U T H O R I T Y
Nebraska Profile III.1.51 Final Report: March 26, 2021
Table III.1.53 Percent of Total Households with Severe Housing Problems by Income and Race
Alliance city 2013–2017 HUD CHAS Data
Income Non-Hispanic by Race Hispanic
(Any Race) Total
White Black Asian American Indian Pacific Islander Other Race
With A Severe Housing Problem
$0 to $22,560 85.2% 0% 0% 0% 0% 100% 0% 71.8%
$22,561 to $37,600
11.3% 0% 0% 0% 0% 0% 0% 9.1%
$37,601 to $60,160
0% 0% 0% 0% 0% 0% 100% 2.6%
$60,161 to $75,200
7.5% 0% 0% 0% 0% 0% 0% 5.6%
Above $75,200 0% 0% 0% 0% 0% 0% 0% 0%
Total 10.6% 0% 0% 0% 0% 100% 4.3% 10.1%
Without A Severe Housing Problems
$0 to $22,560 14.8% 0% 0% 0% 0% 0% 23.1% 15.4%
$22,561 to $37,600
88.7% 0% 0% 100% 0% 0% 100% 90.9%
$37,601 to $60,160
100% 100% 0% 0% 0% 0% 0% 97.4%
$60,161 to $75,200
92.5% 100% 0% 0% 100% 0% 100% 94.4%
Above $75,200 100% 0% 0% 0% 0% 0% 100% 100%
Total 89.4% 100% 0% 100% 100% 0% 81.2% 88.5%

Volume III: City Profiles Alliance city
N E B R A S K A I N V E S T M E N T F I N A N C E A U T H O R I T Y
Nebraska Profile III.1.52 Final Report: March 26, 2021
These racial/ethnic groups tend to be disproportionately impacted by severe housing problems, as
seen in Table III.1.54. Severe housing problems include overcrowding at a rate of more than 1.5
persons per room and housing costs exceeding 50 percent of the household income. Some 0 black
homeowner households face severe housing problems, as well as 0 Asian homeowner households,
and 15 Hispanic homeowner households.
Table III.1.54 Total Households with Severe Housing Problems by Income and Race
Alliance city 2013–2017 HUD CHAS Data
Income
Non-Hispanic by Race Hispanic
(Any Race) Total
White Black Asian American
Indian Pacific
Islander Other Race
With A Severe Housing Problem
$0 to $22,560 260 0 0 0 0 20 0 280
$22,561 to $37,600
30 0 0 0 0 0 0 30
$37,601 to $60,160
0 0 0 0 0 0 15 15
$60,161 to $75,200
25 0 0 0 0 0 0 25
Above $75,200 0 0 0 0 0 0 0 0
Total 315 0 0 0 0 20 15 350
Without A Severe Housing Problems
$0 to $22,560 45 0 0 0 0 0 15 60
$22,561 to $37,600
235 0 0 55 0 0 10 300
$37,601 to $60,160
540 15 0 0 0 0 0 555
$60,161 to $75,200
310 25 0 0 30 0 60 425
Above $75,200 1,535 0 0 0 0 0 195 1,730
Total 2,665 40 0 55 30 0 280 3,070
Not Computed
$0 to $22,560 0 0 0 0 0 0 50 50
$22,561 to $37,600
0 0 0 0 0 0 0 0
$37,601 to $60,160
0 0 0 0 0 0 0 0
$60,161 to $75,200
0 0 0 0 0 0 0 0
Above $75,200 0 0 0 0 0 0 0 0
Total 0 0 0 0 0 0 50 50
Total
$0 to $22,560 305 0 0 0 0 20 65 390
$22,561 to $37,600
265 0 0 55 0 0 10 330
$37,601 to $60,160
540 15 0 0 0 0 15 570
$60,161 to $75,200
335 25 0 0 30 0 60 450
Above $75,200 1,535 0 0 0 0 0 195 1,730
Total 2,980 40 0 55 30 20 345 3,470

Volume III: City Profiles Alliance city
N E B R A S K A I N V E S T M E N T F I N A N C E A U T H O R I T Y
Nebraska Profile III.1.53 Final Report: March 26, 2021
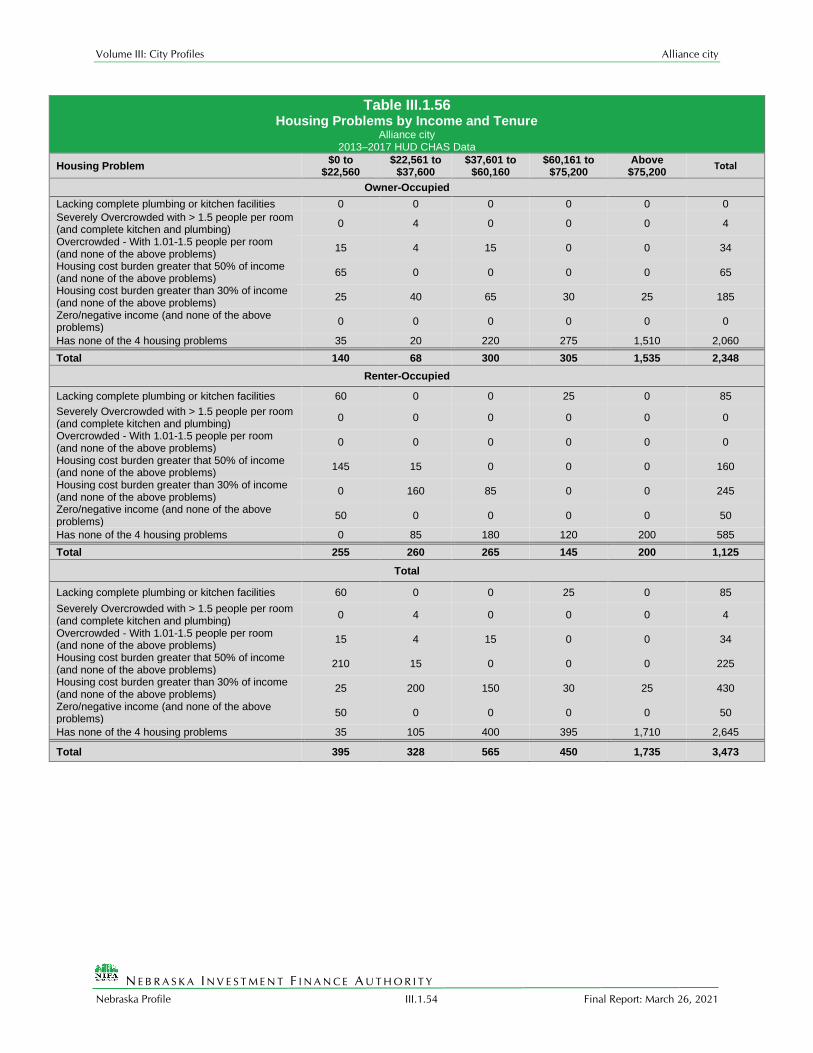
As seen in Table III.1.55 and Table III.1.56, the most common housing problem tends to be housing
cost burdens. More than 430 households have a cost burden and 225 have a severe cost burden.
Some 245 renter households are impacted by cost burdens, and 160 are impacted by severe cost
burdens. On the other hand, some 185 owner-occupied households have cost burdens, and 65 have
severe cost burdens. Overall there are 2,645 households without a housing problem.
Table III.1.55 Percent of Housing Problems by Income and Tenure
Alliance city 2013–2017 HUD CHAS Data
Housing Problem $0 to
$22,560 $22,561 to
$37,600 $37,601 to
$60,160 $60,161 to
$75,200 Above $75,200
Total
Owner-Occupied
Lacking complete plumbing or kitchen facilities
0% 0% 0% 0% 0% 0%
Severely overcrowded with > 1.5 people per room (and complete kitchen and plumbing)
0% 5.9% 0% 0% 0% 0.2%
Overcrowded - With 1.01-1.5 people per room (and none of the above problems)
10.7% 5.9% 5% 0% 0% 1.4%
Housing cost burden greater that 50% of income (and none of the above problems)
46.4% 0% 0% 0% 0% 2.8%
Housing cost burden greater than 30% of income (and none of the above problems)
17.9% 58.8% 21.7% 9.8% 1.6% 7.9%
Zero/negative income (and none of the above problems)
0% 0% 0% 0% 0% 0%
Has none of the 4 housing problems
25% 29.4% 73.3% 90.2% 98.4% 87.7%
Total 100% 100% 100% 100% 100% 100%
Renter-Occupied
Lacking complete plumbing or kitchen facilities
23.5% 0% 0% 17.2% 0% 7.6%
Severely overcrowded with > 1.5 people per room (and complete kitchen and plumbing)
0% 0% 0% 0% 0% 0%
Overcrowded - With 1.01-1.5 people per room (and none of the above problems)
0% 0% 0% 0% 0% 0%
Housing cost burden greater that 50% of income (and none of the above problems)
56.9% 5.8% 0% 0% 0% 14.2%
Housing cost burden greater than 30% of income (and none of the above problems)
0% 61.5% 32.1% 0% 0% 21.8%
Zero/negative income (and none of the above problems)
19.6% 0% 0% 0% 0% 4.4%
Has none of the 4 housing problems
0% 32.7% 67.9% 82.8% 100% 52%
Total 100% 100% 100% 100% 100% 100%
Volume III: City Profiles Alliance city
N E B R A S K A I N V E S T M E N T F I N A N C E A U T H O R I T Y
Nebraska Profile III.1.54 Final Report: March 26, 2021
Table III.1.56 Housing Problems by Income and Tenure
Alliance city 2013–2017 HUD CHAS Data
Housing Problem $0 to
$22,560 $22,561 to
$37,600 $37,601 to
$60,160 $60,161 to
$75,200 Above
$75,200 Total
Owner-Occupied
Lacking complete plumbing or kitchen facilities 0 0 0 0 0 0
Severely Overcrowded with > 1.5 people per room (and complete kitchen and plumbing)
0 4 0 0 0 4
Overcrowded - With 1.01-1.5 people per room (and none of the above problems)
15 4 15 0 0 34
Housing cost burden greater that 50% of income (and none of the above problems)
65 0 0 0 0 65
Housing cost burden greater than 30% of income (and none of the above problems)
25 40 65 30 25 185
Zero/negative income (and none of the above problems)
0 0 0 0 0 0
Has none of the 4 housing problems 35 20 220 275 1,510 2,060
Total 140 68 300 305 1,535 2,348
Renter-Occupied
Lacking complete plumbing or kitchen facilities 60 0 0 25 0 85
Severely Overcrowded with > 1.5 people per room (and complete kitchen and plumbing)
0 0 0 0 0 0
Overcrowded - With 1.01-1.5 people per room (and none of the above problems)
0 0 0 0 0 0
Housing cost burden greater that 50% of income (and none of the above problems)
145 15 0 0 0 160
Housing cost burden greater than 30% of income (and none of the above problems)
0 160 85 0 0 245
Zero/negative income (and none of the above problems)
50 0 0 0 0 50
Has none of the 4 housing problems 0 85 180 120 200 585
Total 255 260 265 145 200 1,125
Total
Lacking complete plumbing or kitchen facilities 60 0 0 25 0 85
Severely Overcrowded with > 1.5 people per room (and complete kitchen and plumbing)
0 4 0 0 0 4
Overcrowded - With 1.01-1.5 people per room (and none of the above problems)
15 4 15 0 0 34
Housing cost burden greater that 50% of income (and none of the above problems)
210 15 0 0 0 225
Housing cost burden greater than 30% of income (and none of the above problems)
25 200 150 30 25 430
Zero/negative income (and none of the above problems)
50 0 0 0 0 50
Has none of the 4 housing problems 35 105 400 395 1,710 2,645
Total 395 328 565 450 1,735 3,473

Volume III: City Profiles Alliance city
N E B R A S K A I N V E S T M E N T F I N A N C E A U T H O R I T Y
Nebraska Profile III.1.55 Final Report: March 26, 2021
Cost Burdens
For owner occupied housing, elderly non-family households are most likely to be impacted by
housing cost burdens, with 16.7 percent of these households having a cost burden or severe cost
burden. For lower income owner households, elderly non-family households and large families are
most likely to experience cost burdens. Some 44.4 percent of elderly non-family and 100 percent of
large family households below 30 percent HAMFI face cost burdens or severe cost burdens. These
data are shown in Table III.1.57

Volume III: City Profiles Alliance city
N E B R A S K A I N V E S T M E N T F I N A N C E A U T H O R I T Y
Nebraska Profile III.1.56 Final Report: March 26, 2021
Table III.1.57 Owner-Occupied Households by Income and Family Status and Cost
Burden Alliance city
2013–2017 HUD CHAS Data
Income Elderly Family
Small Family
Large Family
Elderly Non-Family
Other Household
Total
No Cost Burden
$0 to $22,560 0 15 0 10 10 35
$22,561 to $37,600 4 0 15 15 0 34
$37,601 to $60,160 70 70 15 65 20 240
$60,161 to $75,200 100 25 25 90 35 275
Above $75,200 305 800 185 110 110 1,510
Total 479 910 240 290 175 2,094
Cost Burden
$0 to $22,560 0 20 15 4 0 39
$22,561 to $37,600 15 0 0 30 0 45
$37,601 to $60,160 10 35 4 20 0 69
$60,161 to $75,200 20 10 0 0 0 30
Above $75,200 0 15 0 0 10 25
Total 45 80 19 54 10 208
Severe Cost Burden
$0 to $22,560 0 0 0 4 55 59
$22,561 to $37,600 0 0 0 0 0 0
$37,601 to $60,160 0 0 0 0 0 0
$60,161 to $75,200 0 0 0 0 0 0
Above $75,200 0 0 0 0 0 0
Total 0 0 0 4 55 59
Cost Burden Not Computed
$0 to $22,560 0 0 0 0 0 0
$22,561 to $37,600 0 0 0 0 0 0
$37,601 to $60,160 0 0 0 0 0 0
$60,161 to $75,200 0 0 0 0 0 0
Above $75,200 0 0 0 0 0 0
Total 0 0 0 0 0 0
Total
$0 to $22,560 0 35 15 18 65 133
$22,561 to $37,600 19 0 15 45 0 79
$37,601 to $60,160 80 105 19 85 20 309
$60,161 to $75,200 120 35 25 90 35 305
Above $75,200 305 815 185 110 120 1,535
Total 524 990 259 348 240 2,361

Volume III: City Profiles Alliance city
N E B R A S K A I N V E S T M E N T F I N A N C E A U T H O R I T Y
Nebraska Profile III.1.57 Final Report: March 26, 2021
Table III.1.58 displays cost burden in renter-occupied households by family status and income. Renter
households tend to be impacted at a higher rate by cost burdens than owner households. Some 245
renter occupied households faced cost burdens, compared to 208 owner occupied households. Of
these, there are 0 renter households with incomes less than 30 percent HAMFI facing housing
problems.

Volume III: City Profiles Alliance city
N E B R A S K A I N V E S T M E N T F I N A N C E A U T H O R I T Y
Nebraska Profile III.1.58 Final Report: March 26, 2021
Table III.1.58 Renter-Occupied Households by Income and Family Status and Cost
Burden Alliance city
2013–2017 HUD CHAS Data
Income Elderly Family
Small Family
Large Family
Elderly Non-Family
Other Household
Total
No Cost Burden
$0 to $22,560 0 0 0 0 0 0
$22,561 to $37,600 0 20 0 0 65 85
$37,601 to $60,160 4 40 45 30 60 179
$60,161 to $75,200 0 65 0 25 60 150
Above $75,200 10 75 0 0 115 200
Total 14 200 45 55 300 614
Cost Burden
$0 to $22,560 0 0 0 0 0 0
$22,561 to $37,600 55 20 20 25 35 155
$37,601 to $60,160 0 50 0 25 15 90
$60,161 to $75,200 0 0 0 0 0 0
Above $75,200 0 0 0 0 0 0
Total 55 70 20 50 50 245
Severe Cost Burden
$0 to $22,560 0 35 0 140 30 205
$22,561 to $37,600 0 0 0 15 0 15
$37,601 to $60,160 0 0 0 0 0 0
$60,161 to $75,200 0 0 0 0 0 0
Above $75,200 0 0 0 0 0 0
Total 0 35 0 155 30 220
Cost Burden Not Computed
$0 to $22,560 0 0 0 0 50 50
$22,561 to $37,600 0 0 0 0 0 0
$37,601 to $60,160 0 0 0 0 0 0
$60,161 to $75,200 0 0 0 0 0 0
Above $75,200 0 0 0 0 0 0
Total 0 0 0 0 50 50
Total
$0 to $22,560 0 35 0 140 80 255
$22,561 to $37,600 55 40 20 40 100 255
$37,601 to $60,160 4 90 45 55 75 269
$60,161 to $75,200 0 65 0 25 60 150
Above $75,200 10 75 0 0 115 200
Total 69 305 65 260 430 1,129

Volume III: City Profiles Alliance city
N E B R A S K A I N V E S T M E N T F I N A N C E A U T H O R I T Y
Nebraska Profile III.1.59 Final Report: March 26, 2021
In total, some 450 households face cost burdens, and 285 face severe cost burdens. This includes
205 owner households and 245 renter households facing cost burdens, and another 65 owner
households and 220 renter households facing severe cost burdens, as seen in Table III.1.59.
Table III.1.59 Households with Cost Burden by Tenure and Race
Alliance city 2013–2017 HUD CHAS Data
Race No Cost Burden
Cost Burden Severe Cost
Burden Not
Computed Total
Owner-Occupied
White 1,820 205 65 0 2,090
Black 25 0 0 0 25
Asian 0 0 0 0 0
American Indian 0 0 0 0 0
Pacific Islander 0 0 0 0 0
Other Race 0 0 0 0 0
Hispanic 240 0 0 0 240
Total 2,085 205 65 0 2,355
Renter-Occupied
White 530 165 200 0 895
Black 0 15 0 0 15
Asian 0 0 0 0 0
American Indian 0 55 0 0 55
Pacific Islander 30 0 0 0 30
Other Race 0 0 20 0 20
Hispanic 50 10 0 50 110
Total 610 245 220 50 1,125
Total
White 2,350 370 265 0 2,985
Black 25 15 0 0 40
Asian 0 0 0 0 0
American Indian 0 55 0 0 55
Pacific Islander 30 0 0 0 30
Other Race 0 0 20 0 20
Hispanic 290 10 0 50 350
Total 2,695 450 285 50 3,480

Volume III: City Profiles Alliance city
N E B R A S K A I N V E S T M E N T F I N A N C E A U T H O R I T Y
Nebraska Profile III.1.60 Final Report: March 26, 2021
Lead-Based Paint Risks
According to the Environmental Protection Agency (EPA), older homes are more likely to contain
lead-based paint, which is one of the most common causes of lead poisoning. A home built between
1960 and 1977 has a 24 percent chance of containing lead-based paint, while a home built from
1940 to 1959 has a 69 percent chance of containing lead-based paint. Homes built before 1940 have
the highest rate of lead-based paint at 87 percent3.
Table III.1.60 shows the risk of lead-based paint for households with young children present. As seen,
there are an estimated 355 households built between 1940 and 1979 with young children present,
and 149 built prior to 1939.
3 https://www.epa.gov/lead/protect-your-family-exposures-lead#sl-home

Volume III: City Profiles Alliance city
N E B R A S K A I N V E S T M E N T F I N A N C E A U T H O R I T Y
Nebraska Profile III.1.61 Final Report: March 26, 2021
Table III.1.60 Vintage of Households by Income and Presence of Young
Children Alliance city
2013–2017 HUD CHAS Data
Income One or more
children age 6 or younger
No children age 6 or younger
Total
Built 1939 or Earlier
$0 to $22,560 35 40 75
$22,561 to $37,600 4 65 69
$37,601 to $60,160 55 75 130
$60,161 to $75,200 0 120 120
Above $75,200 55 410 465
Total 149 710 859
Built 1940 to 1979
$0 to $22,560 20 205 225
$22,561 to $37,600 25 225 250
$37,601 to $60,160 55 295 350
$60,161 to $75,200 105 170 275
Above $75,200 150 775 925
Total 355 1,670 2,025
Built 1980 or Later
$0 to $22,560 10 85 95
$22,561 to $37,600 10 0 10
$37,601 to $60,160 0 90 90
$60,161 to $75,200 4 45 49
Above $75,200 60 275 335
Total 84 495 579
Total
$0 to $22,560 65 330 395
$22,561 to $37,600 39 290 329
$37,601 to $60,160 110 460 570
$60,161 to $75,200 109 335 444
Above $75,200 265 1,460 1,725
Total 588 2,875 3,463

Volume III: City Profiles Alliance city
N E B R A S K A I N V E S T M E N T F I N A N C E A U T H O R I T Y
Nebraska Profile III.1.62 Final Report: March 26, 2021
Elderly Housing Needs
Table III.1.61 shows the rate of housing problems for elderly households, ages 62 to 74, and extra
elderly households, ages 75 and above. Some 154 elderly and 234 extra-elderly households have
housing problems. Of these, some 39 elderly households with housing problems have incomes less
than 30 percent MFI, and 109 extra-elderly households have incomes below 30 percent MFI.
Table III.1.61 Households with Housing Problems by Income and Elderly Status
Alliance city 2013–2017 HUD CHAS Data
Income Elderly Extra-Elderly Non-Elderly Total
With Housing Problems
$0 to $22,560 39 109 155 303
$22,561 to $37,600 70 75 79 224
$37,601 to $60,160 25 25 110 160
$60,161 to $75,200 20 25 10 55
Above $75,200 0 0 25 25
Total 154 234 379 767
Without Housing Problems
$0 to $22,560 0 10 25 35
$22,561 to $37,600 15 4 85 104
$37,601 to $60,160 84 85 235 404
$60,161 to $75,200 155 35 205 395
Above $75,200 410 70 1,225 1,705
Total 664 204 1,775 2,643
Not Computed
$0 to $22,560 0 0 50 50
$22,561 to $37,600 0 0 0 0
$37,601 to $60,160 0 0 0 0
$60,161 to $75,200 0 0 0 0
Above $75,200 0 0 0 0
Total 0 0 50 50
Total
$0 to $22,560 39 119 230 388
$22,561 to $37,600 85 79 164 328
$37,601 to $60,160 109 110 345 564
$60,161 to $75,200 175 60 215 450
Above $75,200 410 70 1,250 1,730
Total 818 438 2,204 3,460

Volume III: City Profiles Alliance city
N E B R A S K A I N V E S T M E N T F I N A N C E A U T H O R I T Y
Nebraska Profile III.1.63 Final Report: March 26, 2021
Survey of Rental Properties
From September through December of 2020, a
telephone survey was conducted with landlords
and rental property managers throughout
Nebraska. Table III.1.62, presents some basic
statistics about the completed surveys from this
and other surveys conducted from 2002 through
2020 in Alliance city. The number of completed
surveys decreased to 6 in 2020 from 8 in 2019.
Between 2019 and 2020 the vacancy rate for all
units decreased by 3.1 percentage points and
was at 7.8 percent in 2020.
Table III.1.63 shows the amount of total and
vacant units with their associated vacancy rates.
At the time of the survey, there were an estimated
21 single-family units in Alliance city, with 0 of
them available. This translates into a vacancy rate
of 0 percent in Alliance city, which compares to
a single-family vacancy rate of 2.8 percent for the
State of Nebraska. There were 110 apartment
units reported in the survey, with 10 of them
available, which resulted in a vacancy rate of 9.1 percent. This compares to a statewide vacancy rate
of 3.7 percent for apartment units across the state.
Table III.1.63 Rental Vacancy Survey by Type
Alliance city 2020 Survey of Rental Properties
Place Total Units Vacant Units Vacancy Rate Five-Year Average
Single-Family 21 0 0% 3.4%
Apartments 110 10 9.1% 6.3%
Mobile Homes 0 0 0% 0%
“Other” Units 0 0 0% 0%
Don’t Know 10 1 10% .
Total 141 11 7.8% 7.5%
Table III.1.62 Survey of Rental Properties
Alliance city 2002–2020 Survey of Rental Properties
Year Completed
Surveys Total Units
Vacancy Rate
Absorption Rate
2002 0 0 0 0
2003 0 0 0 0
2004 0 0 0 0
2005 0 0 0 0
2006 0 0 0 0
2007 0 0 0 0
2008 0 0 0 0
2009 0 0 0 0
2010 0 0 0 0
2011 0 0 0 0
2012 20 919 5.8 23.3
2013 18 584 6.7 22
2014 20 608 2.8 63.7
2015 18 684 2.6 35.6
2016 15 463 13 43.3
2017 17 417 10.8 23.1
2018 12 360 8.1 44
2019 8 295 4.7 32
2020 6 141 7.8 30.5

Volume III: City Profiles Alliance city
N E B R A S K A I N V E S T M E N T F I N A N C E A U T H O R I T Y
Nebraska Profile III.1.64 Final Report: March 26, 2021
Diagram III.1.14 Survey Responses by Year
Alliance city Survey of Rental Properties
Diagram III.1.15
Units and Vacancy Rate by Year Alliance city
Survey of Rental Properties

Volume III: City Profiles Alliance city
N E B R A S K A I N V E S T M E N T F I N A N C E A U T H O R I T Y
Nebraska Profile III.1.65 Final Report: March 26, 2021
Table III.1.64 reports units by number of bedrooms. There were 49 two-bedroom apartment units
and 24 three-bedroom units. Overall, the 51 two-bedroom units accounted for 36.2 percent of all
units, and the 35 three-bedroom units accounted for 24.8 percent. Several respondents choose not
to provide bedroom sizes, which accounted for the 26 units listed as “Don’t Know.”
Table III.1.64 Rental Units by Number of Bedrooms
Alliance city 2020 Survey of Rental Properties
Number of Bedrooms
Single-Family Units
Apartment Units
Mobile Homes
“Other” Units
Don’t Know
Total
Efficiency 0 0 0 0 . 0
One 0 16 0 0 . 16
Two 2 49 0 0 . 51
Three 11 24 0 0 . 35
Four 8 5 0 0 . 13
Don’t Know 0 16 0 0 10 26
Total 21 110 0 0 10 141
Table III.1.65 displays the vacancy rate of
single-family units by the number of
bedrooms. Three-bedroom units were the
most common type of reported single-
family unit, which had a vacancy rate of 0
percent.
Table III.1.66 displays the vacancy rate of
apartment units by the number of
bedrooms. The most common apartment
units were Two-bedroom units, which had
a vacancy rate of 2 percent.
Table III.1.65 Single-Family Units by Number of Bedrooms
Alliance city 2020 Survey of Rental Properties
Number of Bedrooms
Units Available Units Vacancy Rates
Efficiency 0 0 0%
One 0 0 0%
Two 2 0 0%
Three 11 0 0%
Four 8 0 0%
Don’t know 0 0 0%
Total 21 0 0%

Volume III: City Profiles Alliance city
N E B R A S K A I N V E S T M E N T F I N A N C E A U T H O R I T Y
Nebraska Profile III.1.66 Final Report: March 26, 2021
Table III.1.66 Apartment Units by Number of Bedrooms
Alliance city 2020 Survey of Rental Properties
Number of Bedrooms
Units Available Units Vacancy Rates
Efficiency 0 0 0%
One 16 1 6.2%
Two 49 1 2%
Three 24 0 0%
Four 5 0 0%
Don’t know 16 8 50%
Total 110 10 9.1%
Average market-rate rents by unit type are shown in Table III.1.67. Not all respondents were able to
disclose the rental amounts for their units, so there may be some statistical aberrations in the
computed rental rates, but generally those units with more bedrooms had higher rents.
Table III.1.67 Average Market Rate Rents by Number of Bedrooms
Alliance city 2020 Survey of Rental Properties
Number of Bedrooms
Single-Family Units
Apartment Units
Mobile Homes
“Other” Units Total
Efficiency $0 $0 $0 $0 $0
One $0 $285 $0 $0 $285
Two $0 $450 $0 $0 $450
Three $925 $0 $0 $0 $925
Four $0 $0 $0 $0 $0
Average4 $767 $439 $0 $0 $614
Median market-rate rents by unit type are shown in Table III.1.68. Not all respondents were able to
disclose the rental amounts for their units, so there may be some statistical aberrations in the
computed rental rates, but generally those units with more bedrooms had higher rents.
Table III.1.68 Median Market Rate Rents by Number of Bedrooms
Alliance city 2020 Survey of Rental Properties
Number of Bedrooms
Single-Family Units
Apartment Units
Mobile Homes
“Other” Units Total
Efficiency $0 $0 $0 $0 $0
One $0 $285 $0 $0 $285
Two $0 $450 $0 $0 $450
Three $925 $0 $0 $0 $925
Four $0 $0 $0 $0 $0
Average $825 $450 $0 $0 $581
4 Rents for units missing number of bedrooms are not shown.
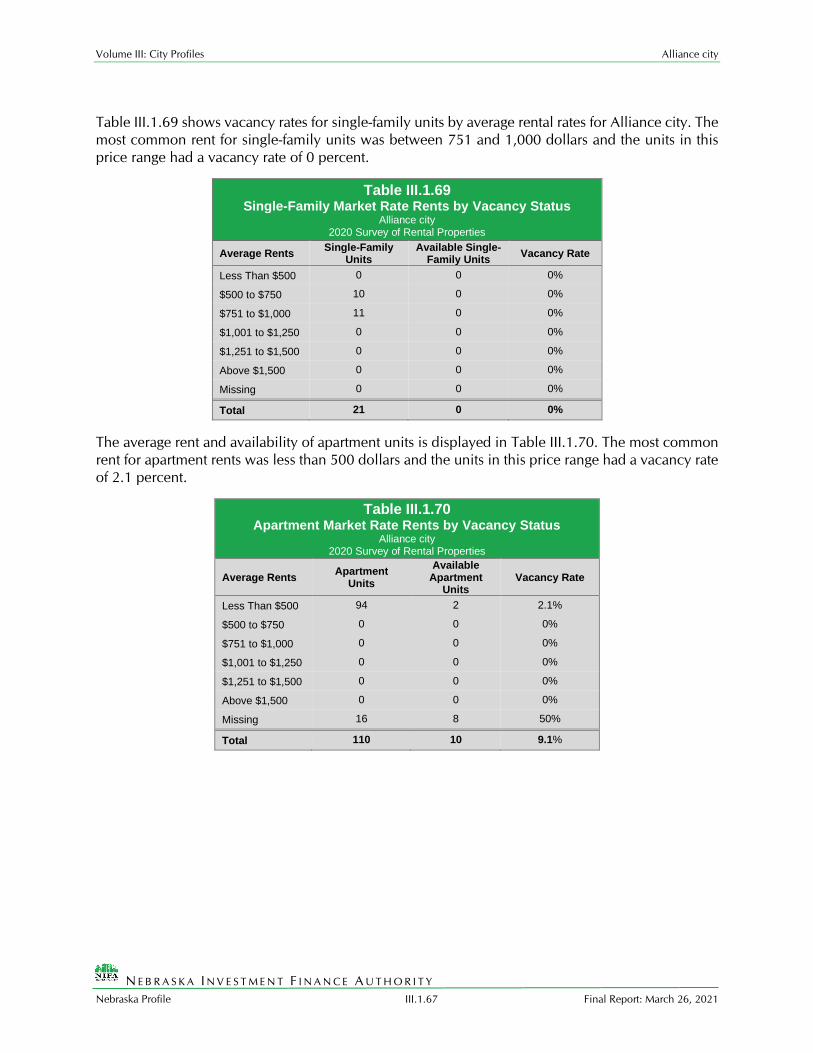
Volume III: City Profiles Alliance city
N E B R A S K A I N V E S T M E N T F I N A N C E A U T H O R I T Y
Nebraska Profile III.1.67 Final Report: March 26, 2021
Table III.1.69 shows vacancy rates for single-family units by average rental rates for Alliance city. The
most common rent for single-family units was between 751 and 1,000 dollars and the units in this
price range had a vacancy rate of 0 percent.
Table III.1.69 Single-Family Market Rate Rents by Vacancy Status
Alliance city 2020 Survey of Rental Properties
Average Rents Single-Family
Units Available Single-
Family Units Vacancy Rate
Less Than $500 0 0 0%
$500 to $750 10 0 0%
$751 to $1,000 11 0 0%
$1,001 to $1,250 0 0 0%
$1,251 to $1,500 0 0 0%
Above $1,500 0 0 0%
Missing 0 0 0%
Total 21 0 0%
The average rent and availability of apartment units is displayed in Table III.1.70. The most common
rent for apartment rents was less than 500 dollars and the units in this price range had a vacancy rate
of 2.1 percent.
Table III.1.70 Apartment Market Rate Rents by Vacancy Status
Alliance city 2020 Survey of Rental Properties
Average Rents Apartment
Units
Available Apartment
Units Vacancy Rate
Less Than $500 94 2 2.1%
$500 to $750 0 0 0%
$751 to $1,000 0 0 0%
$1,001 to $1,250 0 0 0%
$1,251 to $1,500 0 0 0%
Above $1,500 0 0 0%
Missing 16 8 50%
Total 110 10 9.1%

Volume III: City Profiles Alliance city
N E B R A S K A I N V E S T M E N T F I N A N C E A U T H O R I T Y
Nebraska Profile III.1.68 Final Report: March 26, 2021
Respondents were asked if utilities are included in the rent and as shown in Table III.1.71; 1
respondents, or 25 percent, included some sort of utility in the rent.
Table III.1.71 Are there any utilities included with
the rent? Alliance city
2020 Survey of Rental Properties
Period Respondent
Yes 1
No 3
% Offering Utilities 25%
The type of utility included in the rent is shown in Table III.1.72. There were 0 respondents who
included electricity, 0 respondents who included natural gas, 1 respondents who included water and
sewer and 1 respondents included trash collection in the rent.
Table III.1.72 Which utilities are included with the rent?
Alliance city 2020 Survey of Rental Properties
Type of Utility Provided Respondent
Electricity 0
Natural Gas 0
Water/Sewer 1
Trash Collection 1

Volume III: City Profiles Alliance city
N E B R A S K A I N V E S T M E N T F I N A N C E A U T H O R I T Y
Nebraska Profile III.1.69 Final Report: March 26, 2021
Table III.1.73 shows the number of survey respondents who
keep a waiting list. 1 respondents said they keep a waitlist,
with an estimated 0 number of persons on the waiting list.
Respondents were also asked how they would rate the need
for renovating existing units. As shown in Table III.1.74, 1
respondents said there was no need for renovating single-
family units, with 1 respondents saying there was extreme
need for renovating single-family units. Likewise, 1
respondents indicated no need for renovating existing apartment units, with 1 respondents saying
there was extreme need for renovating existing apartment units.
Table III.1.74 How would you rate the need for renovation of existing units in the city?
Alliance city 2020 Survey of Rental Properties
Need Single-Family Apartments Mobile Homes Other Units
No Need 1 1 1 1
Low Need 0 0 0 0
Moderate Need 0 0 0 0
High Need 1 1 2 2
Extreme Need 1 1 0 0
Respondents were also asked how they would rate the need for constructing new units. As shown in
Table III.1.75, 1 respondents said there was no need for new single-family units, with 0 respondents
saying there was extreme need for constructing new single-family units. Likewise, 1 respondents
indicated no need for new apartment units, with 0 respondents saying there was extreme need for
constructing new apartment units.
Table III.1.75 How would you rate the need for construction of new units in the city?
Alliance city 2020 Survey of Rental Properties
Need Single-Family Apartments Mobile Homes Other Units
No Need 1 1 1 1
Low Need 0 0 0 0
Moderate Need 1 1 0 0
High Need 1 1 0 0
Extreme Need 0 0 0 0
Table III.1.73 Do you keep a waiting list?
Alliance city 2020 Survey of Rental Properties
Period Respondent
Yes 1
No 3
Waitlist Size 0
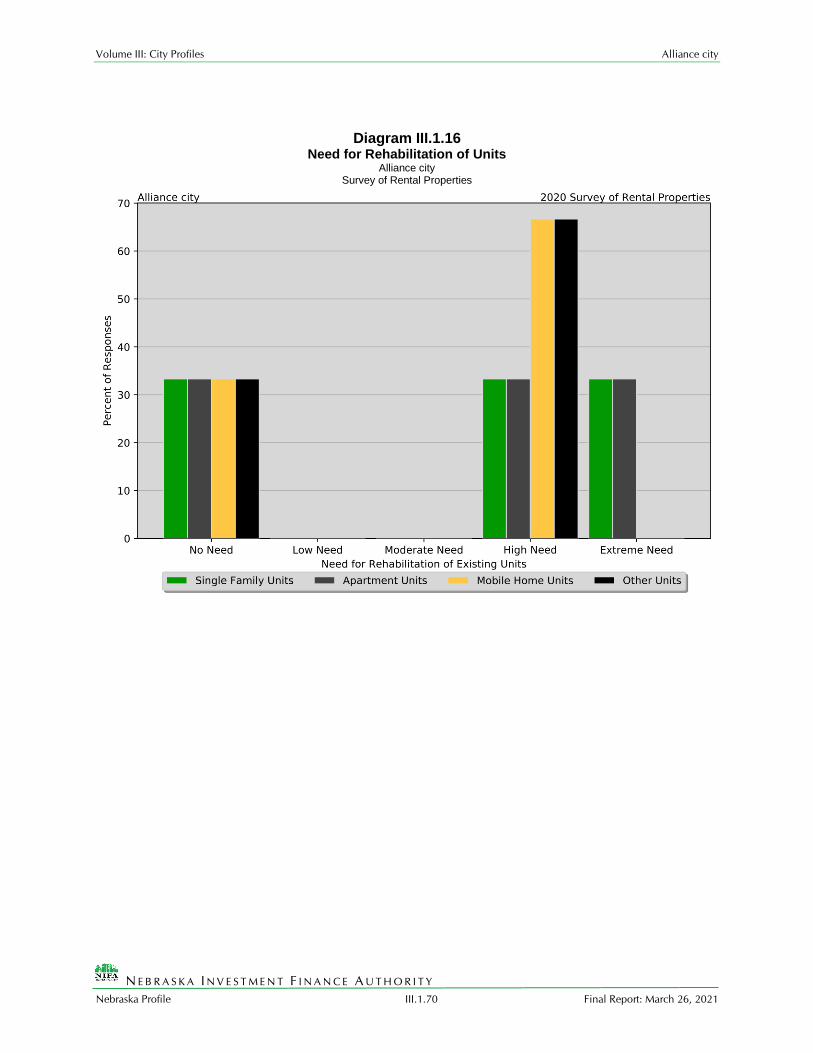
Volume III: City Profiles Alliance city
N E B R A S K A I N V E S T M E N T F I N A N C E A U T H O R I T Y
Nebraska Profile III.1.70 Final Report: March 26, 2021
Diagram III.1.16 Need for Rehabilitation of Units
Alliance city Survey of Rental Properties

Volume III: City Profiles Alliance city
N E B R A S K A I N V E S T M E N T F I N A N C E A U T H O R I T Y
Nebraska Profile III.1.71 Final Report: March 26, 2021
Diagram III.1.17
Need for Construction of Additional Units Alliance city
Survey of Rental Properties