allen county coroner'sallen county coroner's office - 2015 statistical summary manner of...
TRANSCRIPT

ALLEN COUNTY CORONER'S
Dr. Craig Nelson, DDS
Indiana
Coroner - Allen County
ANNUAL SUMMARY
2015

TOTAL NUMBER OF DEATHS IN ALLEN COUNTY 2015 4340
603 13.89%
242 40.1%
totals
NATURAL 182 199
ACCIDENT, (non-Motor Vehicle) 151 220
ACCIDENT, MOTOR VEHICLE 31 81
SUICIDE 44 62
HOMICIDE 30 34
UNDETERMINED 7 7
PENDING 0 0
Returned to be Signed by PHY 0
TOTALS 445
17
0
0
69
50
18
4
ALLEN COUNTY CORONER
2015 STATISTICAL SUMMARY Dr. C. Nelson, DDS - Coroner
Cases transferred from
other Counties who died
in Allen
Allen County (non-
transferred) cases
Manner of Death
determination
TOTAL NUMBER OF CASES INVESTIGATED BY THE CORONER'S OFFICE
TOTAL NUMBER OF CORONER CASES WHICH REQUIRED AUTOPSIES
158 603
73.80%
26.20%
TOTAL PERCENT OF CORONER'S CASE LOAD GENERATED IN ALLEN COUNTY =
TOTAL PERCENT OF CASES TRANSFERRED IN FROM OTHER COUNTIES =
Allen County Coroner's Office 10/21/2016

Allen County Coroner's Office 10/21/2016

female male female male female male female male female male female male female male female male female male female male
NATURAL 2 3 0 1 2 3 4 10 10 16 14 38 16 31 8 9 5 7 1 2 182 30.2%
Natural - Transfers 0 2 0 0 2 0 0 2 2 1 0 2 0 1 1 3 1 0 0 0 17 2.8%
ACCIDENT 0 3 0 0 3 12 6 16 7 13 5 9 6 10 8 7 10 12 16 8 151 25.0%
Accident - Transfers 0 0 0 2 1 2 1 1 0 3 2 3 1 8 7 11 11 10 5 1 69 11.4%
MOTOR VEHICLE ACCIDENT 1 1 1 2 1 8 0 2 0 3 1 3 2 1 0 3 1 1 0 0 31 5.1%
Motor Vehicle Acc -Transfers 2 0 2 2 2 4 1 7 2 0 1 11 2 3 1 5 1 4 0 0 50 8.3%
SUICIDE 0 0 0 2 2 5 2 7 3 3 2 4 1 6 1 2 0 2 0 2 44 7.3%
Suicide - Transfers 0 0 0 1 1 3 2 2 2 2 0 2 2 0 0 0 0 1 0 0 18 3.0%
HOMICIDE 1 0 2 2 4 10 1 5 0 4 0 0 0 1 0 0 0 0 0 0 30 5.0%
Homicide - Transfers 2 0 0 0 0 1 0 0 0 1 0 0 0 0 0 0 0 0 0 0 4 0.7%0
UNDETERMINED 1 2 1 0 1 0 0 0 0 1 0 1 0 0 0 0 0 0 0 0 7 1.2%
Undetermined - Transfers 0 0 0 0 0 0 0 0 0 0 0 0 0 0 0 0 0 0 0 0 0 0.0%
PENDING 0 0 0 0 0 0 0 0 0 0 0 0 0 0 0 0 0 0 0 0 0 0.0%
Pending - Transfers 0 0 0 0 0 0 0 0 0 0 0 0 0 0 0 0 0 0 0 0 0 0.0%
Returned to Physician 0 0 0 0 0 0 0 0 0 0 0 0 0 0 0 0 0 0 0 0 0 0.0%
Returned - Transfers 0 0 0 0 0 0 0 0 0 0 0 0 0 0 0 0 0 0 0 0 0
gender per age group (includes transfers): 9 11 6 12 19 48 17 52 26 47 25 73 30 61 26 40 29 37 22 13 603 100.0%
totals per age group, (includes transfers) 603 73.8%
percent of total case load (includes transfers): 100.00% 26.2%5.8%3.0% 11.1% 11.4% 12.1% 16.3% 15.1% 10.9%
60>69 70>79
6620
Allen County Coroner's Office - 2015 Statistical Summary
Manner of Death v/s Age & Gender Distribution Analysis
Totals and percentages of entire annual case load
Gender / Age Grouping
% o
F T
otal
Cas
e Lo
ad
Tot
al C
ases
/
Man
ner
30>39
67 69 3573 98 91 66
3.3%
80>89 90 +
18
0>12 13>19 20>29
10.9%
40>49 50>59

# % # % # % # % # % # % TOTALS
NATURAL 147 24.4% 26 4.3% 6 1.0% 3 0.5% 0 0.0% 0 0.0% 182
Natural - Transfers 16 2.7% 1 0.2% 0 0.0% 0 0.0% 0 0.0% 0 0.0% 17
ACCIDENT 137 22.7% 13 2.2% 1 0.2% 0 0.0% 0 0.0% 0 0.0% 151
Accident - Transfers 69 11.4% 0 0.0% 0 0.0% 0 0.0% 0 0.0% 0 0.0% 69
MOTOR VEHICLE ACCIDENT 26 4.3% 3 0.5% 1 0.2% 1 0.2% 0 0.0% 0 0.0% 31
Motor Vehicle Acc -Transfers 45 7.5% 3 0.5% 1 0.2% 1 0.2% 0 0.0% 0 0.0% 50
SUICIDE 38 6.3% 2 0.3% 4 0.7% 0 0.0% 0 0.0% 0 0.0% 44
Suicide - Transfers 17 2.8% 0 0.0% 1 0.2% 0 0.0% 0 0.0% 0 0.0% 18
HOMICIDE 8 1.3% 18 3.0% 2 0.3% 2 0.3% 0 0.0% 0 0.0% 30
Homicide - Transfers 4 0.7% 0 0.0% 0 0.0% 0 0.0% 0 0.0% 0 0.0% 4
UNDETERMINED 3 0.5% 4 0.7% 0 0.0% 0 0.0% 0 0.0% 0 0.0% 7
Undetermined - Transfers 0 0.0% 0 0.0% 0 0.0% 0 0.0% 0 0.0% 0 0.0% 0
PENDING 0 0.0% 0 0.0% 0 0.0% 0 0.0% 0 0.0% 0 0.0% 0
Pending - Transfers 0 0.0% 0 0.0% 0 0.0% 0 0.0% 0 0.0% 0 0.0% 0
Returned to Physician 0 0.0% 0 0.0% 0 0.0% 0 0.0% 0 0.0% 0 0.0% 0
Returned to Physician - Transfers 0 0.0% 0 0.0% 0 0.0% 0 0.0% 0 0.0% 0 0.0% 0
TOTALS 510 84.6% 70 11.6% 16 2.7% 7 1.2% 0 0.0% 0 0.0% 603
Allen County Coroner's Office - 2015 Statistical Summary
Manner of Death v/s Race Distribution Analysis
Totals and percentages of entire annual case load
ASIAN OTHER UNKNOWNWHITE BLACK HISPANIC

# % # % # % # % # % # % # % # % # % # % # % # % TOTAL
NATURAL 21 3.5% 11 1.8% 15 2.5% 21 3.5% 19 3.2% 17 2.8% 14 2.3% 7 1.2% 14 2.3% 11 1.8% 15 2.5% 17 2.8% 182
Natural - Transfers 4 0.7% 3 0.5% 1 0.2% 2 0.3% 1 0.2% 0 0.0% 0 0.0% 1 0.2% 2 0.3% 2 0.3% 0 0.0% 1 0.2% 17
ACCIDENT 14 2.3% 8 1.3% 10 1.7% 13 2.2% 11 1.8% 13 2.2% 13 2.2% 17 2.8% 10 1.7% 13 2.2% 15 2.5% 14 2.3% 151
Accident - Transfers 5 0.8% 3 0.5% 1 0.2% 8 1.3% 9 1.5% 4 0.7% 4 0.7% 12 2.0% 8 1.3% 6 1.0% 4 0.7% 5 0.8% 69
Motor Vehicle Acc 0 0.0% 2 0.3% 4 0.7% 2 2.0% 5 0.8% 3 0.5% 2 0.3% 1 0.2% 5 0.8% 1 0.2% 2 0.3% 4 0.7% 31
Motor Vehicle Acc -Transfers 3 0.5% 1 0.2% 2 0.3% 2 0.3% 7 1.2% 5 0.8% 6 1.0% 7 1.2% 5 0.8% 5 0.8% 4 0.7% 3 0.5% 50
SUICIDE 3 0.5% 2 0.3% 2 0.3% 7 1.2% 4 0.7% 2 0.3% 3 0.5% 2 0.3% 6 1.0% 4 0.7% 7 1.2% 2 0.3% 44
Suicide - Transfers 3 0.5% 2 0.3% 3 0.5% 1 0.2% 1 0.2% 0 0.0% 1 0.2% 1 0.2% 1 0.2% 0 0.0% 4 0.7% 1 0.2% 18
HOMICIDE 2 0.3% 2 0.3% 6 1.0% 2 0.3% 1 0.2% 2 0.3% 1 0.2% 4 0.7% 1 0.2% 6 1.0% 2 0.3% 1 0.2% 30
Homicide - Transfers 1 0.2% 1 0.2% 0 0.0% 0 0.0% 0 0.0% 0 0.0% 1 0.2% 0 0.0% 1 0.2% 0 0.0% 0 0.0% 0 0.0% 4
UNDETERMINED 0 0.0% 1 0.2% 0 0.0% 1 0.2% 1 0.2% 0 0.0% 0 0.0% 1 0.2% 0 0.0% 0 0.0% 1 0.2% 2 0.3% 7
Undetermined - Transfers 0 0.0% 0 0.0% 0 0.0% 0 0.0% 0 0.0% 0 0.0% 0 0.0% 0 0.0% 0 0.0% 0 0.0% 0 0.0% 0 0.0% 0
PENDING 0 0.0% 0 0.0% 0 0.0% 0 0.0% 0 0.0% 0 0.0% 0 0.0% 0 0.0% 0 0.0% 0 0.0% 0 0.0% 0 0.0% 0
Pending - Transfers 0 0.0% 0 0.0% 0 0.0% 0 0.0% 0 0.0% 0 0.0% 0 0.0% 0 0.0% 0 0.0% 0 0.0% 0 0.0% 0 0.0% 0
RETURN TO PHYSICIAN 0 0.0% 0 0.0% 0 0.0% 0 0.0% 0 0.0% 0 0.0% 0 0.0% 0 0.0% 0 0.0% 0 0.0% 0 0.0% 0 0.0% 0
Returned to Physician - Transfr 0 0.0% 0 0.0% 0 0.0% 0 0.0% 0 0.0% 0 0.0% 0 0.0% 0 0.0% 0 0.0% 0 0.0% 0 0.0% 0 0.0% 0
TOTALS 56 9.3% 36 6.0% 44 7.3% 59 9.8% 59 9.8% 46 7.6% 45 7.5% 53 8.8% 53 8.8% 48 8.0% 54 9.0% 50 8.3% 603
.
Allen County Coroner's Office - 2015 Statistical Summary
Manner of Death v/s Month of Death Analysis
Totals and percentages of entire annual caseload
JAN FEB MAR APR NOV DECJUL AUG SEPT OCTMAY JUN

female male female male female male female male female male female male female male female male female male female male
NATURAL 2 3 0 1 2 3 4 10 10 16 14 38 16 31 8 9 5 7 1 2 182
Natural - Transfers 0 2 0 0 2 0 0 2 2 1 0 2 0 1 1 3 1 0 0 0 17
gender per age group (includes transfers): 2 5 0 1 4 3 4 12 12 17 14 40 16 32 9 12 6 7 1 0 199
totals per age group, (includes transfers)
percent of Natural deaths (includes transfers): 100.0%
ACCIDENT 0 3 0 0 3 12 6 16 7 13 5 9 6 10 8 7 10 12 16 8 151
Accident - Transfers 0 0 0 2 1 2 1 1 0 3 2 3 1 8 7 11 11 10 5 1 69
gender per age group (includes transfers): 0 3 0 2 4 14 7 17 7 16 7 12 7 18 15 18 21 22 21 0 220
totals per age group, (includes transfers)
percent of Accidental deaths (includes transfers): 100.0%
MOTOR VEHICLE ACCIDENT 1 1 1 2 1 8 0 2 0 3 1 4 2 1 0 2 0 2 0 0 31
Motor Vehicle Acc - Transfers 2 0 2 2 2 4 1 7 2 0 1 11 2 3 1 5 1 4 0 0 50
gender per age group (includes transfers): 3 1 3 4 3 12 1 9 2 3 2 15 4 4 1 7 1 6 0 0 81
totals per age group, (includes transfers)
percent of MVA deaths (includes transfers): 100.0%
SUICIDE 0 0 0 2 2 5 2 7 3 3 2 4 1 6 1 2 0 2 0 2 44
Suicide - Transfers 0 0 0 1 1 3 2 2 2 2 0 2 2 0 0 0 0 1 0 0 18
gender per age group (includes transfers): 0 0 0 3 3 8 4 9 5 5 2 6 3 6 1 0 0 3 0 0 62
totals per age group, (includes transfers)
percent of Suicide deaths (includes transfers): 100.0%
HOMICIDE 1 0 2 2 4 10 1 5 0 4 0 0 0 1 0 0 0 0 0 0 30
Homicide - Transfers 2 0 0 0 0 1 0 0 0 1 0 0 0 0 0 0 0 0 0 0 4
gender per age group (includes transfers): 3 0 2 2 4 11 1 5 0 5 0 0 0 1 0 0 0 0 0 0 34
totals per age group, (includes transfers)
percent of Homicide deaths (includes transfers): 100.0%
UNDETERMINED 1 2 1 0 1 0 0 0 0 1 0 1 0 0 0 0 0 0 0 0 7
Undetermined - Transfers 0 0 0 0 0 0 0 0 0 0 0 0 0 0 0 0 0 0 0 0 0
gender per age group (includes transfers): 1 2 1 0 1 0 0 0 0 1 0 1 0 0 0 0 0 0 0 0 7
totals per age group, (includes transfers)
percent of Homicide deaths (includes transfers): 100.0%42.9% 14.3% 14.3% 0.0% 14.3% 14.3% 0.0% 0.0%
0 0
0.0% 0.0%
1 0 03 1 1 0 1
7
4 7 10
0.5% 3.5% 8.0%
Allen County Coroner's Office - 2015 Statistical Summary
Manner of Death v/s Age & Gender Distribution Analysis
Totals and percentages by Manner of Death onlyGender / Age Grouping
50>590>12 13>19 40>49
Tot
al C
ases
/
Man
ner30>39
15
60>69 70>79
5 17
15.0% 19.5%
20>29
9.5%
80>89 90 +
3.5%
43 21
1.4% 0.9% 8.2% 10.9%
0.5%
1 7 16 29 54 48 121 13
27.1% 24.1% 10.6% 6.5%14.6%
3 2 18 24 33
8 8
23 19 25
7
10.5% 8.6% 11.4%
0
4.9% 8.6% 18.5% 12.3% 6.2% 21.0% 9.9% 9.9% 8.6% 0.0%
0 3 11 13 10 8 9 1 3 0
0.0% 4.8% 17.7% 21.0% 16.1% 12.9% 4.8% 0.0%
3 4 15 6 5 0
14.7% 0.0% 2.9% 0.0%
14.5% 1.6%
0 0
8.8% 11.8% 44.1% 17.6% 0.0% 0.0%
1 0

# % # % # % # % # % # %
NATURAL 147 73.9% 26 13.1% 6 3.0% 3 1.5% 0 0.0% 0 0.0% 182 91.5%
Natural - Transfers 16 8.0% 1 0.5% 0 0.0% 0 0.0% 0 0.0% 0 0.0% 17 8.5%
sub totals 163 81.9% 27 13.6% 6 3.0% 3 1.5% 0 0.0% 0 0.0% 199 100.0%
ACCIDENT 137 62.3% 13 5.9% 1 0.5% 0 0.0% 0 0.0% 0 0.0% 151 68.6%
Accident - Transfers 69 31.4% 0 0.0% 0 0.0% 0 0.0% 0 0.0% 0 0.0% 69 31.4%
sub totals 206 93.6% 13 5.9% 1 0.5% 0 0.0% 0 0.0% 0 0.0% 220 100.0%
MOTOR VEHICLE ACCIDENT 26 32.1% 3 3.7% 1 1.2% 1 1.2% 0 0.0% 0 0.0% 31 38.3%
Motor Vehicle Acc -Transfers 45 55.6% 3 3.7% 1 1.2% 1 1.2% 0 0.0% 0 0.0% 50 61.7%
sub totals 71 87.7% 6 7.4% 2 2.5% 2 2.5% 0 0.0% 0 0.0% 81 100.0%
SUICIDE 38 61.3% 2 3.2% 4 6.5% 0 0.0% 0 0.0% 0 0.0% 44 71.0%
Suicide - Transfers 17 27.4% 0 0.0% 1 1.6% 0 0.0% 0 0.0% 0 0.0% 18 29.0%
sub totals 55 88.7% 2 3.2% 5 8.1% 0 0.0% 0 0.0% 0 0.0% 62 100.0%
HOMICIDE 8 0.0% 18 52.9% 2 5.9% 2 0.0% 0 0.0% 0 0.0% 30 88.2%
Homicide - Transfers 4 11.8% 0 0.0% 0 0.0% 0 0.0% 0 0 0 0.0% 4 11.8%
sub totals 12 35.3% 18 52.9% 2 5.9% 0 0.0% 0 0 0 0.0% 34 100.0%
Undetermined 3 42.9% 4 57.1% 0 0.0% 0 0.0% 0 0.0% 0 0.0% 7 100.0%
Undetermined - Transfers 0 0.0% 0 0.0% 0 0.0% 0 0.0% 0 0% 0 0.0% 0 0.0%
sub totals 3 42.9% 4 57.1% 0 0.0% 0 0.0% 0 0 0 0.0% 7 100.0%
HISPANIC Manner of Death
Totals
Allen County Coroner's Office - 2015 Statistical Summary
Manner of Death v/s Race Distribution Analysis
Totals and percentages by Manner of Death only
ASIAN OTHER UNKNOWNWHITE BLACK

# % # % # % # % # % # % # % # % # % # % # % # % TOTAL
NATURAL 21 10.6% 11 5.5% 15 7.5% 21 10.6% 19 9.5% 17 8.5% 14 7.0% 7 3.5% 14 0.9% 11 5.5% 15 7.5% 17 8.5% 182
Natural - Transfers 4 2.0% 3 1.5% 1 0.5% 2 1.0% 1 0.5% 0 0.0% 0 0.0% 1 0.5% 2 0.1% 2 1.0% 0 0.0% 1 0.5% 17
25 12.6% 14 7.0% 16 8.0% 23 11.6% 20 10.1% 17 8.5% 14 7.0% 8 4.0% 16 8.0% 13 6.5% 15 7.5% 18 9.0% 199
ACCIDENT 14 6.4% 8 3.6% 10 4.5% 13 0.0% 11 5.0% 13 5.9% 13 5.9% 17 7.7% 10 0.6% 13 5.9% 15 6.8% 14 6.4% 151
Accident - Transfers 5 2.3% 3 1.4% 1 0.5% 8 3.6% 9 4.1% 4 1.8% 4 1.8% 12 5.5% 8 0.5% 6 2.7% 4 1.8% 5 2.3% 69
19 8.6% 11 5.0% 11 5.0% 21 9.5% 20 9.1% 17 7.7% 17 7.7% 29 13.2% 18 8.2% 19 8.6% 19 8.6% 0 0.0% 220
MOTOR VEHICLE CRASH 0 0.0% 2 2.5% 4 4.9% 2 2.5% 5 6.2% 3 12.0% 2 2.5% 1 1.2% 5 0.3% 1 1.2% 2 2.5% 4 4.9% 31
MVC - Transfers 3 3.7% 1 1.2% 2 2.5% 2 2.5% 7 8.6% 5 6.2% 6 7.4% 7 8.6% 5 0.3% 5 6.2% 4 4.9% 3 3.7% 50
3 3.7% 3 3.7% 6 7.4% 4 4.9% 12 14.8% 8 9.9% 8 9.9% 0 0.0% 10 12.3% 0 0.0% 6 7.4% 7 8.6% 81
SUICIDE 3 4.8% 2 3.2% 2 3.2% 7 11.3% 4 6.5% 2 3.2% 3 4.8% 2 3.2% 6 0.4% 4 6.5% 7 11.3% 2 3.2% 44
Suicide - Transfers 3 4.8% 2 3.2% 3 4.8% 1 1.6% 1 1.6% 0 0.0% 1 1.6% 1 1.6% 1 0.1% 0 0.0% 4 6.5% 1 1.6% 18
6 9.7% 4 6.5% 5 8.1% 8 12.9% 5 8.1% 2 3.2% 4 6.5% 3 4.8% 7 11.3% 0 0.0% 11 17.7% 0 0.0% 62
HOMICIDE 2 5.9% 2 5.9% 6 17.6% 2 5.9% 1 2.9% 2 5.9% 1 2.9% 4 11.8% 1 0.1% 6 17.6% 2 5.9% 1 2.9% 30
Homicide - Transfers 1 2.9% 1 2.9% 0 0.0% 0 0.0% 0 0.0% 0 0.0% 1 2.9% 0 0.0% 1 0.1% 0 0.0% 0 0.0% 0 0.0% 4
3 8.8% 3 8.8% 6 17.6% 2 5.9% 1 2.9% 2 5.9% 2 5.9% 4 11.8% 2 5.9% 6 17.6% 2 5.9% 1 2.9% 34
Undetermined 0 0.0% 1 14.3% 0 0.0% 1 14.3% 1 14.3% 0 0.0% 0 0.0% 1 14.3% 0 0.0% 0 0.0% 1 14.3% 2 28.6% 7
Undetermined - Transfers 0 0.0% 0 0.0% 0 0.0% 0 0.0% 0 0.0% 0 0.0% 0 0.0% 0 0.0% 0 0.0% 0 0.0% 0 0.0% 0 0.0% 0
0 0.0% 1 14.3% 0 0.0% 1 14.3% 1 14.3% 0 0.0% 0 0.0% 1 14.3% 0 0.0% 0 0.0% 1 14.3% 2 28.6% 7
Allen County Coroner's Office - 2015 Statistical Summary
Manner of Death v/s Month of Death Analysis
Totals and percentages by Manner of Death only
JAN FEB MAR APR NOV DECJUL AUG SEPT OCTMAY JUN

MANNER of DEATH CAUSE GROUPING FEMALE MALE
ACCIDENT ALZHEIMER'S 5 3 2
ANOXIA 2 0 2
ASPHYXIA / CARBON MONOXIDE 1 0 1
ASPHYXIA / DROWNING 3 0 3
ASPHYXIA / HANGING 1 0 1
ASPHYXIA / POSITIONAL 2 0 2
ASPHYXIA / SMOKE INHALATION 1 1 0
ASPYXIA / ASPIRATION 1 0 1
BLUNT FORCE INJURY 2 0 2
CARBON MONOXIDE POISONING 1 0 1
CARDIAC DISEASE 10 7 3
DEMENTIA 4 4 0
DRUG / ALCOHOL 61 19 42
FAILURE TO THRIVE 5 4 1
HEMORRHAGIC SHOCK 1 1 0
INTRACRANIAL HEMORRHAGE 20 7 13
MULTI-SYSTEM FAILURE 3 2 1
PARKINSON'S 1 1 0
PNEUMONIA 1 0 1
PULMONARY EMBOLISM 1 1 0
RENAL DISEASE 1 0 1
RESPIRATORY DISEASE 15 8 7
SEPSIS 3 1 2
SUBDURAL HEMATOMA 6 2 4
ACCIDENT / MVC ASPHYXIA 1 0 1
BLUNT FORCE INJURY 29 6 23
RESPIRATORY DISEASE 1 0 1
HOMICIDE ASPHYXIA / STRANGULATION 1 1 0
BLUNT FORCE INJURY 3 0 3
EXSANGUINATION 1 0 1
GUNSHOT WOUND(S) 23 7 16
SHARP FORCE INJURY 2 0 2
NATURAL ABSCESS 1 1 0
ANOREXIA 1 1 0
BRAIN DISORDER 1 1 0
CANCER 2 2 0
CARDIAC DISEASE 121 33 88
DIABETES 4 2 2
DRUG / ALCOHOL 5 3 2
EXSANGUINATION 1 1 0
GASTROINESTINAL HEMORRHAGE 2 0 2
GRAVES DISEASE 1 0 1
2015 Cause of Death SummaryAllen County Coroner's Office
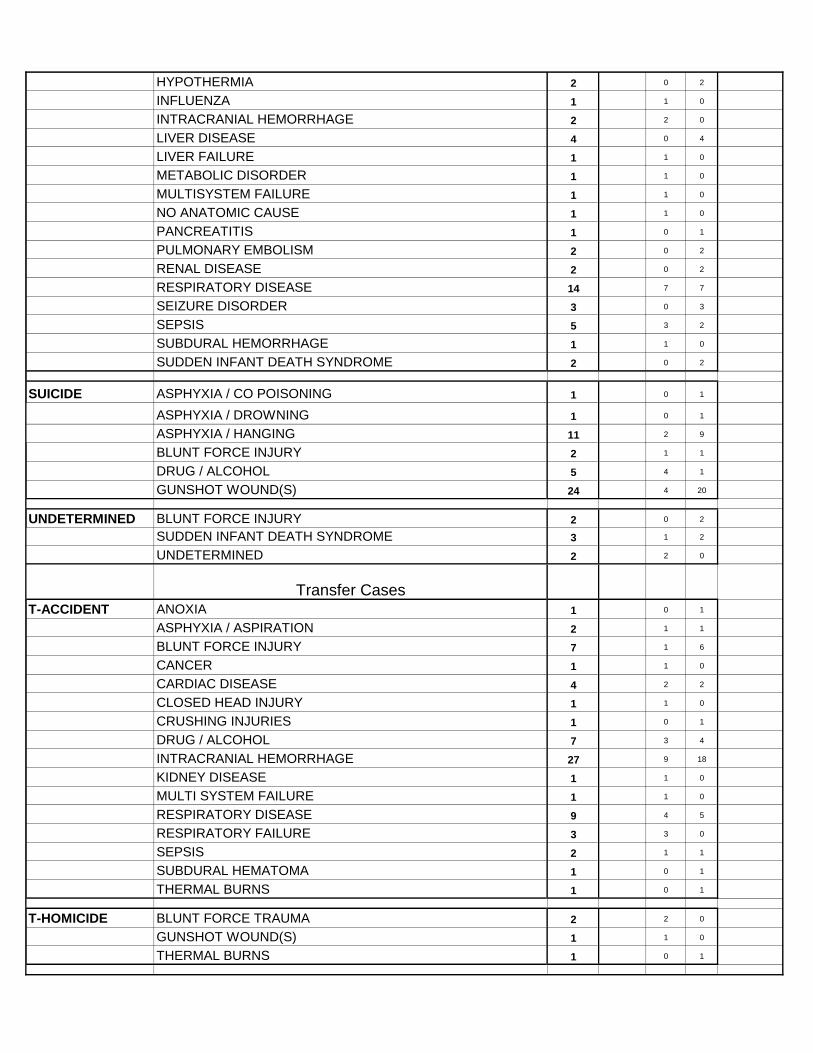
HYPOTHERMIA 2 0 2
INFLUENZA 1 1 0
INTRACRANIAL HEMORRHAGE 2 2 0
LIVER DISEASE 4 0 4
LIVER FAILURE 1 1 0
METABOLIC DISORDER 1 1 0
MULTISYSTEM FAILURE 1 1 0
NO ANATOMIC CAUSE 1 1 0
PANCREATITIS 1 0 1
PULMONARY EMBOLISM 2 0 2
RENAL DISEASE 2 0 2
RESPIRATORY DISEASE 14 7 7
SEIZURE DISORDER 3 0 3
SEPSIS 5 3 2
SUBDURAL HEMORRHAGE 1 1 0
SUDDEN INFANT DEATH SYNDROME 2 0 2
SUICIDE ASPHYXIA / CO POISONING 1 0 1
ASPHYXIA / DROWNING 1 0 1
ASPHYXIA / HANGING 11 2 9
BLUNT FORCE INJURY 2 1 1
DRUG / ALCOHOL 5 4 1
GUNSHOT WOUND(S) 24 4 20
UNDETERMINED BLUNT FORCE INJURY 2 0 2
SUDDEN INFANT DEATH SYNDROME 3 1 2
UNDETERMINED 2 2 0
Transfer CasesT-ACCIDENT ANOXIA 1 0 1
ASPHYXIA / ASPIRATION 2 1 1
BLUNT FORCE INJURY 7 1 6
CANCER 1 1 0
CARDIAC DISEASE 4 2 2
CLOSED HEAD INJURY 1 1 0
CRUSHING INJURIES 1 0 1
DRUG / ALCOHOL 7 3 4
INTRACRANIAL HEMORRHAGE 27 9 18
KIDNEY DISEASE 1 1 0
MULTI SYSTEM FAILURE 1 1 0
RESPIRATORY DISEASE 9 4 5
RESPIRATORY FAILURE 3 3 0
SEPSIS 2 1 1
SUBDURAL HEMATOMA 1 0 1
THERMAL BURNS 1 0 1
T-HOMICIDE BLUNT FORCE TRAUMA 2 2 0
GUNSHOT WOUND(S) 1 1 0
THERMAL BURNS 1 0 1

T-MVC/ACCIDENT BLUNT FORCE INJURY 43 14 29
INTRACRANIAL HEMORRHAGE 2 0 2
MULTI SYSTEM FAILURE 1 0 1
PULMONARY EMBOLISM 1 0 1
RESPIRATORY DISEASE 3 0 3
T-NATURAL BOWEL DISEASE 1 1 0
CARDIAC DISEASE 7 2 5
DIABETES 1 0 1
INTRACRANIAL HEMORRHAGE 1 0 1
MALIGNANT NEUROLEPTIC SYNDROME 1 1 0
MULTI SYSTEM FAILURE 1 1 0
PANCREATIC APOPLEXY 1 0 1
RENAL FAILURE 1 0 1
RESPIRATORY DISEASE 2 1 1
SEPSIS 1 0 1
T-SUICIDE ASPHYXIA / HANGING 2 1 1
BLUNT FORCE TRAUMA 1 0 1
DRUGS / ALCOHOL 3 1 2
GUNSHOT WOUND 10 5 5
MULTISYSTEM FAILURE 1 0 1
RESPIRATORY DISEASE 1 0 1
TOTALS 603 209 394

81
Operator % of MVC's Passenger % of MVC's Pedestrian % of MVC's
not noted or
unknown % of MVC's
total MVA's
represented % of MVC's
MOTOR VEHICLE ACCIDENT 24 29.6% 4 4.9% 3 3.7% 0 0.0% 31 38.3%
Motor Vehicle Accident - Transfer 31 38.3% 13 16.0% 3 3.7% 3 3.7% 50 61.7%
55 67.9% 17 21.0% 6 0.0% 3 3.7% 81 100.0%
Multiple Vehicle% of MVC's
Single Vehicle% of MVC's Motorcycle Inv. % of MVC's
Pedestrian Inv.% of MVC's
not noted or
unknown % of MVC's
MOTOR VEHICLE ACCIDENT 18 22.2% 10 12.3% 4 4.9% 3 3.7% 0 0.0%
Motor Vehicle Accident - Transfer 33 40.7% 11 13.6% 10 12.3% 2 2.5% 2 2.5%
51 63.0% 21 25.9% 14 17.3% 5 6.2% 2 2.5%
Harness / belt
/helmet % of MVC's
no restraint
used % of MVC's
not noted or
unknown % of MVC's
Pedestrian or not
needed
MOTOR VEHICLE ACCIDENT 11 13.6% 8 9.9% 9 11.1% 3 3.7%
Motor Vehicle Accident - Transfer 18 22.2% 19 23.5% 9 11.1% 4 4.9%
29 35.8% 27 33.3% 18 22.2% 7 8.6%
Ind State Police% of MVC's
Allen County
Sh. % of MVC'sFort Wayne PD
% of MVC'sNew Haven PD
% of MVC's
Other (Ind &
Ohio) % of MVC's unknown % of MVC's
MOTOR VEHICLE ACCIDENT 1 1.2% 15 18.5% 14 17.3% 0 0.0% 1 1.2% 0 0.0%
Motor Vehicle Accident - Transfer 5 6.2% 0 0.0% 0 0.0% 0 0.0% 43 53.1% 2 2.5%
6 7.4% 15 18.5% 14 17.3% 0 0.0% 44 54.3% 2 2.5%
Alcohol test
positive % of MVC's
Alcohol test
negative % of MVC's
Test positive for
drugs % of MVC's
No Test given or result
not noted % of MVC's unknown if tested % of MVC's
MOTOR VEHICLE ACCIDENT 9 11.1% 10 12.3% 8 9.9% 9 11.1% 0 0.0%
Motor Vehicle Accident - Transfer 5 6.2% 23 28.4% 18 22.2% 21 25.9% 0 0.0%
14 17.3% 33 40.7% 26 32.1% 30 37.0% 0 0.0%
8
Motorized Vehicle Crash Statistics (MVC's)
Allen County Coroner's Office - 2015 Statistical Summary
MVC's by Primary Investigating Agency
MVC's by Alcohol and/or Drug test results
Total MVC's, including transfers, represented =
MVC's / utilization of safety devices
MVC's by location or position of the deceased Total MVC's
MVC's by accident classification
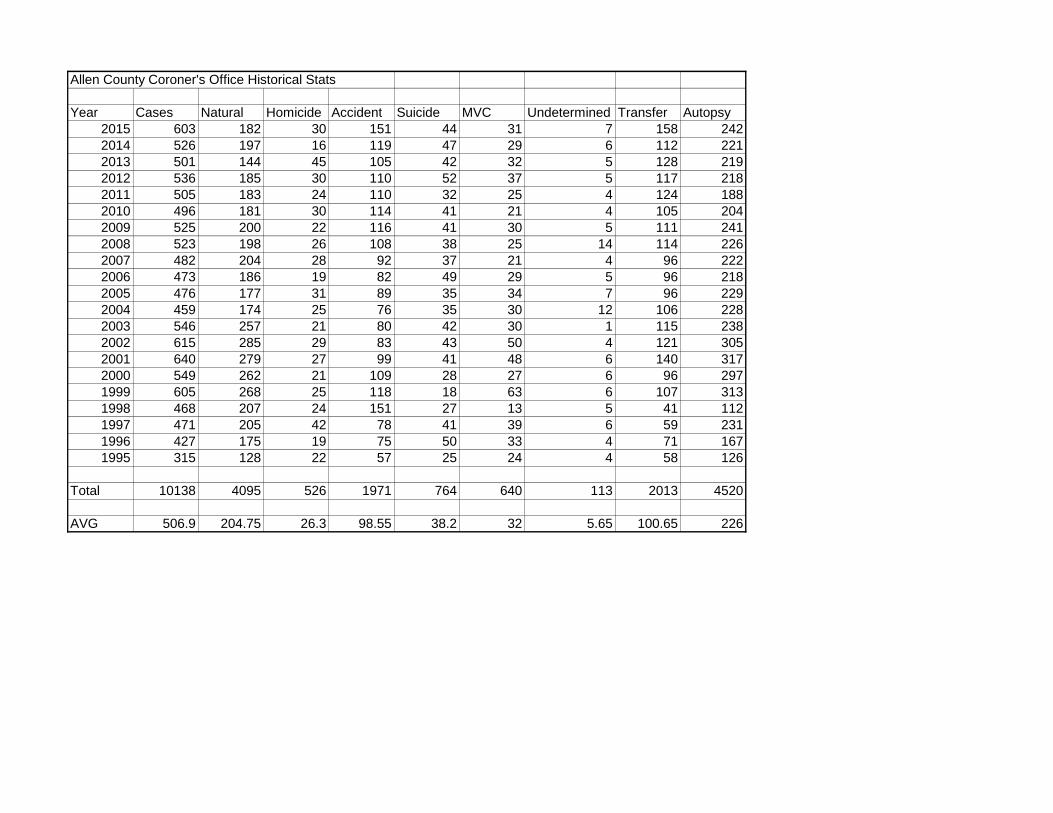
Allen County Coroner's Office Historical Stats
Year Cases Natural Homicide Accident Suicide MVC Undetermined Transfer Autopsy
2015 603 182 30 151 44 31 7 158 242
2014 526 197 16 119 47 29 6 112 221
2013 501 144 45 105 42 32 5 128 219
2012 536 185 30 110 52 37 5 117 218
2011 505 183 24 110 32 25 4 124 188
2010 496 181 30 114 41 21 4 105 204
2009 525 200 22 116 41 30 5 111 241
2008 523 198 26 108 38 25 14 114 226
2007 482 204 28 92 37 21 4 96 222
2006 473 186 19 82 49 29 5 96 218
2005 476 177 31 89 35 34 7 96 229
2004 459 174 25 76 35 30 12 106 228
2003 546 257 21 80 42 30 1 115 238
2002 615 285 29 83 43 50 4 121 305
2001 640 279 27 99 41 48 6 140 317
2000 549 262 21 109 28 27 6 96 297
1999 605 268 25 118 18 63 6 107 313
1998 468 207 24 151 27 13 5 41 112
1997 471 205 42 78 41 39 6 59 231
1996 427 175 19 75 50 33 4 71 167
1995 315 128 22 57 25 24 4 58 126
Total 10138 4095 526 1971 764 640 113 2013 4520
AVG 506.9 204.75 26.3 98.55 38.2 32 5.65 100.65 226

Allen County Homicide Yearly Comparison
2015 2015 2014 2014 2013 2013 2012 2012
Number Percentage Number Percentage Number Percentage Number Percentage
Total Homicides 30 100.00% 16 100.00% 45 100.00% 30 100.00%
Sex
Male 22 73.33% 13 81.25% 42 93.33% 27 90.00%
Female 8 26.67% 3 18.75% 3 6.67% 3 10.00%
Race
White 8 26.67% 6 37.50% 7 15.56% 9 30.00%
Black 18 60.00% 9 56.25% 34 75.56% 19 63.33%
Hispanic 2 6.67% 1 6.25% 3 6.67% 2 6.67%
Asian 2 6.67% 0 0.00% 1 2.22% 0 0.00%
Age Group
0-12 1 3.33% 0 0.00% 0 0.00% 0 0.00%
13-19 4 13.33% 1 6.25% 8 17.78% 3 10.00%
20-29 14 46.67% 5 31.25% 15 33.33% 10 33.33%
30-39 6 20.00% 4 25.00% 9 20.00% 5 16.67%
40-49 4 13.33% 3 18.75% 9 20.00% 7 23.33%
50-59 0 0.00% 1 6.25% 3 6.67% 4 13.33%
60-69 1 3.33% 1 6.25% 1 2.22% 0 0.00%
70 + 0 0.00% 1 6.25% 0 0.00% 1 3.33%
Method
Asphyxia/ Strangulation 1 3.33% 1 6.25% 0 0.00% 0 0.00%
Blunt Force Trauma 3 10.00% 2 12.50% 3 6.67% 4 13.33%
Exsanguination 1 3.33% 0 0.00% 1 2.22% 0 0.00%
Failure to Thrive 0 0.00% 0 0.00% 0 0.00% 0 0.00%
Gunshot 23 76.67% 12 75.00% 39 86.67% 22 73.33%
Intracranial Hemorrhage 0 0.00% 0 0.00% 0 0.00% 0 0.00%
Respiratory Disease 0 0.00% 0 0.00% 0 0.00% 0 0.00%
Sepsis 0 0.00% 0 0.00% 1 2.22% 2 6.67%
Sharp Force Injury 2 6.67% 1 6.25% 1 2.22% 2 6.67%

Allen County Suicide Yearly Comparison
2015 2015 2014 2014 2013 2013 2012 2012
Number Percentage Number Percentage Number Percentage Number Percentage
Total Suicides 44 47 100.00% 42 100.00% 52 100.00%
Sex
Male 33 75.00% 36 76.60% 37 88.10% 46 88.46%
Female 11 25.00% 11 23.40% 5 11.90% 6 11.54%
Race
White 38 86.36% 40 85.11% 40 95.24% 44 84.62%
Black 2 4.55% 4 8.51% 1 2.38% 6 11.54%
Hispanic 4 9.09% 3 6.38% 1 2.38% 2 3.85%
Age Group
0-12 0 0.00% 0 0.00% 0 0.00% 0 0.00%
13-19 2 4.55% 5 10.64% 1 2.38% 3 5.77%
20-29 7 15.91% 11 23.40% 7 16.67% 11 21.15%
30-39 9 20.45% 6 12.77% 7 16.67% 5 9.62%
40-49 6 13.64% 7 14.89% 6 14.29% 11 21.15%
50-59 6 13.64% 9 19.15% 12 28.57% 11 21.15%
60-69 7 15.91% 4 8.51% 5 11.90% 8 15.38%
70 + 7 15.91% 5 10.64% 4 9.52% 3 5.77%
Method
Asphyxia 13 29.55% 13 27.66% 11 26.19% 20 38.46%
Blunt Force Trauma 2 4.55% 1 2.13% 2 4.76% 1 1.92%
Drug/Alcohol 5 11.36% 11 23.40% 9 21.43% 9 17.31%
Exsanguination 0 0.00% 0 0.00% 1 2.38% 0 0.00%
Gunshot 24 54.55% 22 46.81% 19 45.24% 21 40.38%
Poisoning 0 0.00% 0 0.00% 0 0.00% 1 1.92%