all surface empty bottle inspection(asebi) full documentation
TRANSCRIPT

OPTIMAL GLASS BOTTLE INSPECTION WITH ASEBI
DEPT OF ECE, CREC 1
1. INTRODUCTION
The Filtec Omnivision All Surface Empty Bottle Inspector (ASEBI), with a
modular design that makes expandable functionality possible through available
technology upgrades, meets the needs of small to medium size bottling facilities.
Operating at speeds of up to 700 bottles per minute, the standard ASEBI comes
equipped with a high resolution Camera Base Inspection system. Optional functions
include inspection of the finish, thread, outer sidewall, inner sidewall, as well as the
detection of residual liquid by infrared and RF techniques.Transparent films are
detected with a special optical technique known as the Bright Field Analyzer.
Reject verification, test bottle verification, rotating self-cleaning diffuser glass,
serial interface port (MODBUS Protocol), isolated PLC outputs, and enclosure
doors are also available as options. All of these options can easily be upgraded in
the field, which assures maximum adaptability of the Filtec Omnivision.
Filtec Omnivision is appropriate for bottling operations that fill returnable
plastic or glass bottles for soft drinks, beer, and other products.The production
conveyor powers the automatic starwheel drive system; this assures that the
starwheel is always synchronized with bottle flow. Upstream sensors control the
starwheel drive system and regulate gap closure of bottles entering the starwheel to
provide smooth stops and starts which minimize breakage, jams, and noise.
Handling bottles up to 104-mm-dia, the Filtec Omnivision improves
productivity by reducing changeover related downtime to less than five min. The
Filtec Omnivision offers a touchpad control panel and LCD color monitor that are
both mounted on a swing arm that rotates for easy operator viewing.

OPTIMAL GLASS BOTTLE INSPECTION WITH ASEBI
DEPT OF ECE, CREC 2
2. INTRODUCTION TO ASEBI
2.1. ASEBI
All Surface Empty Bottle Inspector (ASEBI), with a modular design that makes
expandable functionality possible through available technology upgrades, meets the needs
of small to medium size bottling facilities. Operating at speeds of up to 700 bottles per
minute, the standard ASEBI comes equipped with a high resolution Camera Base
Inspection system. Optional functions include inspection of the finish, thread, outer
sidewall, inner sidewall, as well as the detection of residual liquid by infrared and RF
techniques.Transparent films are detected with a special optical technique known as the
Bright Field Analyzer. Reject verification, test bottle verification, rotating self-cleaning
diffuser glass, serial interface port (MODBUS Protocol), isolated PLC outputs, and
enclosure doors are also available as options..
Figure 2.1: All Surface Empty Bottle Inspector (ASEBI)

OPTIMAL GLASS BOTTLE INSPECTION WITH ASEBI
DEPT OF ECE, CREC 3
2.2 ASEBI DETECTION POINTS
All Surface Empty Bottle Inspector (ASEBI) having following detection points
They are:
1. OSW Detection
2.ISW Detection
3.Base detection
4.IR Residual Detection
5.RF Residual Detection
6.Finish Detection
7.Thread Detection
2.3 APPLICATIONS OF ASEBI
It is used in these areas like
1) Drug Companies
2) Beverages Companies
3) Water bottle companies
4) Pharmaceutical companies
5) Liquor companies

OPTIMAL GLASS BOTTLE INSPECTION WITH ASEBI
DEPT OF ECE, CREC 4
3. DETECTION TYPES IN ASEBI
3.1 Inner side wall
The bottle's inner sidewall is made up of all the inside surfaces from the base up
through the neck. Damages in these surfaces can be difficult to see with the human eye,
but can easily grow mold internally or shed glass into the product after it has been filled.
Figure 3.1: Inner side wall
The bottle's inner sidewall is made up of all the inside surfaces from the base up through
the neck. Damages in these surfaces can be difficult to see with the human eye, but can
easily grow mold internally or shed glass into the product after it has been filled. The
CCD is a special integrated circuit consisting of a flat, two dimensional array of small
light detectors referred to as pixels. The CCD chip is an array of Metal-Oxide-
Semiconductor capacitors (MOS capacitors), each capacitor represents a pixel. Each pixel
acts like a bucket for electrons. A CCD chip acquires data as light or electrical charge.
During an exposure, each pixel fills up with electrons in proportion to the amount of light

OPTIMAL GLASS BOTTLE INSPECTION WITH ASEBI
DEPT OF ECE, CREC 5
that enters it.The CCD takes this optical or electronic input and converts it into an
electronic signal. The electronic signal is then processed by some other equipment and/or
software to either produce an image or to give the user valuable information.
3.2 Outer side wall
Outer sidewall refers to the outside surface of a container, usually below
the thread and above the base. This outer surface can often become visibly
scuffed or chipped, especially in returnable glass or PET.
Figure 3.2: Outer side wall
Outer sidewall refers to the outside surface of a container, usually below the thread and
above the base. This outer surface can often become visibly scuffed or chipped, especially
in returnable glass or PET. While outer sidewall damages are unlikely to corrupt the
product itself, external container flaws are the indications of low quality standards most
obvious to the end consumer.

OPTIMAL GLASS BOTTLE INSPECTION WITH ASEBI
DEPT OF ECE, CREC 6
15 independent inspection zones
ACL detection
Adjustable illumination
360 degree outer surface inspection
6000k LED panel strobe
Cellophane / brightfield detection
Adjustable illumination
3.3 Base detection
The base of a bottle receives the most amount of wear during the container's life,
and easily sustains scuffing or chips. Thorough inspection of both the inside and outside
of an empty container's base prevents flawed packaging and contaminated product from
reaching the market
Figure 3.3: Base detection
The CCD is a special integrated circuit consisting of a flat, two dimensional array of
small light detectors referred to as pixels. The CCD chip is an array of Metal-Oxide-
Semiconductor capacitors (MOS capacitors), each capacitor represents a pixel. Each pixel
OPTIMAL GLASS BOTTLE INSPECTION WITH ASEBI
DEPT OF ECE, CREC 7
acts like a bucket for electrons. A CCD chip acquires data as light or electrical charge.
During an exposure, each pixel fills up with electrons in proportion to the amount of light
that enters it.The CCD takes this optical or electronic input and converts it into an
electronic signal. The electronic signal is then processed by some other equipment and/or
software to either produce an image or to give the user valuable information.
As stated, CCD cameras are useful in scientific imagery, especially in astronomy, where,
with the help of a telescope, they allow for high resolution images of stars, galaxies, and
other celestial bodies that human eye cannot detect. CCD cameras can also be used in a
laboratory to image in finer detail than a regular camera. The fact that CCDs are
extremely sensitive to light makes them useful in experimentation where faint light
detection is needed.
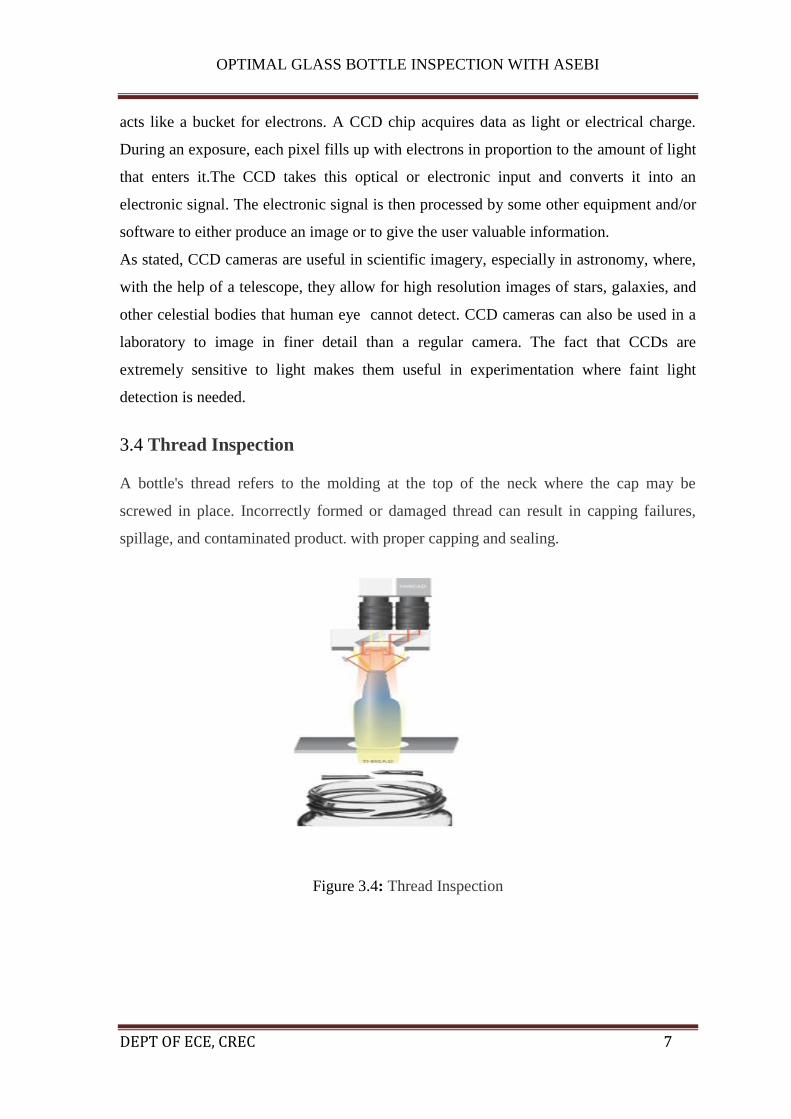
3.4 Thread Inspection
A bottle's thread refers to the molding at the top of the neck where the cap may be
screwed in place. Incorrectly formed or damaged thread can result in capping failures,
spillage, and contaminated product. with proper capping and sealing.
Figure 3.4: Thread Inspection
OPTIMAL GLASS BOTTLE INSPECTION WITH ASEBI
DEPT OF ECE, CREC 8
3.5 finish Inspection
finish of a bottle or container is the very top surface where the cap is applied. For
returnable glass especially, this surface can easily chip while in the market or during the
washing process and cause problems with proper capping and sealing. If a chipped finish
does make its way back out into the market, sharp edges can harm the end consumer. The
CCD is a special integrated circuit consisting of a flat, two dimensional array of small
light detectors referred to as pixels. The CCD chip is an array of Metal-Oxide-
Semiconductor capacitors (MOS capacitors), each capacitor represents a pixel. Each pixel
acts like a bucket for electrons. A CCD chip acquires data as light or electrical charge.
During an exposure, each pixel fills up with electrons in proportion to the amount of light
that enters it.1 The CCD takes this optical or electronic input and converts it into an
electronic signal. The electronic signal is then processed by some other equipment and/or
software to either produce an image or to give the user valuable information. As stated,
CCD cameras are useful in scientific imagery, especially in astronomy, where, with the
help of a telescope, they allow for high resolution images of stars, galaxies, and other
celestial bodies that human eye cannot detect. CCD cameras can also be used in a
laboratory to image in finer detail than a regular camera. The fact that CCDs are
extremely sensitive to light makes them useful in experimentation where faint light
detection is needed.
For example, the 8-inch shutter pictured below leaks about 1/10,000ths of incident
light. Even in a dark room, the leaked light was imperceptible to experimenters. Though,
a 10 second integration time CCD exposure can resolve all the details of the leaked light
as shown in the picture. By applying IRAF image processing (to be described later), we
removed extraneous lighting by subtracting a dark image from the signal image.
It have:
• 1)High resolution CCD camera
• 2)Up to 720 degree inspection tracking
• 3)Adaptable for Press, Roll, and Twist finishes

OPTIMAL GLASS BOTTLE INSPECTION WITH ASEBI
DEPT OF ECE, CREC 9
Figure 3.5: final Inspection
3.6 CAUSTIC DETECTION(RF-RLD)
Without additional inspection, leftover caustic and objects (like mold, cigarette butts, or
straws) not shaken out during the washing process can remain inside of returnable
containers through the filler and get sent back out to the market. Detects smallest amounts
of caustic, even once it has dried.
Figure 3.6: Caustic Detection

OPTIMAL GLASS BOTTLE INSPECTION WITH ASEBI
DEPT OF ECE, CREC 10
4.CCD CAMERA OPERATION AND THEORY
4.1 INTRODUCATION
A CCD, or charged coupled device, is a device used in digital photography that converts
an optical image into electrical signal. CCD chips can detect faint amounts of light and
are capable of producing high resolution images needed in scientific research and
applications thereof. CCDs are particularly useful in astronomical imagery due to their
great sensitivity to light. In theory, CCDs are linear-producing accurate images,
transmitting the value they detect in a 1:1 ratio. This is usually not the case. Various
factors, such as dark noise, readout noise, saturation, along with the fact that each pixel
on a CCD is unique and varies from its neighbors, require that in-depth testing, analysis,
and data reduction be implemented when using a CCD for any type of scientific imagery.
Other variables, including the effects of a lens before a CCD and shutter speed of the
camera being used, along with others, must be taken into consideration and dealt with
accordingly in order to obtain a true image. There are various methods of testing for the
above factors, a few of which will be described, along with the appropriate data reduction
procedure.
4.2 Basic Theory of a CCD
The CCD is a special integrated circuit consisting of a flat, two dimensional array
of small light detectors referred to as pixels. The CCD chip is an array of Metal-Oxide-
Semiconductor capacitors (MOS capacitors), each capacitor represents a pixel. Each pixel
acts like a bucket for electrons. A CCD chip acquires data as light or electrical charge.
During an exposure, each pixel fills up with electrons in proportion to the amount of light
that enters it. The CCD takes this optical or electronic input and converts it into an
electronic signal. The electronic signal is then processed by some other equipment and/or
software to either produce an image or to give the user valuable information.

OPTIMAL GLASS BOTTLE INSPECTION WITH ASEBI
DEPT OF ECE, CREC 11
4.3 Practical Applications of the CCD Camera
As stated, CCD cameras are useful in scientific imagery, especially in astronomy,
where, with the help of a telescope, they allow for high resolution images of stars,
galaxies, and other celestial bodies that human eye cannot detect. CCD cameras can also
be used in a laboratory to image in finer detail than a regular camera. The fact that CCDs
are extremely sensitive to light makes them useful in experimentation where faint light
detection is needed.
For example, the 8-inch shutter pictured below leaks about 1/10,000ths of incident
light. Even in a dark room, the leaked light was imperceptible to experimenters. Though,
a 10 second integration time CCD exposure can resolve all the details of the leaked light
as shown in the picture. By applying IRAF image processing (to be described later), we
removed extraneous lighting by subtracting a dark image from the signal image.
4.4 Use of a CCD in a Controlled Environment
For the purposes of this essay and the description of CCD operation, functionality, test
methods, and data reduction, it will be assumed that all CCD use is in a controlled
environment such as an indoor laboratory or dark room. A procedure for operation in this
type of environment will be described. Keep in mind that CCD usage in different
situations call for other procedures than the ones described below, although many of the
same principles still apply.
The CCD that was used for the actual data that will be represented is a product of
SBIG, Santa Barbara Instrumentation Group. The model used was the ST-8300M/C.
Table B. Specifications for the ST-8300
CCD Kodak KAF-8300
Pixel Array 3326 x 2504 pixels
Total Pixels 8.3 Megapixels
Pixel Size 5.4 x 5.4 microns
Shutter Type Electromechanical
Exposure 0.1 to 3600 seconds
Dimensions 4 x 5 x 2 inches

OPTIMAL GLASS BOTTLE INSPECTION WITH ASEBI
DEPT OF ECE, CREC 12
When operating a CCD camera of these sorts, software must be used to acquire,
view, and edit images. CCDOps is the software that was used in the acquisition of all
images pictured. CCDOps is a free SBIG camera control software for Windows provided
with the purchase of an SBIG camera. While simple to operate, CCDOps effectively
controls all camera functions and is useful for basic image processing, although
limitations may exist.
When further image processing and data reduction is necessary, many other useful
programs exist, one of which is IRAF. IRAF stands for Image Reduction and Analysis
Facility, and is a general purpose software system for the reduction and analysis of
astronomical data. IRAF is written and supported by the IRAF programming group at the
National Optical Astronomy Observatories (NOAO) in Tucson, Arizona. NOAO is
operated by the Association of Universities for Research in Astronomy (AURA), Inc.
under cooperative agreement with the National Science Foundation. Basic IRAF
operations will be explained in further detail later on in this report.
4.5 Basic CCDOps Usage
1)The following process describes operation of CCDOps from a Windows XP
environment along with a few useful commands included in the program:
2)Install CCDOps onto a computer that runs Windows before connecting the camera to
the computer.
3)The process is simple and detailed instructions accompany the software package.
4)Make sure that the proper drivers for specific camera are installed.
5)SBIG cameras come equipped with a USB cable that connects the camera to the
computer.
6)Plug the camera‟s power supply into the wall and note that the internal fan comes on.
7)Connect the USB to the computer and follow instructions provided in the manual and
the “Found New Hardware Wizard” prompts.
Once CCDOps is installed and the camera is successfully connected to the computer, run
CCDOps. Once the temperature is reached, the percent capacity should be no more than
60-80 percent, and should never be operating at 100 percent.

OPTIMAL GLASS BOTTLE INSPECTION WITH ASEBI
DEPT OF ECE, CREC 13
4.6 Conclusion
The CCD, charged coupled device, is an amazing piece of technology that is very
useful in science, particularly in Astronomy, as well as in everyday life. High resolution
CCD images have allowed scientists to observe realms of the universe that the human eye
had never seen. Using various means of imaging and data reduction, one can correct
variances and imperfections exhibited by a CCD, and obtain a very accurate image.

OPTIMAL GLASS BOTTLE INSPECTION WITH ASEBI
DEPT OF ECE, CREC 14
5. WORKING AND OPERATION OF ASEBI
5.1 Working Principle
This machine works on the principle of empty bottle inspection.
Figure 5.1: Parts of ASEBI
Applications
Inspection of empty glass and PET containers
Output
Rated output: 72,000 containers per hour

OPTIMAL GLASS BOTTLE INSPECTION WITH ASEBI
DEPT OF ECE, CREC 15
5.2 Inspection modules in overview

OPTIMAL GLASS BOTTLE INSPECTION WITH ASEBI
DEPT OF ECE, CREC 16
5.3 POWER SUPPLY
5.3.1 AC POWER SUPPLY
Figure 5.3.1: AC POWER BLOCK DIGRAM

OPTIMAL GLASS BOTTLE INSPECTION WITH ASEBI
DEPT OF ECE, CREC 17
5.3.2 DC POWER SUPPLY
Figure 5.3.2: DC POWER BLOCK DIGRAM
FIGURE 5.3.1 shows the circuit diagram for AC power supply in ASEBI
FIGURE 5.3.2 shows the circuit diagram for DC power supply in ASEBI
.
UPS Battery:
The Lead-Acid 24VDC UPS battery is charged with the 30VDC power supply
that is mounted in the Base Cabinet. CB-11, the breaker for this supply, is connected
directly to the in-coming 220VAC line to allow charging to take place regardless of the
state of the main power switch. The power for this circuit is not subordinate to the main
Power Switch.
OPTIMAL GLASS BOTTLE INSPECTION WITH ASEBI
DEPT OF ECE, CREC 18
Theory/Functionality:
The OV-II UPS is not a typical AC UPS.
The OV-II UPS is a DC UPS whose sole purpose is to switch 24VDC from the power
supply in the Base Cabinet (which is killed when the main power switch is thrown) to the
24VDC battery for a period of one minute to allow Windows to have time to properly
shut down
1)Monitor The operating unit is a high-resolution 15" TFT colour touch-screen, which is
integrated in the machine head
2)Current display of all relevant operating data including rejection trend analysis with
possibility for display of all camera images
3)Access to user interface via individual passwords - optional as number code or with
coded transponders
4)Different access levels for individual operators, depending on the assigned
authorisation +
Documentation of production
1) data Recording of all relevant operating data such as production data, parameter
changes, the results of the test bottle programme, and special occurrences with the
machine function
2)Use of these data e. g. for quality management, or storing in a longtime memory
3)Saving of these data with exact time indications, operator names, and the respective
valid parameter values
4)Transfer possibility of defined operating data to an operating data acquisition system,
to the customer's network, or to an external PC (customer)
5)Different printout representations of production and test container data

OPTIMAL GLASS BOTTLE INSPECTION WITH ASEBI
DEPT OF ECE, CREC 19
Automatic maintenance programme
1.Automatic information on display for machine operator or service technician about
upcoming maintenance tasks
2.Display of maintenance tasks by priorities and resetting jobs after termination
3.Interactive graphical malfunctions diagnostics system to support troubleshooting
Remote visualisation
1.Display of the machine’s operating condition through the company-own network to
several PCs by using an additional software
2.Monitoring of e.g. counter readings, malfunctions, test bottle programme runs
Change ovwe
1)Test container programme Semi-automatic function monitoring in regular intervals, as
well as every time after switching on the machine, and when changing over to a new
container type
2)Infeed of a prepared assortment of test containers to the machine in any sequence
3)Examination of the individual inspection units by error detection with the test container
4)Data indication on the display, and recording of results
5)Data transfer to operating data acquisition system, to a network, or to a printe

OPTIMAL GLASS BOTTLE INSPECTION WITH ASEBI
DEPT OF ECE, CREC 20
6. LCD DISPLAY AND SETUP
6.1 Introducation
By using CCD camaras the detection of bottles seen in disply screen.It requires
windows 7 os with detection software.Below figure 6.1 shows the LCD display with
touchpad
Figure 6.1 LCD Display
Screen have:-
15-inch pivoting touch-screen
Display of all relevant operating data including a rejection trend analysis with
display of all camera images
Operation and adjustments via individual access levels with userdefined
transponders

OPTIMAL GLASS BOTTLE INSPECTION WITH ASEBI
DEPT OF ECE, CREC 21
6.2 Base inspection setup
A camera takes an image of the container base, which is evenly illuminated by an
LED flash. The high grey-scale resolution guarantees consistently high image quality
even in containers with different levels of permeability to light.
In glass bottles, it detects
Contamination and damage on the base
Foreign objects
With an additional filter: film residues and glass splinters in the bottle
In returnable PET containers, it detects
Contamination and damage on the base
Foreign objects
Tension cracks on the base

OPTIMAL GLASS BOTTLE INSPECTION WITH ASEBI
DEPT OF ECE, CREC 22
Figure 6.2 Base inspection setup
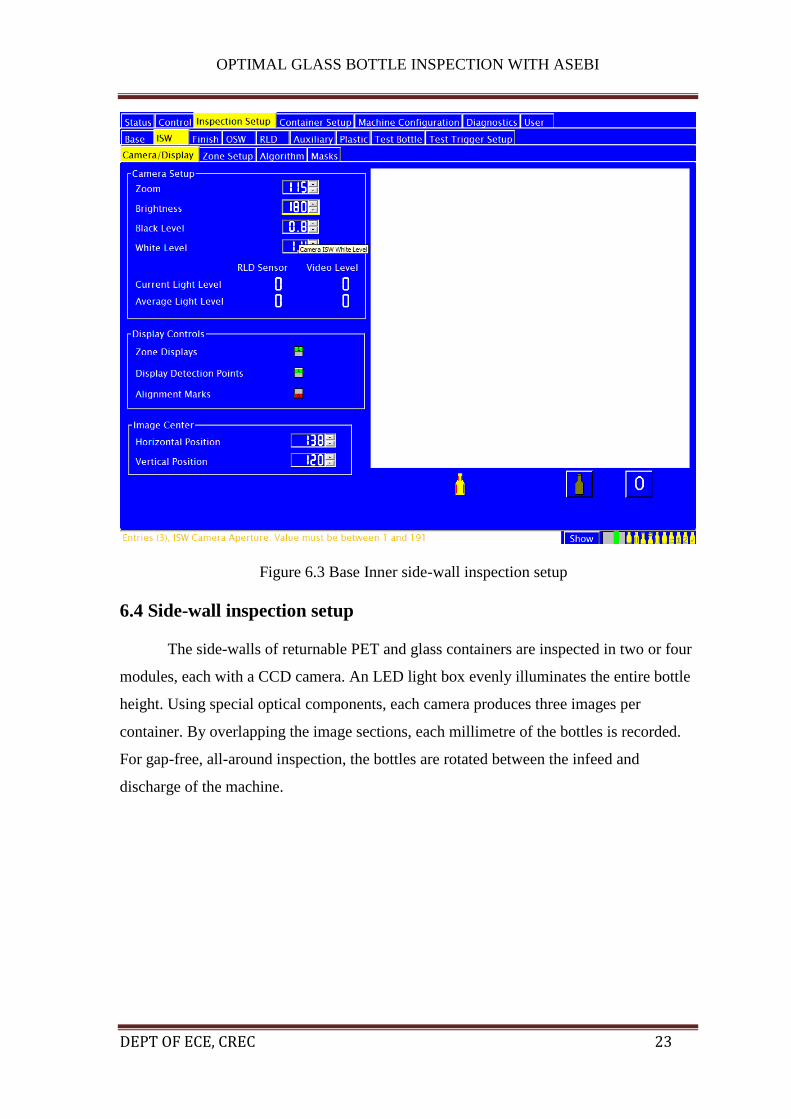
6.3 Inner side-wall inspection setup
Uses a CCD camera to inspect theinside of the container through itsopening
Utilises the LED illumination ofthe base inspection unit
Detects protruding dirt on theinner side-wall
This means that it inspects theinner side-wall precisely, even ifthere is a large-area
ACL label onthe container
OPTIMAL GLASS BOTTLE INSPECTION WITH ASEBI
DEPT OF ECE, CREC 23
Figure 6.3 Base Inner side-wall inspection setup
6.4 Side-wall inspection setup
The side-walls of returnable PET and glass containers are inspected in two or four
modules, each with a CCD camera. An LED light box evenly illuminates the entire bottle
height. Using special optical components, each camera produces three images per
container. By overlapping the image sections, each millimetre of the bottles is recorded.
For gap-free, all-around inspection, the bottles are rotated between the infeed and
discharge of the machine.

OPTIMAL GLASS BOTTLE INSPECTION WITH ASEBI
DEPT OF ECE, CREC 24
6.5 Infrared residual liquid detection setup
Residual liquid in the container is detected by two independently operating
systems: the infrared system detects all liquids, such as for example, cooking oil. As a
team, these two detection systems achieve a maximum degree of safety.
Figure 6.5 Infrared residual liquid detection setup

OPTIMAL GLASS BOTTLE INSPECTION WITH ASEBI
DEPT OF ECE, CREC 25
6.6 Finish setup
The finish of a bottle or container is the very top surface where the cap is applied.
For returnable glass especially, this surface can easily chip while in the market or during
the washing process and cause problems with proper capping and sealing. If a chipped
finish does make its way back out into the market, sharp edges can harm the end
consumer.
Figure 6.6 Finish setup

OPTIMAL GLASS BOTTLE INSPECTION WITH ASEBI
DEPT OF ECE, CREC 26
7. Troubleshooting and Benefits
7.1 Reasons of Heavy rejection of Bottle’s through EBI
Rejection due to Vacuum Drop.
Rejection due to Inspection.
Figure 7.1 vacuum drop in ASEBI

OPTIMAL GLASS BOTTLE INSPECTION WITH ASEBI
DEPT OF ECE, CREC 27
Figure 7.2 vacuum valve plate
7.1.1 Problems for above the valve plate:
Port get Blocked due to dirt's.
Due to damaged/loose sucker cup.
Due to damaged Valve plate.
Due to damaged Seal ring.
Due to damaged/loose of spring or o-ring.Due to loose Registry plate
7.1.2 Problems for below the valve plate:
Due to chock-up of vacuum filter.
Due to chock-up of Host pipe/Distributor Assy
Due to failure of Reject valve.
Failure of Vacuum pump
7.1.3 Rejection due to Inspection:
Improper entries of bottles in starwheel.
Object/dirt on inspection surface.
Heavy soap on conveyor.
Improper selection of bottle type during changeover.
Improper selection/alignment of starwheel/Dead plate.
Inspection head is not been kept on mention h.t.
7.2 While looking at the bottles being rejected see if there is an unusual
bottle characteristic which could be interpreted as a defect. Typical false
reject problems to look for include
7.2.1On the Base:
• Heavy embossed lettering or molding
• Extreme wedges
• Extreme color variations

OPTIMAL GLASS BOTTLE INSPECTION WITH ASEBI
DEPT OF ECE, CREC 28
• Prominent seams
• Large air bubbles
• Thin spots in the heel
7.2.2On the Inner Sidewall:
• Protruding glass knobs
• Extreme variation in thickness
• Birdswings
7.2.3 On the Plugged Neck/Color Sort:
• Extreme bottle color variations
7.2.4 For Residual Liquid:
• High levels of rinse carryover
• Extreme bottle color variations
• Bottles made from contaminated glass (such as recycled glass
which have blended multiple glass colors in it)
7.2.5 On the Finish:
• Heavy scuffing
• Large molding ridges
• Prominent seams
7.2.6 On the Outer Sidewall:
• Heavy scuffing
• Extreme color variations
• Large air bubbles
• Heavy embossed lettering or molding
• Prominent seams
If u find rejection due to above reason then make the adjustment in the respective
Inspection parameters accordingly.
7.3 Daily Maintenance checklist
1)Clean the machine with wet cloth.

OPTIMAL GLASS BOTTLE INSPECTION WITH ASEBI
DEPT OF ECE, CREC 29
2)Clean the Lens of camera by tissue paper or soft cloth.
3)Clean Diffuser glass by soft cloth.
4)Clean the base strobe lamp cover which is below the DEAD plate.
5)Clean the vacuum pump filter.
(one is in the machine and other is at the vacuum pump)

OPTIMAL GLASS BOTTLE INSPECTION WITH ASEBI
DEPT OF ECE, CREC 30
7.4 Our Benefits
7.4.1 Modular design
There is a range of different inspection modules and detection systems available for the
omnivision. Our product specialists can help you decide exactly which options are right
for you. Should your inspection requirements change at a later date, the omnivision can
be simply upgraded with additional modules.
7.4.2 Large processing spectrum
The omnivision can be flexibly adapted to very different con tainer types. This means that
both glass and returnable PET bottles can even be handled on the same machine.
7.4.3 Protection against operator errors
Parameters, cameras and belts are automatically adjusted and changed. Thus the
omnivision is perfectly protected against operator errors.
7.4.4 Slight wear-related costs
All modules are equipped with long-lasting LED illumination units.
7.4.5 Hygienic design
To create optimal hygienic conditions, the omnivision was designed in a completely
hygienic manner: it makes do without a table plate and dirt deposits do not stand a chance
on its slanted exterior surfaces. Container lubricants, fragments and other types of
contamination are removed immediately.
7.4.6 Excellent inspection results
The highly sensitive inspection modules have a 99.9% success rate when it comes to
detecting faults and contamination. Simultaneously, they keep the number of faulty
OPTIMAL GLASS BOTTLE INSPECTION WITH ASEBI
DEPT OF ECE, CREC 31
rejections down to an absolute minimum. This is made possible by intelligent inspection
software; the side-wall inspection system, for example, does not even become confused
by water droplets on the bottle. The side-wall and base inspection units can be optionally
upgraded with a 1.3 megapixel camera.
7.4.7 Quick and simple change-over
When changing over to other container types, no change parts need to be exchanged.
Furthermore, the parameters are changed over and the heights of the camera and of the
conveyor belts are adjusted automatically. This allows the entire change-over to be
performed in the record time of just two to five minutes.
7.4.8 Long-lasting and dirt repellant conveyor belts
Durability and microbiological safety are the two most important features of the conveyor
belts: their enclosed surfaces protect them against traces of wear and prevent them from
absorbing lubricants and liquids.
7.4.9 Uniform operating concept
All omnivision machines are equipped with a uniform operating concept for maximum
user friendliness.
7.5 Safety devices and other additional equipment
7.5.1 Safety devices:-
The machine is stopped if containers which are too high or have fallen down are
fed into it
Safety switch if containers with a diameter which is too small are fed into the
machine
Electronic function monitoring of the inspection and lighting units, all P.E. sensor
assemblies and all rejection systems

OPTIMAL GLASS BOTTLE INSPECTION WITH ASEBI
DEPT OF ECE, CREC 32
Tracking of the container position in the machine according to the fail-safe
principle
7.5.2 Additional equipment:-
Special filter for detecting glass splinters and film residues with the base
inspection unit
Special filter for detecting film residues with the side-wall inspection unit
Transponder for the test container program
Container pool statistics
1.3 megapixel camera for inspecting the base and side-wall
Ejection chute to avoid glass fragments in the bottle
Machine network connection and remote visualisation
Electronic Bloc connection with the filler

OPTIMAL GLASS BOTTLE INSPECTION WITH ASEBI
DEPT OF ECE, CREC 33
8.ULTRA SONIC SENSORS
8.1 FUNDAMENTALS AND ITS APPLICATION
This chapter provides the fundamentals of ultrasonic sensing techniques
that can be used in the various fields of engineering and science. It also includes
some advanced techniques used for non-destructive evaluations. At first, basic
characteristics of ultrasonic waves propagating in media are described briefly.
Secondly, basic concepts for measuring ultrasonic waves are described with
introductory subjects of ultrasonic transducers that generate and receive
ultrasonic waves. Finally, specialized results demonstrating the capabilities of
using a buffer rod sensor for ultrasonic monitoring at high temperatures are
presented.
Ultrasonic sensing techniques have become mature and are widely used in
the various fields of engineering and basic science. Actually, many types of
conventional ultrasonic instruments, devices and sophisticated software are
commercialized and used for both industrial and medical applications. One of
advantages of ultrasonic sensing is its outstanding capability to probe inside
objectives nondestructively because ultrasound can propagate through any kinds
of media including solids, liquids and gases except vacua. In typical ultrasonic
sensing the ultrasonic waves are travelling in a medium and often focused on
evaluating objects so that a useful information on the interaction of ultrasonic
energy with the objects are acquired as ultrasonic signals that are the wave forms
variations with transit time. Such ultrasonic data provides the fundamental basis
for describing the outputs of ultrasonic sensing and evaluating systems.
In this chapter the fundamentals of ultrasonic sensing techniques are described.
What is ultrasound, how to produce and capture ultrasound, what kinds of
methods and equipments can be used to measure ultrasound, and what kinds of
information can be obtained from ultrasonic measurements? These questions are
addressed in the following sections and the answers to the questions are briefly
explained from the viewpoint of industrial applications. In addition, some
specialized results using a buffer rod sensor that is an effective means for high

OPTIMAL GLASS BOTTLE INSPECTION WITH ASEBI
DEPT OF ECE, CREC 34
temperature ultrasonic measurements are introduced to demonstrate its
applicability for nondestrucive evaluations and monitoring. For further studies
on ultrasonic sensing, it is recommended to refer to some books, for basic
theories of ultrasound propagations. for transducers and instruments, and for
ultrasonic measurements, evaluations, applications and others.
It is known that frequency range of sound audible to humans is
approximately 20 to 20,000 Hz (cycles per second). Ultrasound is simply sound
that are above the frequency range of human hearing. When a disturbance occurs
at a portion in an elastic medium, it propagates through the medium in a finite
time as a mechanical sound wave by the vibrations of molecules, atoms or any
particles present. Such mechanical waves are also called elastic waves.
Ultrasound waves or ultrasonic waves are the terms used to describe elastic
waves with frequency greater than 20,000 Hz and normally exist in solids,
liquids, and gases. A simple illustration of the ultrasonic waves produced in a
solid is shown in Fig. 1, where distortion caused depending on whether a force is
applied normal or parallel to the surface at one end of the solid can result in
producing compression or shear vibrations, respectively, so that two types of
ultrasonic waves, i.e. longitudinal waves or transverse waves, propagate through
the solid. The energy of the wave is also carried with it.
In a continuous medium, the behaviour of ultrasonic waves is closely
related to a balance between the forces of inertia and of elastic deformation. An
ultrasonic wave moves at a velocity (the wave velocity) that is determined by the
material properties and shape of the medium, and occasionally the frequency.
The ultrasonic wave imparts motion to the material when it propagates. This is
referred to as particle motion, to distinguish it from the wave motion. This
particle motion is usually specified as a particle velocity v. It is noted in
ultrasonic measurements that the particle velocity is much smaller than wave
velocity. Also, one can understand that no ultrasonic wave propagates in vacua
because there are no particles that can vibrate in vacua.
The balance between inertia and elasticity develops into a linear relationship
between stress σ and particle velocity v, σ =zv. The proportional factor z is
called the specific acoustic impedance of an ultrasonic wave

OPTIMAL GLASS BOTTLE INSPECTION WITH ASEBI
DEPT OF ECE, CREC 35
z = σ/v = ρ c
where, ρ is the density, and c is the wave velocity. The acoustic impedance
characterizes the ability of a material to vibrate under an applied force and can
be considered as the resistance of the material to the passage of ultrasonic waves.
There is an analogy between impedance in electrical circuits and the acoustic
impedance. The acoustic impedance is useful for treating the transmission of
ultrasonic waves between two media, just like that the electrical impedance is
effective to characterize a resistance in an alternating electric current circuit. For
example, the transmission of an ultrasonic wave from one medium to another
becomes maximum when the acoustic impedances of the two media are equal.
The concept of using the acoustic impedance plays an important role in
determining of acoustic transmission and reflection at a boundary of two media
having different material properties and therefore, the acoustic impedance is an
important parameter in designing ultrasonic sensors and sensing systems.
ultrasonic waves propagating across the material is simply shown in terms
of the displacement of the layers from their equilibrium position and its
amplitude. At a fixed position in the material, the displacement changes
sinusoidally with time t, where the time required for the wave to propagate the
distance between successive maxima is the period T. At any time, the amplitude
of the displacement decreases periodically with increasing propagation distance
because of its attenuation by the material. The distance between successive
maxima in the amplitude variation is equal to the wavelength λ.
8.2. FEATURES OF ULTRASONIC WAVES
It is important to understand the behaviour and properties of ultrasonic
waves in media, to design ultrasonic sensors and develop ultrasonic sensing
systems. Some basic features of ultrasonic waves are introduced here.
Types of Wave (Modes of Propagation)
What types of ultrasonic waves can exist? The answer to this question can
basically be given from solutions of the wave equations that predict wave
behaviours by showing that material properties and body shape dictate the
vibrational response to the applied forces that drive the wave motion. Details of
wave types obtained by solving wave equations and their characteristics are
OPTIMAL GLASS BOTTLE INSPECTION WITH ASEBI
DEPT OF ECE, CREC 36
shown in .In short, there are two types of ultrasonic waves: bulk (fundamental)
waves that propagate inside of an object, and guided waves that propagate near
the surface or along the interface of an object
Waves that propagate wholly inside an object, independent of its boundary
and shape, are called bulk waves. Two types of bulk waves can exist in an
isotropic medium: longitudinal (or dilatational, compression, primary), and shear
(or distortional, transverse, secondary) waves as shown schematically in Fig. 1.
As mentioned in Section 2.1, ultrasonic wave propagations are usually described
in terms of the direction of particles motion in relation to the direction in which
the wave propagates. The longitudinal waves can be defined on this basis as
waves in which the particle motion is parallel to the direction of the wave
propagation. The shear waves are defined as waves in which the particle motion
is perpendicular to the direction of the propagation. Both waves can exist in
solids because solids, unlike liquids and gasses, have rigidity that is a resistance
to shear as well as compressive loads. However, the shear waves cannot exist in
liquids and gasses because of no resistance to shear roads in such media.
When the influences of the boundaries or shape of an object are considered,
other types of waves called the guided waves are produced. There are three types
of guided waves depending on geometry of an object: surface acoustic waves
(SAWs), plate waves, and rod waves.
SAW are defined as waves that propagate along a free surface, with
disturbance amplitude that decays exponentially with depth into the object. There
are many kinds of SAWs such as Rayleigh, Scholte, Stoneley, and Love waves
and the wave propagation characteristics of SAWs strongly depend on material
properties, surface structure, and nature at the interface of the object. When an
SAW propagates along a boundary between a semiinfinite solid and air, the wave
is often called Rayleigh wave in which the particle motion is elliptical and the
effective penetration depth is of the order of one wavelength. Among many types
of SAWs, Rayleigh wave is the most common and well-known wave so that
many researchers often call any SAWs Rayleigh wave.
When an ultrasonic wave propagates in a finite medium (like a plate),
the wave is bounded within the medium and may resonate. Such waves in an

OPTIMAL GLASS BOTTLE INSPECTION WITH ASEBI
DEPT OF ECE, CREC 37
object of finite size are called plate waves if the object has a multilayer structure,
and called Lamb waves if it has a single layer. Also, when a force is applied to
the end of a slender rod, an ultrasonic wave propagates axially along it. Wave
propagations in rodlike structures such as a thin rod and hollow cylinders have
been studied extensively. Further information on the guided waves and their
characteristics can be obtained in In general, the wave propagation
characteristics of guided waves strongly depend on not only material properties
but also the plate thickness, the rod diameter, and the frequency. The frequency
dependence of the wave velocity of guided waves is called frequency dispersion.
While the frequency dispersion often makes wave propagation behaviour
complicated, it also provides unique materials evaluations using guided waves. It
is noted that similar types of bulk and guided waves can exist for anisotropic
materials and in general, their behaviours become much more complicated than
those for isotropic materials
Ultrasonic velocity is probably the most important and widely used
parameter in ultrasonic sensing applications. Each medium has its own value of
the velocity that usually depends on not only propagation medium but also its
geometrical shape and structure. The theoretical values can be obtained from
wave equations and typically determined by the elastic properties and density of
the medium. For example, the wave equations for an isotropic solid give the
following simple formulae for the longitudinal and shear wave velocities
V l = ρ E (1+ν1)(−1ν− 2ν) (2) V S = ρ E 2(11+ν) = Gρ
where, vl and vs are the longitudinal and shear wave velocities, respectively, E
is Young’s modulus, ν is Poisson’s ratio, G is shear modulus and ρ is the density.
For most of solid materials the longitudinal wave velocity is faster than the shear
wave velocity because the shear modulus is lower than the Young’s modulus. It
is noted that Poisson’s ratio is not a dominant factor affecting the velocities. As a
rule of thumb, the velocity of the shear wave is roughly half the longitudinal
wave. Although the velocities can be determined theoretically if material
properties such as the elastic moduli and density are kno wn precisely, these
material properties are not always available for the determination because they

OPTIMAL GLASS BOTTLE INSPECTION WITH ASEBI
DEPT OF ECE, CREC 38
change depending on mechanical processing and heat treatments. Therefore, it is
important and necessary to make a calibration measurement for the velocities
when one wants to know the correct values for velocities.
8.3. ATTENUATION
When an ultrasonic wave propagates through a medium, ultrasonic
attenuation is caused by a loss of energy in the ultrasonic wave and other
reasons. The attenuation can be seen as a reduction of amplitude of the wave.
There are some factors affecting the amplitude and waveform of the ultrasonic
wave, such as ultrasonic beam spreading, energy absorption, dispersion,
nonlinearity, transmission at interfaces, scattering by inclusions and defects,
Doppler effect and so on. To characterize the ultrasonic attenuation
quantitatively, attenuation coefficient α is defined as follow.
Where A is the peak amplitude of the wave at propagation distance x, A0 is
the initial peak amplitude. The attenuation coefficient α is experimentally
determined from the variation of the peak amplitude with the propagation
distance, and it can be given in decibel per metre (dB/m) or in neper per metre
(Np/m). In general, the attenuation coefficient highly depends on frequency.
Since this frequency dependence reflects microstructures of materials, it can be
used for characterizing microscopic material properties relating to chemical
reactions and mechanical processes. Further information on the attenuation can
be obtained
Wavelength λ is the distance over which one spatial cycle of the wave
completes and the following expression can be given, λ=v/f
where V is the ultrasonic velocity and f is the frequency. Wavelength is a useful
parameter in ultrasonic sensing and evaluations. In ultrasonic detection of a
small object, the smallest size that can clearly be detected must be larger than
half a wavelength at the operating frequency. If the critical size of an object to be
detected is known, such prior information on size is helpful for selecting an
appropriate frequency for measurements.
When an ultrasonic wave perpendicularly impinges on an interface between
two media as shown in Fig.2, a part of the wave is reflected back to the medium
1 and the remainder is transmitted to the medium 2. The ratio of the amplitude of

OPTIMAL GLASS BOTTLE INSPECTION WITH ASEBI
DEPT OF ECE, CREC 39
the reflected wave AR to that of the incident wave AI is called reflection
coefficient R, and the ratio of the amplitude of the transmitted wave AT to that
of the AI is called transmission coefficient T. Considering a valance of stresses
and a continuity of velocities on both sides of the interface, the reflection and
transmission coefficients, R and T can be given as follows
R = AARI = zz1 1 +−zz22
T = AATI = 2 z1 z+1 z2
where subscripts 1 and 2 refer to the medium 1 and 2, respectively, and z is the
acoustic impedance defined as Eq. (1). It can be seen from these equations that
the maximum transmission of ultrasonic wave occurs when the impedances of
the two media are identical, and most of ultrasonic wave is reflected when the
two media have very different impedances. The reflection and transmission at
interface play an important role in designing ultrasonic sensing systems and
understanding experimental results with the ultrasonic systems.
8.4 REFRACTION AND MODE CONVERSION
When an ultrasonic wave obliquely impinges on an interface between two
media as shown in Fig.3, several things happen depending on the incident angle
of the wave as well as the material properties of the two media. One of important
things is refraction in which a transmitted wave has a different angle from the
incident. The refraction is basically caused by the velocity difference on either
side of the interface. The refraction angle can be calculated from Snell’s law if
the velocities of the two media and the incidence angle are known.
Another important phenomenon is mode conversion that is a generation of
one type of wave from another type in refraction as shown in Fig. 3. For
example, a longitudinal wave incident on an interface between liquid and solid is
transmitted partially as a refracted longitudinal wave and partially as a mode
converted shear wave in the solid.
Mode conversion can also take place on reflection if the liquid shown in
Fig. 3 is a solid. It is noted that any types of waves can be converted to another
type, e.g. from a shear wave to a longitudinal wave, and from a longitudinal
wave to a surface wave. The angles of reflection and/or refraction by mode
conversion can be calculated from Snell’s law.

OPTIMAL GLASS BOTTLE INSPECTION WITH ASEBI
DEPT OF ECE, CREC 40
a simulation result for refraction and mode conversion, calculated by a
finite difference method. We can see that an incident plane wave
(longitudinal wave) of 10º in water is refracted at the refraction angle of 43º in
steel and simultaneously converted to shear wave at refraction angle of 22º.
Refracted longitudinal wave Mode converted shear wave
TRANSDUCERS
Ultrasonic sensors are often called transducers. The function of the
transducers is to convert electrical energy into mechanical energy which directly
corresponds to ultrasonic vibration, and vice versa. The most common way of
generating and detecting ultrasonic waves utilizes the piezoelectric effect of a
certain crystalline material such as quartz. Since the piezoelectric effect is
reciprocal, it produces a deformation (a mechanical stress) in a piezoelectric
material when an electrical voltage is applied across the material, and
conversely, it produces an electrical voltage when a deformation (a mechanical
stress) is applied to the material. Thus, the piezoelectric materials can be used for
generating and detecting ultrasonic waves that are related to the mechanical
stresses.
Appropriate cuts and directions of quartz are utilized for two types of
waves, longitudinal and shear, Nowadays, many piezoelectric materials besides
quartz are available, such as barium titanate (BaTiO3), lead metaniobate
(PbNb2O3) and lead zirconate titanate (PZT), etc. The size and shape of
piezoelectric transducers have to be precisely designed depending on the desired
frequency. For industrial applications, solid-state transducers are usually used,
because of their robustness. A piezoelectric transducer consists of a piezoelectric
element, electrical connections, backing materials, front layers and a casing.
The typical construction The front layer is to protect the piezoelectric
element against external stresses and environmental influences, and also must
function as an impedance matching layer with which the transfer of ultrasonic
energy to the target medium is optimized. The backing material functions as a
damping block that alters the resonance frequency of the piezoelectric element

OPTIMAL GLASS BOTTLE INSPECTION WITH ASEBI
DEPT OF ECE, CREC 41
and deletes unwanted ultrasonic waves reflected from the back wall. The
electrical line is connected AC or DC voltage supplies that are often operated at
the resonant frequency of the piezoelectric element.
Depending on applications, other types of transducers can be available.
Piezoelectric polymers that can exhibit the piezoelectric effect, often called
PVDF (polyvinylidene fluoride), have some advantages owing to polymer
characteristics such as its low acoustic impedance and softness. Magnetostriction
effect that occurs in ferromagnetic materials is also utilized as transducers in
industries.
It should be noted that the piezoelectric and magnetostrictive effects
generally decrease with a rise in temperature and disappears at the Curie
temperature. This is a crucial limitation in use of the ultrasonic transducers.
When ultrasonic measurements are conducted at high temperatures near the
Curie temperature, precautions are necessary so that the ultrasonic transducer
does work properly. One of methods for high temperature measurements and its
applications are presented in Section 4. It is also noted in the use of the
transducers mentioned above that it is necessary to use some coupling medium
for making an effective ultrasonic energy transmission between the transducer
and specimen, as shown in Fig. 6. Gels, liquids or grease are often used as a
coupling medium. It is extremely difficult to conduct the ultrasonic
measurements without such coupling medium because of any air gap or large
acoustic impedance between the transducer and specimen surface. This is
another disadvantage of using contact-type transducers. Further information on
transducers can be obtained in
Non-contact ultrasonic measurements are of great practical interests in the
many fields of engineering. There are three kinds of non-contact methods for
generation and detection of ultrasonic waves: optical method, electromagnetic
method, and air-coupled method. Although each method has advantages and
disadvantages, they have the potential to be powerful diagnostic tools for
advanced ultrasonic sensing.

OPTIMAL GLASS BOTTLE INSPECTION WITH ASEBI
DEPT OF ECE, CREC 42
Optical methods for measuring ultrasonic waves are called laser ultrasonics
in which ultrasonic waves are generated and detected by using lasers. Laser
generation of ultrasonic waves can be recognized as exciting the waves with an
optical hammer. When a high energy pulsed laser beam is irradiated onto a
specimen surface, an interaction of the laser beam with the specimen occurs in
one or both of two distinct processes, thermoelastic and ablative. By controlling
the laser irradiation conditions, it is possible to generate any types of ultrasonic
waves such as longitudinal, shear and guided waves at a desired frequency. To
detect ultrasonic waves, a laser beam is illuminated onto the specimen surface
for the duration sufficiently long to capture the ultrasonic signal of interest.
Ultrasonic waves are then detected by measuring surface displacements caused
by ultrasonic disturbance, using a laser-assisted interferometer or other device.
Mickelson, Confocal Fabry-Perot or Photorefractive Two-wave mixing
interferometers are often utilized. The ability of laser-ultrasonics to operate at
large standoff distances provides big advantages in industrial applications such
as materials process monitoring at high temperatures. Further information on
laser ultrasonics can be obtained
Electromagnetic acoustic transducer (EMAT) is an alternative technique for
generating and receiving ultrasonic waves, with which the ultrasonic
measurements are conducted without any coupling medium between the
transducer and specimen. The EMAT consists of a stack of coils and magnets to
generate and receive ultrasonic waves in an electrically conductive material as
shown in Fig. 7. When a coil that is placed near to the surface of a specimen is
driven by a pulse current with a desired ultrasonic frequency, eddy currents will
be induced by electromagnetic induction in near surface region of the specimen.
Since a static magnetic field is present, the eddy currents will experience Lorentz
forces F of the following form
F =J×B
where J is the induced eddy currents and, B is the static magnetic field.
Interactions of the Lorentz forces with the specimen produce high frequency
vibrations resulting in generating ultrasonic waves. Since these processes are
reciprocal, the same mechanisms work to allow the ultrasonic energy to be

OPTIMAL GLASS BOTTLE INSPECTION WITH ASEBI
DEPT OF ECE, CREC 43
converted into electromagnetic energy, so that the EMAT works as a receiver as
well as a generator. The EMAT eliminates the problems associated with the
coupling medium because the electro-mechanical conversion takes place directly
within the electromagnetic skin depth of the specimen surface. Thus, EMATs
allow non-contact ultrasonic sensing for moving specimens, rough surfaces, in
vacuum and also in hazardous locations. Further information on
EMATs can be obtained
Another method for non-contact ultrasonic sensing is air-coupled
ultrasonics. In aircoupled ultrasonics, air is used as a coupling medium between
the transducer and specimen. Although air-coupling is very attractive, it has
some difficulties because of high attenuation coefficient of air and high
impedance mismatch between a transducer and air. To overcome such problem, a
specially designed transducer with an optimal impedance matching layer is
required for air-coupled ultrasonic measurements. Some piezoelectric-type air-
coupled transducers have been commercialized and used for noncontact
inspections. However, most of them have relatively low and narrow band
frequency response with which it may not be sufficient to be used in a wide
variety of applications. Recently, micro electromechanical systems (MEMS)
technology has applied to ultrasonic sensors. A capacitive type air-coupled
transducer, consisting of a metallized insulating polymer film placed upon a
contoured conducting backplate, is developed using semiconductor
manufacturing techniques [24]. This provides effective air-couple measurements
with a higher and wider band frequency, in the range 100 kHz to 2 MHz.
Utilizing such advantage, a novel noncontact method for characterizing surface
roughness of materials by air-coupled ultrasound is developed

OPTIMAL GLASS BOTTLE INSPECTION WITH ASEBI
DEPT OF ECE, CREC 44
4.5 Basics of Instrumentation
Basic construction of an ultrasonic measurement system used to generate
and detect ultrasonic waves in a specimen. The synchronization generator gives
trigger signals with high repetition rate (e.g. 1000 repetitions per second) to the
pulse generator (pulser). Using these triggers, the pulser provides electrical
voltage to the transducer so that the transducer generates ultrasonic waves at the
same repetition rate. The reflected ultrasonic waves through the specimen are
received by the same transducer and the resulting voltage of the received waves
goes to the display through the amplifier. The computer is often used to analyze
the acquired ultrasonic data.
Figure 9 shows typical configurations for transducers used to launch and
receive ultrasonic waves for ultrasonic measurements. Pulse-echo configuration
with a single transducer shown in Fig. 9(a) is most commonly used to measure
reflected waves from a flaw or the opposite side of the specimen. Through-
transmission with a two transducers shown in Fig. 9(b) is probably the second
most commonly used configuration. The third one is so-called pitch-catch
configuration in which two transducers are placed on the same side of the
specimen as shown in Fig. 9(c). This can be useful in the cases that the back wall
is not parallel to the front wall or there is diffi- culty to use normal incidence
ultrasonic beams.
In general, an ultrasonic transducer operating at a high frequency radiates a
narrow ultrasonic beam into a medium, which results in sensing over a narrow
spatial region. To cover a wider region in ultrasonic sensing, scanning techniques
are often used. Another have been applied to various nondestructive evaluations
such as inspections of industrial structures, quantitative characterizations of
materials and structural health monitoring it is still required to develop new and
more effective techniques that are applicable to advanced nondestructive
evaluations. One of industrial demands is to realize ultrasonic in-line monitoring
in a hazardous environment such as high temperatures. In this section, recent
advances showing the capabilities of using buffer rod sensors as nondestructive
tool for high temperature monitoring are presented.

OPTIMAL GLASS BOTTLE INSPECTION WITH ASEBI
DEPT OF ECE, CREC 45
Buffer Rod Sensors for High Temperature Monitoring
There are several ways for ultrasonic sensing at high temperatures: laser
ultrasonics, EMATs, high temperature transducers and buffer rod method
(known as delay-lines or waveguides). Since each technique has advantages and
disadvantages, one has to select the appropriate technique to suit the objective
depending on the application. Among the techniques, buffer rod method is a
classical and still an attractive approach because of its simplicity and low cost.
For high temperature applications of the buffer rod method, a long buffer rod is
often employed as a waveguide. A conventional piezoelectric transducer is
installed to the one end of the buffer rod and the other end is in contact with the
material to be measured.
The difficulty in ultrasonic measurements using a buffer rod is, in most
cases, caused by spurious echoes due to interference of mode converted waves,
dispersion, and diffraction within the rod of finite diameter. These spurious
echoes deteriorate the signal to noise ratio (SNR) because of their possible
interference with desired signals to be measured. To overcome such difficulty,
tapered and clad buffer rods are developed for various applications in materials
evaluations and monitoring [26]-[31]. Fig. 11 shows the exterior of one of the
developed buffer rod sensors, consisting of a tapered clad buffer rod, a cooling
pipe and a conventional ultrasonic transducer (UT). The transducer end of the
buffer rod is air cooled so that conventional room temperature UTs can be used
while the other end (probing end) is in contact with a hot medium at 800ºC.
Because of a taper shape of the buffer rod and a cladding layer of the outer
surface, the buffer rod provides high performance pulse-echo measurements with
high SNR at high temperatures. The length of the rod is possible to be up to 1000
mm.
To provide high spatial resolution measurements, a spherical concave surface
is machined at the probing end of the rod . This is expected to function as an
acoustic lens for generating and receiving focus Ultrasonic transducer Air
cooling pipe
OPTIMAL GLASS BOTTLE INSPECTION WITH ASEBI
DEPT OF ECE, CREC 46
Caused ultrasonic waves. Shows a contour plot of the acoustic field in the
vicinity of a focal zone in molten aluminium at 800ºC, where the acoustic field is
numerically examined by finite difference method. We can see that the ultrasonic
wave can be focused onto a small area comparable to a wavelength (460 µm) so
that it is expected to make high resolution measurements using the focused
buffer rod sensor. It is experimentally verified that the developed focused sensor
can successfully detect alumina particles of about 160 µm suspended in molten
aluminum Fig. 13 shows ultrasonic images obtained in molten zinc at 650ºC, by
scanning of a focused buffer rod sensor .This is probably the first ever image in a
molten metal. Surprisingly, this kind of imaging is possible even using a long
buffer rod of 1 m length. Fig. 14 shows the images obtained in water using a
short rod of 75 mm and a long rod of about 1000 mm Although the resolution of
the image using the long rod deteriorates because of an attenuation of higher
frequency components of the guided wave in the rod, it can be seen that the
ultrasonic wave can be focused onto a small spot of about one wavelength.
Using the buffer rod sensor, an attempt has been made to monitor a
solidliquid interface of aluminium alloy during unidirectional solidification at
700ºC . A solid-liquid interface of aluminium alloy is produced using a
directional solidification furnace and then the interface behaviour is monitored
during heating and cooling as the location of the interface determined from the
transit time of ultrasonic pulse echo. The growing rate of the solidification front
is estimated to be 0.12 mm/s by time-differentiating the location. The amplitude
change of the interface echo is also We can observe periodical
Oscillations in the amplitude during heating and cooling. It is tentatively
considered that these oscillations are related to the feature of solidification
instabilities such as variations in cellular structure and/or mushy zone consisting
of solid and liquid phases.
In many fields of science and engineering, there are growing demands for
measuring internal temperature distribution of heated materials. Recently, an
ultrasonic method has been applied to internal temperature monitoring [32]. The
principle of the method is based on temperature dependence of ultrasonic

OPTIMAL GLASS BOTTLE INSPECTION WITH ASEBI
DEPT OF ECE, CREC 47
velocity in materials. A single side of a silicone rubber plate of 30 mm thickness
is heated by contacting with a hot steel plate as shown in Fig. 16(a) and
ultrasonic pulse-echo measurements are then performed during heating. A
change in the transit time of ultrasonic wave in the heated rubber is monitored
and used to determine the transient variation of internal temperature gradient in
the rubber, where an inverse analysis is used to determine one-dimensional
temperature gradient. Fig. 16(b) shows the internal temperature distributions in
the silicone rubber and their variations with elapsed time. The temperature
gradient determined ultrasonically agrees well with both obtained using
commercial thermocouples installed in the rubber and estimated theoretically.
Thus, recent demonstrations shown in this section reveal that even a
classical method such as a pulse-echo method using a buffer rod sensor has the
high potential to be applicable to a novel sensing in an unexplored field.
In this chapter a brief overview of fundamentals in ultrasonic sensing is
presented. Some advanced techniques and applications to nondestrucve
evaluation are also introduced. The essentials of ultrasonic sensing are how to
drive an ultrasonic wave into an object and how to capture the ultrasonic wave
from the object. In addition, another essential is how to extract the information
we want from the captured ultrasonic wave. To accomplish these and to create a
useful sensing technique, it is indispensable to make an effective collaboration
among researchers in different fields of engineering and science such as
electrical, electronics, information, mechanical and materials. Actureally,
progress is being made in ultrasonic sensing technology. but, it should be noted
that classical techniques and methods are still attractive .
OPTIMAL GLASS BOTTLE INSPECTION WITH ASEBI
DEPT OF ECE, CREC 48
8.REFERENCES
H. Kolsky (1963) Stress Waves in Solids, Dover Publications, New York.
W. C. Elmore and M. A. Heald (1985) Physics of Waves, Dover Publications, New
York.
D. Royer and E. Dieulesaint (2000) Elastic Waves in Solids I & II, SpringerVerlag,
Berlin.
L. M. Brekhovskikh, Waves in Layered Media 2nd Edition, Academic press, New
York, 1980.
J. D. Achenbach (1990) Wave Propagation in Elastic Solids, Elasevier Science
Publisher, Amsterdam.
B. A. Auld (1990) Acoustic Fields and Waves in Solids 2nd Edition Vol. 1 & 2,
Krieger Publishing, Florida.
J. L. Rose (1999) Ultrasonic Waves in Solid Media, Cambridge University Press,
Cambridge.
G. S. Kino, Acoustic Waves (1987) Devices, Imaging and Analog Signal
Processing, Prentice-Holl, New Jersey.
R. N. Thurston and A. D. Pierce (Editors) (1999) Ultrasonic Instruments and
Devices I & II, Academic Press, San Diego.
A. Arnau (2004) Piezoelectric Transducers and Applications, Springer-Verlag,
Berlin.
E. P. Papadakis (Editor) (1999) Ultrasonic Instruments & Devices, Academic Press,
San Diego.
R. N. Thurston and A. D. Pierce (Editors) (1990) Ultrasonic Measurement Methods,
Academic Press, San Diego.
J. Krautkramer and H. Krautkramer (1990) Ultrasonic Testing of Materials 4th
Revised Edition, Springer-Verlag, Berlin.
A. Briggs, Acoustic Microscopy (1992) Clarendon Press, Oxford.
M. Levy, H. E. Bass, and R. Stern (Editors), Modern Acoustical Techniques for the
Measurement of Mechanical Properties (2001) Academic Press, San Diego.
T. Kundu (Editor) (2004) Ultrasonic Nondestructive Evaluation, CRC Press, Boca
Raton.
OPTIMAL GLASS BOTTLE INSPECTION WITH ASEBI
DEPT OF ECE, CREC 49
D. R. Raichel (2006) The Science and Applications of Acoustics 2nd Edition,
Springer Science+Business Media, New York.
L. W. Schmerr Jr. and S.-J. Song (2007) Ultrasonic Nondestructive Evaluation
Systems, Springer Science+Business Media, New York.
B. M. Lempriere (2002) Ultrasound and Elastic Waves: Frequently Asked
Questions, Academic Prerss, San Diego.
K. F. Graff (1991) Wave Motion in Elastic Solid, Dover Publications, New York.
J. -P. Monchalin (2007) Laser-Ultrasonics: Principles and Industrial Applications,
in Ultrasonic and advanced Methods for Nondestructive Testing and Materials
Characterization, chapter 4, edited by C. F. Chen, World Scientific, New Jersey,
pp.79-115.
H. M. Frost (1979) Electromagnetic-Ultrasonic Transducers: Principles, Practice,
and Applications: Physical Acoustics XIV, edited by W. P. Mason and R.
N Thurston, Academic Press, New York, pp.179-270.
M. Hirao and H. Ogi (2003) EMATS for Science and Industry, Kluwer Academic
Publishers, Boston.
D. W. Schindel, D. A. Hutchins, L. Zou, and M. Sayer (1995) The Design and
Characterization of Micromachined Air-Coupled Capacitance Transducers, IEEE
Trans. Ultrason. Ferroelec. Freq. Control. UFFC-42: 42-50.
D. D. Sukmana, and I. Ihara (2007) Quantitative Evaluation of Two Kinds of
Surface ` Roughness Parameters Using Air-Coupled Ultrasound, Jpn J. App.
Phys., 46(5B): 4508-4513.
C.-K. Jen,, J. G. Legoux, and L. Parent, Experimental Evaluation of Clad Metallic
Buffer Rods for High Temperature Ultrasonic Measurements, NDT & E
International 33, pp. 145-153, (2000)
C.-K. Jen, D. R. França, and Z. Sun, and I. Ihara (2001) Clad Polymer Buffer Rods
for Polymer Process Monitoring, Ultrasonics, 39(2): 81-89.
I. Ihara, C.-K. Jen and D. R. França (1998) Materials Evaluation Using Long Clad
Buffer Rods, Proc. IEEE Int. Ultrasonics Symp., Sendai, pp.803-809.
I. Ihara, Cheng-Kuei Jen, and D. R. França (2000) Ultrasonic Imaging, Particle
Detection and V(z) Measurements in Molten Zinc Using Focused Clad Buffer
Rods, Rev. Sci. Instrum, 71(9): 3579-3586.

OPTIMAL GLASS BOTTLE INSPECTION WITH ASEBI
DEPT OF ECE, CREC 50
I. Ihara, H. Aso, and D. Burhan (2004) In-situ Observation of Alumina Particles in
Molten Aluminum Using a Focused Ultrasonic Sensor, JSME International Journal,
47(3): 280-286.
I. Ihara, D. Burhan and Y. Seda (2005) In situ Monitoring of Solid-liquid Interface
of Aluminum Alloy using a High Temperature Ultrasonic Sensor, Jpn J. App. Phys.,
Vol.44(6B): 4370-7373.
M. Takahashi and I. Ihara (2008) Ultrasonic Monitoring of Internal Temperature
Distribution in a Heated Material, Jpn J. App. Phys., Vol.47(5B): in press.
WEBSITES:
http://abrahaminnovations.com/glassbottle.php
http://heuft.com/en/product/beverage/empty-containers/empty-bottle-inspection-heuft-
inline
http://www.krones.com/en/products/filling-technology/linear-empty-bottle-inspector.php
https://www.krones.com/downloads/linatronic_735_en.pdf
http://www.bbull.com/binternet/englisch/d1Frames_ohne_e/lfo.Pro.Details_e/lafo.Leerfla
scheninspektion._e/a1fo.Leerflaschen_e.htm
http://graphene.limited/deep-dive-into-technology-2/glass-empty-bottle-
inspecti/index.html
https://www.google.co.in/url?sa=t&rct=j&q=&esrc=s&source=web&cd=13&cad=rja&ua
ct=8&sqi=2&ved=0ahUKEwjsteSxt4nMAhUUC44KHb7PCHEQFghPMAw&url=http%
3A%2F%2Fwww.matsunae-system.com%2Fcatalog-
pdf%2FSTRATEC%2520LFI%2520735-
Empty%2520Bottle%2520Inspection.pdf&usg=AFQjCNFo21n3kZ79SHwPOOJ193lHm
zHHxQ&sig2=H7wjjNGJYxvjYIEOx4CDBw&bvm=bv.119408272,d.c2E
http://dir.indiamart.com/impcat/bottle-inspection-machine.html
http://ieeexplore.ieee.org/xpl/login.jsp?tp=&arnumber=1380507&url=http%3A%2F%2Fi
eeexplore.ieee.org%2Fxpls%2Fabs_all.jsp%3Farnumber%3D1380507
https://www.miho.de/products/davidengl.html
https://www.miho.de/company/programmengl.html

OPTIMAL GLASS BOTTLE INSPECTION WITH ASEBI
DEPT OF ECE, CREC 51