all statements that are not historical facts, including ... · all statements that are not...
TRANSCRIPT


Certain statements contained herein regarding First Majestic Silver Corp. (the “Company”) and its operations constitute
“forward-looking statements” within the meaning of the United States Private Securities Litigation Reform Act of 1995 and
applicable Canadian securities legislation.
All statements that are not historical facts, including without limitation, statements regarding future estimates, plans,
forecasts, projections, objectives, assumptions, expectations or beliefs of future performance, are “forward-looking
statements”.
We caution you that such “forward-looking statements” involve known and unknown risks and uncertainties that could
cause actual and future events to differ materially from those anticipated in such statements.
Such risks and uncertainties include fluctuations in precious metal prices, unpredictable results of exploration activities,
uncertainties inherent in the estimation of mineral reserves and resources, fluctuations in the costs of goods and services,
problems associated with exploration and mining operations, changes in legal, social or political conditions in the
jurisdictions where the Company operates, lack of appropriate funding and other risk factors, as discussed in the
Company’s filings with the Canadian and United States Securities regulatory agencies.
Resource and production goals and forecasts may be based on data insufficient to support them. Ramon Mendoza, P. Eng.,
Vice President of Technical Services and Jesus Velador, Ph.D., Regional Exploration Manager are certified Qualified
Persons (“QP”) for the Company. The Company expressly disclaims any obligation to update any “forward-looking
statements”.
2

~70% of revenue from Silver (18% Au, 10% Pb, 2% Zn)
World’s largest silver producing country
Six producing silver mines; 100% ownedMulti-Asset Producer
Pure Silver Producer
Two advanced stage silver projects
Achieve annual production of 20M+ Ag oz
One Country: Mexico
Future Growth
Goal
3

4.7M shares ~ US$33M
4
Market Capitalization: US$1.2B
Cash & Cash Eqv: US$120.8M
Shares Outstanding: 165.7M (FD 175.9M)
3M Avg. Daily Volume:(NYSE & TSX)
Production Growth Cost Reductions
Shareholders:

5
• ~ 3,900 direct employees
• Internally design, develop and construct 100%
of our silver projects
• Awarded ‘Socially Responsible
Company’ for nine consecutive
years, 2008 to 2016, from the
Centro Mexicano para la Filantropia
(CEMEFI)
BROAD DEPTH OF PEOPLE

6
Q/Q Y/Y Full Year
2016(All shown in $USD) Q3 2017 Q2 2017 Q3 2016
Revenue 61.9M 60.1M 79.3M 278.1M
Mine Operating Earnings 3.2M 1.4M 20.0M 49.2M
Net Earnings after taxes (1.3M) 1.4M 8.1M 8.6M
Earnings per share - Adjusted1 0.00 (0.02) 0.07 0.12
Operating Cash Flows, before movements in WC 17.7M 18.0M 35.4M 107.3M
Cash Flow per share 0.11 0.11 0.22 0.67
Working Capital 126.3M 130.9M 143.8M 130.6M
Cash and Cash equivalents 120.8M 126.9M 122.5M 129.0M
Avg. Realized Silver price per oz ($/eq. oz) 17.11 17.17 19.72 17.16
(1) Adjusted earnings per share (a non-GAAP measure) after removing non-cash and non-recurring items

7
IN PRODUCTION
La Encantada
La Parrilla
San Martin
La Guitarra
Del Toro
Santa Elena
3
3
2
1
1
2
5
5 8
8
4
4
7
PROJECTS
Plomosas
La Luz
7
6
6
9
9
EXPLORATION
La Joya

8
0
5
10
15
20
25
30
2006 2007 2008 2009 2010 2011 2012 2013 2014 2015 2016 2017E 2-4 YearGoal
Silver Ounces Only
Silv
er
Eq
v. O
un
ces
(M)

9
Mine Silver Oz (M) Silver Eqv Oz (M) Cash Costs ($) AISC ($)
Santa Elena 1.7 4.3 1.93 5.29
La Encantada 1.7 1.7 12.03 14.42
La Parrilla 1.3 1.9 11.08 16.50
Del Toro 0.9 1.9 4.10 9.18
San Martin 1.3 1.7 6.35 8.79
La Guitarra 0.4 0.7 11.66 19.43
Totals: 7.4 12.1 $7.51 $14.10
*Certain amounts shown may not add exactly to the total amount due to rounding differences.
*The following prices were used in the calculation of silver equivalent ounces: Silver: $17.16 per ounce; Gold: $1,252 per ounce; Lead:
$1.02 per pound; Zinc $1.26 per pound.

10
Mine Silver Oz (M) Silver Eqv Oz (M) Cash Costs ($) AISC ($)
Santa Elena 2.2 - 2.3 5.2 - 5.5 2.58 - 2.85 6.23 - 6.71
La Encantada 2.3 - 2.5 2.3 - 2.5 11.06 - 12.23 14.68 - 16.07
La Parrilla 1.8 - 1.9 2.5 - 2.7 9.36 - 10.35 14.37 - 15.65
Del Toro 1.3 - 1.4 2.5 - 2.7 3.33 - 3.68 9.32 - 10.00
San Martin 1.7 - 1.8 2.2 - 2.3 6.04 - 6.68 9.46 - 10.29
La Guitarra 0.6 - 0.7 0.9 - 1.0 10.83 - 11.97 19.64 - 21.28
Totals: 10.0 – 10.6 15.7 – 16.6 $7.00 – $7.75 $14.40 – $15.50*
Metal price assumptions for calculating equivalents are: silver: $17.00/oz, gold: $1,250/oz, lead: $1.00/lb, zinc: $1.25/lb.
Currency exchange assumption for costs are: 18:1 MXN:USD
*Consolidated AISC includes corporate general & administrative expense of $1.75 to $1.85 per ounce, share-based payments expense of $0.83 to
$0.88 per ounce and accretion of decommissioning liabilities of $0.09 to $0.10 per ounce
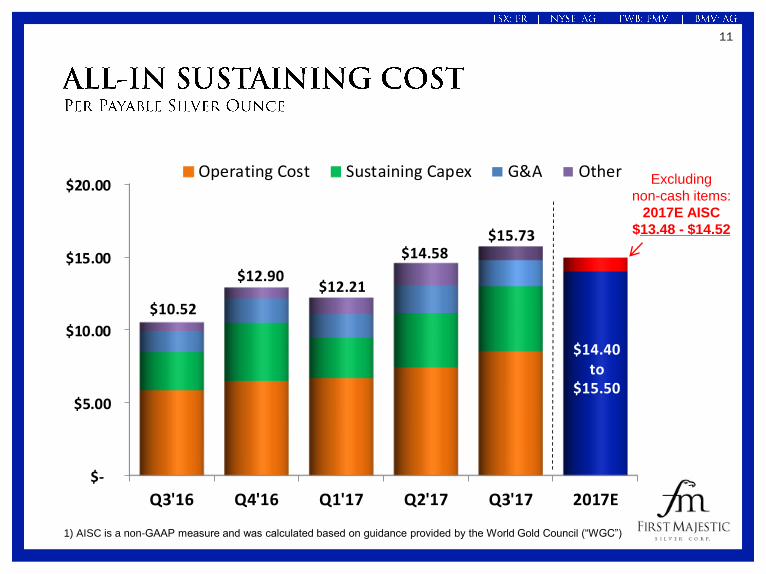
11
1) AISC is a non-GAAP measure and was calculated based on guidance provided by the World Gold Council (“WGC”)
Excluding
non-cash items:
2017E AISC
$13.48 - $14.52
$-
$5.00
$10.00
$15.00
$20.00
Q3'16 Q4'16 Q1'17 Q2'17 Q3'17 2017E
Operating Cost Sustaining Capex G&A Other
$12.21$12.90
$15.73
$14.40 to
$15.50
$14.58
$10.52

12
$61M Expansionary
$44M - U/G Development
$22M - Exploration
$37M - PP&E
$4M - Corporate Projects
$46M Sustaining
2017E CAPEX include:

13
2P
Silv
er
Ounces (
M)
Explo
ration M
etr
es
Also produced 61M oz of Silver over this period
Our largest drill
program ever!

14
2017 Total Capital Budget: $107M
2017 Capital Budget Producing Mines
Non-Producing Mines
Other
(*CAPEX US$) Exploration Development PP&E Total
La Encantada 2M 6M 13M 21M
Santa Elena 3M 11M 6M 20M
La Parrilla 4M 7M 5M 16M
La Guitarra 3M 7M 4M 15M
San Martin 3M 4M 5M 13M
Del Toro 2M 6M 4M 12M
Total 18M 42M 37M 97M
Exploration Development PP&E Total
Plomosas 3M 2M 1M 6M
Other, Corporate Projects (R&D) 4M
*Certain amounts shown may not add exactly to the total amount due to rounding differences.

15
Kiln BarrelMain DriveRotary Dryer
Key Metrics
Base Case*
Tailings Life (LOM) 6.2 years
Throughput 2,000 tpd
LOM Avg. Grade 110 g/t
LOM Avg. Recovery 64%
LOM Avg. Production 1.5M oz/yr
LOM Total Production 9.3M oz
Costs and Capital
Processing Costs $24 tonne
Project Capex $9.0M
Economics
Silver Price $15 oz
IRR 42%
NPV(5%) $12.0M
*Based on 4.1M tonnes of current
above ground tails
Exhaust
Fans
Feeding
System
Blowers
Plates
Cooler
Dust
Collectors
Roasting
Furnace
Cyclones
To
Cyanidation
Dryer

16
Lime feed pH monitoringCyanide
consumptionMill & Grind optimization
Oxygen Injection
Microbubbles &
Fine Grinding
Target Recovery
Goal = 90%
Every 1% increase ~ 100K Ag oz

17
• Improves the metallurgical performance of our
plants by pairing fine grinding and microbubbles
• Pilot test results showed silver recoveries from
flotation improve 5% to 10%
• Installation expected to begin at Del Toro, La
Parrilla, La Guitarra and San Martin in 2018
Typical Flotation
BubblesMicrobubbles
Microbubble test column

18
100 Year Old Ball Mill
Vertical Mill
Ancient Technology Cutting Edge

19
1) Revenue forecasts calculated using BMO metal price assumptions of $17.29/oz silver, $1,216/oz gold, $2.64/lb
copper, $1.07/lb lead and $1.43/lb zinc.
2) Source: BMO
Our Silver purity is INCREASING to 75% in 2018 with the La Encantada Roaster

20
AG +36%
AU -24%
AG +182%
AU +69%
AG +407%
AU +105%
AG ?
AU ?
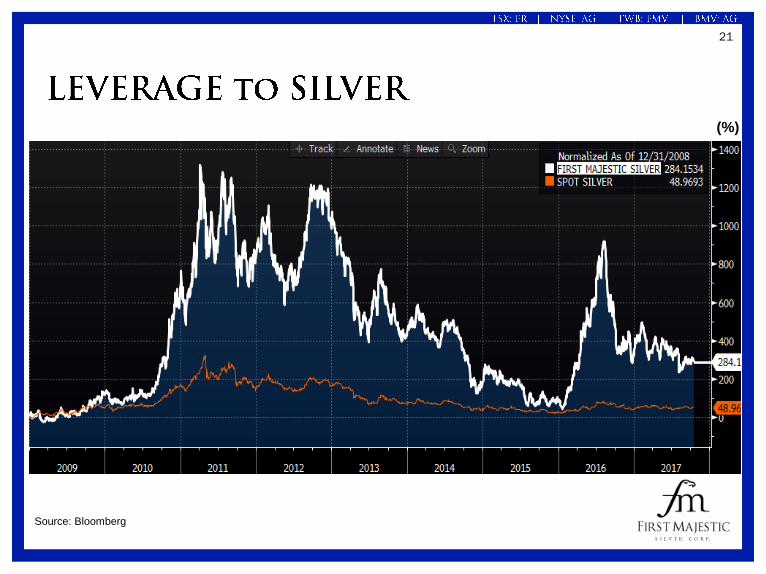
21
Source: Bloomberg
(%)

22
Commissioning of roasting circuit at La Encantada -
expected to add 1.5 million Ag ounces per year
La Guitarra expansion decision to 1,000 tpd
Continued improvements in metallurgical recoveries
through implementation of microbubbles, fine grinding
& other R&D
Connection to power grid at Santa Elena to reduce
operating costs
Completion of underground haulage system at La
Parrilla aimed to further reduce costs and the potential
for future expansion
Exploration discovery potential at Plomosas and Santa
Elena’s Ermitaño West property

23
Our Strategy…
One Metal
One Country
Continue to Acquire the Best Talent in Mexico
Build through Development and Acquisitions
Become a 20+ Million Ounce Producer


25
Natural Gas Generators

26
Research Coverage
Bank of Montreal - Andrew Kaip
Cormark - Richard Gray
Echelon Wealth Partners - Matt O'Keefe
National Bank Financial - Shane Nagle
Raymond James - Chris Thompson
Rodman & Renshaw- Heiko Ihle
Scotiabank - Ovais Habib
Toronto-Dominion - Daniel Earle
Institution % S/O
Van Eck (GDXJ) 7.1%
Van Eck (GDX) 4.3%
The Vanguard Group 2.1%
Connor Clark & Lunn 1.9%
Blackrock 1.4%
Dimensional Fund Adv. 1.3%
Global X 1.2%
Gluskin Sheff & Asso. 1.2%
M&G Investment 0.9%
TD Asset Mgmt 0.8%

27
• Undergoing electrical power
analysis to reduce future energy
costs
• Recently doubled land package to
101,837 hectares with purchase of
El Gachi property
• 100% Gold/Silver doré producer
Plant Operations
Mill Throughput:
2017E Production:
2017E AISC:
Reserves & Resources
Proven & Probable:
Measured & Indicated:
Inferred:
*M&I Resources are inclusive of Reserves
2,750 tpd
2.2M – 2.3M Ag oz
(5.2M – 5.5M AgEq oz)
$6.23 - $6.71
11.1M Ag + 174K Au oz
12.9M Ag + 209K Au oz
2.0M Ag + 39K Au oz
Quarter End Full Year
2016Q3 2017 Q2 2017 Q3 2016
Silver production (oz) 560,054 557,914 671,423 2,598,537
Silver eqv. production (oz) 1,503,376 1,399,940 1,430,506 6,185,945
Silver grade (g/t) 83 83 95 92
Gold grade (g/t) 1.7 1.6 1.5 1.6
Cash costs / oz ($US) $1.39 $2.86 ($2.86) ($2.09)
All-in Sustaining cost / oz ($US) $4.65 $6.64 $1.81 $1.75

28
• Recently installed natural gas
generators – currently supplying 90%
of power requirements
• Installing new roasting circuit to
reprocess tailings – expected to add
1.5M Ag oz per year starting in 2018
• 100% Silver doré producer
Quarter End Full Year
2016Q3 2017 Q2 2017 Q3 2016
Silver production (oz) 609,138 374,901 685,478 2,706,516
Silver eqv. production (oz) 610,307 375,563 687,841 2,713,372
Silver grade (g/t) 136 120 145 164
Cash costs / oz ($US) $12.47 $13.59 $12.41 $11.21
All-in Sustaining cost / oz ($US) $14.98 $17.95 $13.85 $12.76
Plant Operations
Mill Throughput:
2017E Production:
2017E AISC:
Reserves & Resources
Proven & Probable:
Measured & Indicated:
Inferred:
*M&I Resources are inclusive of Reserves
3,000 tpd
2.3M – 2.5M Ag oz
$14.68 – $16.07
31.0M Ag oz
31.9M Ag oz
5.8M Ag oz

29
• Connecting the mines with an
underground 5 kilometre modern ore
haulage system
• Expected cash cost reduction and
potential for further expansion
• Large land package consisting of
69,478 hectares covering several old
mines
Quarter End Full Year
2016Q3 2017 Q2 2017 Q3 2016
Silver production (oz) 424,358 425,060 547,913 2,220,874
Silver eqv. production (oz) 612,116 593,852 739,026 3,388,434
Silver grade (g/t) 132 131 146 140
Cash costs / oz ($US) $12.26 $11.15 $7.33 $7.58
All-in Sustaining cost / oz ($US) $18.85 $17.12 $9.43 $10.47
Plant Operations
Mill Throughput:
2017E Production:
2017E AISC:
Reserves & Resources
Proven & Probable:
Measured & Indicated:
Inferred:
*M&I Resources are inclusive of Reserves
1,500 tpd
1.8M – 1.9M Ag oz
(2.5M – 2.7M AgEq oz)
$14.37– $15.65
11.5M Ag oz
13.0M Ag oz
32.3M Ag oz

30
• Currently produces a silver-lead
concentrate
• Significant cash flow generator and
low cost operation
• Metallurgical recoveries continue to
improve for silver and lead
Quarter End Full Year
2016Q3 2017 Q2 2017 Q3 2016
Silver production (oz) 233,015 365,323 446,137 1,500,951
Silver eqv. production (oz) 472,804 712,714 707,524 2,649,326
Silver grade (g/t) 149 173 195 171
Cash costs / oz ($US) $6.41 $3.99 $7.90 $5.73
All-in Sustaining cost / oz ($US) $12.92 $7.93 $10.05 $8.62
Plant Operations
Mill Throughput:
2017E Production:
2017E AISC:
Reserves & Resources
Proven & Probable:
Measured & Indicated:
Inferred:
*M&I Resources are inclusive of Reserves
1,000 tpd
1.3M – 1.4M Ag oz
(2.5M – 2.7M AgEq oz)
$9.32 - $10.00
9.7M Ag oz
15.6M Ag oz
24.4M Ag oz

31
• 100% Silver/Gold doré producer
• Low cost, long mine life operation
• Property consists of 33 mining claims
within 38,512 hectares
Plant Operations
Mill Throughput:
2017E Production:
2017E AISC:
Reserves & Resources
Proven & Probable:
Measured & Indicated:
Inferred:
*M&I Resources are inclusive of Reserves
1,000 tpd
1.7M – 1.8M Ag oz
(2.2M – 2.3M AgEq oz)
$9.46 - $10.29
17.2M Ag oz
21.9M Ag oz
32.6M Ag oz
Quarter End Full Year
2016Q3 2017 Q2 2017 Q3 2016
Silver production (oz) 471,893 425,645 500,441 1,902,963
Silver eqv. production (oz) 604,686 577,598 562,096 2,209,035
Silver grade (g/t) 243 234 246 241
Gold grade (g/t) 0.8 1.0 0.4 0.5
Cash costs / oz ($US) $7.11 $5.43 $8.67 $7.07
All-in Sustaining cost / oz ($US) $10.03 $7.53 $10.20 $9.40

32
Large 39,714-hectare property
Plant Operations
Mill Throughput:
2017E Production:
2017E AISC:
Reserves & Resources
Proven & Probable:
Measured & Indicated:
Inferred:
*M&I Resources are inclusive of Reserves
400 tpd
0.6M – 0.7M Ag oz
(0.9M – 1.0M AgEq oz)
$19.64 - $21.28
9.1M Ag + 49K Au oz
9.8M Ag + 53K Au oz
6.3M Ag + 31K Au oz
Quarter End Full Year
2016Q3 2017 Q2 2017 Q3 2016
Silver production (oz) 117,504 138,345 263,235 923,597
Silver eqv. production (oz) 182,986 229,276 397,627 1,523,688
Silver grade (g/t) 187 188 252 228
Gold grade (g/t) 1.4 1.8 2.0 2.2
Cash costs / oz ($US) $19.02 $12.65 $5.93 $7.23
All-in Sustaining cost / oz ($US) $31.55 $19.51 $10.34 $13.33

(1) Mineral Reserves have been classified in accordance with the Canadian Institute of Mining, Metallurgy and Petroleum (“CIM”) Definition Standards on Mineral
Resources and Mineral Reserves, whose definitions are incorporated by reference into NI 43-101.
(2) Metal prices considered for Mineral Reserves estimates were $18.00 /oz Ag, $1,250 /oz Au, $1.00 /lb Pb, and $1.15 /lb Zn.
(3) The Mineral Reserves information provided above for La Encantada, La Parrilla, Del Toro, San Martín, La Guitarra and Santa Elena is based on internal estimates
prepared as of December 31, 2016. The information provided was reviewed and validated by the Company’s internal Qualified Person, Mr. Ramon Mendoza Reyes,
P.Eng., who has the appropriate relevant qualifications, and experience in mining and reserves estimation practices.
(4) Silver-equivalent grade is estimated considering: metal price assumptions, metallurgical recovery for the corresponding mineral type/mineral process and the metal
payable of the corresponding contract of each mine. Estimation details are listed in each mine section of the 2016 Annual Information Form.
(5) The cut-off grades and modifying factors used to convert Mineral Reserves from Mineral Resources are different for all mines. The cut-off grades and factors are
listed in each mine section of the 2016 Annual Information Form.
33

Measured and Indicated Mineral Resources are reported inclusive of Mineral Reserves)
34
*See footnotes on next page

35
(1) Mineral Resources have been classified in accordance with the CIM Definition Standards on Mineral Resources and Mineral Reserves, whose definitions are incorporated by reference into NI 43-101.(2) In all cases, metal prices considered for Mineral Resource estimates were $19.00 /oz Ag, $1,300 /oz Au, $1.00 /lb Pb, and $1.20 /lb Zn.(3) The Mineral Resources information provided above for La Parrilla, Del Toro and San Martín is based on internal estimates prepared as of December 31, 2016. The information provided was reviewed and validated by the Company’s internal Qualified Person, Mr. Jesus M. Velador Beltran, MMSA, QP Geology, who has the appropriate relevant qualifications, and experience in geology and resource estimation.(4) Mineral Resource estimates for La Guitarra are based on information contained in the 2015 Technical Report compiled by First Majestic with contribution of Amec Foster Wheeler Americas Ltd. which were updated by First Majestic with information to 31 December, 2016.(5) Mineral Resource estimates for La Encantada are based on information contained in the 2016 Technical Report compiled by First Majestic with contribution of Amec Foster Wheeler Americas Ltd. which were updated by First Majestic with information to 31 December, 2016.(6) Mineral Resource estimates for Santa Elena are internal estimates based on the 2014 Update to Santa Elena Pre-Feasibility Study Technical Report compiled by SilverCrest and re-addressed to First Majestic in October, 2015. These estimates were reviewed and validated by the Company’s internal Qualified Person, Mr. Jesus M. Velador Beltran, MMSA, QP Geology(7) Silver-equivalent grade is estimated considering: metal price assumptions, metallurgical recovery for the corresponding mineral type/mineral process and the metal payable of the corresponding contract of each mine. Estimation details are listed in each mine section of the 2016 Annual Information Form.(8) The cut-off grades for Mineral Resources are different for all mines. The cut-off grades are listed in each mine section of the 2016 Annual Information Form.(9) Measured and Indicated Mineral Resources are reported inclusive of Mineral Reserves.

36
(1) Plomosas historical estimates figures are taken from Grupo México’s estimates prepared in 2001.(2) Tonnage is expressed in thousands of tonnes, metal content is expressed in thousands of ounces.(3) The Company’s Qualified Persons have not done sufficient work to classify the historical estimates as current Mineral Resources or Mineral Reserves and have beencoordinating the work for the verification of the information supporting the historical estimates at Plomosas. The historical estimates at Plomosas do not conform to NI 43-101for reporting purposes; as such, the Company is not treating these historical estimates as current Mineral Reserves or Mineral Resources. Since the historical estimates do nothave demonstrated current economic viability, these estimates should not be relied upon until the verification process and due diligence in progress by the Company's QualifiedPerson is completed.(4) In order to verify or upgrade the historical estimates, the Company has started a diamond drilling program at the Rosario and San Juan mines. The drilling program isdesigned to confirm the historical estimates reported by Grupo México and will allow the Company to plan a second exploration program focused on locating extensions of theknown mineralization. Other work required to verify the historical estimates as current includes, but it is not limited to: re-survey of underground workings, re-survey ofavailable exploration drill-hole monuments, review of drilling, sampling and assays databases, and the re-assessment of the estimates following CIM Estimation of MineralResources and Mineral Reserves Best Practice Guidelines and CIM Definition Standards on Mineral Resources and Mineral Reserves.
La Luz Historical Estimates
Plomosas Historical Estimates
(1) The La Luz resource estimates are taken from the Real de Catorce Property Technical Report dated July 25, 2008 and the Real de Catorce Property Technical
Report dated July 30, 2007. The Company’s Qualified Persons consider that those reports do not reflect current economic conditions and are working on applying
similar economic inputs to the La Luz Silver Project to those applied to the other properties.
(2) Tonnage is expressed in thousands of tonnes, metal content is expressed in thousands of ounces.
(3) The Company’s Qualified Persons have not done sufficient work to classify the historical estimates as current Mineral Resources or Mineral Reserves and have
been coordinating the work for the verification of the information supporting the historical estimates at La Luz. The historical estimates at La Luz do not conform to
NI 43-101 for reporting purposes; as such, the Company is not treating these historical estimates as current Mineral Reserves or Mineral Resources. Since the
historical estimates do not have demonstrated current economic viability, these estimates should not be relied upon until the verification process and due diligence
in progress by the Company's Qualified Person is completed.
(4) In order to verify or upgrade the historical estimates, the Company will need to implement a diamond drilling program at the La Luz mines. The drilling program
is designed to confirm the historical estimates reported in previous Technical reports and will allow the Company to plan a second exploration program focused on
locating extensions of the known mineralization. Other work required to verify the historical estimates as current includes, but it is not limited to: re-survey of
underground workings, re-survey of available exploration drill-hole monuments, review of drilling, sampling and assays databases, and the re-assessment of the
estimates following CIM Estimation of Mineral Resources and Mineral Reserves Best Practice Guidelines and CIM Definition Standards on Mineral Resources and
Mineral Reserves.
Project Category Mineral Type k tonnes Ag (g/t) Au (g/t) Pb (%) Zn (%) Ag (k Oz) Ag-Eq (k Oz)
PLOMOSASNot in accordance with
CIM Standards Sulphides (UG) 896 192 0.8 2.1 3.4 5,500 11,000
Project Category Mineral Type k tonnes Ag (g/t) Au (g/t) Pb (%) Zn (%) Ag-Eq (g/t) Ag (k Oz) Ag-Eq (k Oz)
LA LUZNot in accordance with
current CIM standards Oxides and Sulphides 5,005 204 - - - 204 32,836 32,836