all in sustaining cost reporting – gold industry’s new ... may 6 2013.pdf · all in sustaining...
TRANSCRIPT
All In Sustaining Cost Reporting – Gold Industry’s New Standard?
Denver Gold Group Luncheon May 6, 2013 - Toronto
Brian Christie VP Investor Relations

agnicoeagle.com
FORWARD LOOKING STATEMENTS
The information in this document has been prepared as at May 6, 2013. Certain statements contained in this document constitute “forward-looking statements” within the meaning of the United States Private Securities Litigation Reform Act of 1995 and forward looking information under the provisions of Canadian provincial securities laws. When used in this document, the words “anticipate”, “expect”, “estimate”, “forecast”, “will”, “planned”, and similar expressions are intended to identify forward-looking statements or information.
Such statements include without limitation: statements regarding timing and amounts of capital expenditures and other assumptions; estimates of future reserves, resources, mineral production, optimization efforts and sales; estimates of mine life; estimates of future internal rates of return, mining costs, cash costs, minesite costs and other expenses; estimates of future capital expenditures and other cash needs, and expectations as to the funding thereof; statements and information as to the projected development of certain ore deposits, including estimates of exploration, development and production and other capital costs, and estimates of the timing of such exploration, development and production or decisions with respect to such exploration, development and production; estimates of reserves and resources, and statements and information regarding anticipated future exploration; the anticipated timing of events with respect to the Company’s mine sites and statements and information regarding the sufficiency of the Company’s cash resources. Such statements and information reflect the Company’s views as at the date of this document and are subject to certain risks, uncertainties and assumptions, and undue reliance should not be placed on such statements and information. Many factors, known and unknown could cause the actual results to be materially different from those expressed or implied by such forward looking statements and information. Such risks include, but are not limited to: the volatility of prices of gold and other metals; uncertainty of mineral reserves, mineral resources, mineral grades and mineral recovery estimates; uncertainty of future production, capital expenditures, and other costs; currency fluctuations; financing of additional capital requirements; cost of exploration and development programs; mining risks; community protests; risks associated with foreign operations; governmental and environmental regulation; the volatility of the Company’s stock price; and risks associated with the Company’s byproduct metal derivative strategies. For a more detailed discussion of such risks and other factors that may affect the Company’s ability to achieve the expectations set forth in the forward-looking statements contained in this document, see the Company’s Annual Report on Form 20-F for the year ended December 31, 2012, as well as the Company’s other filings with the Canadian Securities Administrators and the U.S. Securities and Exchange Commission. The Company does not intend, and does not assume any obligation, to update these forward-looking statements and information. Alain Blackburn, a Qualified Person and the Company’s Senior Vice-President, Exploration, reviewed the technical information disclosed herein. For a detailed breakdown of the Company’s reserve and resource position see the February 13, 2013 press release on the Company’s website. That press release also lists the Qualified Persons for each project.

agnicoeagle.com
NOTES TO INVESTORS
Note Regarding the Use of Non-GAAP Financial Measures
This document presents estimates of future “total cash cost per ounce” and “minesite cost per tonne” that are not recognized measures under United States generally accepted accounting principles (“US GAAP”). This data may not be comparable to data presented by other gold producers. These future estimates are based upon the total cash costs per ounce and minesite costs per tonne that the Company expects to incur to mine gold at the applicable projects and do not include production costs attributable to accretion expense and other asset retirement costs, which will vary over time as each project is developed and mined. It is therefore not practicable to reconcile these forward-looking non-GAAP financial measures to the most comparable GAAP measure. A reconciliation of the Company’s total cash cost per ounce and minesite cost per tonne to the most comparable financial measures calculated and presented in accordance with US GAAP for the Company’s historical results of operations is set forth in the notes to the financial statements included in the Company’s Annual Information Form and Annual Report on Form 20-F, for the year ended December 31, 2012, as well as the Company’s other filings with the Canadian Securities Administrators and the SEC. All-in sustaining cost is a non-GAAP measure. The Company calculates all-in sustaining costs as the sum of total cash costs (net of byproduct credits), sustaining capital expense, corporate, general and administrative expense (net of stock option expense) and exploration expense. The Company’s methodology for calculating all-in sustaining costs may not be similar to methodology used by other gold producers that disclose all-in sustaining cost. The Company may change the methodology it uses to calculate all-in sustaining costs in the future, including in circumstances where the World Gold Council adopts formal industry guidelines regarding this measure.
Note Regarding Production Guidance
The gold production guidance is based on the Company’s mineral reserves but includes contingencies and assumes metal prices and foreign exchange rates that are different from those used in the reserve estimates. These factors and others mean that the gold production guidance presented in this disclosure does not reconcile exactly with the production models used to support these mineral reserves.

agnicoeagle.com
AGENDA
• Evolution of cost per ounce reporting • Gold Institute Production Cost Standard • The move to All In Sustaining Costs (AISC) • Definition of AISC • Strengths & weaknesses of AISC • Other options (Full and Complete cost reporting) • Conclusions

agnicoeagle.com
EVOLUTION OF GOLD COST STANDARDS
$0
$200
$400
$600
$800
$1,000
$1,200
$1,400
$1,600
$1,800
1976 1978 1980 1982 1984 1986 1988 1990 1992 1994 1996 1998 2000 2002 2004 2006 2008 2010 2012
Gold Price US$/oz
Gold Institute Founded
National Mining
Association takes over
Gold Institute WGC
Established
Deferred Stripping
Accounting
Gold Fields introduces concept of Notional Cash
Expenditure
Gold Institute Production Cost Standard Adopted
Industry adopts AISC

agnicoeagle.com
GOLD INSTITUTE PRODUCTION COST STANDARD
• Adopted in 1996 - one of the first attempts at standardizing cost reporting
• Basically the cost of mining an ounce of gold and selling it
• “Deferred stripping accounting” encouraged in 2002 to standardize the cost
of waste stripping at open pit mines
• Fails to accurately account for all the costs associated with production.

agnicoeagle.com
GOLD INSTITUTE PRODUCTION COST STANDARD
Formal Definition Per Ounce of Gold
Direct mining expenses $XXX Stripping and mine development adjustments XXX Third-party smelting, refining and transport costs XXX By-product credits (deduct) (XXX) Other XXX Cash Operating Costs XXX
Royalties (not-profit based) XXX Production taxes XXX Total Cash Costs XXX
Depreciation XXX Depletion & Amortization XXX Reclamation & mine closure XXX Total Production Costs XXX
agnicoeagle.com
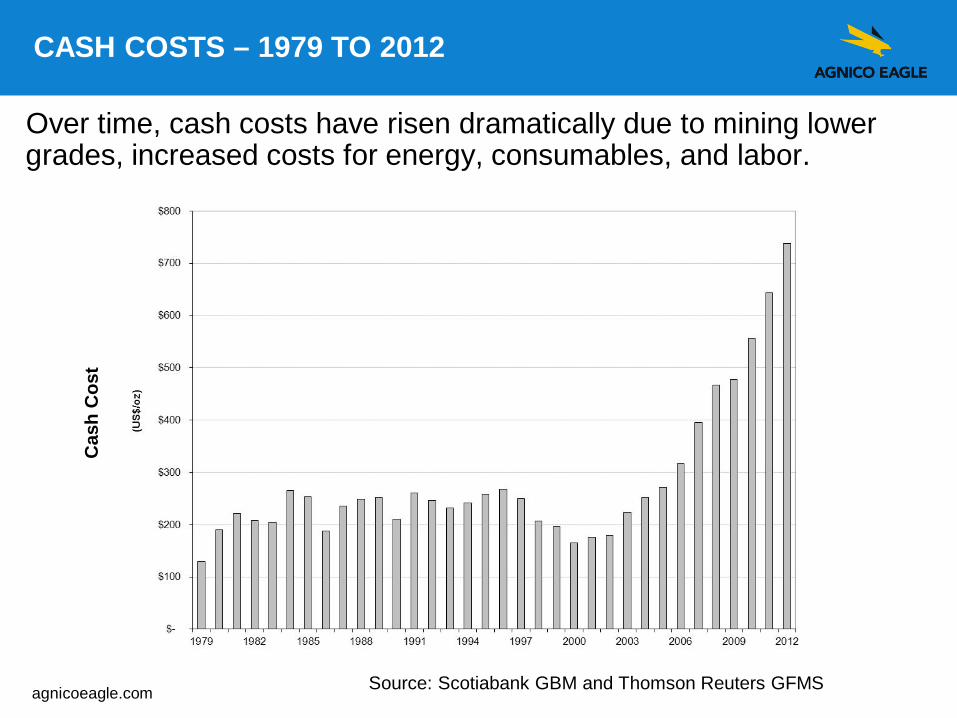
CASH COSTS – 1979 TO 2012
Over time, cash costs have risen dramatically due to mining lower grades, increased costs for energy, consumables, and labor.
Cas
h C
ost
Source: Scotiabank GBM and Thomson Reuters GFMS

agnicoeagle.com
CURRENT MOVE TO ALL IN COST REPORTING
• Despite a strong gold price environment, the equities have generally underperformed bullion
• Underperformance is due to AISC increasing in line with gold price – little profit margin expansion.
• AISC provides investors with better visibility into the true cost of producing gold (i.e. true margins).
• AISC also shows governments that company’s are not as profitable as indicated by cash costs alone (this could ease pressure for higher royalties and taxes).
• For equities to outperform bullion, companies will likely need to show strong free cash flow generation (AISC will have to decline over time).

agnicoeagle.com
IS AISC A “REVOLUTIONARY” NEW CONCEPT?
• No, not really. • Many analysts were already using this concept to derive their long
term gold prices. • Many companies were already reporting data to calculate AISC. • Gold Fields introduced the concept of “Notional Cash
Expenditure (NCE)” per ounce in May 2008. • However a universal formula needs to be presented.

agnicoeagle.com
USING ALL IN COSTS TO FORECAST LONG TERM PRICES
• Many analysts have been using their own formulas to set their long term gold price for years.
• In October 2012, Desjardins Capital Markets calculated that the average all in production cost for producers >500,000 ozs/year was ~ $1,100/oz.
• Their cost calculation was based on:
Total Cash Cost + Depreciation (as a proxy for sustaining capital) + Exploration Expense + G&A Expense.
• On this basis, their long term gold price was $1,250/oz
agnicoeagle.com
NOTIONAL CASH EXPENDITURE (NCE)
• Notional Cash Expenditure (NCE) per ounce is defined as: Operating Costs + Capital Expenditures. • Shows how much free cash flow is generated before taxation and
green fields exploration. • Gold Fields felt that NCE “addresses the demand of the investing
community to generate real returns.”

agnicoeagle.com
AGNICO EAGLE’S DEFINITION OF AISC
• Many companies have reported their version of AISC, although some are waiting for the WGC to establish formal guidelines.
• Agnico Eagle defines AISC as: Total Costs (net of by-product credits) + Sustaining Capital + Corporate, General and Administrative expense (net of stock option expense) + Exploration expense • For 2013, Agnico Eagle’s AISC is forecast to be $1,110/oz
All-in Sustaining cost is a non-GAAP measure. The Company's methodology for calculating all-in sustaining costs may not be similar to methodology used by other gold producers that disclose all-in sustaining cost. The Company may change the methodology it uses to calculate all-in sustaining costs in the future, including in circumstances where the World Gold Council adopts formal industry guidelines regarding this measure.
1
1

agnicoeagle.com
COMPONENTS OF AGNICO EAGLE’S AISC
• By-product credits: all other metals produced as part of the gold
mining process.
• Sustaining Capital: capital required to sustain existing production
levels.
• Corporate G&A: does not include stock based compensation.

agnicoeagle.com
2013 AISC FOR MAJOR GOLD PRODUCERS
Source: Company reports
Company Mkt Cap 2013 2013 2013 C$B Production Cash Costs AISC
May 3/13 Mozs US$/oz US$/oz Goldcorp 23.3 2.55 - 2.80 700 -750 1,000 - 1,100 Barrick Gold 19.6 7.00 - 7.40 610 - 660 950 - 1,050 Newmont Mining 16.2 4.80 - 5.10 675 - 750 1,100 - 1,200 Yamana Gold 8.9 1.44 - 1.60 365* 800 Randgold 7.3 0.90 - 0.95 700 - 750 1,000 Kinross 6.1 2.30 - 2.40 690-740 1,100 - 1,200 Agnico Eagle Mines 5.5 0.97 -1.01 735 -785 1,110 Eldorado Gold 5.4 0.71 - 0.76 575 - 590 1,010 Goldfields** 5.2 1.83 -1.90 860 1,360
Centerra 0.9 0.61 - 0.66 406-443 1,067-1,164
Average 672 1,086
* per GEO ** Estimates exclude Sibanye Gold

agnicoeagle.com
AISC BY COMPANY (2013-2015E)
Source: Scotiabank GBM

agnicoeagle.com
STRENGTHS AND WEAKNESSES OF AISC
Strengths • Better defines the total costs associated with producing gold. • Provides better visibility to investors (shows true margins). • Provides clarity to governments – could help diffuse pressure for higher
royalties and taxes.
Weaknesses • Need stringent definitions of by-product credits, sustaining capital, G&A,
and exploration spending. • Does not account for acquisition costs, development capital, interest
expense and taxes.

agnicoeagle.com
OTHER REPORTING OPTIONS
Full Cost Reporting AISC + development capital - Shows full cost to build, operate and develop new resources. Source: Scotiabank GBM
agnicoeagle.com
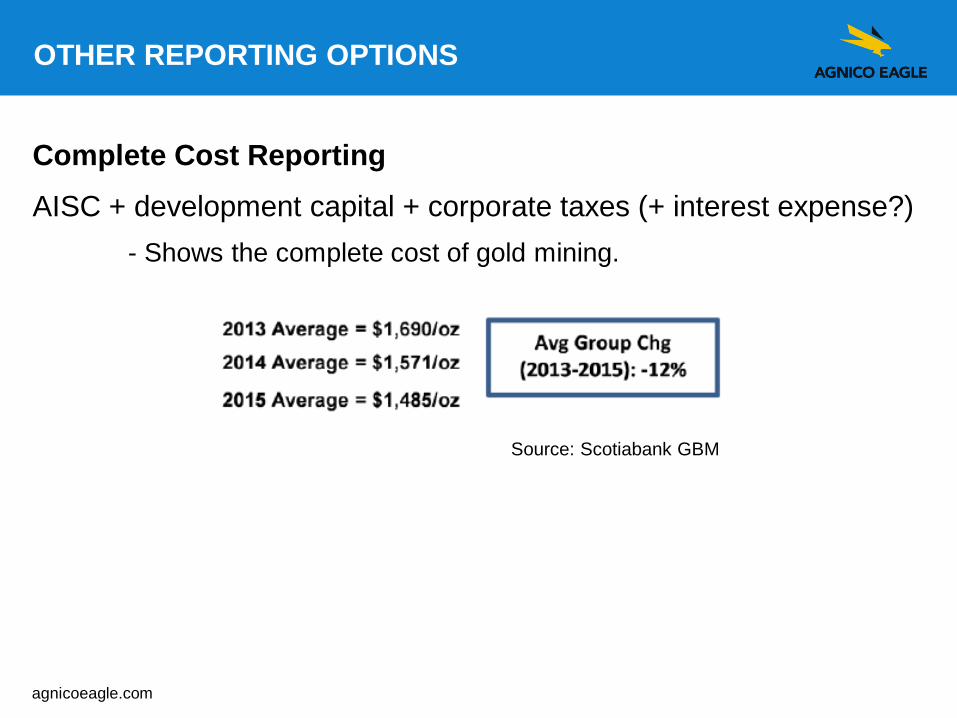
OTHER REPORTING OPTIONS
Complete Cost Reporting AISC + development capital + corporate taxes (+ interest expense?) - Shows the complete cost of gold mining. Source: Scotiabank GBM

agnicoeagle.com
COMPLETE COST REPORTING
• For the first time since 2004, the Complete Cost for the industry is above the gold price. Although this was the case in the 1990’s, it was more of a function of the unsustainably low gold price.
Source: Scotiabank GBM
Costs offset by hedging

agnicoeagle.com
CONCLUSION
• The need to show real returns has forced the gold industry to move away from Total Cash Cost per ounce to AISC per ounce.
• Most industry players have voluntarily adopted the concept of AISC, but the process needs to be standardized.
• Need buy-in from all groups involved (industry, analysts, WGC) on the use and definition of AISC.
• The World Gold Council working on their own definition of AISC.

agnicoeagle.com
CONCLUSION
• Key issues to address: - Gold equivalent production - Definition of by-product credits - Definition of sustaining capital - Interest expense treatment - Handling corporate taxes - Is depreciation a better proxy for capital and acquisition costs? - Impact from IFRS accounting policies