alignment between indonesias first ndc and developments in...
TRANSCRIPT
Power sector NDC-alignment
Alignment between Indonesia’s first NDC and developments in the Indonesian power sector
November 2018
AMBITION TO ACTION
i
Executive Summary in Bahasa Indonesia
Makalah kebijakan ini menelusuri derajat kesesuaian antara dokumen NDC Indonesia yang pertama dengan
rencana pengembangan sektor pembangkit. Perbandingan langsung tidak mungkin dilakukan, karena
dokumen NDC tidak memuat informasi tentang kontribusi penurunan emisi dari sektor pembangkit, sebagai
gantinya kita melihat dari tiga aspek yaitu proyeksi, proses-proses, dan kebijakan-kebijakan.
Sesuai dengan proyeksi yang ditunjukkan pada laporan ini, sektor pembangkit dapat berkontribusi hingga
ratusan megaton pengurangan emisi per tahun dan menghasilkan sejumlah Gigawat kapasitas pembangkit
yang baru dan bersih. Proyeksi emisi tahun 2016 yang digunaan di dalam dokumen NDC secara umum sesuai
dengan perencanaan sektor energi, meskipun masih secara konservatif. Implementasi NDC dan peningkatan
ambisi NDC pada saat ini tidak diintegrasikan ke dalam proses perencanaan sektor energi. RPJMN adalah titik
masuk yang logis untuk memenuhi target pengurangan emisi NDC yang sejalan dengan NDC sebab RPJMN
melingkupi semua sektor disisi ekonomi dan menyeimbangkan berbagai target pembangunan.
Kebijakan energi di Indonesia difokuskan pada peningkatan kapasitas untuk mendukung pengembangan
ekonomi, menjaga biaya rendah, dan diversifikasi bauran bahan bakar untuk meningkatkan ketahanan
energi. Kebijakan yang ada saat ini mengarahkan sektor energi menjauh dari garis BAU (business as usual)
termasuk ambisi memenuhi target energi terbarukan dan efisiensi energi. Tetapi, kebijakan energi
terbarukan dan efisiensi energi secara mandiri tidak cukup memandu penurunan emisi, khususnya jika tidak
ada batasan-batasan pada pengembangan serentak kapasitas pembangkit berbasis energi fosil. Kesesuaian
dari kebijakan energi dengan janji iklim pada NDC akan membutuhkan target-target emisi yang tegas,
dinyatakan salah satu biaya karbon atau intensitas emisi.
Abstract / Synopsis
This policy paper assesses the degree of alignment between Indonesia’s first NDC and planned development
in the power sector. Direct comparison is not possible, since the NDC does not contain information on the
power sector contribution to emission reduction, so instead we looked at three aspects: projections,
processes, and policies. The 2016 emissions projections used in the NDC are broadly aligned with the energy
sector plans at the time. The Paris Agreement and the NDC ambition cycle have not been integrated into
sector policy planning. The RPJMN is a logical entry point for NDC-compatible emission reduction targets
because it covers all sectors in the economy and balances various development priorities. Energy policy is
currently not aligned with climate pledges and will require explicit emissions targets for each sector, either
expressed as carbon budget or emissions intensity.

AMBITION TO ACTION
ii
Authors: Xander van Tilburg and Jasper Donker Contact: [email protected]
Acknowledgements: We are grateful for the input from Himsar Ambarita (University of Medan), and Sam Lamboo and Koen Smekens (both ECN part of TNO).
Project number: Registered under number 16_I_268
TNO project number: 060.33751 – Ambition to Action
TNO report number: TNO 2019 P10489
© November 2018 Ambition to Action This project is part of the International Climate Initiative (IKI). The Federal Ministry for the Environment, Nature Conservation and Nuclear Safety (BMU) supports this initiative on the basis of a decision adopted by the German Bundestag

AMBITION TO ACTION
iii
Contents
Executive Summary in Bahasa Indonesia .................................................................................................. i
1 Introduction ............................................................................................................................... 1
2 Indonesia’s first NDC .................................................................................................................. 2
2.1 Mitigation .............................................................................................................................................. 2
2.2 Energy sector details ............................................................................................................................. 2
2.3 Compared to what? ............................................................................................................................... 3
3 Power sector in Indonesia .......................................................................................................... 5
3.1 Basic facts .............................................................................................................................................. 5
3.2 Projections 2020-2030 ........................................................................................................................... 6
3.3 Current condition .................................................................................................................................. 9
4 NDC-alignment ........................................................................................................................ 10
4.1 Projections ........................................................................................................................................... 10
4.2 Planning processes .............................................................................................................................. 10
4.3 Policies ................................................................................................................................................. 11
5 Discussion ................................................................................................................................ 13
References ........................................................................................................................................... 14
AMBITION TO ACTION
1
1 Introduction
At the COP21 climate conference in December 2015, all Parties to the UNFCCC reached an agreement to
combat climate change: the Paris Agreement. This bottom-up framework starts from initial pledges and
through a repeated five-year cycle of more ambitious pledges. The greenhouse gas (GHG) emissions are
supposed to stay within the limits needed to keep global warming well below two degrees and preferably
below 1.5 degrees. Indonesia put forward its intended nationally determined contribution (INDC) in
September 2015, which was converted into its first nationally determined contribution (NDC) submitted in
November 2016 when Indonesia signed the Paris Agreement. Indonesia’s headline first pledge to the Paris
Agreement is a 29% reduction by 2030 from business as usual, and up to 41% contingent on international
support.
Signatories to the Paris Agreement commit themselves to policies that lead to the emission reduction
expressed in the successive NDCs, eventually leading to net zero emissions in 2050 or shortly after (IPCC,
2018). This has major implications for sectoral planning and calls for a dialogue between national (climate)
policy makers and sectoral stakeholders. Sector stakeholders need to know what is expected from them,
while policy makers need to understand how to create space and support for ambition raising.
At present the majority of Indonesia’s greenhouse gas emissions come from land-use, land-change and
forestry (LULUCF) (65%) with the energy sector as second (23%). It is expected that demand for power and
transport will expand so rapidly that the energy sector will start to dominate as source of GHG emissions in
the coming decade. The expansion of energy demand and supply is inevitable, as it is the driving force behind
economic growth and prosperity. To what extent this expansion also leads to an increase in emissions
depends on technology choices now and in the future. Unabated coal, oil, and gas-based energy systems are
incompatible with the long-term goals of the Paris Agreement, and will need to be phased out.
In order for Indonesia to reach the targets in the current, first NDC, and over time put itself on the path
consistent with the Paris Agreement, it is crucial to integrate emission reduction into sectoral strategies and
policies. In 2018, Bappenas (the Ministry of National Development and Planning ()) launched the low-carbon
development initiative (LCDI) to integrate emissions reduction into the 5-year development planning cycle.
The LCDI is a step in a larger effort to get emission reduction into sectoral planning. It has been years in
preparation and builds on experiences in the national climate policy action plan (RAN-GRK) and the Indonesia
Climate Change Trust Fund (ICCTF).
This policy paper looks at the Indonesian power sector, and in particular the degree of alignment between
pledges in Indonesia’s first NDC and the current and planned developments in the sector. Since the first NDC
does not contain detailed information on the power sector, a direct comparison is not possible. Instead we
look at three aspects to get a sense of alignment: projections and targets, policies, and planning processes.
Chapter 2 presents a brief overview of Indonesia’s first NDC with a focus on energy. Chapter 3 looks at the
basic facts and current condition of the power sector, and presents demand, supply, and capacity projections
towards 2030. Chapter 4 then discusses three aspects of alignment between Indonesia’s first NDC and the
current and planned developments in the power sector: targets, policies, and processes. Chapter 5 makes
suggestions for follow-up.

AMBITION TO ACTION
2
2 Indonesia’s first NDC
Indonesia’s first NDC is a 19-page document mandated by Presidential Regulation 2016/16 and submitted to
the United Nations Framework Convention for Climate Change (UNFCCC) in November 2016. The document
outlines ”the country’s transition to a low carbon and climate resilience future…..describes the enhanced
actions and the necessary enabling environment during the 2015-2019 period that will lay the foundation for
more ambitious goals beyond 2020, contributing to the concerted effort to prevent 2 degrees increase in
global average temperature and to pursue efforts to limit the temperature increase to 1.5 degrees above pre-
industrial levels” (NDC Indonesia 2016).
2.1 Mitigation
Indonesia’s GHG emission reduction pledge is as follows: “Post 2020, Indonesia envisions a progression
beyond its existing commitment to emission reductions. Based on the country’s most recent emissions level
assessment, Indonesia has set unconditional reduction target of 29% and conditional reduction target up to
41 % of the business as usual scenario by 2030.”.
For the Indonesian energy and power sector, two sections of the NDC are especially relevant: section 2 on
‘mitigation’ and section 6 on ‘information to facilitate clarity, transparency, and understanding’ and their
annexes. Energy is not mentioned elsewhere in the NDC.
2.2 Energy sector details
Section 2 on mitigation reads “…In the energy sector, Indonesia has embarked on a mixed energy use policy.
Indonesia has also established the development of clean energy sources as a national policy directive.
Collectively, these policies will eventually put Indonesia on the path to de-carbonization. Government
Regulation No. 79/2014 on National Energy Policy, set out the ambition to transform, by 2025 and 2050, the
primary energy supply mix with shares as follows:
• New and renewable energy at least 23% in 2025 and at least 31% in 2050; • Oil should be less than 25% in 2025 and less than 20% in 2050; • Coal should be minimum 30% in 2025 and minimum 25% in 2050; and • Gas should be minimum 22% in 2025 and minimum 24% in 2050.”
Section 6 of the NDC introduces reference data for the reduction pledge: “The BAU scenario is projected
approximately 2,869 MtCO2-eq. in 2030 which is updated from the BAU scenario on the INDC due to current
condition on energy policy development in particular in coal fired power plant”. It further presents three
projections for the period 2020-2030: a BAU scenario without mitigation policies, a mitigation scenario CM1
with sectoral development targets, and a more ambitious mitigation scenario CM2 conditional on
international support (see table 1). In the annex to the NDC there is additional information on the
assumptions behind the projections (see table 2), albeit without much detail. In 2030, energy emissions will
account for around 60% of the total, LULUCF for less than 25% (all scenarios).
The energy sector grows fast and its emissions will keep growing: business as usual energy emissions are
1,669 MtCO2-eq. in 2030. Even under the ambitious scenario CM2, emissions will nearly triple compared to
2010 levels. LULUCF is currently the largest source of emissions and varies greatly between years (e.g. el-
Niño has a particularly large effect), but it does not increase in the same way with economic development as

AMBITION TO ACTION
3
energy does. The NDC shows that 60% of the mitigation effort concerns LULUCF and 35% on energy (5% from
agriculture, waste, and IPPU).
Table 1: Projected BAU and emission reduction (source: Indonesia first NDC)
Table 2: Assumptions used for projections (source: Indonesia first NDC)
2.3 Compared to what?
To compare the mitigation pledge in the NDC with the emissions associated with energy sector plans and
developments, we are looking a set of policy documents that cover total -, energy- , and power sector
emissions. As Table 3 shows, none of the documents covers all three emission projections.
On the energy policy side, several projections exist (see Table 3). The National Energy Policy (KEN),
established by the National Energy Council (DEN), sets the long-term targets for the sector in 2050 and
intermediate targets for 2025. In the National Energy Outlook, the DEN presents a business as usual scenario
for the energy sector without policy, and a scenario that has policies to achieve the KEN targets. The National
Energy Outlook scenarios contain detailed information on the power sector; constructed using the LEAP
modelling tool, with ongoing refinement in the toolkit (e.g. include Balmorel dispatch modelling)1.
The Ministry of Energy and Natural Resources (ESDM) develops its 5-year National Energy Master Plan (RUEN)
and the National Electricity Master Plan (RUKN) to present medium-term scenarios consistent with KEN
targets. These ESDM scenarios are supported by LEAP modelling. Finally, every year, the state-owned utility
PLN presents its 10-year business plan (RUPTL) with very detailed projections based on own modelling.
1 LEAP, which stands for Long-range Energy Alternatives Planning, is a tool for energy systems accounting. Balmorel is an open source framework for
energy systems optimisation using linear programming engine GAMS.

AMBITION TO ACTION
4
Abbreviation Author Total Energy Power Description Horizon
2014 KEN GoI ◌ ◌ ◌ National Energy Policy (KEN) 2014/79 2050
2014 DEN2014 DEN ◌ ● ● National Energy Outlook 2014 2050
2015 ESDM RUKN ESDM ◌ ● ● National Electricity Master Plan 2015 2035
2016 DEN2016 DEN ◌ ● ● National Energy Outlook 2016 2050
2017 RUPTL2017 PLN ◌ ◌ ● PLN 10-year Electricity Business Plan 2017 2017-2026
2018 RUPTL2018 PLN ◌ ◌ ● PLN 10-year Electricity Business Plan 2018 2018-2027
Table 3: Energy policy documents coverage of emissions projections (●=yes, ◌=no)
On the climate change policy side, Bappenas and KLHK (the Ministry of Environment and Forestry) have both
developed emissions projections each supported by a team of academic experts. The national climate change
policy RAN-GRK itself does not contain any scenarios, but for the 2015 review, Bappenas made projections
up to 2030 using a system dynamics model developed with the Bandung Institute of Technology (ITB). The
RAN-GRK review shows a BAU scenario and two mitigation scenarios to inform the INDC (i.e. to reach 29%
and 41%). The system dynamics model currently used by Bappenas and ITB supports Vision Indonesia 2045
and the Low-Carbon Development Indonesia effort to integrate emission reduction into the medium-term
development plan RPJMN.
Abbreviation Author Total Energy Power Description Horizon
2015 RANGRK Review Bappenas ● ● (◌) Developing Indonesia mitigation policy 2020-2030 2030
2015 INDC KLHK ● ◌ ◌ Intended Nationally Determined Contribution (INDC) 2030
2016 NDC KLHK ● ● ◌ Nationally Determined Contribution 2030
Ongoing Indo2045 Bappenas ● ● (◌) unpublished 2045
Table 4: Climate policy - documents
The INDC contains a business as usual emissions estimate for the whole economy of 2,881 Mt CO2-eq. in
2030, derived from the Asia-Pacific Integrated Model/Computable General Equilibrium (AIM/CGE) model.
The NDC updates the INDC by adding three emissions scenarios with sector totals (see table 1) and an
updated total for emissions in the BAU scenario of 2,869 Mt CO2-eq..

AMBITION TO ACTION
5
3 Power sector in Indonesia
This chapter starts with a short overview of the power sector in Indonesia and then presents a range of
existing projections for the period 2020-2030, followed by a short reflection on the changes in the power
sector since the submission of the NDC in November 2016.
3.1 Basic facts
Indonesia is among 20 countries with the largest power demand, on par with countries such as South Africa
and Australia but with vastly larger population. Among the large power sector countries, Indonesia has the
least capacity and consumption per capita with 925 kWh/person. This is less than a third of the world’s
average (see Table 5). Energy consumption and level of economic development are linked, and this is the
reason behind the consumption targets set in the National Energy Policy for 2025 (2500 kWh/person) and
2050 (7000 kWh/person). To achieve these targets, an annual growth rate of close to 10% is needed until
2025 – or a steady 6% until 2050.
Region kWh/capita
World 3127
OECD 7994
EU 5908
US 12984
Mexico 2090
Brazil 2601
South Africa 4198
Indonesia 925
Table 5: Energy use per capita
(source: WRI CAIT Data Explorer)
Supply (TWh) Emissions (Mt) Capacity (GW) Capacity factor (%)
Coal 134.8 145.5 24.6 0.6
Oil 12.9 9.5 5.5 0.3
Gas 53.6 23.2 16.5 0.4
Renewables 29.9 0.0 8.0 0.4
Total 231.15 178.2 54.58
Table 6: Power supply, capacity, and emissions (derived from PLN, 2018)
Current installed power capacity is around 55 GW and total power supply is 231 TWh. The generation mix2 is
dominated by coal (58%) and gas (23%), followed by renewable energy (13%) and oil (6%). At the time of
writing, Indonesia has 141 operational coal power plants with a joint capacity of 29 GW, and another 39 coal
plants with a total capacity of 13 GW are under construction3. The power sector has a relatively high emission
factor of around 0.85 kg CO2/kWh4. In the past decade especially, the domestic coal industry has flourished
but operation is not without problems: capacity factors are low, plants are inefficient (and dirty), and the
network infrastructure requires maintenance. Current emissions in the power sector are 178 Mt. If power
capacity triples or quadruples in size by 2030 as planned, with the current generating mix, this would lead to
significant increase in annual emissions (400-500 Mt). This would make the power sector an important factor
for Indonesia’s long-term commitments under the Paris Agreement.
2 https://www.esdm.go.id/assets/media/content/content-ringkasan-ruptl-2018-2027.pdf 3 https://endcoal.org/tracker/ 4 Based on IGES (2018)
AMBITION TO ACTION
6
3.2 Projections 2020-2030
All the graphs in this section are based on original datasets, with missing data points amended through simple
inter- and extrapolation and assumptions on losses and capacity factors. It is intended for comparison, and
to get a sense of how emissions in the power sector can develop in 2020-2030, which is the relevant period
for the NDC. The data set contains the two editions of the Indonesia Energy Outlook (DEN2014 and DEN2016),
the RUKN, and the two recent editions of PLN’s business plan RUPTL. Figures 1 ,3, and 8 also show current
capacity for reference. Some of the scenarios seem to make odd jumps around 2025, which is probably a
result of deliberate targeting the national energy mix goals.
3.2.1 Power demand and supply
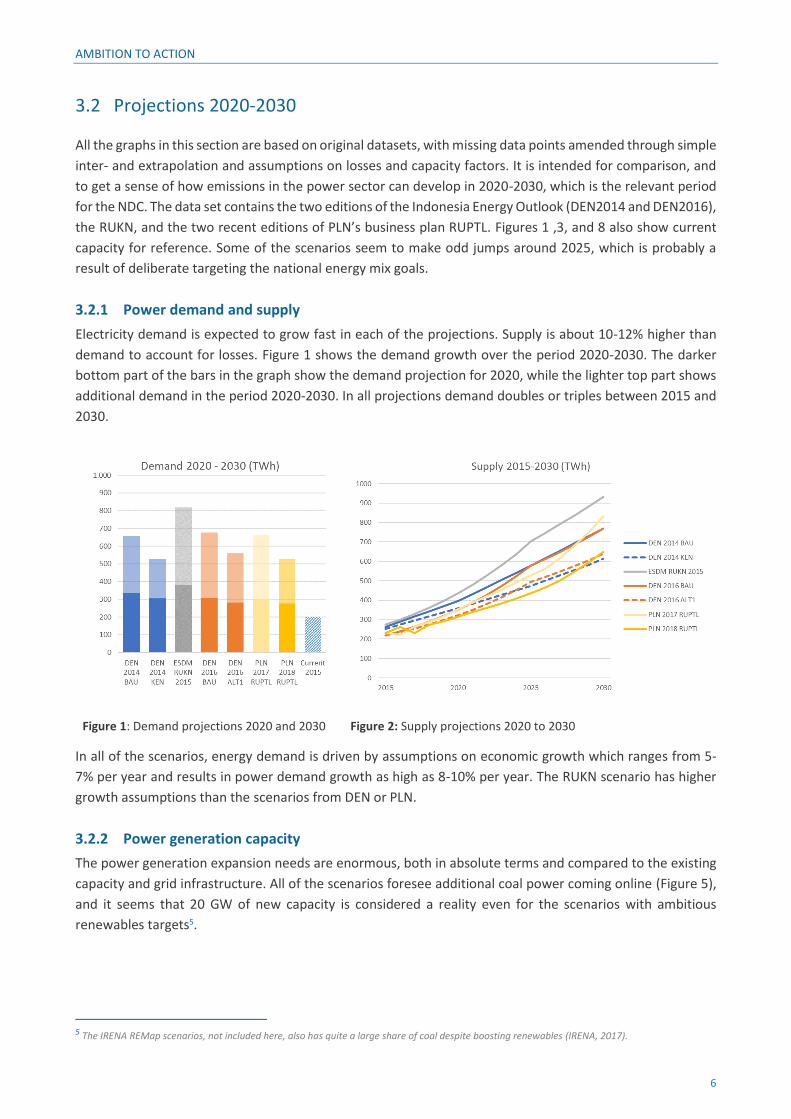
Electricity demand is expected to grow fast in each of the projections. Supply is about 10-12% higher than
demand to account for losses. Figure 1 shows the demand growth over the period 2020-2030. The darker
bottom part of the bars in the graph show the demand projection for 2020, while the lighter top part shows
additional demand in the period 2020-2030. In all projections demand doubles or triples between 2015 and
2030.
Figure 1: Demand projections 2020 and 2030
Figure 2: Supply projections 2020 to 2030
In all of the scenarios, energy demand is driven by assumptions on economic growth which ranges from 5-
7% per year and results in power demand growth as high as 8-10% per year. The RUKN scenario has higher
growth assumptions than the scenarios from DEN or PLN.
3.2.2 Power generation capacity
The power generation expansion needs are enormous, both in absolute terms and compared to the existing
capacity and grid infrastructure. All of the scenarios foresee additional coal power coming online (Figure 5),
and it seems that 20 GW of new capacity is considered a reality even for the scenarios with ambitious
renewables targets5.
5 The IRENA REMap scenarios, not included here, also has quite a large share of coal despite boosting renewables (IRENA, 2017).
AMBITION TO ACTION
7
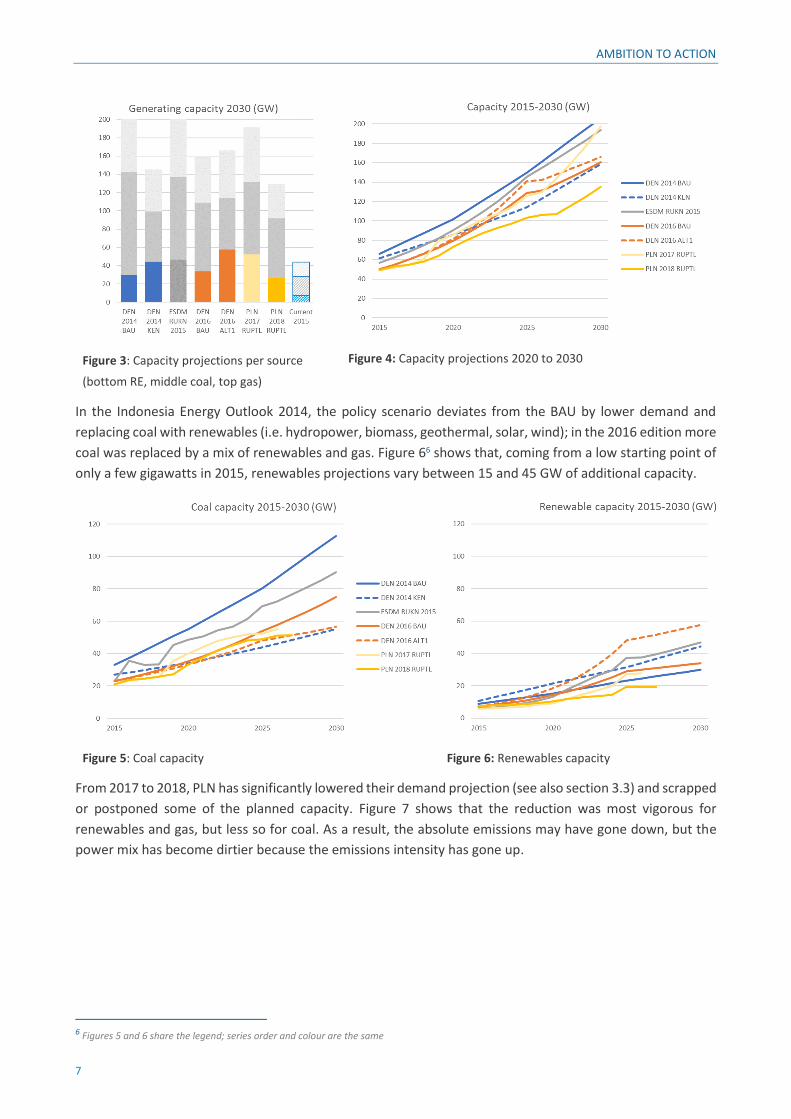
Figure 3: Capacity projections per source
(bottom RE, middle coal, top gas)
Figure 4: Capacity projections 2020 to 2030
In the Indonesia Energy Outlook 2014, the policy scenario deviates from the BAU by lower demand and
replacing coal with renewables (i.e. hydropower, biomass, geothermal, solar, wind); in the 2016 edition more
coal was replaced by a mix of renewables and gas. Figure 66 shows that, coming from a low starting point of
only a few gigawatts in 2015, renewables projections vary between 15 and 45 GW of additional capacity.
Figure 5: Coal capacity
Figure 6: Renewables capacity
From 2017 to 2018, PLN has significantly lowered their demand projection (see also section 3.3) and scrapped
or postponed some of the planned capacity. Figure 7 shows that the reduction was most vigorous for
renewables and gas, but less so for coal. As a result, the absolute emissions may have gone down, but the
power mix has become dirtier because the emissions intensity has gone up.
6 Figures 5 and 6 share the legend; series order and colour are the same
AMBITION TO ACTION
8
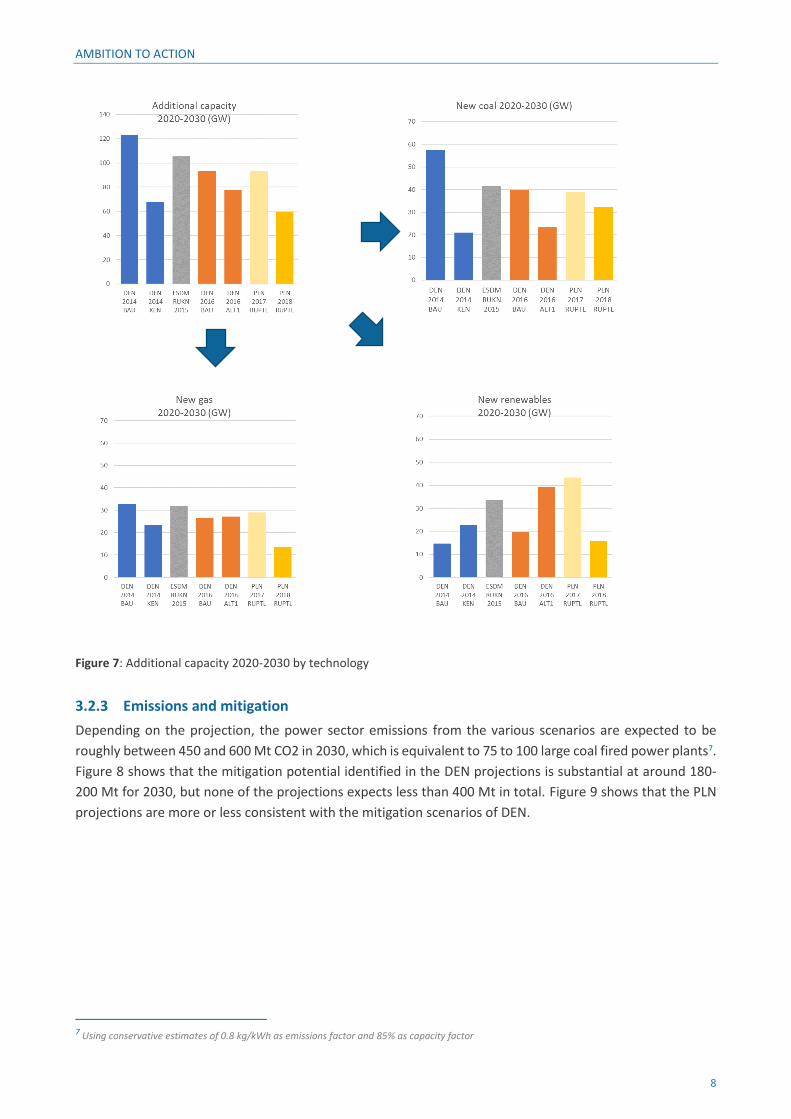
Figure 7: Additional capacity 2020-2030 by technology
3.2.3 Emissions and mitigation
Depending on the projection, the power sector emissions from the various scenarios are expected to be
roughly between 450 and 600 Mt CO2 in 2030, which is equivalent to 75 to 100 large coal fired power plants7.
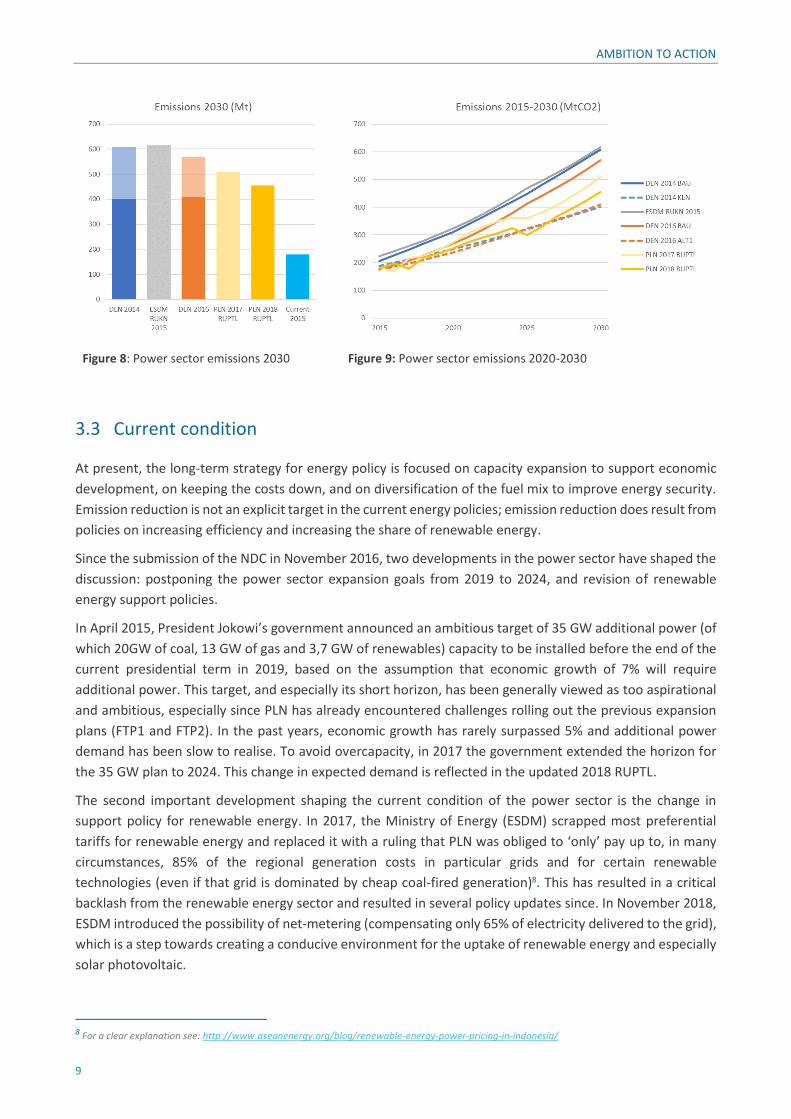
Figure 8 shows that the mitigation potential identified in the DEN projections is substantial at around 180-
200 Mt for 2030, but none of the projections expects less than 400 Mt in total. Figure 9 shows that the PLN
projections are more or less consistent with the mitigation scenarios of DEN.
7 Using conservative estimates of 0.8 kg/kWh as emissions factor and 85% as capacity factor
AMBITION TO ACTION
9
Figure 8: Power sector emissions 2030
Figure 9: Power sector emissions 2020-2030
3.3 Current condition
At present, the long-term strategy for energy policy is focused on capacity expansion to support economic
development, on keeping the costs down, and on diversification of the fuel mix to improve energy security.
Emission reduction is not an explicit target in the current energy policies; emission reduction does result from
policies on increasing efficiency and increasing the share of renewable energy.
Since the submission of the NDC in November 2016, two developments in the power sector have shaped the
discussion: postponing the power sector expansion goals from 2019 to 2024, and revision of renewable
energy support policies.
In April 2015, President Jokowi’s government announced an ambitious target of 35 GW additional power (of
which 20GW of coal, 13 GW of gas and 3,7 GW of renewables) capacity to be installed before the end of the
current presidential term in 2019, based on the assumption that economic growth of 7% will require
additional power. This target, and especially its short horizon, has been generally viewed as too aspirational
and ambitious, especially since PLN has already encountered challenges rolling out the previous expansion
plans (FTP1 and FTP2). In the past years, economic growth has rarely surpassed 5% and additional power
demand has been slow to realise. To avoid overcapacity, in 2017 the government extended the horizon for
the 35 GW plan to 2024. This change in expected demand is reflected in the updated 2018 RUPTL.
The second important development shaping the current condition of the power sector is the change in
support policy for renewable energy. In 2017, the Ministry of Energy (ESDM) scrapped most preferential
tariffs for renewable energy and replaced it with a ruling that PLN was obliged to ‘only’ pay up to, in many
circumstances, 85% of the regional generation costs in particular grids and for certain renewable
technologies (even if that grid is dominated by cheap coal-fired generation)8. This has resulted in a critical
backlash from the renewable energy sector and resulted in several policy updates since. In November 2018,
ESDM introduced the possibility of net-metering (compensating only 65% of electricity delivered to the grid),
which is a step towards creating a conducive environment for the uptake of renewable energy and especially
solar photovoltaic.
8 For a clear explanation see: http://www.aseanenergy.org/blog/renewable-energy-power-pricing-in-indonesia/

AMBITION TO ACTION
10
4 NDC-alignment
As mentioned in Chapter 2, there is no information in the NDC about the power sector specifically but there
is a clear indication that the National Energy Policy (KEN) is taken as guidance for energy emissions. Since
there is no explicit link between the NDC and the power sector emissions, this chapter looks at three aspects
of alignment: projections, policies, and process.
4.1 Projections
Indonesia’s First NDC contains projections for the energy sector as a whole but does not give details on the
power sector. Table 7 shows emissions estimates for 2030 corresponding to documents listed in Table 3 and
Table 4. Each line in the table represents a scenario. The blue circle shows that the NDC has no emissions
details for the power sector in either of the three scenarios (BAU, CM1 and CM2; see section 2.2). From this
table we can observe that the projections used in the INDC and NDC are broadly aligned with the existing
energy projections at the time (i.e. DEN2014, RUKN, DEN2016), and that the NDC is on the conservative side.
The overall national emissions in the NDC are similar to those in the INDC, differing only ever so slightly, but
for the energy sector we see that NDC expects 15% higher emissions compared to the RAN-GRK review.
Table 7: Emissions estimates for 2030 under various projections (energy = orange, climate = blue)
Shortly after the NDC submission to the UNFCCC in November 2016, DEN published the Energy Outlook
Indonesia 2016. This update replaces high growth estimates (7.1%) from the 2014 edition with more modest
economic growth expectations (5.5%). It shows a reduction in total energy sector emissions of 20%, but the
impact on power sector emissions is a decrease of only 5%. Note that most people were well aware of the
fact that 7.1% demand growth was high/aspirational, renewable energy capacity expansion towards 23% was
not on track, and climate policy (RAN-GRK) had so far not been very demanding for the energy sector.
4.2 Planning processes
Currently the NDC targets and commitments under the Paris Agreement are not formally linked to the energy
sector planning processes. This is expected to change, over time, with the development of the Low-Carbon
Total Energy Power2014 DEN 2014 -
-15001000
607400
2015 ESDM RUKN --
18071061
598
2015 RAN-GRK Review 288120491669
14441190972
594513393
INDC 288120491669
---
---
2016 NDC 286920341787
166913351271
---
2016 DEN2016 --
1201799
570409
2017 RUPTL2017 - - 635
2018 RUPTL2018 - - 456
ongoing Indo2045 287520331690
12581060955
468339247
AMBITION TO ACTION
11
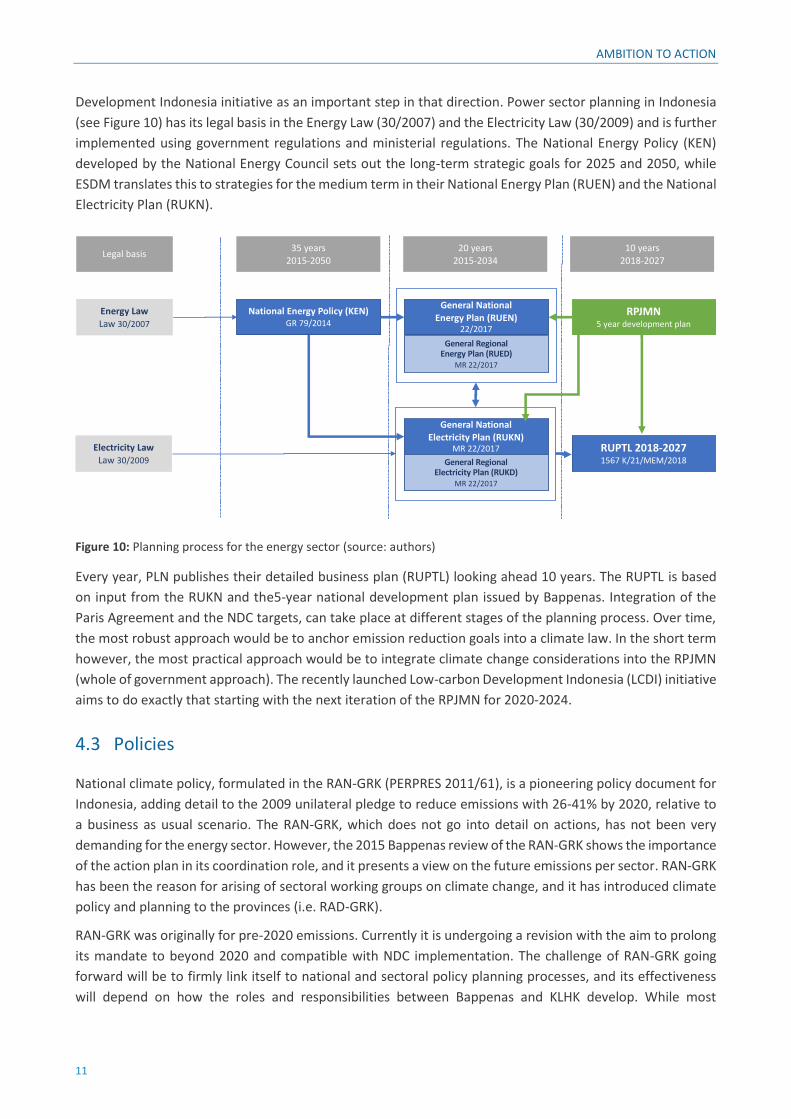
Development Indonesia initiative as an important step in that direction. Power sector planning in Indonesia
(see Figure 10) has its legal basis in the Energy Law (30/2007) and the Electricity Law (30/2009) and is further
implemented using government regulations and ministerial regulations. The National Energy Policy (KEN)
developed by the National Energy Council sets out the long-term strategic goals for 2025 and 2050, while
ESDM translates this to strategies for the medium term in their National Energy Plan (RUEN) and the National
Electricity Plan (RUKN).
Figure 10: Planning process for the energy sector (source: authors)
Every year, PLN publishes their detailed business plan (RUPTL) looking ahead 10 years. The RUPTL is based
on input from the RUKN and the5-year national development plan issued by Bappenas. Integration of the
Paris Agreement and the NDC targets, can take place at different stages of the planning process. Over time,
the most robust approach would be to anchor emission reduction goals into a climate law. In the short term
however, the most practical approach would be to integrate climate change considerations into the RPJMN
(whole of government approach). The recently launched Low-carbon Development Indonesia (LCDI) initiative
aims to do exactly that starting with the next iteration of the RPJMN for 2020-2024.
4.3 Policies
National climate policy, formulated in the RAN-GRK (PERPRES 2011/61), is a pioneering policy document for
Indonesia, adding detail to the 2009 unilateral pledge to reduce emissions with 26-41% by 2020, relative to
a business as usual scenario. The RAN-GRK, which does not go into detail on actions, has not been very
demanding for the energy sector. However, the 2015 Bappenas review of the RAN-GRK shows the importance
of the action plan in its coordination role, and it presents a view on the future emissions per sector. RAN-GRK
has been the reason for arising of sectoral working groups on climate change, and it has introduced climate
policy and planning to the provinces (i.e. RAD-GRK).
RAN-GRK was originally for pre-2020 emissions. Currently it is undergoing a revision with the aim to prolong
its mandate to beyond 2020 and compatible with NDC implementation. The challenge of RAN-GRK going
forward will be to firmly link itself to national and sectoral policy planning processes, and its effectiveness
will depend on how the roles and responsibilities between Bappenas and KLHK develop. While most
National Energy Policy (KEN)GR 79/2014
RUPTL 2018-20271567 K/21/MEM/2018
Energy LawLaw 30/2007
Electricity LawLaw 30/2009
General National
Energy Plan (RUEN)22/2017
General Regional Energy Plan (RUED)
MR 22/2017
General NationalElectricity Plan (RUKN)
MR 22/2017
General RegionalElectricity Plan (RUKD)
MR 22/2017
35 years2015-2050
20 years2015-2034
10 years2018-2027
DEN (2016) Indonesia Energy
Outlook 2016ESDM (2014) RUEN draft 2015 PLN (2018) RUPTL 2018-2027
Legal basis
RPJMN5 year development plan

AMBITION TO ACTION
12
mitigation policies and actions will be sectoral anyway, RAN-GRK can play an important role to indicate (cross-
) sectoral impacts and how national targets play out for them.
Current energy policy is not driven by climate considerations, but solely by economic growth and energy
security concerns. Seriously ambitious targets for energy efficiency and renewable energy are in place in the
2014 National Energy Policy (1% energy intensity improvement per year; 23% renewables in 2025, 31%
renewables in 2050), but there are no restrictions on emissions of the remaining power generation that is
not renewable: 77% of in 2025 (and 69% in 2050).
The KEN sets minimum and maximum renewable energy shares for the generating mix, but as Figure 11
shows this can still result in very different emissions outcomes : based on the renewable energy targets only,
the resulting emissions per kWh9 can vary between 0.39 and 0.64 kg/kWh in 2025 (or between 0.40 and 0.55
kg/kWh in 2050). This shows that in order to guide emission reductions, it is not sufficient to only look at the
share of renewable energy, especially if the non-renewable share is particularly dirty.
Figure 11: Both KEN-compatible energy mixes but very different emissions (0.4 kg/kWh left, 0.6 kg/kWh right)
Looking beyond the first NDC, the National Energy Policy is currently not consistent with the Paris Agreement.
The KEN targets for 2050 contain a considerable amount of coal- and gas-based power generation, while IPCC
reports from 2015 and 2018 show that economies need to aim for net-zero emissions by mid-century or face
costly measures for negative emissions in the decades after.
9 For illustration only, uses emissions factor of 1.0 kg/kWh for coal, and 0.4 kg/kWh for gas respectively.
2025 2025

AMBITION TO ACTION
13
5 Discussion
This policy paper assesses the degree of alignment between Indonesia’s first NDC and planned development
in the power sector. Direct comparison is not possible, since the NDC does not contain information on the
power sector contribution to emission reduction, so instead we looked at three aspects: projections,
processes, and policies.
According to projections shown in this report, the power sector could contribute up to hundreds of megatons
of emission reduction per year and generate gigawatts of new clean power generation capacity. The 2016
emissions projections used in the NDC are broadly aligned with the energy sector plans at the time, albeit on
the conservative side. NDC implementation and NDC ambition raising are currently not integrated into
energy sector planning processes. The RPJMN is a logical entry point for NDC-compatible emission reduction
targets because it covers all sectors in the economy and balances various development priorities.
Energy policy in Indonesia is focused on capacity expansion to support economic development, on keeping
the costs down, and on diversification of the fuel mix to improve energy security. Existing policies to direct
the energy sector away from its business as usual pathway include ambitious renewable energy and energy
efficiency targets. However, renewable energy and energy efficiency policies alone are not enough to guide
emissions reduction, especially if there are no constraints on the simultaneous expansion of fossil-based
generation capacity. Alignment of energy policy with climate pledges in the NDC will require explicit
emissions targets for each sector, either expressed as carbon budget or emissions intensity.

AMBITION TO ACTION
14
References
Bappenas (2015) Developing Indonesian Climate Mitigation Policy 2020 – 2030: through RAN-GRK review,
Ministry of National Development Planning/ BAPPENAS, Jakarta, November 2015
Cameron and van Tilburg (2016) Coal power and climate change in Indonesia, Energy research Centre of the
Netherlands (ECN), Amsterdam/Jakarta, 2016
GoI (2015) Indonesia INDC, Jakarta, September 2015
GoI (2016) Indonesia first NDC, Jakarta, October 2016
GoI (2017) Ratification of the Paris Agreement, Presidential Regulation 6/2016, Jakarta, 2016
GoI (2011) The National Action Plan for Greenhouse Gas Emissions Reduction. RAN-GRK, Presidential
Regulation 61/2011;
GoI (2014) National Energy Policy, Government Regulation 79/2014.
IEA (2015) Energy Policies Beyond IEA Countries – Indonesia, International Energy Agency, Paris, 2015
IEEFA (2018) PLN-A Power Company out of Step With Global Trends,
IESR (2015) INDC A brief analysis, Jakarta, October 2015
IISD (2017) Missing the 23 Per Cent Target: Roadblocks to the development of renewable energy in Indonesia,
PLN (2017) Electricity Supply Business Plan (RUPTL) 2017-2026, PT PLN Persero, Jakarta
PLN (2018) Electricity Supply Business Plan (RUPTL) 2018-2027, PT PLN Persero, Jakarta