algebra zapping zombies - math solutions
TRANSCRIPT
Math Solutions Lesson from the Classroom
1
Algebra Zapping ZombiesA Lesson for Grades 6–8Carmen WhitmanFeatured in Math Solutions Online Newsletter, Issue 38
© 2011 Math Solutions, mathsolutions.com. Reproducible for one teacher’s classroom use only.
Overview of LessonIn this lesson students translate among representations so that their understanding can advance from words to tables to graphs to equations. The concepts are covered in the context of playing a video game where Zombies are zapped to score points and advance a level in the game. Introduce to students the background about the video game. The main goal of the game is to earn points by zapping Zombies. Have a brief conversation about game levels and points earned. As students work through this lesson keep them focused on the relationship between the different parts of the table.
The understanding of proportional relationships in this problem helps students make the connections between the different representations.
Common Core State StandardsExpressions and Equations 7.EE
Solve real-life and mathematical problems using numerical and algebraic expressions and equations.
4. Use variables to represent quantities in a real-world or mathematical problem, and construct simple equations and inequalities to solve problems by reasoning about the quantities.
NCTM CorrelationNumber and Operations
Compute fluently and make reasonable estimates.
Develop, analyze, and explain methods for solving problems involving proportions, such as scaling and finding equivalent ratios.
Algebra Use mathematical models to represent and understand quantitative relationships.
Model and solve contextualized problems using various representations, such as graphs, tables and equations.
Analyze change in various contexts.
Use graphs to analyze the nature of changes in quantities in linear relationships.
The lesson was adapted from the Math Solutions publications It’s All Connected: The Power of Proportional Reasoning to Understand Mathematics Concepts, Grades 6–8.

2
Algebra Zapping Zombies, Grades 6–8, continued
© 2011 Math Solutions, mathsolutions.com. Reproducible for one teacher’s classroom use only.
Goals for Student Understanding •Representrelationshipsinatabular,verbal,graphical,andsymbolicform.
•Comparetableandgraphicrepresentationsofthesamedataandconnecttothesymbolicrepresentation.
• Identifyandunderstandhowunitrateisrepresentedinanequation,table,andgraph.
Materials •Paper
•Pencil
•Graphingcalculator(optional)
•Graphpaper(optional)
Key VocabularyRatio
Rate
Unit Rate
Slope
Constant rate
Coefficient
Independent variable
Dependent variable
3
Algebra Zapping Zombies, Grades 6–8, continued
© 2011 Math Solutions, mathsolutions.com. Reproducible for one teacher’s classroom use only.
Teaching Connections• Makesurestudentscanreadthetablebyreviewingtheinformationknownandaskquestionsabouttheinformation needed to complete the table. Leave the discussion open enough to allow students to decide on a method for finding the missing values.
• Tohelpstrugglingstudents,suggeststudentsfirstwriteaverbaldescriptionofthesituation.
• Beforediscussingrates,reviewthedefinitionofaratio.
A ratio is a comparison of two quantities. Ratios can be written using three formats.
2 to 3; 2:3, and 2/3.
• Useguidingquestionstohelpstudentsunderstandthesignificanceofwhataunitrateisandwhatroleitplaysin generalizing the pattern. They then can translate their rule to symbolic form using variables.
A rate is a ratio of two measurements.
A unit rate is a rate where one of the measurements is 1. Sample unit rates are: 12 inches:1 foot, $25 per ticket, 4 hours:1 room
• Haveadiscussiontoreviewthecomponentsofagraphinpreparationforstudentsgraphingrelationshipsinthislesson. Include in the review the concept of slope.
Slope is the constant rate of change of a linear relationship. When the equation of line is given in a form
y = mx + b, the coefficient of the x-term, m, is the slope .
• Instructstudentsonhowtodistinguishbetweentheindependentanddependentvariablesinarelationship.
An independent variable in a relationship, or ordered pair, is the variable that stands alone and is not affected or changed by the relationship.
A dependent variable in a relationship, or ordered pair, is the variable affected by the independent variable. The value of the independent variable changes the value of the dependent variable.
• Explainthatequationsalsoshowhowvariablesarerelatedtoeachother,justliketablesandgraphs.
• Encouragestudentstosharetheirstrategiesforcompletingthetable.
• Forstudentsthatusearepeatedadditionprocesstofillinpartsofthetable,askquestionsthatwillfocusthemonthe multiplicative nature of the values.
o As the level numbers tripled from 2 to 6, how did the number of Zombies change? How did the number of points change?
o How would you determine the number of Zombies you zapped if you reached level 20? Level 5?
Student ConnectionsStudents need to complete the Student Recording Page. As students begin working ask them to estimate the values that belong in the table and explain why their estimates make sense. As students begin graphing, be sure they have identified the independent and dependent variables correctly and have selected to use an appropriate scale. As students work on this recording page, continue to ask questions about the relationships between variables of the situations.
Questions for Struggling Student• Whatinformationvariablesareinvolved?Levels, Zombies, and Points
• Whatinformationcanyougatherfromthetable?Possible answers include:
When you reach Level 6 you have zapped 210 Zombies and earned 23,100 points.
You earned 7,700 points for Level 2.
To exit Level 8 you need 30,800 points.
4
Algebra Zapping Zombies, Grades 6–8, continued
© 2011 Math Solutions, mathsolutions.com. Reproducible for one teacher’s classroom use only.
• WhatinformationinthetablewillhelpyoufindthenumberofZombiesneededtoadvancetothenextlevel?The number of Zombies increased from 140 to 210 between Levels 4 and 6; therefore, the number of Zombies needed to complete two levels of play is 70.
• Whatratewillhelpyoucompletethetable?210 Zombies zapped to 23,100 points earned. The unit rate for this ratio is 1/110, so I can use that to find other amounts of points earned.
• Describeanypatternsyousee.Answers will vary.
• Howarethelevelnumberschanginginthetable?by 2 each time
• HowarethenumbersofZombieszappedchanginginthetable?by 70 for every 2 levels
• Howdothenumbersofpointsearnedchangeinthetable?by 7,700 every 2 levels
• YouknowthenumberofZombieszappedforeverytwolevelsofplay.UsethatinformationtofindhowmanyZombies need to be zapped at every level? This is called the unit rate. What other unit rates can you find? For every level I need to zap 35 Zombies. 1 Zombie gets me 110 points, every level I earn 3,850 points.
• Identifyaratiofoundinthetable.theratiobetweenthelevelandthenumberofZombieszapped;the ratio between the numbers of Zombies zapped to the number of points earned; or the level to the number of points earned.
• WhatdoyouknowaboutLevel10?the number of Zombies zapped;. Given that, what can you determine about Level 5? 350 Zombies zapped, 38,500 points earned; Level 5 should be half of each of the values.
• WhatistherelationshipbetweenthelevelsearnedandthenumbersofZombieszapped?For every two levels you increase the number of Zombies zapped by 70.
• Whatlabelsdoyouuseforthegraphs?Levels and Zombies, Zombies and Points, or Level and Points
• Foreachvariable,nametheminimumandmaximumvaluesyouneedtoincludeonyourx-andy-axes.Whatisa reasonablescaletousefortheaxes?(e.g.Whatwouldbeaneffectivewaytoskip-count,ifyourrangewentfrom 0tonearly50,000?)for Levels, a scale of 1 with a minimum of 0 and a maximum of 15; for Zombies, a scale of 35 with a minimum of 0 and a maximum of 500; for Points, a scale of 5,000 with a minimum of 0 and a maximum of 50,000
Questions for Students on Task• Describehowyoufindthemissingvaluestocompletethetable.Showexamplestoexplainyourthinking.Use the values you know to help find the missing values. Find out how the table changes from one value to the next both horizontally and vertically.
• Whatpatternsdoyouseeinthetable?Studentsmaysuggest:
As levels increase by 2, the number of Zombies increases by 70.
As levels increase by 1, the number of Zombies increases by 35.
As levels increase by 1, the number of points increases by 3,850.
Ask students questions about any patterns that are not mentioned.
• IfthepatternshowsthatthenumberofZombieszappedincreasesby70Zombiesforeverytwolevels,howmany Zombies need to be zapped per level? 35
• Describetherelationshipsbetweenthevariables.Pressstudentstobeasspecificaspossible.Studentsmaysuggest the following:
Asthelevelsincrease,theothervariablesincrease.Suggeststudenttobemorespecificbyasking“Byhowmuch?”
For every two levels you advance, the number of Zombies zapped increases by 70.
For every 70 Zombies, you score 7,700 points.
For every level increased, you zap 35 Zombies.
For every level increased, you earn 3,850 points.
5
Algebra Zapping Zombies, Grades 6–8, continued
© 2011 Math Solutions, mathsolutions.com. Reproducible for one teacher’s classroom use only.
• Whataretheattributesofaproportionalrelationship? As the independent variable increases by one unit, the dependent variable increases at a constant rate. If you look at a graph, you see a linear relationship that passes through the origin.
• Whatrelationshipscanbegraphed?Whatdoyoupredictthegraphstolooklike? Level and Number of Zombies Zapped; Level and the Number of Points earned; and Zombies Zapped and Number of Points earned; The graphs will be linear.
• Howcanyoutellifarelationshipisproportionalusingagraph?The graph is linear and passes through the origin.
Questions for Students on Task• SupposeLeopurchasedanewerversionofZappingZombies.Inthisversion,thenumberofZombieszappedateach level increases from 35 to 50 Zombies. How would this affect the original table of values? How would this affect the original graph? How would this affect the original equation? In the table, the values would increase more rapidly; in the graph the trend line would be steeper; and in the equation the coefficient of x would be 50, not 35.
• Whatwouldthevaluesbeifyouextendedthetabletolevel13?The number of Zombies zapped would reach 455; the number of points earned would be 50,050.
• Afterplayingformanyhours,Leohadatotalof92,400points.Whatleveldidhecomplete?Showhowtousethe table,graph,andequationtojustifyyoursolution.He would be on level 24. I knew that each level was worth 3,850 points, so I divided 92,400 by 3,850 to get a quotient of 24. I could follow the trend on the graph to estimate the level and use my equation p = 350l to solve for l where l, is the level.
• Leo’slittlebrothersaidhebeatthelevelandzappedatotalof990Zombies.Leodidn’tbelievehim.Mathematically justifywhichbrotheriscorrect.Level 24 would only zap 840 Zombies; 24 • 35 = 840 Zombies zapped. Leo’s little bother is incorrect.
• IfthebonusroundscorestriplepointsforeveryZombiezapped,andyouearn16,500pointsinthatround,howmany Zombies did you zap? Explain. You normally earn 110 points per Zombie; if points are tripled, then you earn 330 points per Zombie. 16,500 ÷ 330 = 50 Zombies.
• Whatbenefitsdoesthetable,graph,orequationgiveyouinunderstandingthespecificrelationships?The table shows you specific data points. The graph shows you the relationship holistically, such as what is happening with the relationships. The equations tell you about the specific rates in the relationships.
Lesson SummaryStudents will experience identifying patterns involving a constant rate of change, completing a table, creating graphs, and writing equations. Students should recognize that all of these representations show that the relationships are proportional. They all increase with a constant rate of change as the other variable increases by 1. The relationships are all based on the proportional relationship between the levels, Zombies, and points. Have students go back to the fact that all of these relationships are balanced the same way in each representation. They all share a constant of proportionality among the compared variables.
Continuetofocusstudentsonthepatternsofchange(i.e.unitrate)ineachequation.Discusstheconnectionbetweenthecoefficient of the variable in the equation, which is also the slope of the line, and the rates in the table. As students move through the topic of algebraic reasoning, it would be helpful for students to recognize how the different representations are related and how each representation is equally valuable.
Students should be able to tell you that the information that is readily seen from the table is the exact values of the ordered pairs.Informationthatisreadilyseenfromthegraphisthegeneralpatternoftherelationship.Fromtheequation,youcanfindsolution, even those can be efficiently determined without drawing a table or graph.
Algebra Zapping Zombies, Grades 6–8, continued
© 2011 Math Solutions, mathsolutions.com. Reproducible for one teacher’s classroom use only.
Findmoreclassroomlessonsonlineat mathsolutions.com. Visitthe“EducatorTools”sectionandclickon“FreeClassroomLessons.”
6
Check for Success• Foreachrelationship,studentsshouldbeabletoidentifytheconstantofproportionality.Generatealistofallthepatterns observed(horizontallyandvertically)inthetable.Havestudentssharetheirstrategiesforfindingthemissingvaluesinthe table.Recordthesestrategiesandhavestudentsrecordatleastonestrategytheyfullyunderstand.Focusstudentson the multiplicative relationships.
• Studentsshouldbeabletogeneratealistofallpossibleunitratesandexplaintheinformationthatcanbegatheredfrom a unit rate.
• Havestudentssharetheirgraphssothattheycancompareandcontrastthegraphs.Haveaclassdiscussionaboutthe following: all relationships are linear, all graphs of the line pass through the origin, proportional relationships are linear, but can have different rates. Include the following questions in the discussion so that students can verbalize what they notice in the graphs and what they have learned. Did you expect the graphs to look like this? Why?
Did students use the same variables? Scales? Axes?
What intervals are used?
Are the relationships linear? How do you know?
What other information can you gather from the graph?
Can you make predictions about higher levels in the game?
• Havestudentssummarizeandexplaintheirequations.Youcanchecktheirunderstandingbyposinganyofthefollowing questions.
What steps did you use to write the equations?
Is it helpful to write a rule in words before you write the equation?
How can you write a rule as an equation?
In words, what does each equation mean?
What variables did you choose for your equation? Why? Can you define each variable?
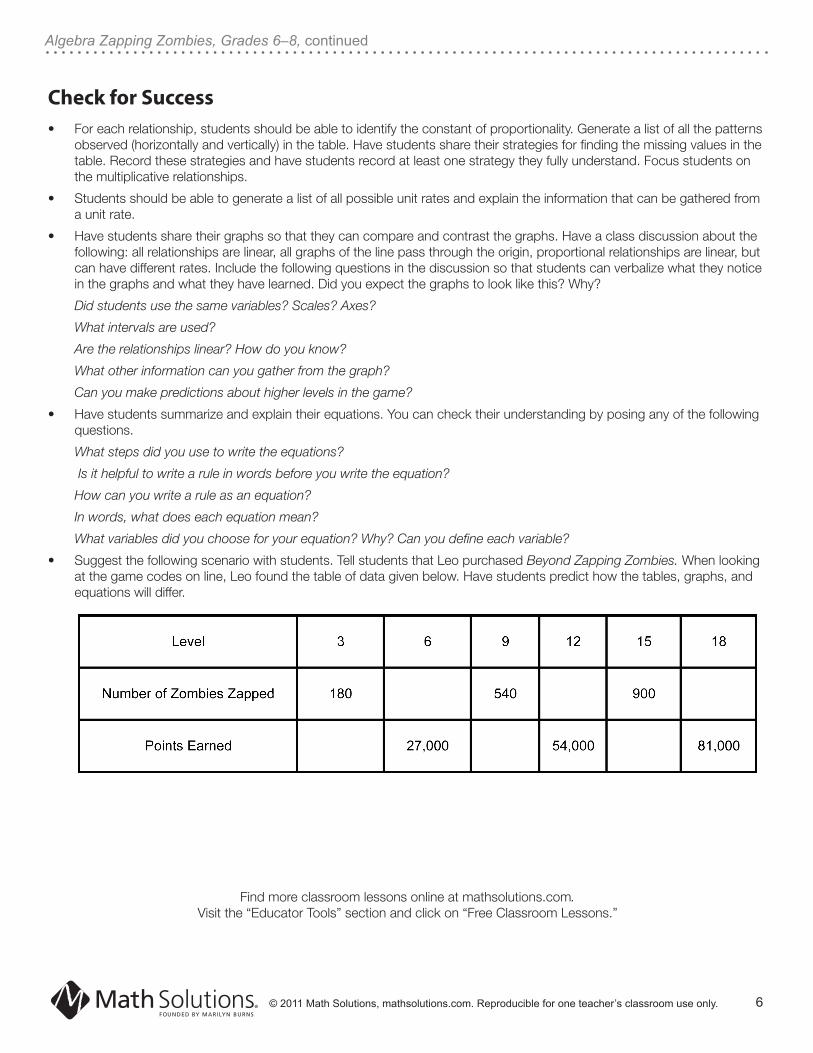
• Suggestthefollowingscenariowithstudents.TellstudentsthatLeopurchasedBeyond Zapping Zombies. When looking at the game codes on line, Leo found the table of data given below. Have students predict how the tables, graphs, and equations will differ.
Proportional Reasoning It’s All Connected © 2011 Math Solutions, mathsolutions.com. Reproducible for one teacher’s classroom use only.
Student_______________________________________Class___________Date_______
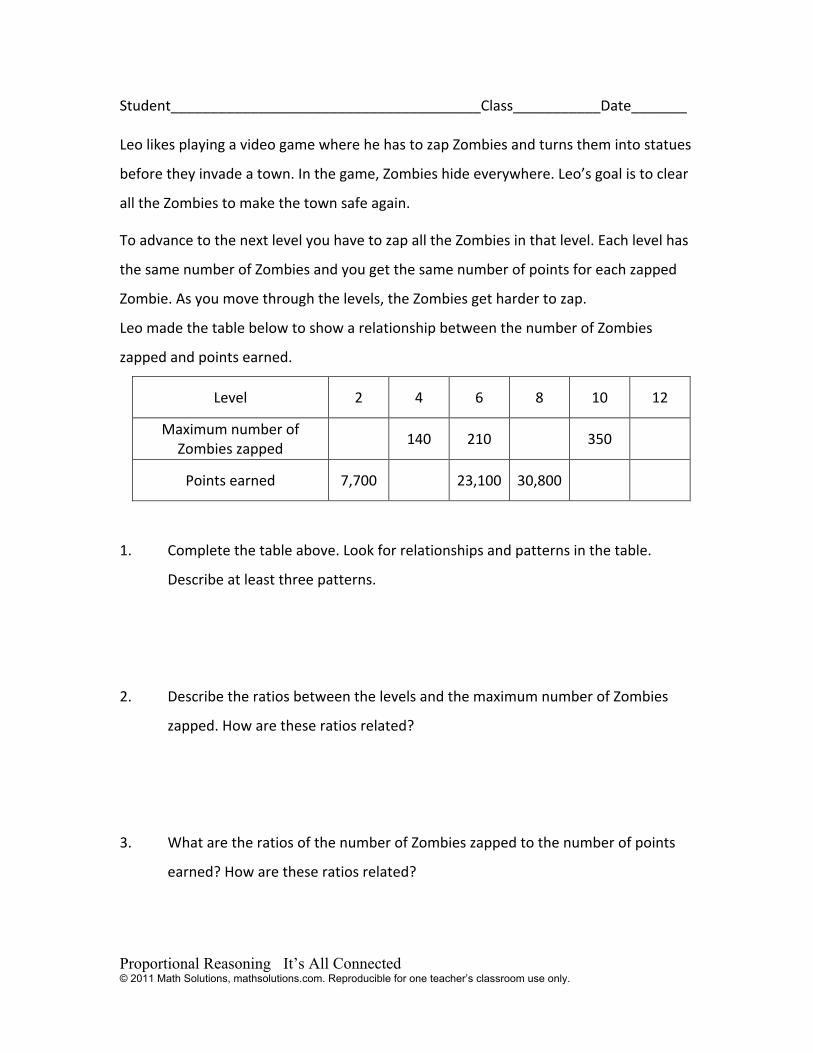
Leo likes playing a video game where he has to zap Zombies and turns them into statues
before they invade a town. In the game, Zombies hide everywhere. Leo’s goal is to clear
all the Zombies to make the town safe again.
To advance to the next level you have to zap all the Zombies in that level. Each level has
the same number of Zombies and you get the same number of points for each zapped
Zombie. As you move through the levels, the Zombies get harder to zap.
Leo made the table below to show a relationship between the number of Zombies
zapped and points earned.
Level 2 4 6 8 10 12
Maximum number of Zombies zapped
140 210 350
Points earned 7,700 23,100 30,800
1. Complete the table above. Look for relationships and patterns in the table.
Describe at least three patterns.
2. Describe the ratios between the levels and the maximum number of Zombies
zapped. How are these ratios related?
3. What are the ratios of the number of Zombies zapped to the number of points
earned? How are these ratios related?
Proportional Reasoning It’s All Connected © 2011 Math Solutions, mathsolutions.com. Reproducible for one teacher’s classroom use only.
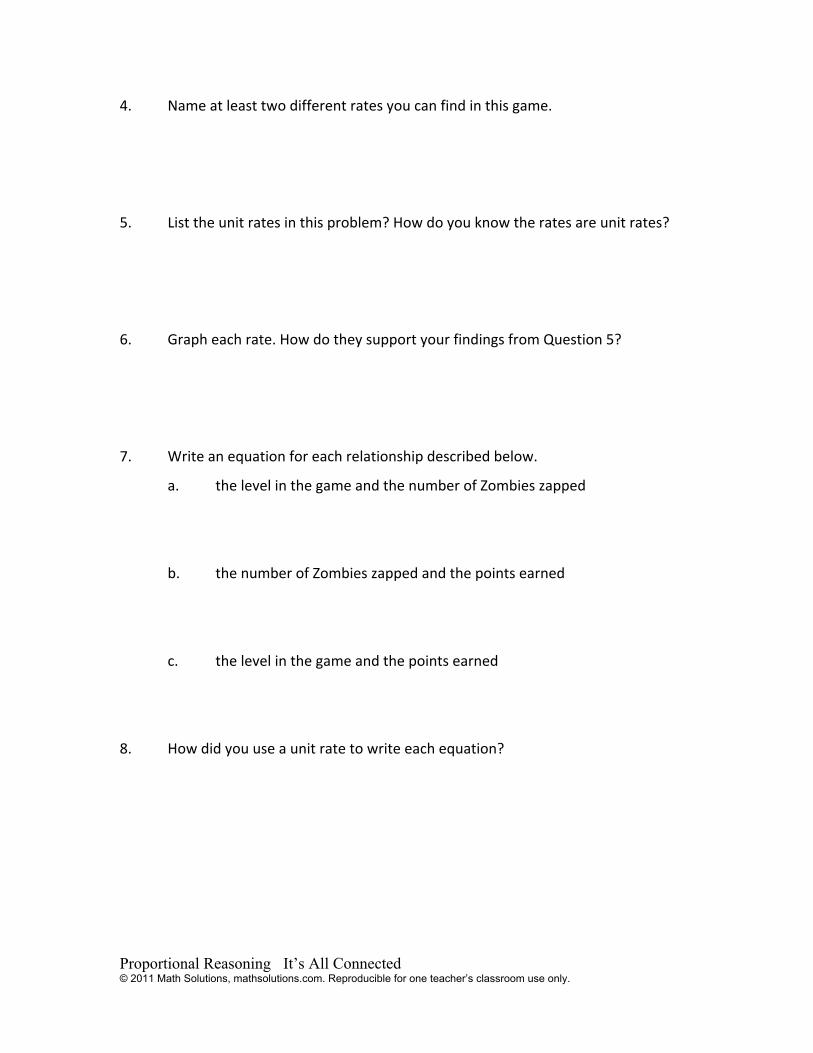
4. Name at least two different rates you can find in this game.
5. List the unit rates in this problem? How do you know the rates are unit rates?
6. Graph each rate. How do they support your findings from Question 5?
7. Write an equation for each relationship described below.
a. the level in the game and the number of Zombies zapped
b. the number of Zombies zapped and the points earned
c. the level in the game and the points earned
8. How did you use a unit rate to write each equation?
Proportional Reasoning It’s All Connected © 2011 Math Solutions, mathsolutions.com. Reproducible for one teacher’s classroom use only.
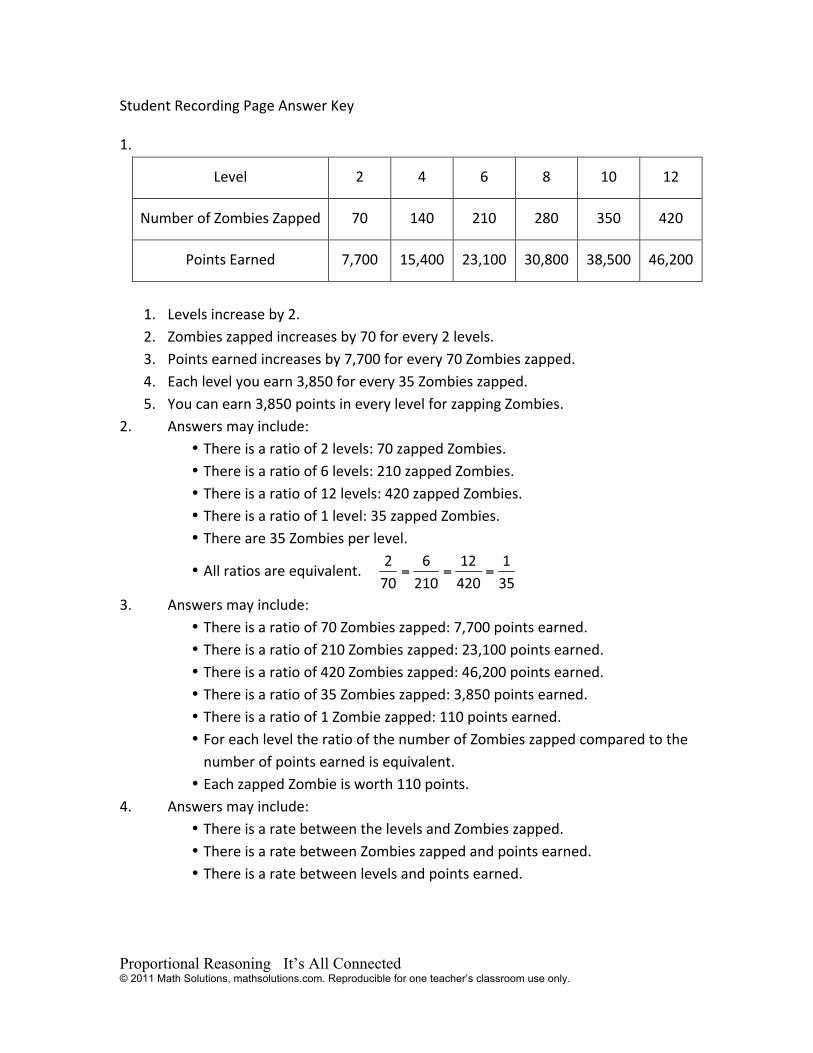
Student Recording Page Answer Key
1.
Level 2 4 6 8 10 12
Number of Zombies Zapped 70 140 210 280 350 420
Points Earned 7,700 15,400 23,100 30,800 38,500 46,200
1. Levels increase by 2. 2. Zombies zapped increases by 70 for every 2 levels. 3. Points earned increases by 7,700 for every 70 Zombies zapped. 4. Each level you earn 3,850 for every 35 Zombies zapped. 5. You can earn 3,850 points in every level for zapping Zombies.
2. Answers may include: • There is a ratio of 2 levels: 70 zapped Zombies. • There is a ratio of 6 levels: 210 zapped Zombies. • There is a ratio of 12 levels: 420 zapped Zombies. • There is a ratio of 1 level: 35 zapped Zombies. • There are 35 Zombies per level.
• All ratios are equivalent.
3. Answers may include: • There is a ratio of 70 Zombies zapped: 7,700 points earned. • There is a ratio of 210 Zombies zapped: 23,100 points earned. • There is a ratio of 420 Zombies zapped: 46,200 points earned. • There is a ratio of 35 Zombies zapped: 3,850 points earned. • There is a ratio of 1 Zombie zapped: 110 points earned. • For each level the ratio of the number of Zombies zapped compared to the number of points earned is equivalent.
• Each zapped Zombie is worth 110 points. 4. Answers may include:
• There is a rate between the levels and Zombies zapped. • There is a rate between Zombies zapped and points earned. • There is a rate between levels and points earned.
Proportional Reasoning It’s All Connected © 2011 Math Solutions, mathsolutions.com. Reproducible for one teacher’s classroom use only.
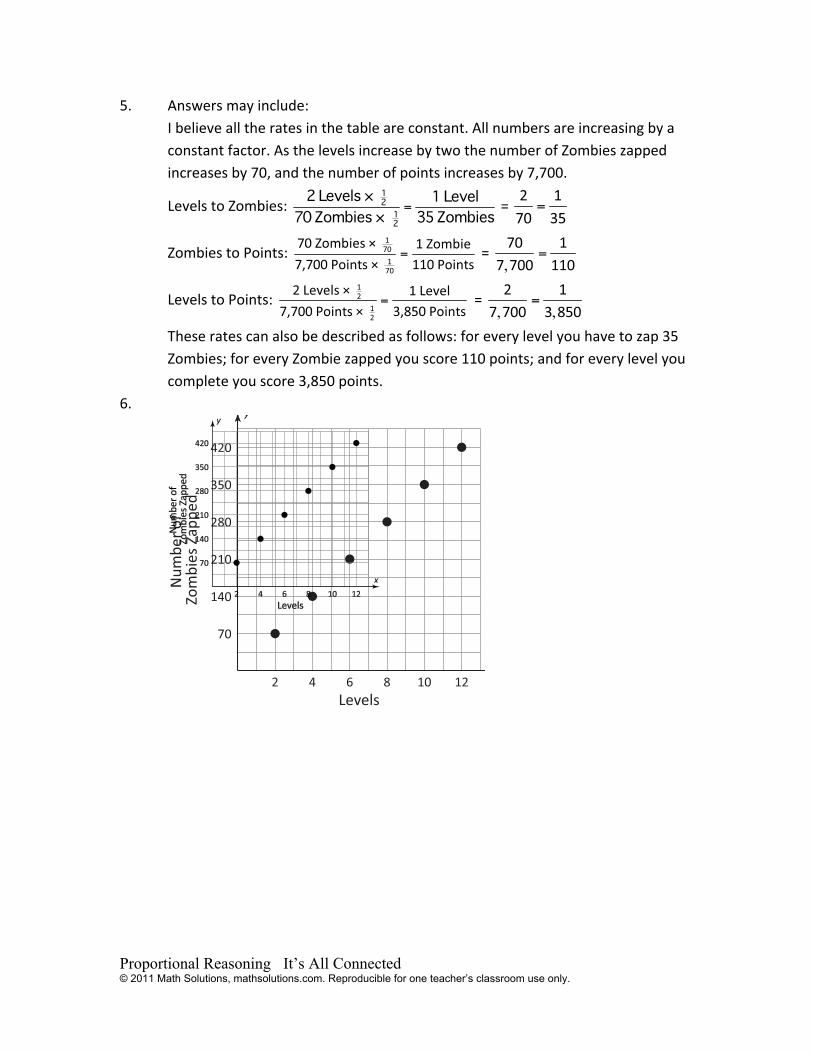
5. Answers may include: I believe all the rates in the table are constant. All numbers are increasing by a constant factor. As the levels increase by two the number of Zombies zapped increases by 70, and the number of points increases by 7,700.
Levels to Zombies: =
Zombies to Points: =
Levels to Points: =
These rates can also be described as follows: for every level you have to zap 35 Zombies; for every Zombie zapped you score 110 points; and for every level you complete you score 3,850 points.
6.
Levels42 6 8 10
70
Num
ber o
f Zo
mbi
es Z
appe
d
140
210
280
350
420
12
x
y
Proportional Reasoning It’s All Connected © 2011 Math Solutions, mathsolutions.com. Reproducible for one teacher’s classroom use only.
Number of Zombies Zapped200100 300 400 500
5,000
Num
ber o
f Po
ints
Ear
ned
10,000
15,000
20,000
25,000
30,000
35,000
40,000
45,000
x
y
Levels42 6 8 10
5,000
Num
ber o
f Po
ints
Ear
ned
10,000
15,000
20,000
25,000
30,000
35,000
40,000
45,000
12
x
y
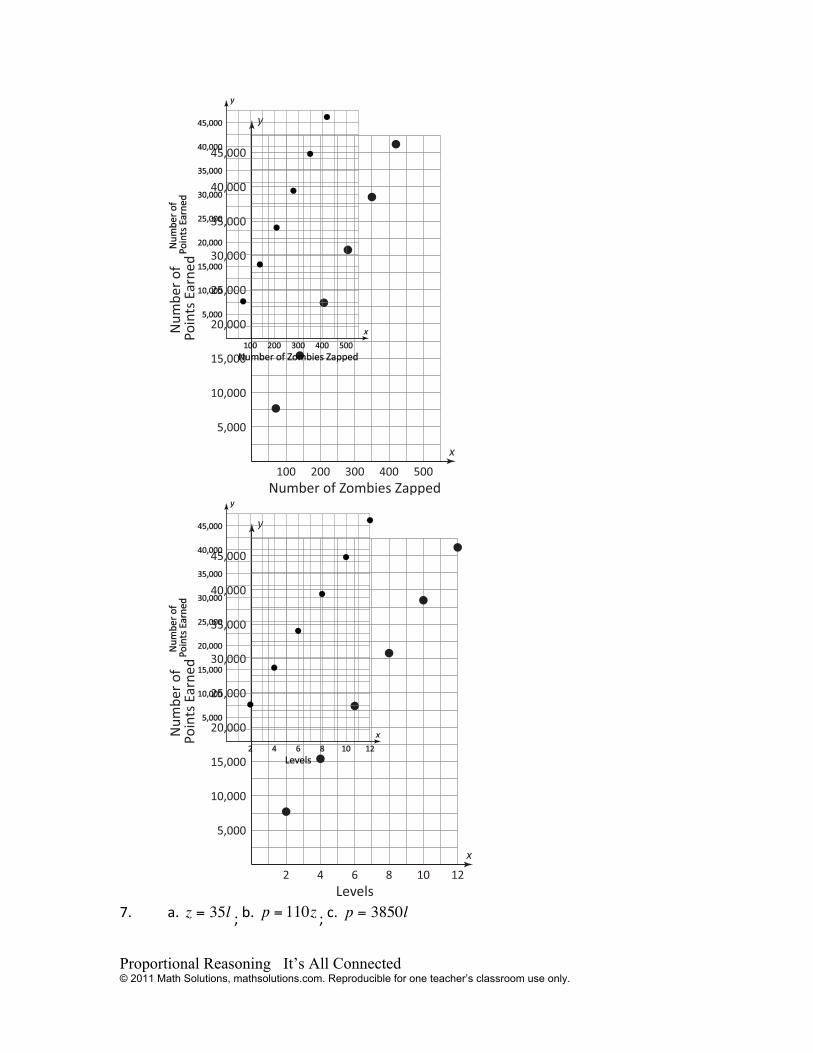
7. a. ; b. ; c.
Proportional Reasoning It’s All Connected © 2011 Math Solutions, mathsolutions.com. Reproducible for one teacher’s classroom use only.
8. Answers may include: The table helped me. I found the constant rate of change which became the coefficient of the independent variable in the equation. From the table I saw the unit rate for each relationship. If you know the amount of change per variable, then you can multiply that value by any number (or independent quantity) to find the total dependent quantity. From the graph I saw that it was a linear relationship and then found the slope (the amount of vertical change for every one unit of horizontal change). Finally, I wrote the equation y = slope times x.