algebra for every eighth grade student: one size
TRANSCRIPT

ALGEBRA FOR EVERY EIGHTH GRADE STUDENT:
ONE SIZE FITS ALL?
by
Lori R. Best
A Master’s Paper
Submitted in Partial Fulfillment of
The Requirements for the Degree of
Master of Science in Education – Secondary Mathematics
The University of Wisconsin-River Falls 2011

“Algebra For Every Eighth Grade Student: One Size Fits All?”
Lori R. Best
The purpose of this paper is to investigate the reasons why Minnesota enacted legislation
in 2007 requiring the enrollment in and successful completion of algebra 1 by every eighth grade
student, and how, specifically, one school district implemented changes to meet this requirement.
From the “new math” of the 1960’s to standards-based reform of the 21st century, United States
public school students have been subjected to various trends in education; yet when compared to
other countries, standardized test scores have fallen. How can this trend be reversed? The U.S.
federal government has imposed legislation to require all students to demonstrate proficiency as
measured on annual high-stakes testing. Each state has been challenged to increase the rigor in
math as public schools across the country are working to meet the ever-increasing proficiency
targets laid out in No Child Left Behind. Algebra 1 content, in both the Minnesota academic
standards and the Common Core math standards, is expected to be mastered by students at an
earlier age than ever before. How can students achieve this goal?
In this paper you will learn how the administration and math department at the middle
school in Hastings, Minnesota, began increasing the rigor for students with new curriculum and
teacher staff development. They recognized the success of a program dedicated to the lowest
scoring 8th grade math students. This required a change in the math scheduling model and
allocated fifty percent more time for students in math class. Teachers used the time for more
instruction, one-on-one guidance, hands-on activities, technology exploration, and discovery
lessons. The results, as measured by the state’s annual assessment, showed a noticeable increase
in proficiency for Hastings eighth graders while the overall state average decreased from the
previous year. These results and scheduling model may be helpful to districts interested in
increasing student proficiency rates.

1
Introduction
Algebra 1 is considered to be a pivotal course in a student’s mathematical study. In the
1960’s and 1970’s, Algebra 1 was typically taken in the 9th grade. Those who were successful
moved on to study geometry and higher levels of math, continuing on a college preparatory
track. For those who were unsuccessful, they either repeated the course, took lower levels of
mathematics (i.e. “consumer math”), or simply ended their study of mathematics in high school.
It was considered to be an “effective filter to separate the college-bound students from their
work-bound classmates”. (Steen, 1999) Beginning in the last part of the 20th century, Algebra 1
became a course available to higher-level students in 8th grade, allowing them to reach the study
of calculus in high school. As expectations and rigor have increased, state standards have
followed this trend embedding more algebra 1 topics at the 8th grade level. In fact, a number of
states (such as California and Minnesota) have mandated legislatively that the successful
completion of Algebra 1 be required for all students in 8th grade. Why has this “pushing down”
of algebra become so important? Is this mandate what is best for all students? Is this level of
study appropriate for all students? Is the successful completion of algebra 1 in eighth grade
possible for all students, or is this a goal which is statistically impossible to attain? The purpose
of this investigation is to examine the reasons behind requiring algebra 1 at the eighth grade
level, how this drive for rigor at earlier ages has developed throughout the 20th century to today,
the role of policy set at the national and state levels, and how the Hastings, Minnesota district has
devoted extra time and resources to meet this challenge.
Why is the eighth grade deemed so important? Although much focus and attention is
given to high school data, test scores, graduation rates, etc., more and more attention has recently
been given to education and proficiency in the middle grades. While it may seem obvious that a

2
student’s success in later years (high school and beyond) is built upon prior success, a report
released in 2008 by the ACT organization shows the correlation between student performance in
the middle grades and future college and career readiness. “Our research shows that, under
current conditions, the level of academic achievement that students attain by eighth grade has a
larger impact on their college and career readiness by the time they graduate from high school
than anything that happens academically in high school” (ACT, 2008). The report further
reinforces the idea that trying to increase the rigor at the high school level will not be successful
unless the rigor at earlier grades is increased beforehand. This scaffolding approach must start in
the primary grades and build from there to ensure students have a solid foundation upon which to
build successfully (ACT, 2008). This is true in all states, and especially in Minnesota, where this
paper focuses special attention.
History
During the post-World War II era, the United States experienced an unprecedented
growth in its standard of living. The baby boom era had begun, and the cold war helped fuel a
competitive spirit to be the best in the world in math, science, and technology for the
preservation and defense of the “free world”. The National Science Foundation was created in
1950. Its purpose was “to promote the progress of science; to advance the national health,
prosperity, and welfare; to secure the national defense…" (NSF, 2011); however, the launch of
the Soviet Union’s Sputnik satellite in 1957 prompted America to quickly realize that it must
continue to work hard to compete internationally. Also in 1957, the NSF expanded to examine
and promote change in secondary math, biology, chemistry, and social sciences and to address
the growing need for more science and math educators (NSF, 1956). The space race coupled
with the cold war further fueled more competition, especially with the Soviet Union. The United

3
Stated educational system came under intense scrutiny. NASA was created by Congress in July
of 1958. The National Defense Education Act was signed into law in September of 1958,
providing funding for national defense fellowships and to provide financial assistance to the
ever-growing population of college students (Kosar, 2011). Prior to the U.S. involvement in
World War II, approximately 30.7% of high school graduates enrolled in college. By 1960,
approximately 45.1% of the nation’s high school graduates enrolled in college. (Young, 1982).
[To give some perspective, in the fall of 2010 that percentage had soared to 68.1%. (US Dept. of
Labor, Bureau of Labor & Statistics, 2011).] As more students enrolled in college and as more
emphasis and need for technical careers grew, more attention was placed on K-12 education.
Trends and “new” theories and methodologies began to influence educational practices as
the U.S. sought to remain an international leader. The National Defense Education Act of 1958
also provided funding to states to improve the teaching of math, science, and modern languages
(i.e. Russian). During the 1960’s the focus of education was on the content being taught, not the
skill or performance of the students. “New math” was thrust into the curriculum, with more
attention being devoted to set theory, number theory, modular arithmetic, and more abstract
concepts. Schools built in the 1970’s often had open classrooms, and the trends in education
became more student-centered: choice, inclusiveness, innovation, active learning, holistic
learning, and self-motivated/self-paced learning were common threads in instruction. By the
mid- to late 1970’s, standardized test scores began to decline and math textbooks returned to
traditional content and methods. The back-to-basics movement took hold and more attention
was given to not just content but student learning.
In April 1983, the National Commission on Excellence in Education released the report,
“Á Nation at Risk”. It noted that the United States was, “nation at risk ... [whose] educational

4
foundations ... are presently being eroded by a rising tide of mediocrity that threatens our very
future as a Nation and a people” (The National Commission on Excellence in Education, 1983). The
report suggested that America’s young people were not learning enough nor demonstrating
significant academic achievement (The National Commission on Excellence in Education, 1983) .
Significant findings in the study were quite disturbing and sparked the need for further change in
education. At that time, the achievement levels by high school students on standardized tests
were lower than 26 years prior (around the time that Sputnik was launched). Scores on the SAT
declined from 1963 to 1983, with verbal scores dropping 50 points and math scores dropping 40
points. From 1975 to 1980, colleges had to increase the amount of remedial math courses by
72%. These deficiencies in education were occurring at a time when the need for more highly
skilled workers and workers in new fields were rapidly increasing (The National Commission on
Excellence in Education, 1983). All of these factors led to a shift in how to measure academic
quality.
Instead of focusing on the inputs of education (resources, curriculum, spending), the
outputs (goals, products and results) became more important. Outcome-based learning and
emphasis on learner objectives became popular in the 1980’s. One of the voices for such reform
in the 1980’s was William Spady. While speaking against the confines of time, nine months at a
time, he proposed the concept of outcome-based education. (Spady, 1988). This model of
education reform, focusing on learner outcomes, is a student-centered learning style with more
progressive types of instruction, such as block scheduling, reform math, project based learning,
etc. Students must demonstrate mastery of an objective in order to move ahead, and if such
mastery was not passed, the student would not be promoted. Outcome based education was
popular in the 1980’s and 1990’s and was also referred to as mastery education or performance-
5
based education (Spady, 1988), and as a result many states began to implement outcome-based
types of programs.
In Minnesota, for instance, the effort to establish an outcome-based approach to student
learning began in 1972. The state Department of Education began developing Some Essential
Learner Outcomes (SELOS) which specified the content students would be taught. In the
aftermath of the “Nation at Risk” report, the Minnesota Legislature requested a report on
education. The Commissioner of Education, Ruth Randall, introduced proposals considered to
be quite radical at the time. (Manno, 1995) First, she proposed changing the graduation rule
from traditional “seat time” graduation standards with measurable learner outcomes. She also
asked for the creation of state achievement tests to measure individual student learning of these
outcomes. The legislature was not satisfied with Commissioner Randall’s report, and as a result
little action was taken. In 1984 the Minnesota Business Partnership produced a report which
called for a major reorganization of K-12 education. The recommendations included that all
students master certain common competencies and that the state develop uniform achievement
tests to measure whether students had attained them, very similar to Commissioner Randall’s
recommendations. After finally agreeing that the outcome-based approach would be required,
people from various roles (the governor, the legislature, the Department of Education, and many
others) began work on determining such outcomes. In 1991, the Minnesota State Board of
Education released its Outcome-Based Graduation Rule, including the following proposed
outcomes:
“In order to lead productive, fulfilling lives in a complex and challenging society and to continue learning, the graduate demonstrates the knowledge, skills, and attitudes essential to:
Communicate with words, numbers, visuals, symbols and sounds;

6
Think and solve problems to meet personal, social and academic needs; Contribute as a citizen in local, state, national and global communities; Understand diversity and the interdependence of people; Work cooperatively in groups and independently; Develop physical and emotional well-being; Contribute to the economic well-being of society.” (Manno, 1995)
There was strong opposition to these outcomes by several organizations, including parent groups,
because some of the outcomes described values and attitudes. It was not clear and specific as to
what some of these objectives meant, how they would be taught in a public school setting, nor
how they would be evaluated and measured by teachers. More discussion and work followed.
The opposition and lack of clarity in the objectives prompted then Governor Arne Carlson in
1993 to recommend delaying the implementation. By late 1993, the Minnesota Department of
Education (then known as the Department of Children, Families, and Learning) brought forth a
plan known as the Profile of Learning. It included thirteen competencies to be met for high
school graduation:
Comprehends, interprets, and evaluates information received through reading, listening, and viewing;
Uses strategies to understand and apply information from technical reading, such as manuals and research documents;
Writes and speaks clearly for academic, technical, and personal purposes with a variety of audiences;
Analyzes patterns and functional relationships in order to solve problems and determine cause/effect relationships;
Applies data handling and measurement techniques to solve problems and justify conclusions;
Applies methods of inquiry needed to conduct research, draw conclusions, and communicate and apply findings;
Understands the past and continuous development of societies and cultures in human history;
Understands how principles of interaction and interdependence affect physical and social situations;
Applies informed decision-making processes to promote healthy lifestyles, social well-being, and stewardship of the environment;
Understands the processes and meaning of artistic expression; Understands application of technological systems;

7
Understands the effective management of resources in a household, business, community, and government; and
Communicates using a language other than English.
(MN House of Representatives, 1998)
Again, more debate ensued and more revisions followed, until 1998 when a two-fold plan for
graduation requirements was finally adopted. The first part was the Basic Standards Tests: one
in reading (testing the ability to read at a degree of difficulty equal to popular adult nonfiction;
students tested in 8th grade), one in writing (testing the ability to write a composition in response
to a request for information; students tested in 10th grade), and in math (testing for understanding
through pre-algebra; students tested in 8th grade). The second part was the Profile of Learning,
which had been modified to include ten broad learning areas:
1. Read, view, and listen 6. Scientific applications 2. Write and speak 7. People and cultures 3. Literature and the arts 8. Decision making 4. Mathematical applications 9. Resource management 5. Inquiry 10. World languages (optional for students)
(Manno, 1995)
Within these areas, certain content standards are given (56 standards in grades K-8, 48 standards
in grades 9-12). To graduate from high school, students were required to complete:
complete one content standard within each group or cluster; complete two standards within learning area 6; complete at least 21 of 47 standards in learning areas 1 to 9; complete at least three other content standards as electives; and use computer technology in completing a required content standard in learning areas 2, 4, 5, and 6. (Larson, 1998)
In theory, the concept of setting high, rigorous expectations that are assessed and measured in
order to demonstrate learning is a good, positive policy that should benefit students, teachers,
and families alike. So why has this approach been changed and/or completely abandoned?

8
Other countries, such as Australia, South Africa, and Hong Kong, implemented OBE models, but
have since dropped these methods. What led to turning away from this reform? Minnesota’s
objectives, like others, were worded in such a broad, vague manner, which were difficult for
consistent implementation across districts. Assessments were difficult to measure and these
outcomes did not definitively seem to raise student achievement (Manno, 1995).
In the mid 1980’s, the National Governor’s Association devoted 12 months to study the
issue of education. The driving force was that better schools will produce more educated
workers in order to compete with workers around the world (National Governor’s Association,
1986). Later, in 1989, President Bush and the nation’s governors met at an Education Summit
held in Charlottesville, Virginia. The goal was to develop ambitious, yet realistic goals for the
performance of all students. To do this the country must have a common mission. The
following six goals for the year 2000 were set:
All children will start school ready to learn at least 90 percent of all students will graduate from high school all students will demonstrate competence in challenging subject matter U.S. students will be first in the world in math and science every adult will be literate every school will be safe and drug-free. (NY Times, 1989)
Also in 1989, the National Council of Teachers of Mathematics published Curriculum and
Evaluation Standards for School Mathematics. This laid the groundwork or foundation for states
to model their own standards. The United States, unlike many countries, did not (and still does
not) have a national curriculum for education. Therefore, education is a function of each of the
states. This first publication was published with the intent that states would use it as a guide in
the development of their own standards. (NCTM, 1989).

9
During the 1990’s, developing standards and the standards-based reform movement took
hold. In 1990, only 1 in 6 eighth grade students were enrolled in algebra 1 (Loveless, 2008).
When President Clinton took office, his administration made it a national goal to get 8th graders
enrolled in algebra. The feeling was that the U.S. was falling behind other countries, and setting
this goal would begin to close that gap (Loveless 2008). In 1996, Washington D.C. schools led
the nation with 53% of its 8th graders enrolled in algebra. From 1990 to 2000, enrollment in
algebra by 8th graders increased from 16% to 24% nationally. By 2007, the national rate had
grown to 31%. Some of this push for algebra seemed to be motivated by equity issues.
(Loveless, 2008). Robert Moses, civil rights leader, teacher, and founder of The Algebra Project
(a foundation dedicated to improving minority education in math), suggested that algebra should
be considered “the new civil right”. The study of algebra meant access; it represented open
doors to productive careers and access to big ideas (Moses, 1995). This prompted more attention
and action to improve student achievement in mathematics.
In November of 1998, Richard Riley, then U.S. Secretary of Education said, “Today’s
students must master high-level mathematical concepts and complex approaches to solving
problems to be prepared for college, careers of the 21st century and the demands of everyday
life.” Shortly after this, Secretary Riley appointed a 25 member commission on the teaching of
math and science for the 21st century. This commission, chaired by former astronaut and senator
John Glenn, was charged with the task “to investigate and report on the quality of mathematics
and science teaching in the nation, directing us to consider ways of improving recruitment,
preparation, retention, and professional growth for mathematics and science teachers in K–12
classrooms nationwide. You reminded us that, three decades after a historic achievement, ‘we
need to set the stage for advancement in mathematics and science for the next thirty years.’ ”

10
(U.S. Dept. of Education, 2000). The commission identified four reasons that children in the
U.S. should achieve competency in math and science:
(1) the rapid pace of change in both the increasingly interdependent global economy and in the American workplace demands widespread mathematics- and science-related knowledge and abilities; (2) our citizens need both mathematics and science for their everyday decision-making; (3) mathematics and science are inextricably linked to the nation’s security interests; and (4) the deeper, intrinsic value of mathematical and scientific knowledge shapes and defines our common life, history, and culture. (U.S. Dept. of Education, 2000)
It further identified five factors which made it the perfect time to enact change:
(1) reform efforts have sharply focused the attention of the American people on education as a public issue; (2) the nation now has a surplus of resources to invest in education; (3) a coming demographic shift in the teaching force—two thirds of which will be retiring in the next decade—offers an unparalleled chance to plan for and make changes at the core of education itself; (4) our schools can now put to work what educators have learned in the past generation about curriculum, high standards, effective teaching, assessment, and how children learn; and (5) the rising generation of college graduates is once again showing an interest in teaching as a profession.
(U.S. Dept. of Education, 2000)
The main message from the report was that American students must perform better in order to
compete in a global economy. Analyzing the data from TIMSS (the Third International Math
and Science Study, 1995), students from other countries were still outperforming their American
peers.

11
(U.S. Dept. of Education, 2000)
The NAEP (National Assessment of Educational Progress) results from 1996 corroborated the
lack of improvement in American student performance. Periodically, students are assessed in
math and science by NAEP and rated in one of four categories: Below Basic, Basic, Proficient,
or Advanced. Less than one third of the students tested were proficient, and more than one third
of the students were below the basic level.
The commission’s solution to improve student performance is
to improve math and science teaching. Three goals were
formulated:
Goal 1: Establish an ongoing system to improve the quality of mathematics and science teaching in grades K–12. Goal 2: Increase significantly the number of
mathematics and science teachers and improve the quality of their preparation. Goal 3: Improve the working environment and make the teaching profession more attractive for K–12 mathematics and science teachers.
(U.S. Dept. of Education, 2000)
In the same year that this report was released, the NCTM
released the Principles and Standards for School
Mathematics. This publication reflected the efforts of the
NCTM as an ongoing process. As the new millennium
began, the NCTM recognized the need for mathematics in a
changing world. Everyone needs to be able to understand and use mathematics in everyday life,
in the workplace, and in the scientific and technical communities. “In this changing world, those

12
who understand and can do mathematics will have significantly enhanced opportunities and
options for shaping their futures. Mathematical competence opens doors to productive futures.”
(NCTM, 2000).
The standards-based reform movement of the 1990’s took a giant step when Congress re-
authorized the Elementary and Secondary Education Act in 2001. Known now as the No Child
Left Behind Act (NCLB), this act now required that all states test students annually in reading
and math, and that school must demonstrate that students are making adequate yearly progress
(AYP) in order to avoid sanctions. Each state is responsible for setting and implementing its
own standards and assessments. By the year 2014, all students are expected to be proficient in
reading and math, as measured on each state’s version of its reading and math assessments.
One of the unfortunate outcomes from NCLB is that some states have enacted more
rigorous standards than others. It is difficult to compare one state’s proficiency rates to another
because of this. Some states may show a higher proficiency rate in passing their own proficiency
tests—are those students truly more knowledgeable or is this because their states’ standards are
lower, making it easier for students to pass test? There exist some large discrepancies in student
proficiency between the states; one of the ways to illustrate this is by using the Northwest
Evaluation Association’s Scale Alignment studies for the states that use NWEA’s Measure of
Academic Progress testing products in their schools.
“NWEA has conducted Scale Alignment studies to link the RIT scale to the proficiency levels from many state assessments.
Each alignment study identifies the specific Rasch Unit (RIT) scale scores from MAP assessments that correspond to the
various proficiency levels for each subject (reading, mathematics, etc.) and for each student grade.
Alignment studies also estimate the probability that a student with a specific RIT score will achieve a status of proficient or
better on her or his state test. Because all states set their own standards for proficiency and may use different tests for
measuring student achievement, alignment studies are usually necessary for each state.
When states use this information with NWEA assessments, member schools can monitor their students' progress toward the
proficiency standards for their states. This has been an important step toward helping our schools and districts to meet the

13
No Child Left Behind legislation. School districts can get copies of their state alignment studies from the research section of
the NWEA web site and use the data for planning of curricular and instructional improvements.” (NWEA, 2007-2011)
The recommended fall MAP test scores to be proficient on state assessments in math in grade 8
vary greatly, from lows of 211 in Georgia and 213 in Maryland to 237 in Massachusetts and 235
in California (see table below).
State RIT score State
RIT score State
RIT score
AZ 227 KY 226 NC 225
AR 225 ME 231 ND 225
CA 235 MD 213 OH 222
CO 233 MA 237 OR 224
DE 224 MI 222 PA 223
FL 222 MN 231 RI 231
GA 211 MT 234 SC 227
ID 229 NV 225 UT 226
IL 215 NH 231 VT 231
IN 224 NJ 224 WA 233
IA 225 NM 231 WI 217
KS 225 NY 225 WY 231
(NWEA, 2007-2011)
From the 2011 normative data compiled by NWEA, the mean RIT score for an eighth grade
student in the fall of the year is 230.2. Clearly, a number of states are setting proficiency targets
far below this mean score.

14
(NWEA, 2011)
The expectation of the states, as put forth in the NCLB legislation, was that states would set high
academic standards. With such variation on the interpretation of where the level of proficiency
should be set amongst the states, there became questions of why the U.S. does not have national
academic standards.
Eighth Grade Focus
Adding to the need for common standards across the country was the importance of
success in the middle grades. It is critical for students to be successful in the middle grades,
especially by eighth grade, because it is an accurate predictor of future success— “…the level
of academic achievement that students attain by eighth grade has a larger impact on their college
and career readiness by the time they graduate from high school than anything that happens
academically in high school.” (ACT, 2008). The findings emphasize that “…students’ academic
readiness for college and career can be improved when students develop behaviors in the upper
elementary grades and in middle school that are known to contribute to successful academic
performance.” (ACT, 2008)
California’s legislature was one of the first to mandate algebra 1 testing for all eighth
graders in July of 2008 (Minnesota’s legislature passed the requirement in 2007 that eighth

15
graders successfully complete algebra 1 beginning in 2010-2011). The California mandate was
blocked when it came before the appeals court in December of that year, because the process
used by the State Board of Education did not adequately inform the public. During this time,
much discussion took place in education circles whether “algebra for all” at the eighth grade
level is appropriate. While a push for higher standards and equity among all students is noble
and good, care must be taken to determine if every student is ready. Many students are still
unprepared as they enter eighth grade—they must first have mastered basic skills—in order to be
successful in algebra (McKibben, 2009). Steps must be taken to ensure that teachers are
adequately trained to teach algebra 1—a study from California in 2008 found that of the 3,790
teachers in middle school teaching algebra, one third are either underprepared to teach the
subject or are teaching out of their licensure area/field (Guha, 2008). (At Hastings Middle
School, Hastings, Minnesota, all 7th and 8th grade math teachers are considered “highly
qualified”, holding licensure in either grade 7-12 mathematics (six of eight teachers) or grades 1-
6 with a grade 5-8 mathematics specialty (two of eight teachers)). With the continued idea of
pushing algebra down to the 8th grade level for more and more students (if not all), this study
highlighted the need to recruit, prepare, retain and support middle school teachers as well as
teachers in earlier grades so that students are well prepared for algebra 1 and subsequent higher
math classes (Guha, 2008).
The public schools in Norfolk, VA, have been dedicated since 2000-2001 to increase the
number of students in algebra 1 in middle school through a project called “Algebra for All”.
Though not mandated by law, their goal is to close the achievement gap, provide higher quality
mathematics learning at earlier ages, and to have all students master algebra 1 prior to high
school, as measured by proficiency on the statewide end-of-course algebra 1 exam. To achieve

16
this, they integrated algebra content in all grades (pre K-7) prior to grade 8, increasing (doubling)
class time in grades 6 and 7, and focusing more professional development and training for
teachers. (Paek, 2008, Algebra for All). Enrollment in the algebra 1 course has increased and at
the same time, the percentage of students passing the course and the state’s end-of-course exam
has increased from 41% to 69% (Paek, 2008, Raising Student Achievement).
Minnesota
The Minnesota legislature passed an algebra requirement in 2007 for all eighth graders.
It states that all eighth graders must complete an algebra 1 credit by the end of eighth grade, to be
implemented by the 2010-2011 school year (Larson, 2010). This requirement was timed
concurrently with the adoption of the 2007 mathematics standards, which would first be assessed
on the Minnesota Comprehensive Assessment III (MCA III) in the spring of 2011. The 2007
standards for eighth grade focus heavily on the algebra strand and primarily on linear equations,
slope/rate of change, and systems of linear equations with the ability to represent them
graphically, algebraically, and numerically (see appendix 1). Quadratic functions and other
traditional non-linear topics typically included in an algebra 1 textbook are not included in the
eighth grade standards; they are included later, at the high school level. Therefore, in order to
comply legally, a number of middle schools in Minnesota have created an algebra course which
satisfies the legislative requirement, incorporates the standards for grade 8, and covers the linear
topics/chapters often found in the first half of a traditional algebra 1 textbook.
Shortly after the passage of the Minnesota and California laws requiring algebra 1 for
eighth graders, the National Council of Teachers of Mathematics (NCTM) published a position
paper on this same issue. Released in the fall of 2008, the paper explains that algebraic concepts
and skills should be a focus in the entire pre K-12 curriculum and that all students must have

17
access to learning algebra, but the timing of learning algebra is critical. “Only when students
exhibit demonstrable success with prerequisite skills—not at a prescribed grade level—should
they focus explicitly and extensively on algebra, whether in a course titled Algebra 1 or whether
any integrated mathematics curriculum. Exposing students to such coursework before they are
ready often leads to frustration, failure, and negative attitudes towards mathematics and
learning.” (NCTM, 2008). Despite this position, the states must comply with the grade specific
standards and tests of No Child Left Behind.
When the Elementary and Secondary Education Act of 1965 was originally passed, it
prohibited the establishment of a national curriculum. Since the act was reauthorized in 2001 as
NCLB, and as states have each been setting their own standards and assessments, there has been
a push for some type of national academic standards in math and reading. In 2009, the National
Governor’s Association and the Council of Chief State School Officers, in partnership with
Achieve, Inc., ACT, and the College Board, worked to lead the Common Core State Standards
Initiative. The goal was to develop a set of standards in English/Language Arts and Mathematics
that the states can voluntarily adopt. Each state may also add to these standards, as long as the
core standards comprise at least 85% of the state’s standards (National Governor’s Association,
2009). In June 2010, the Common Core State Academic Standards in English-Language Arts
and Mathematics were released for adoption by the states (see appendix 2). To date, 45 of 50
states and 3 of 6 territories/districts have adopted these standards. Minnesota has chosen to
adopt the English-Language Arts standards but not the Mathematics standards. Initially, it was
reported that then Governor Tim Pawlenty and Education Commissioner Alice Seagren felt the
Common Core standards in mathematics were not as rigorous as the 2007 Minnesota standards.
(Stacey, 2010). The Minnesota legislature has also enacted specific timetables for the revision

18
of academic standards. The mathematics standards are not set to be revised again until 2015 by
the Commissioner of the Department of Education. The commissioner does not have the
authority to revise the math standards earlier unless further legislative action is taken. (MN
Dept. of Education, November 2011).
District
At Hastings Middle School in Hastings, Minnesota, the process of ramping up the rigor
began in earnest in school year 2004-2005. New statewide math standards had been adopted in
2003, and a concerted effort was made to target the lowest performing students in grade 8. At
this time, the students in 8th grade took the Minnesota Basic Skills Test in Mathematics, which
was the test required for high school graduation. Several budget cuts had been made in order to
improve the district’s financial situation; certain electives and other programming had been
eliminated (The district was working its way out of statutory operating debt.). Many class sizes
were quite large (eighth grade pre algebra sections numbered in the upper 30’s per class and
some sections of algebra 1 above 40 students per class). Despite this, class sizes for the lowest
performing math students were intentionally held below 20 students, and an increase of student
contact time given to improve math performance. The school operates on a day 1, day 2
schedule (a modified block schedule with certain classes meeting every other day). Math classes
for all grades meet for one class period every day; however, the lowest performing students in 8th
grade were scheduled with an extra class period every other day in order to give teachers more
instructional time for discovery, exploration, lab activities, and more in depth study of topics.
The course was named (MS)2, “ms squared” meaning Middle School Math Success. Teachers
were given extra staff development time to create and implement a variety of additional hands-on
activities, technology labs, and real world activities, explorations, and projects to enrich students’

19
learning experiences. The results for all students, as measured in 2005 by the Minnesota BST,
were noticeable.
8th Grade Data Hastings Percent
Proficient
Hastings Average Score
State Percent
Proficient
State Average Score
2003 MN Basic Skills Test (BST)
74.6% 629.1 71.7% 629.7
2004 MN Basic Skills Test (BST)
69.5% 623.8 70.7% 630.8
2005 MN Basic Skills Test (BST)
76.1% 631.3 74.3% 632.0
(MN Dept. of Education)
In 2006, the first MCA-II (Minnesota Comprehensive Assessments) tests were administered.
This was the first year the new academic standards passed in 2003 were assessed. Because of
the success students demonstrated , particularly the lowest achieving students, and the
expectations set forth in NCLB for ever-increasing levels of proficiency amongst students, the
school restructured its daily schedule to allow for the extra class time (referred to as block-and-a-
half scheduling) for all 7th and 8th grade math classes and students. (Unfortunately, the schedule
didn’t allow for such restructuring at the 6th grade level.) In the fall of 2007, new curriculum
was adopted and implemented from kindergarten through 12th grade. A significant amount of
time was dedicated to plan and structure the progression of curriculum vertically K-12 for all
learners. Although the data in the table below shows a dip in MCA-II scores in 2008 for both
Hastings and statewide, the proficiency levels have made an overall increase in the past five
years. The MCA-III tests were first administered in the spring of 2011 and assessed student
performance based on the academic standards adopted in 2007.

20
8th Grade Data Hastings Percent
Proficient
Hastings Average Score
State Percent
Proficient
State Average Score
2006 MCA-II 53.86% 849.87 56.68% 850.81 2007 MCA-II 60.5% 851.4 58.7% 851.2 2008 MCA-II 56.0% 851.1 58.2% 851.3 2009 MCA-II 60.8% 853.3 59.6% 852.0 2010 MCA-II 60.5% 852.9 58.5% 851.6 2011 MCA-III 64.7% 854.0 53.1% 849.8
(MN Dept. of Education)
While not able to truly compare the 2010 results to the 2011 results (the standards
changed and an entirely different test, MCA-II versus the MCA-III, was administered), Hastings
eighth graders managed to increase the level of proficiency by 4.2 percentage points, while the
state overall decreased by 5.4 percentage points. Because of such significant improvement in
scores, the administration and teaching staff strongly advocated for the increased time schedule
for all grades; as a result, every student in Hastings Middle School now receives this modified
block schedule of time for math: 48 minutes one day, 96 minutes the next. The extra class time
is intended to improve student learning and to enrich and deepen understanding of the math
content. Teachers utilize the extra time in a variety of ways: providing additional practice,
giving additional instruction, remediating as needed, enhancing and enriching learning through
hands-on activities and technology-rich applications. A few examples of these lessons are
provided in appendix 3. Because of the increased rigor in the new curriculum, each year’s
lessons and timeframes are modified to adjust for higher levels of prior learning. More
professional development opportunities are available for teachers—the Minnesota Department of
Education has initiated nine regional teacher academies for math and science, providing
professional development and STEM initiatives in order to impact classroom instruction.
In order to comply with state law, Minnesota schools also had to ensure each 8th grade
student was enrolled in an Algebra 1 course by the 2010-2011 school year. In order to move the

21
lowest achieving students up to this level, each school year from 2007-2008 required students in
the lowest track of math to be advancing in rigor and curriculum. In the first years our lowest
performing students were placed in a course 1 middle school textbook, the text used for our at-
grade-level fifth grade students. Each year the lowest track’s students progressed to the next
highest level (course 2, course 3) until attaining Algebra 1. Today at Hastings Middle School,
there are four levels/tracks of math in the 8th grade: Linear Algebra Essentials (students
complete the first half of the textbook through lines and systems of linear equations with
modifications and accommodations necessary for struggling learners and students with special
education requirements), Linear Algebra (students complete the first half of the textbook through
lines and systems of linear equations), Algebra 1 (students complete the entire textbook, linear
and quadratics), and Honors Geometry (which qualifies for high school credit). These
paths/tracks will ensure that during high school, students will complete an Algebra II credit
(mandated by the state legislature by the year 2014-2015). It is important to note that while
much emphasis and resources are placed on struggling learners, the gifted and talented learners
are being provided with additional options too. For those students on the highest accelerated
path, AP Calculus AB could be taken as a junior, with the option of taking AP Calculus BC as a
senior. Students could also take AP Statistics anytime after completing Algebra II. The students
with these options are currently sophomores (the class of 2014). The high school is also
considering offering a College-in-the-Schools course in College Algebra, for those college-
bound students who complete algebra II but may not be ready for pre-calculus or may not wish
to take a pre-calculus or calculus course.
Conclusion

22
Since the launch of Sputnik, the educational system and teaching practices in the United
States have been scrutinized. Over the decades, the emphasis has shifted from the inputs and
resources to the outputs and student learning. This shift has led to the development and
continued revision of state standards in mathematics. Federal legislation (No Child Left Behind)
requires that proficiency rates continue to increase each year until 2014 when it is expected that
all students are proficient. While most states have continued to update and increase the rigor of
such standards, there remains great inconsistency from one state to another in determining what
“proficient” means at each grade level. With the release of the Common Core State Standards in
June of 2010 and the overwhelming response by the states to adopt them (45 of 50 at the time of
this writing), it appears that the majority of the country’s students will soon be held to more
consistent levels of proficiency. The debate continues as to whether all eighth grade students are
ready for algebra 1. While many would agree that most students, given the proper preparation
and strong work habits, can rise to meet the challenge of more rigor, we must remain flexible
enough to accommodate those students who have not developed the skills to succeed. Teachers
may not agree with the laws imposed upon the educational system, nor do they condone the
judgment of student/teacher/school quality based on only one high stakes test; but they do want
students to be challenged with rigor and high quality instruction. Not every eighth grade student
may be ready for the abstraction of a traditional algebra 1 course. In Hastings, this was
acknowledged, but the enactment of legislation requiring algebra 1 concepts for every eighth
grader forced teachers to plan and prepare students for this level. By preparing students well in
the K-7 curriculum and modifying and differentiating instruction, more students than ever can
learn algebraic concepts laid forth in the standards. Whether every eighth grade student can

23
demonstrate mastery and score at a proficient on one high stakes test remains to be seen—and
this will continue to be the challenge.

24
References
“2011 MCA-III Math Public Results” Minnesota Department of Education. 14 September 2011. Web. 29 October 2011.
“2011 Normative Data.” Northwestern Evaluation Association. 2011. Web. 26 September 2011.
ACT. “The Forgotten Middle: Ensuring that All students are on Target for College and Career Readiness before High School.” Iowa City, IA: ACT. 2008. Print.
“About the National Science Foundation.” National Science Foundation. Web. 18 July 2011.
“About the Standards.” Common Core State Standards Initiative, Preparing America’s Students for College & Career. Web. 18 July 2011.
“Adoption by State.” Common Core State Standards Initiative, Preparing America’s Students for College & Career. Web. 7 November 2011.
“Algebra: What, When, and for Whom, A Position Paper of the National Council of Teachers of Mathematics.” NCTM. National Council of Teachers of Mathematics. September 2008. Web. 18 July 2011.
“College Enrollment and Work Activity of 2010 High School Graduates.” U.S. Department of Labor, Bureau of Labor and Statistics, Economic News Release, 8 April 2011. Web. 18 July 2011.
“Common Core State Standards for Mathematics.” Common Core State Standards Initiative, Preparing America’s Students for College & Career. Web. 18 July 2011.
“Forty-Nine States and Territories Join Common Core Standards Initiative.” National Governor’s Association. 1 June 2009. Web. 11 November 2011.
Guha, R., Shields, P., Tiffany-Morales, J., Bland, J., & Campbell, A. “California’s teaching force 2008: Key issues and trends.” Santa Cruz, CA: The Center for the Future of Teaching and Learning. 2008. Print.
“Ideas and Trends: ‘A Jeffersonian Compact’; The Statement by the President and Governors.” New York Times. 1 October 1989. Web. 18 July 2011.
Kosar, Kevin. “National Defense Act of 1958.” Federal Education Policy History. Wordpress. 3 June 2011. Web. 18 July 2011.

25
Larson, Lisa. “Minnesota’s High School Graduation Requirements” Minnesota House of Representatives. July 2010. Web. 10 November 2011.
Larson, Lisa. “Profile of Learning and the State’s High School Graduation Rule”, Minnesota House of Representatives. September 1998. Web. 12 November 2011.
Loveless, Tom. “The 2008 Brown Center Report on American Education: The Misplaced Math Student Lost in Eighth Grade Algebra” Washington DC: The Brookings Institution. September 2008. Print.
Manno, Bruno V. “Outcome Based Education: Miracle Cure or Plague?” Mackinac Center for Public Policy. 1 September 1995. Web. 18 July 2011.
Massell, Diane. “The current status and role of standards based reform in the United States”. Paper prepared for the National Research Council Workshop on Assessing the Role of K-12 Academic Standards in the States. National Academies. 18 January 2008. Web. 18 July 2011. McKibben, Sarah “Should all 8th Graders Take Algebra?” Education Digest, 74:7 March 2009, pp. 62-64. Print.
“Minnesota K-12 Academic Standards in Mathematics.” Minnesota Department of Education. 28 September 2008. Web. 25 April 2011.
Moses, Robert, “Algebra, The New Civil Right.” In The Algebra Initiative Colloquium, Vol. II. Carol Lacampagne, et al. Editors. Washington DC: U.S. Departmeant of Education, Office of Educational Research and Improvement, 1995. Print.
The National Commission on Excellence in Education. A Nation at Risk: The Imperative for Educational Reform. Washington, D.C.: Government Printing Office, 1983. Print.
National Council of Teachers of Mathematics. Curriculum and Evaluation Standards for School Mathematics. Reston, VA, 1989. Print.
National Council of Teachers of Mathematics. Principles and Standards for School Mathematics. Reston, VA, 2000. Print.
National Governors' Association. Time for Results: The Governors' 1991 Report on Education. Washington D.C.: National Governors' Association, 1986. Print.
National Science Foundation. National Science Foundation 6th Annual Report, 1956. Washington D.C.: Government Printing Office, 1956. Print.
Paek, P.L. (2008, January). Raising student achievement through academic intensification. Cross-case analysis from Practices worthy of attention: Local innovations in strengthening
26
secondary mathematics. Austin, TX: Charles A. Dana Center at the University of Texas at Austin. Print.
Paek, P.L. (2008, January). Algebra for All: Norfolk Public Schools. Cross-case analysis from Practices worthy of attention: Local innovations in strengthening secondary mathematics. Austin, TX: Charles A. Dana Center at the University of Texas at Austin. Print.
“Scale Alignment Studies.” Northwestern Evaluation Association. 2007, 2008, 2009, 2011. Web. 18 July 2011.
“School NCLB Data Report, Hastings, 2011” Minnesota Department of Education. 30 September 2011. Web. 29 October 2011.
Spady, William G. “Organizing for Results: The Basis of Authentic Restructuring and Reform” Educational Leadership, 46:2 1988: 4-8. Print.
Stacey, Evelyn. “Minnesota Rejects Common Core Math Standards” The Heartland Institute. 13 August 2010. Web. 12 November 2011.
“The Standards.” Common Core State Standards Initiative, Preparing America’s Students for College & Career. Web. 18 July 2011.
Steen, Lynn Arthur. “Does Everybody Need to Study Algebra?” Mathematics Teacher, 85:4 1992: 258-260. Print.
Steen, Lynn Arthur, “Algebra for All in Eighth Grade: What’s the Rush?”, Middle Matters, 8:1 1999: 1, 6-7. Print.
U.S. Department of Education, The National Commission on Mathematics and Science Teaching for the 21st Century. Before It’s Too Late, A Report to the Nation from the National Commission on Mathematics and Science Teaching for the 21st Century. Washington D.C.: Government Printing Office, 2000. Print. “Update on the Common Core State Standards” Minnesota Department of Education. n.d. Web. 12 November 2011.
Young, Anne McDougall. “Special Labor Force Reports—Summaries, Labor Force Patterns of Students, Graduates, and Dropouts, 1981” Monthly Labor Review 105:9 1982: 39-42. Print.

27
Appendix 1: Minnesota K-12 Grade 8 Mathematic Standards

28

29

30

31

32

33
Appendix 2: Common Core State Standards Grade 8 Mathematic Standards

34

35

36

37
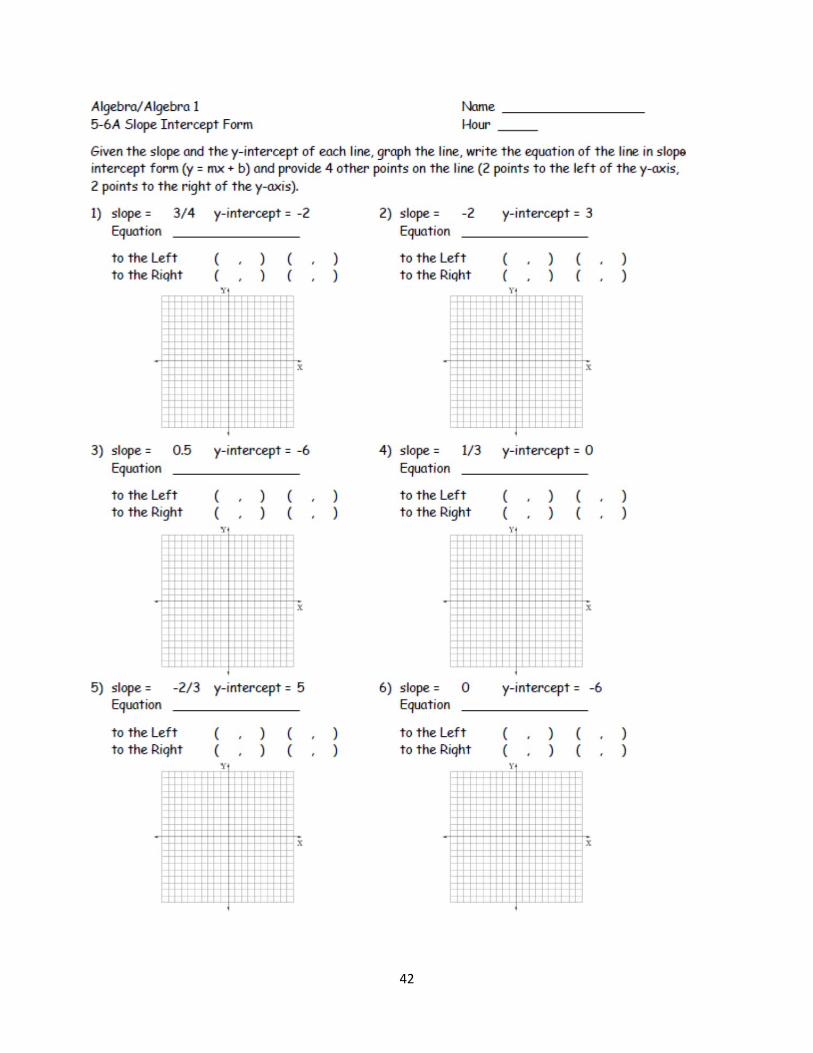
Appendix 3: Curricular Materials From www.ilovemath.org
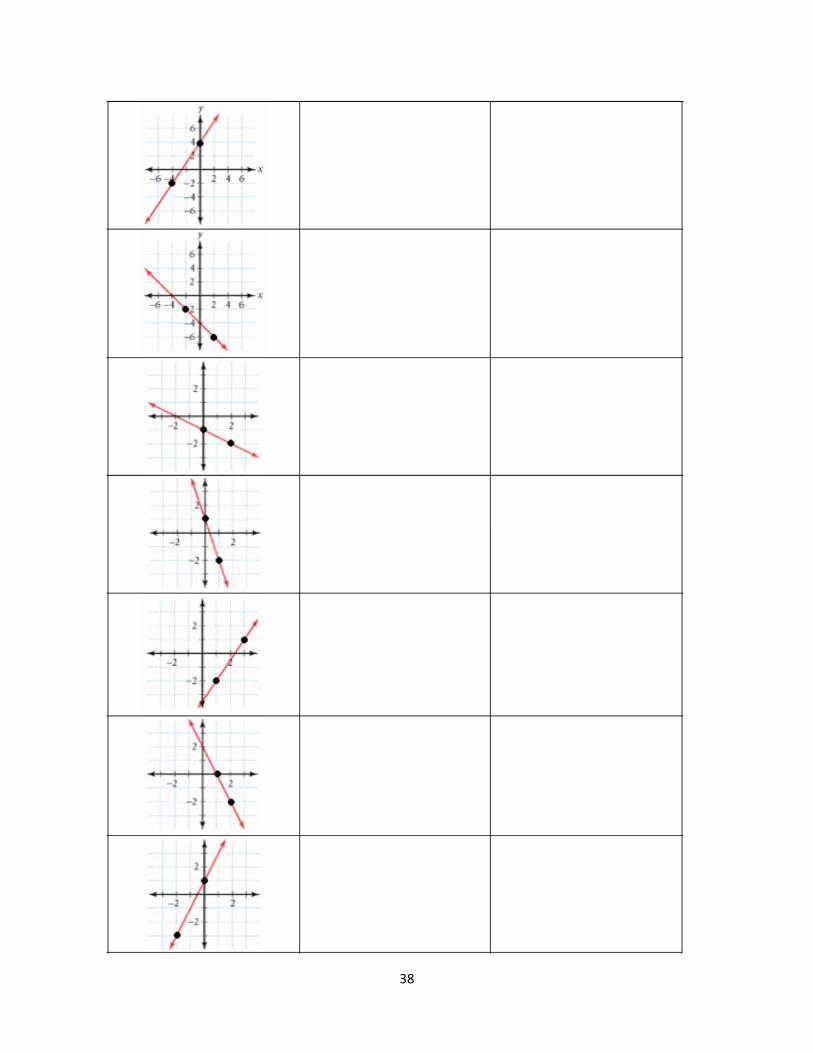
38
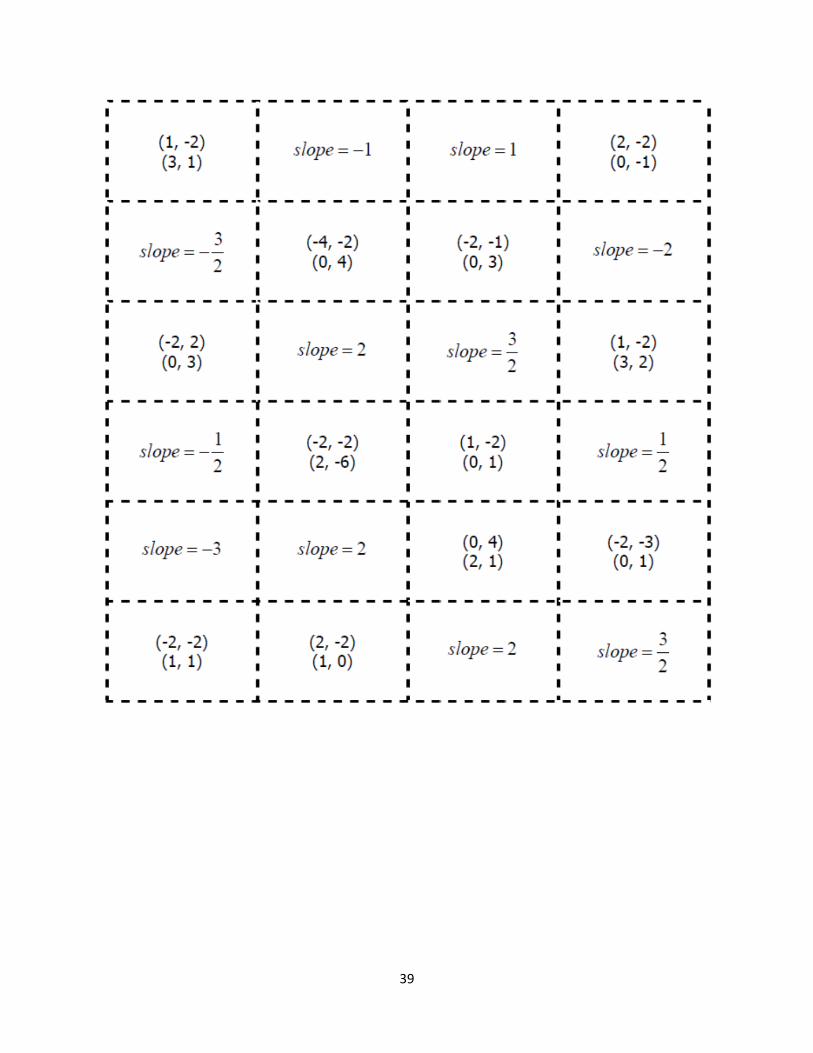
39

40
From www.smarttech.com/teacherexchange

41
42

43

44
From www.ilovemath.org

45

46

47

48
From www.ilovemath.org

49
Created/adapted from a similar worksheet from www.ilovemath.org