algebra 1 fall semester review 2012-2013 - mrs....
TRANSCRIPT
Name: ________________________ Class: ___________________ Date: __________ ID: A
1
Algebra 1 Fall Semester Review 2012-2013
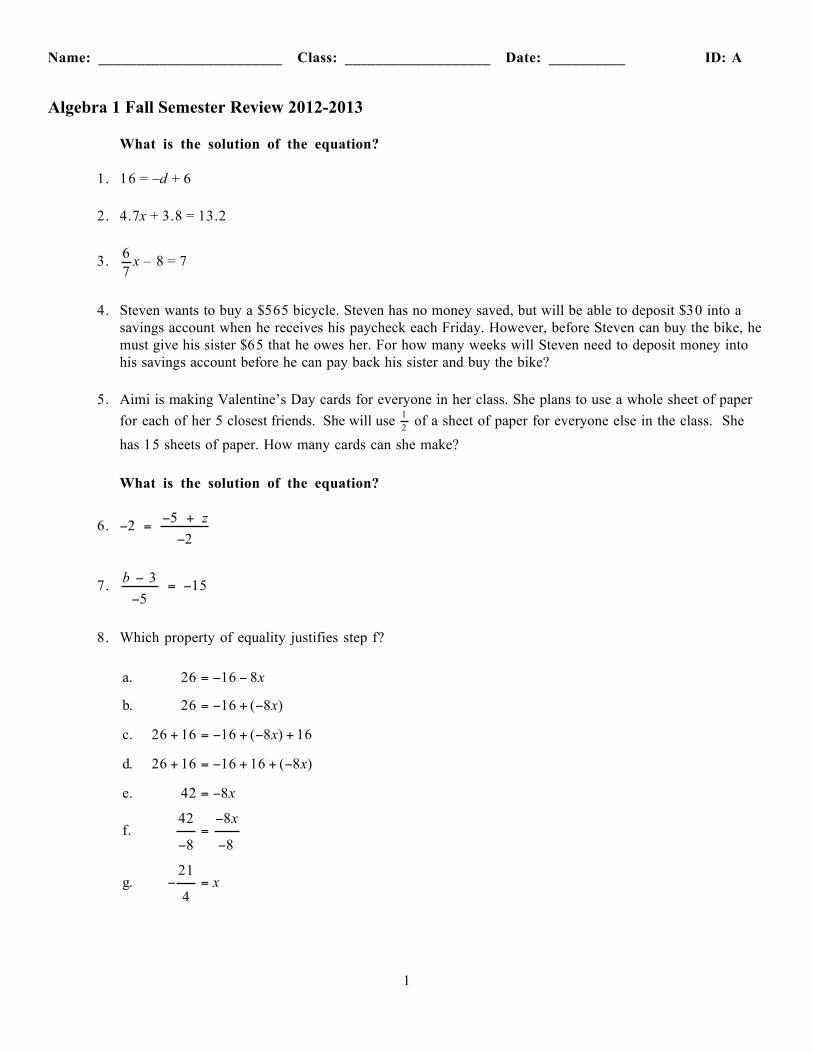
What is the solution of the equation?
1. 16 = –d + 6
2. 4.7x + 3.8 = 13.2
3. 67
x – 8 = 7
4. Steven wants to buy a $565 bicycle. Steven has no money saved, but will be able to deposit $30 into a savings account when he receives his paycheck each Friday. However, before Steven can buy the bike, he must give his sister $65 that he owes her. For how many weeks will Steven need to deposit money into his savings account before he can pay back his sister and buy the bike?
5. Aimi is making Valentine’s Day cards for everyone in her class. She plans to use a whole sheet of paper for each of her 5 closest friends. She will use 1
2 of a sheet of paper for everyone else in the class. She has 15 sheets of paper. How many cards can she make?
What is the solution of the equation?
6. −2 = −5 + z−2
7. b − 3−5
= −15
8. Which property of equality justifies step f?
a. 26 = −16 − 8x
b. 26 = −16 + (−8x)
c. 26 + 16 = −16 + (−8x) + 16
d. 26 + 16 = −16 + 16 + (−8x)
e. 42 = −8x
f.42
−8=−8x
−8
g. −21
4= x

Name: ________________________ ID: A
2
What is the solution of the equation?
9. 2 = 6p − 8 − 5p
10. 3x – 9 − 5x = –7
11. 5d – d – 2d + 8 − 3d = 0
12. −6y + 14 + 4y = 32
13. John and 2 friends are going out for pizza for lunch. They split one pizza and 3 large drinks. The pizza cost $12.00. They spend a total of $16.95. Find the cost of one large drink.
14. Angela and Neil are going to the movies. They each bought a medium popcorn, and Neil got a small soft drink. Angela had a $5 gift certificate to put toward the cost, and Neil paid the rest, which came to $27.90. A movie ticket costs $10.00 and a medium popcorn costs $5.50. How much does a soft drink cost at the theater?
What is the solution of the equation?
15. 4(y + 2) = 32
16. 3(y – 5) + 2 = 5
What is the solution of the equation?
17. 6x – 3 = 5x – 5
18. –4x – 9 = –5 – 6x
What is the solution of the equation?
19. 5 10x − 10( ) = −5 −4x + 4( )
What is the solution of each equation?
____ 20. 2(h − 8) − h = h − 16a. 8 c. infinitely many solutionsb. −8 d. no solution
____ 21. 3 + 6z = 13 + 6z
a. − 56
c. infinitely many solutions
b. 2 23
d. no solution

Name: ________________________ ID: A
3
22. What equation do you get when you solve a − q = a + sx for x?
23. What equation do you get when you solve ky − bf =fym
for y?
24. At an automobile factory, 1849 parts are made in 4 hours. What is the average rate at which parts are made per hour?
25. A flock of Canadian geese migrated 1623 miles in 28 days. What was the average rate at which these geese traveled in miles per day?
26. Car A travels 180 miles in 7 hours. Car B travels 350 miles in 4 hours. Car C travels 584 miles in 15 hours. Which car has the fastest average speed?
What is the given amount converted to the given units?
27. 195 s; minutes
28. 86 cm; meters
29. 144 ft; inches
30. A car is driving at a speed of 45 mi/h. What is the speed of the car in feet per minute?
31. A student ran the 100-m dash in 15.4 s. What was the student’s speed in miles per hour?
What is the solution of the proportion?
____ 32. 1412
= d48
a. 56 c. 168b. 672 d. 576
____ 33. h−8
= 19−2
a. 76 c. –38b. –152 d. 16
34. 13y
= 38
35. x − 85
= 24

Name: ________________________ ID: A
4
36. w + 144w + 6
= 34
What inequality represents the verbal expression?
37. all real numbers greater than or equal to 67
____ 38. 8 less than a number n is less than 11a. 11 – 8 < n c. 8 – n < 11b. n – 8 < 11 d. 11 < 8 – n
Which number is a solution of the inequality?
____ 39. 10.6 < ba. –18 b. –9 c. 7 d. 14
____ 40. m > 7
12a. 1 b. –1 c. –9 d. –5
____ 41. 3 ≤ 3x − 15
a. − 911
b. 5 c. 611
d. 6
What inequality describes the situation?
42. Let n = the number. A number exceeds 45.
What are the solutions of the inequality? Graph the solutions.
43. x − 3 ≤ − 12
44. The French Club is sponsoring a bake sale. If their goal is to raise at least $140, how many pastries must they sell at $3.50 each in order to meet that goal? Write and solve an inequality.
What are the solutions of the inequality? Graph the solutions.
45. −4x ≥ −12
46. –2m < –14
What are the solutions of the inequality? Check the solutions.
47. 4x + 6 < –6

Name: ________________________ ID: A
5
What are the solutions of the inequality?
48. 2(b – 8) > 12
What are the solutions of the inequality?
49. 12 + 10w ≥ 8(w + 12)
What are the solutions of the inequality?
____ 50. −5 2x + 2( ) ≥ −10x − 17a. x ≥ 7 c. all real numbersb. x ≤ 19 d. no solution
Name: ________________________ ID: A
6
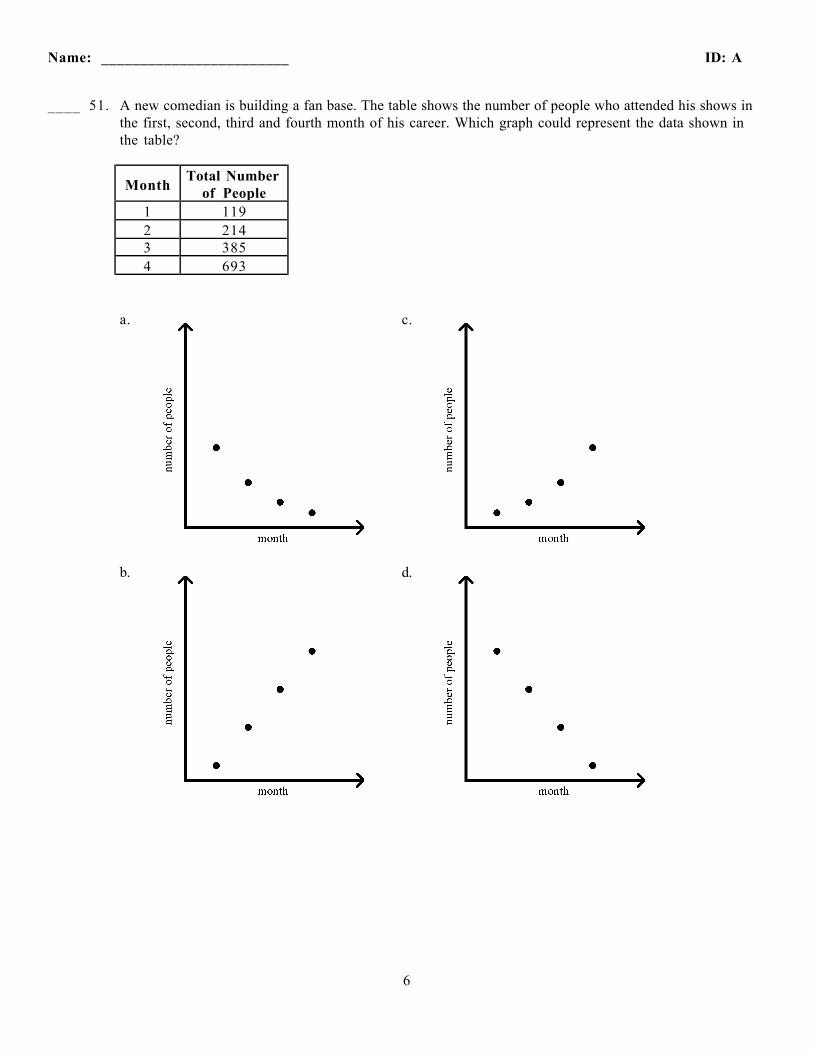
____ 51. A new comedian is building a fan base. The table shows the number of people who attended his shows in the first, second, third and fourth month of his career. Which graph could represent the data shown in the table?
Month Total Number of People
1 1192 2143 3854 693
a. c.
b. d.

Name: ________________________ ID: A
7
____ 52. A hiker climbs up a steep bank and then rests for a minute. He then walks up a small hill and finally across a flat plateau. What sketch of a graph could represent the elevation of the hiker?
a. c.
b. d. Any of the graphs could represent the situation, depending on the hiker’s speed.

Name: ________________________ ID: A
8
In the diagram below, what is the relationship between the number of triangles and the perimeter of the figure they form?
____ 53. Which of the following represents the above relationship?
a. The perimeter, P, is equal to the length of the base of one triangle multiplied by the number of triangles in the figure, n, plus the length of another side. The equation for the perimeter is P = 5n + 7.
b. The perimeter, P, is equal to the length of a side of one triangle multiplied by the number of triangles in the figure, n, plus the length of the base. The equation for the perimeter is P = 7n + 5.
c. The perimeter, P, is equal to the length of a side of one triangle multiplied by the number of triangles in the figure, n, plus two times the length of the base. The equation for the perimeter is P = 7n + 10.
d. The perimeter, P, is equal to the length of the base of one triangle multiplied by the number of triangles in the figure, n, plus two times the length of another side. The equation for the perimeter is P = 5n + 14.
54. Represent the above relationship by filling in the table below.
Number of Triangles Perimeter
1
2
3

Name: ________________________ ID: A
9
55. Represent the above relationship by drawing a graph.
The table shows the relationship between the number of sports teams a person belongs to and the amount of free time the person has per week.
Number of Sports Teams
Free Time (hours)
0 461 392 323 25
____ 56. Is the above relationship a linear function?
a. yes b. no
57. Describe the above relationship using words. What is the equation for this relationship?
____ 58. x y1 12.32 19.63 26.94 34.25 41.5
Graph the function shown by the table. Is the function linear or nonlinear?a. linear b. nonlinear
Name: ________________________ ID: A
10
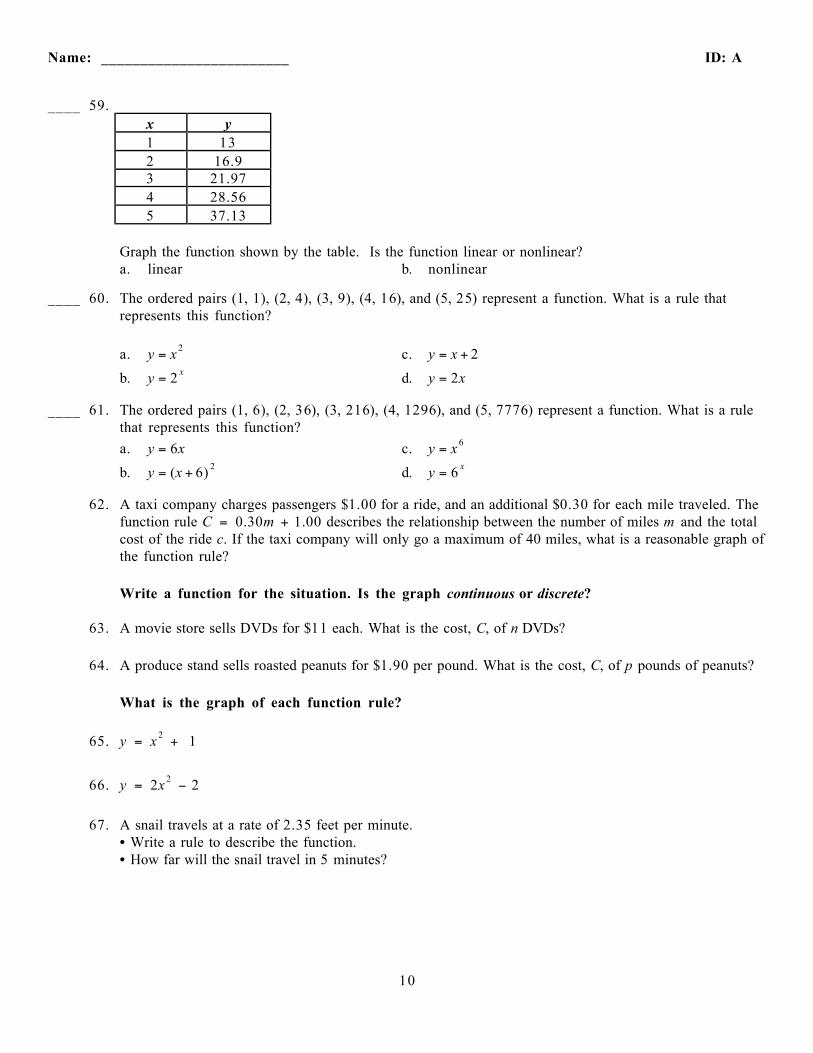
____ 59. x y1 132 16.93 21.974 28.565 37.13
Graph the function shown by the table. Is the function linear or nonlinear?a. linear b. nonlinear
____ 60. The ordered pairs (1, 1), (2, 4), (3, 9), (4, 16), and (5, 25) represent a function. What is a rule that represents this function?
a. y = x 2 c. y = x + 2b. y = 2 x d. y = 2x
____ 61. The ordered pairs (1, 6), (2, 36), (3, 216), (4, 1296), and (5, 7776) represent a function. What is a rule that represents this function?a. y = 6x c. y = x 6
b. y = (x + 6) 2 d. y = 6 x
62. A taxi company charges passengers $1.00 for a ride, and an additional $0.30 for each mile traveled. The function rule C = 0.30m + 1.00 describes the relationship between the number of miles m and the total cost of the ride c. If the taxi company will only go a maximum of 40 miles, what is a reasonable graph of the function rule?
Write a function for the situation. Is the graph continuous or discrete?
63. A movie store sells DVDs for $11 each. What is the cost, C, of n DVDs?
64. A produce stand sells roasted peanuts for $1.90 per pound. What is the cost, C, of p pounds of peanuts?
What is the graph of each function rule?
65. y = x 2 + 1
66. y = 2x 2 − 2
67. A snail travels at a rate of 2.35 feet per minute. • Write a rule to describe the function.• How far will the snail travel in 5 minutes?
Name: ________________________ ID: A
11
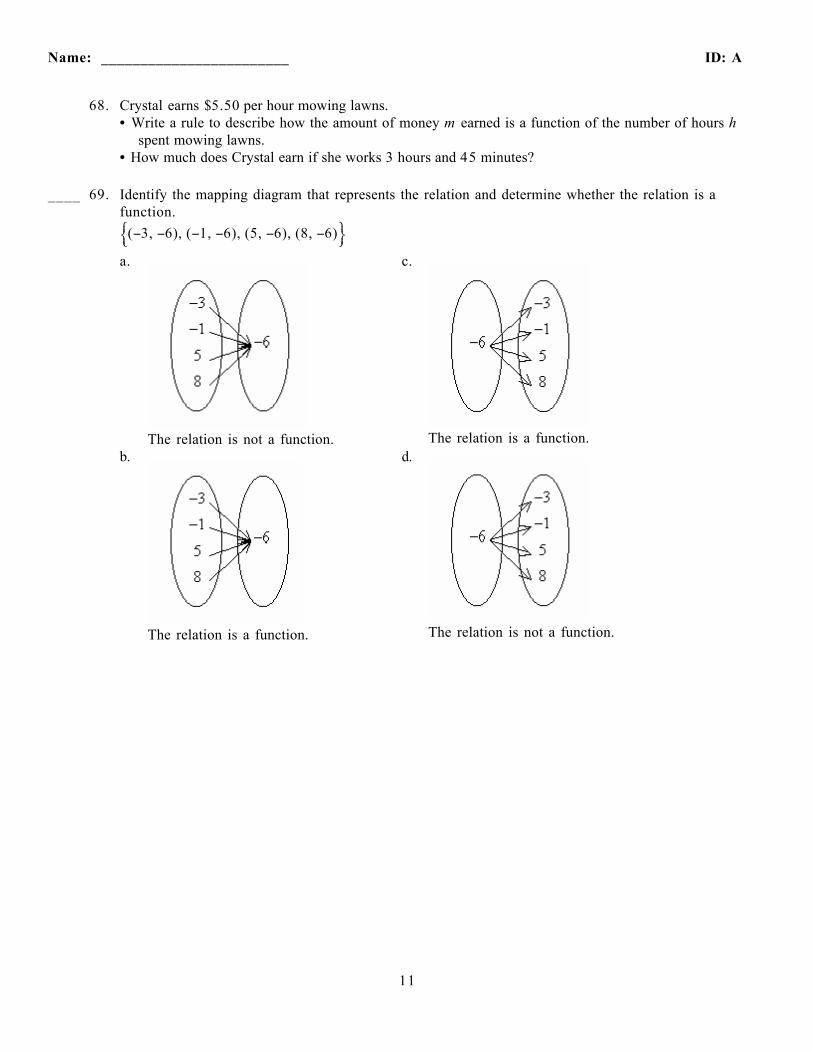
68. Crystal earns $5.50 per hour mowing lawns.• Write a rule to describe how the amount of money m earned is a function of the number of hours h
spent mowing lawns.• How much does Crystal earn if she works 3 hours and 45 minutes?
____ 69. Identify the mapping diagram that represents the relation and determine whether the relation is a function.
(−3, −6), (−1, −6), (5, −6), (8, −6)ÏÌÓÔÔÔÔ
¸˝̨ÔÔÔÔ
a.
The relation is not a function.
c.
The relation is a function.b.
The relation is a function.
d.
The relation is not a function.
Name: ________________________ ID: A
12
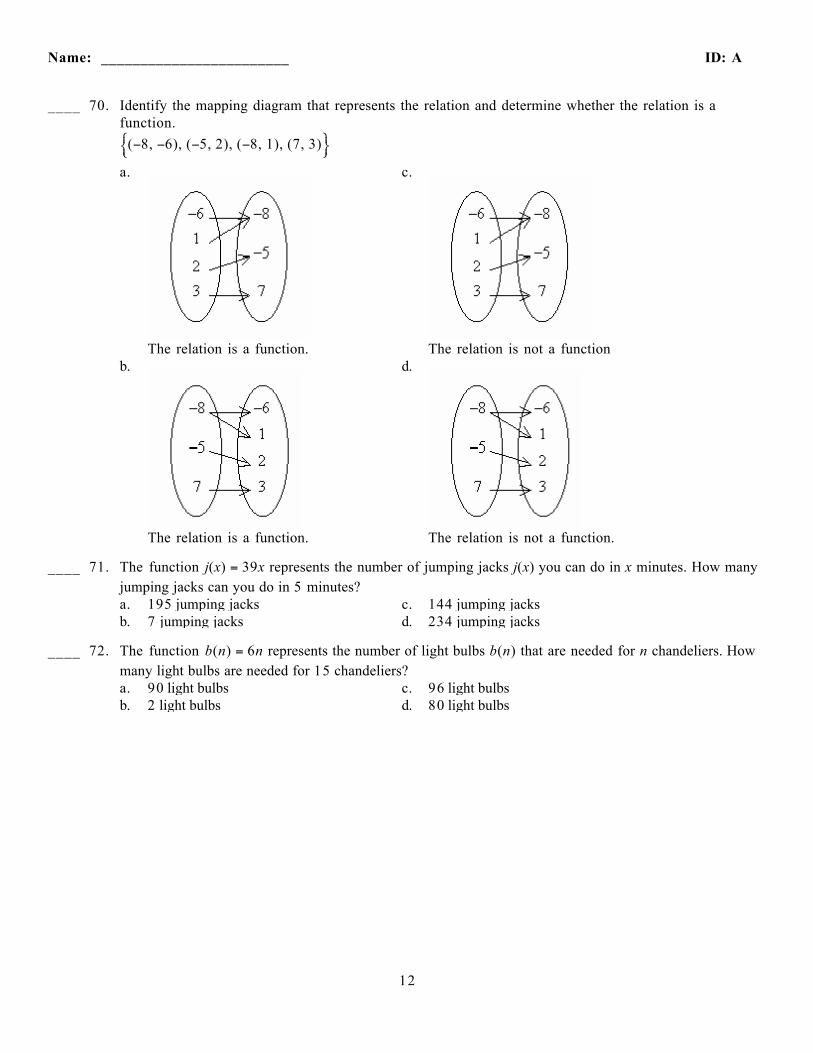
____ 70. Identify the mapping diagram that represents the relation and determine whether the relation is a function.
(−8, −6), (−5, 2), (−8, 1), (7, 3)ÏÌÓÔÔÔÔ
¸˝̨ÔÔÔÔ
a.
The relation is a function.
c.
The relation is not a functionb.
The relation is a function.
d.
The relation is not a function.
____ 71. The function j(x) = 39x represents the number of jumping jacks j(x) you can do in x minutes. How many jumping jacks can you do in 5 minutes?a. 195 jumping jacks c. 144 jumping jacksb. 7 jumping jacks d. 234 jumping jacks
____ 72. The function b(n) = 6n represents the number of light bulbs b(n) that are needed for n chandeliers. How many light bulbs are needed for 15 chandeliers?a. 90 light bulbs c. 96 light bulbsb. 2 light bulbs d. 80 light bulbs
Name: ________________________ ID: A
13
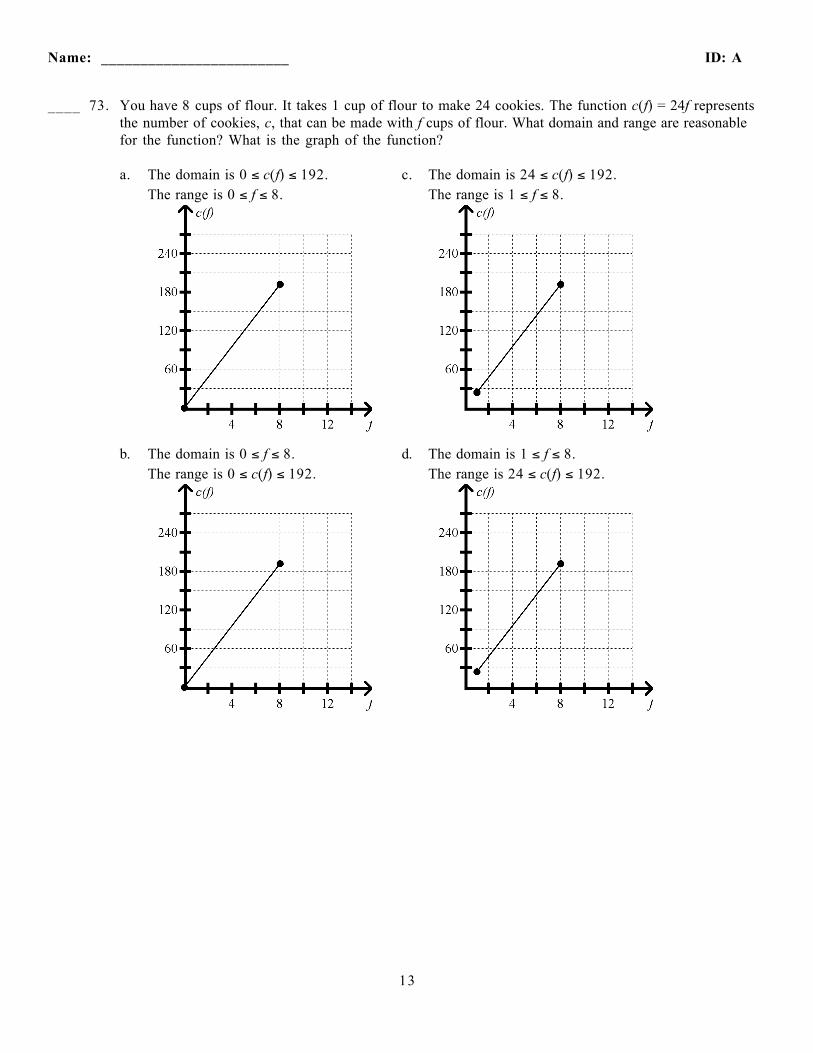
____ 73. You have 8 cups of flour. It takes 1 cup of flour to make 24 cookies. The function c(f) = 24f represents the number of cookies, c, that can be made with f cups of flour. What domain and range are reasonable for the function? What is the graph of the function?
a. The domain is 0 ≤ c(f) ≤ 192.The range is 0 ≤ f ≤ 8.
c. The domain is 24 ≤ c(f) ≤ 192.The range is 1 ≤ f ≤ 8.
b. The domain is 0 ≤ f ≤ 8.The range is 0 ≤ c(f) ≤ 192.
d. The domain is 1 ≤ f ≤ 8.The range is 24 ≤ c(f) ≤ 192.

Name: ________________________ ID: A
14
The rate of change is constant in each table. Find the rate of change. Explain what the rate of change means for the situation.
74. The table shows the cost of a ski rental package for a given number of people.People Cost ($)
4 160
5 200
6 240
7 280
Find the slope of the line.
75.
76.
What is the slope of the line that passes through the pair of points?
77. (1, 7), (10, 1)

Name: ________________________ ID: A
15
78. (–5.5, 6.1), (–2.5, 3.1)
79. (− 53
, −1), (−2, 92
)
What is the slope of the line?
80.
81.
Does the equation represent a direct variation? If so, find the constant of variation.
82. 5x = −3y
83. 2x − 4y = 0
84. 2x 2 + 4y = 0
Name: ________________________ ID: A
16
85. Suppose y varies directly with x, and y = 8 when x = –6. What direct variation equation relates x and y? What is the value of y when x = –2?
86. Suppose y varies directly with x, and y = 193
when x = 45
. What direct variation equation relates x and y?
What is the value of y when x = − 76
?
What are the slope and y-intercept of the graph of the given equation?
87. y = –9x + 2
Write an equation of a line with the given slope and y-intercept.
88. m = 1, b = 4
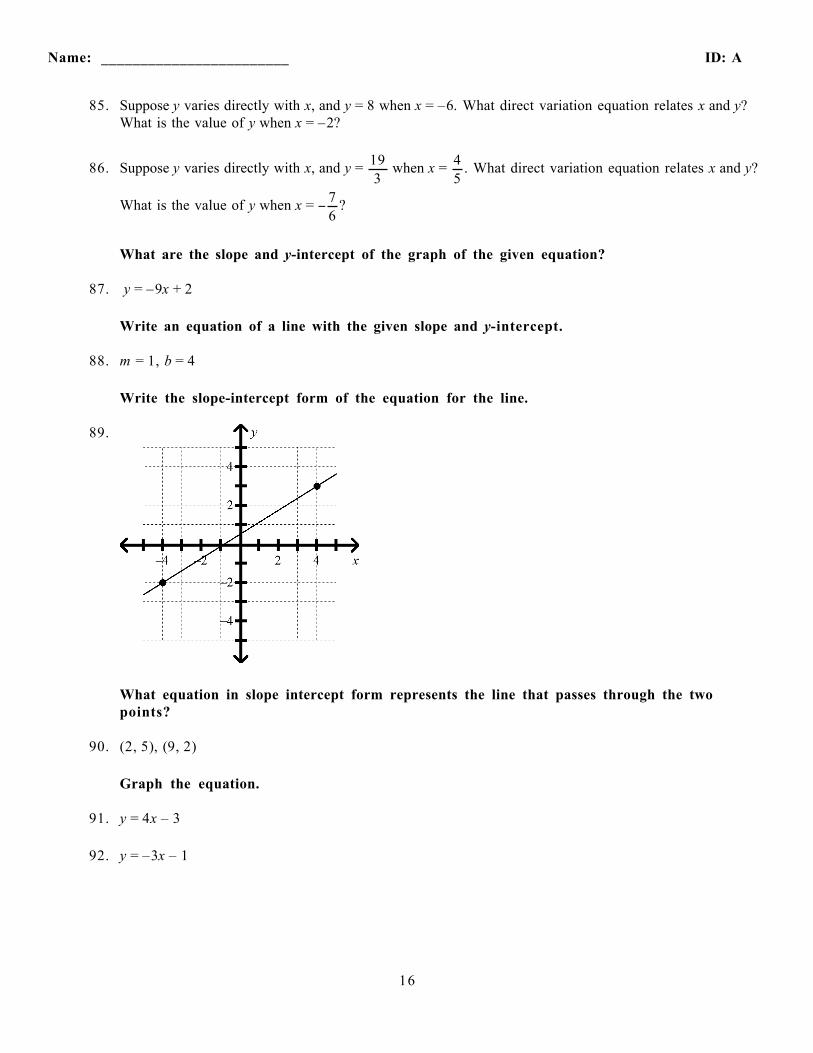
Write the slope-intercept form of the equation for the line.
89.
What equation in slope intercept form represents the line that passes through the two points?
90. (2, 5), (9, 2)
Graph the equation.
91. y = 4x – 3
92. y = –3x – 1

Name: ________________________ ID: A
17
Write an equation in point-slope form for the line through the given point with the given slope.
93. (8, 3); m = 6
94. (–10, –6); m = − 58
Graph the equation.
95. y + 5 = −2(x – 4)
96. y – 3 = − 32
(x + 4)
97. y + 5 = –0.3(x + 5)
What is an equation of the line?
98.
Find the x- and y-intercept of the line.
99. x – 6y = 12
100. –6.9x – 7.8y = 71.76
What is the graph of the equation?
101. y = –3
102. x = –4

Name: ________________________ ID: A
18
103. Write y = 23
x + 7 in standard form using integers.
104. A paint store sells exterior paint for $28.25 a gallon and paint rollers for $6.25 each. Write an equation in standard form for the number of gallons p of paint and rollers r that a customer could buy with $145.
105. The video store rents DVDs for $4.75 each and video games for $2.00 each. Write an equation in standard form for the number of DVDs d and video games g that a customer could rent with $12.
What type of relationship does the scatter plot show?
____106.
a. positive correlationb. negative correlationc. no correlation
____107.
a. positive correlationb. negative correlationc. no correlation

Name: ________________________ ID: A
19
____108.
a. positive correlationb. negative correlationc. no correlation
____109. The scatter plot shows the number of mistakes a piano student makes during a recital versus the amount of time the student practiced for the recital. How many mistakes do you expect the student to make at the recital after 13 hours of practicing?
a. 72 mistakes c. 28 mistakesb. 49 mistakes d. 38 mistakes

Name: ________________________ ID: A
20
____110. The scatter plot below shows the height of a tree over time. What is the approximate height of the tree after 10 years?
a. 13 ft c. 17 ftb. 20 ft d. 21 ft
In the following situations, is there likely to be a correlation? If so does the correlation reflect a causal relationship? Explain.
____111. the number of hours spent studying for a test and your test marka. There is a positive correlation and also a causal relationship. The more you study for
a test the better your mark is likely to be.b. There is a negative correlation. The more you study for a test, the worse your mark
is likely to be.c. There is no correlation.
____112. the average daily winter temperature and your heating billa. There is a positive correlation. The higher the average daily winter temperature the
higher your heating bill.b. There is a negative correlation and a causal correlation. The higher the average daily
winter temperature the lower your heating bill.c. There is no correlation.
113. the number of pets and the number of doctors in a city

Name: ________________________ ID: A
21
What is the solution of the system? Use a graph.
____114. y = –x + 2y = 3x – 1a. c.
b. d.
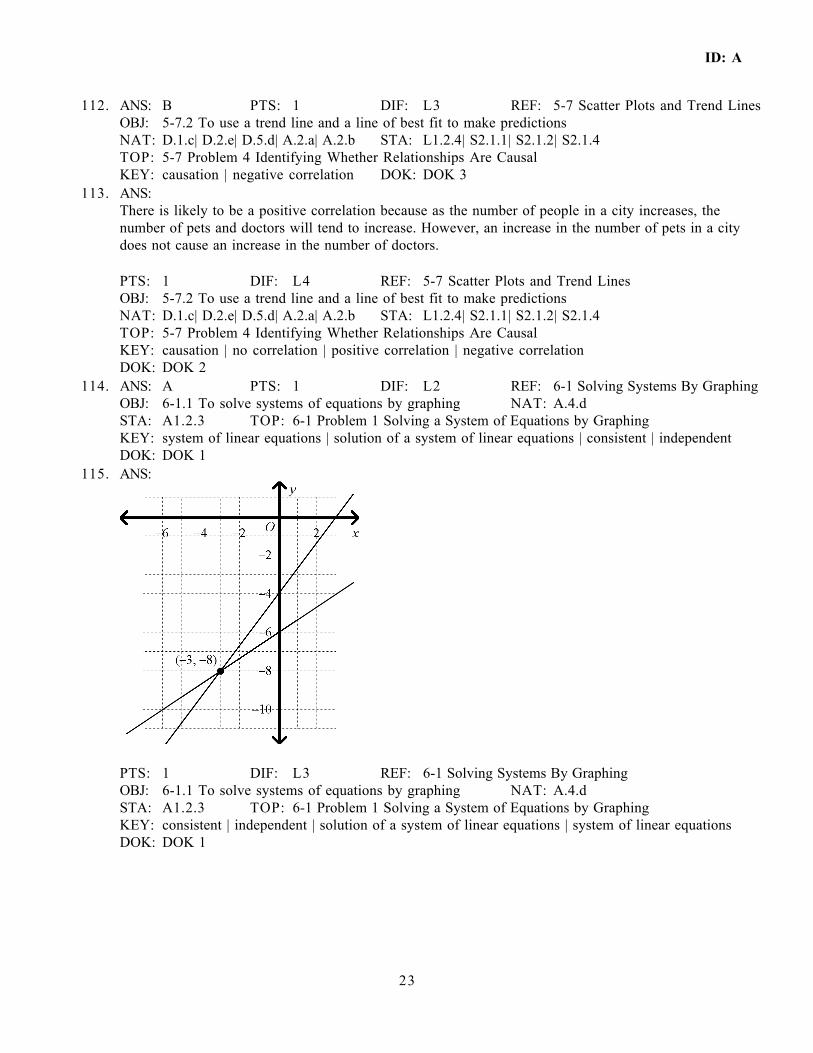
115. –4x + 3y = –12–2x + 3y = –18
116. y = x + 5y = –5x – 1
117. 5x + 4y = 94x + 4y = 8
What is the solution of the system? Use a graph.
118. y = 5x + 4y = 5x – 3

Name: ________________________ ID: A
22
119. y = –5x – 2y + 2 = –5x
What is the solution of the system? Use substitution.
120. y = x + 6y = 2x
121. 3x + 2y = 7y = –3x + 11
122. 3y = – 12
x + 2
y = –x + 9
What is the solution of the system? Use substitution.
123. 2x − y = −74x − y = −4
124. 8x − 2y = 103x − y = 9
125. x − y = −66x − 3y = −9
126. A corner store sells two kinds of baked goods: cakes and pies. A cake costs $14 and a pie costs $8. In one day, the store sold 12 baked goods for a total of $144. How many cakes did they sell?
How many solutions does the system have?
____127. x = −4y + 42x + 8y = 8a. one solution c. infinitely many solutionsb. two solutions d. no solution
____128. y = 6x + 23y − 18x = 12a. one solution c. infinitely many solutionsb. two solutions d. no solution
What is the solution of the system? Use elimination.
129. 2x – 2y = –8x + 2y = –1

Name: ________________________ ID: A
23
130. 5x + 4y = –2x – 4y = 14
131. −12x − y = 617x + y = 4
132. 3x – 4y = 9–3x + 2y = 9
133. The school cafeteria sells two kinds of wraps: vegetarian and chicken. The vegetarian wrap costs $1.00 and the chicken wrap costs $1.80. Today they made $98.80 from the 70 wraps sold. How many of the wraps sold were vegetarian?
What is the solution of the system? Use elimination.
134. 5x + 8y = –297x – 2y = –67
135. 3x – 4y = –24x + y = –1
136. x + 2y = –63x + 8y = –20
137. 3x = –18 + 4y16y = 58 + 5x
What is the solution of the system? Use elimination.
138. 5x + 7y = 328x + 6y = 46
139. 3x + 9y = 33–10x – 6y = –14
140. –9.3x + 8.6y = 45.17.1x + 1.7y = –17.9
How many solutions does the system have?
____141. x − 2y = 63x − 6y = 18a. one solution c. infinitely many solutionsb. two solutions d. no solution
Name: ________________________ ID: A
24
____142. y − 5x = −63y − 15x = −12a. one solution c. infinitely many solutionsb. two solutions d. no solution
What are the solutions of the inequality? Graph and check the solutions.
143. − 18
x ≤ 5
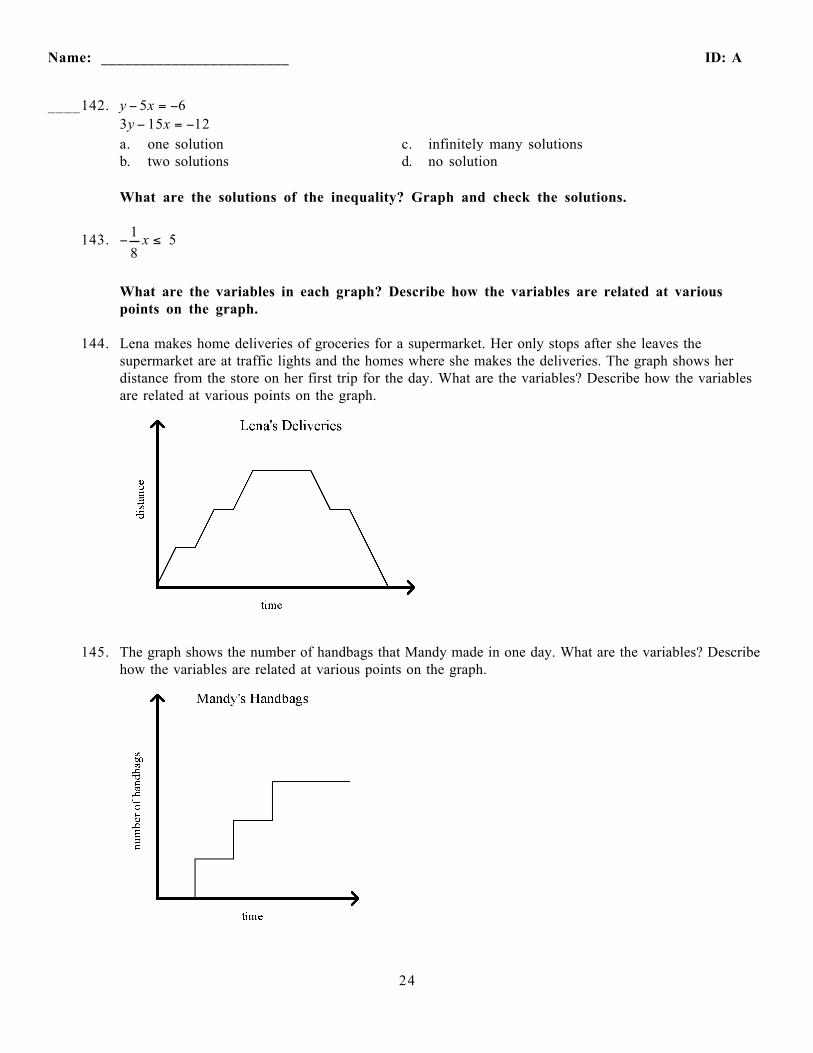
What are the variables in each graph? Describe how the variables are related at various points on the graph.
144. Lena makes home deliveries of groceries for a supermarket. Her only stops after she leaves the supermarket are at traffic lights and the homes where she makes the deliveries. The graph shows her distance from the store on her first trip for the day. What are the variables? Describe how the variables are related at various points on the graph.
145. The graph shows the number of handbags that Mandy made in one day. What are the variables? Describe how the variables are related at various points on the graph.

ID: A
1
Algebra 1 Fall Semester Review 2012-2013Answer Section
1. ANS: –10
PTS: 1 DIF: L2 REF: 2-2 Solving Two-Step EquationsOBJ: 2-2.1 To solve two-step equations in one variable NAT: A.4.a| A.4.cSTA: A1.2.3 TOP: 2-2 Problem 1 Solving a Two-Step EquationDOK: DOK 1
2. ANS: 2
PTS: 1 DIF: L3 REF: 2-2 Solving Two-Step EquationsOBJ: 2-2.1 To solve two-step equations in one variable NAT: A.4.a| A.4.cSTA: A1.2.3 TOP: 2-2 Problem 1 Solving a Two-Step EquationDOK: DOK 1
3. ANS:
17 12
PTS: 1 DIF: L3 REF: 2-2 Solving Two-Step EquationsOBJ: 2-2.1 To solve two-step equations in one variable NAT: A.4.a| A.4.cSTA: A1.2.3 TOP: 2-2 Problem 1 Solving a Two-Step EquationDOK: DOK 1
4. ANS: 21 weeks
PTS: 1 DIF: L3 REF: 2-2 Solving Two-Step EquationsOBJ: 2-2.1 To solve two-step equations in one variable NAT: A.4.a| A.4.cSTA: A1.2.3 TOP: 2-2 Problem 2 Using an Equation as a ModelDOK: DOK 2
5. ANS: 20 cards
PTS: 1 DIF: L4 REF: 2-2 Solving Two-Step EquationsOBJ: 2-2.1 To solve two-step equations in one variable NAT: A.4.a| A.4.cSTA: A1.2.3 TOP: 2-2 Problem 2 Using an Equation as a ModelDOK: DOK 2
6. ANS: 9
PTS: 1 DIF: L3 REF: 2-2 Solving Two-Step EquationsOBJ: 2-2.1 To solve two-step equations in one variable NAT: A.4.a| A.4.cSTA: A1.2.3 TOP: 2-2 Problem 3 Solving With Two Terms in the NumeratorDOK: DOK 1

ID: A
2
7. ANS: 78
PTS: 1 DIF: L3 REF: 2-2 Solving Two-Step EquationsOBJ: 2-2.1 To solve two-step equations in one variable NAT: A.4.a| A.4.cSTA: A1.2.3 TOP: 2-2 Problem 3 Solving With Two Terms in the NumeratorDOK: DOK 1
8. ANS: Division Property of Equality
PTS: 1 DIF: L3 REF: 2-2 Solving Two-Step EquationsOBJ: 2-2.1 To solve two-step equations in one variable NAT: A.4.a| A.4.cSTA: A1.2.3 TOP: 2-2 Problem 4 Using Deductive ReasoningDOK: DOK 2
9. ANS: 10
PTS: 1 DIF: L3 REF: 2-3 Solving Multi-Step EquationsOBJ: 2-3.1 To solve multi-step equations in one variable NAT: A.4.a| A.4.cSTA: A1.2.3 TOP: 2-3 Problem 1 Combining Like Terms DOK: DOK 1
10. ANS: –1
PTS: 1 DIF: L3 REF: 2-3 Solving Multi-Step EquationsOBJ: 2-3.1 To solve multi-step equations in one variable NAT: A.4.a| A.4.cSTA: A1.2.3 TOP: 2-3 Problem 1 Combining Like Terms DOK: DOK 1
11. ANS: 8
PTS: 1 DIF: L4 REF: 2-3 Solving Multi-Step EquationsOBJ: 2-3.1 To solve multi-step equations in one variable NAT: A.4.a| A.4.cSTA: A1.2.3 TOP: 2-3 Problem 1 Combining Like Terms DOK: DOK 1
12. ANS: –9
PTS: 1 DIF: L3 REF: 2-3 Solving Multi-Step EquationsOBJ: 2-3.1 To solve multi-step equations in one variable NAT: A.4.a| A.4.cSTA: A1.2.3 TOP: 2-3 Problem 1 Combining Like Terms DOK: DOK 1

ID: A
3
13. ANS: $1.65
PTS: 1 DIF: L3 REF: 2-3 Solving Multi-Step EquationsOBJ: 2-3.1 To solve multi-step equations in one variable NAT: A.4.a| A.4.cSTA: A1.2.3 TOP: 2-3 Problem 2 Solving a Multi-Step EquationDOK: DOK 2
14. ANS: $1.90
PTS: 1 DIF: L3 REF: 2-3 Solving Multi-Step EquationsOBJ: 2-3.1 To solve multi-step equations in one variable NAT: A.4.a| A.4.cSTA: A1.2.3 TOP: 2-3 Problem 2 Solving a Multi-Step EquationDOK: DOK 2
15. ANS: 6
PTS: 1 DIF: L2 REF: 2-3 Solving Multi-Step EquationsOBJ: 2-3.1 To solve multi-step equations in one variable NAT: A.4.a| A.4.cSTA: A1.2.3 TOP: 2-3 Problem 3 Solving an Equation Using the Distributive PropertyDOK: DOK 1
16. ANS: 6
PTS: 1 DIF: L3 REF: 2-3 Solving Multi-Step EquationsOBJ: 2-3.1 To solve multi-step equations in one variable NAT: A.4.a| A.4.cSTA: A1.2.3 TOP: 2-3 Problem 3 Solving an Equation Using the Distributive PropertyDOK: DOK 1
17. ANS: –2
PTS: 1 DIF: L3 REF: 2-4 Solving Equations With Variables on Both SidesOBJ: 2-4.1 To solve equations with variables on both sides NAT: A.4.a| A.4.cSTA: A1.2.3 TOP: 2-4 Problem 1 Solving an Equation With Variables on Both SidesDOK: DOK 1
18. ANS: 2
PTS: 1 DIF: L3 REF: 2-4 Solving Equations With Variables on Both SidesOBJ: 2-4.1 To solve equations with variables on both sides NAT: A.4.a| A.4.cSTA: A1.2.3 TOP: 2-4 Problem 1 Solving an Equation With Variables on Both SidesDOK: DOK 1

ID: A
4
19. ANS: 1
PTS: 1 DIF: L3 REF: 2-4 Solving Equations With Variables on Both SidesOBJ: 2-4.1 To solve equations with variables on both sides NAT: A.4.a| A.4.cSTA: A1.2.3 TOP: 2-4 Problem 3 Solving an Equation With Grouping SymbolsDOK: DOK 1
20. ANS: C PTS: 1 DIF: L3 REF: 2-4 Solving Equations With Variables on Both Sides OBJ: 2-4.2 To identify equations that are identities or have no solutionNAT: A.4.a| A.4.c STA: A1.2.3 TOP: 2-4 Problem 4 Identities and Equations With No Solution KEY: identity DOK: DOK 1
21. ANS: D PTS: 1 DIF: L3 REF: 2-4 Solving Equations With Variables on Both Sides OBJ: 2-4.2 To identify equations that are identities or have no solutionNAT: A.4.a| A.4.c STA: A1.2.3 TOP: 2-4 Problem 4 Identities and Equations With No Solution DOK: DOK 1
22. ANS:
x = −qs
PTS: 1 DIF: L3 REF: 2-5 Literal Equations and FormulasOBJ: 2-5.1 To rewrite and use literal equations and formulas NAT: A.4.a| A.4.c| A.4.e| A.4.fSTA: A1.2.3| A1.2.8 TOP: 2-5 Problem 2 Rewriting a Literal Equation With Only VariablesKEY: literal equation DOK: DOK 2
23. ANS:
y =bfm
km − f
PTS: 1 DIF: L4 REF: 2-5 Literal Equations and FormulasOBJ: 2-5.1 To rewrite and use literal equations and formulas NAT: A.4.a| A.4.c| A.4.e| A.4.fSTA: A1.2.3| A1.2.8 TOP: 2-5 Problem 2 Rewriting a Literal Equation With Only VariablesKEY: literal equation DOK: DOK 2
24. ANS: 462 parts/h
PTS: 1 DIF: L3 REF: 2-5 Literal Equations and FormulasOBJ: 2-5.1 To rewrite and use literal equations and formulas NAT: A.4.a| A.4.c| A.4.e| A.4.fSTA: A1.2.3| A1.2.8 TOP: 2-5 Problem 4 Rewriting a FormulaKEY: literal equation | formula DOK: DOK 2

ID: A
5
25. ANS: 58 miles per day
PTS: 1 DIF: L3 REF: 2-5 Literal Equations and FormulasOBJ: 2-5.1 To rewrite and use literal equations and formulas NAT: A.4.a| A.4.c| A.4.e| A.4.fSTA: A1.2.3| A1.2.8 TOP: 2-5 Problem 4 Rewriting a FormulaKEY: literal equation | formula DOK: DOK 2
26. ANS: Car B
PTS: 1 DIF: L3 REF: 2-6 Ratios, Rates, and ConversionsOBJ: 2-6.1 To find ratios and rates NAT: N.3.b| N.3.f| M.1.i| M.2.bTOP: 2-6 Problem 1 Comparing Unit Rates KEY: ratio | unit rate | rateDOK: DOK 2
27. ANS: 3.25 min
PTS: 1 DIF: L3 REF: 2-6 Ratios, Rates, and ConversionsOBJ: 2-6.2 To convert units and rates NAT: N.3.b| N.3.f| M.1.i| M.2.bTOP: 2-6 Problem 2 Converting Units KEY: conversion factor | unit analysisDOK: DOK 1
28. ANS: 0.86 m
PTS: 1 DIF: L3 REF: 2-6 Ratios, Rates, and ConversionsOBJ: 2-6.2 To convert units and rates NAT: N.3.b| N.3.f| M.1.i| M.2.bTOP: 2-6 Problem 2 Converting Units KEY: conversion factor | unit analysisDOK: DOK 1
29. ANS: 1728 in.
PTS: 1 DIF: L3 REF: 2-6 Ratios, Rates, and ConversionsOBJ: 2-6.2 To convert units and rates NAT: N.3.b| N.3.f| M.1.i| M.2.bTOP: 2-6 Problem 2 Converting Units KEY: conversion factor | unit analysisDOK: DOK 1
30. ANS: 3,960 ft/min
PTS: 1 DIF: L3 REF: 2-6 Ratios, Rates, and ConversionsOBJ: 2-6.2 To convert units and rates NAT: N.3.b| N.3.f| M.1.i| M.2.bTOP: 2-6 Problem 4 Converting Rates KEY: conversion factor | unit analysisDOK: DOK 1

ID: A
6
31. ANS: 14.5 mi/h
PTS: 1 DIF: L3 REF: 2-6 Ratios, Rates, and ConversionsOBJ: 2-6.2 To convert units and rates NAT: N.3.b| N.3.f| M.1.i| M.2.bTOP: 2-6 Problem 4 Converting Rates KEY: conversion factor | unit analysisDOK: DOK 1
32. ANS: A PTS: 1 DIF: L2 REF: 2-7 Solving ProportionsOBJ: 2-7.1 To solve and apply proportions NAT: N.3.b| N.3.f| N.4.cTOP: 2-7 Problem 1 Solving a Proportion Using the Multiplication PropertyKEY: proportion DOK: DOK 1
33. ANS: A PTS: 1 DIF: L3 REF: 2-7 Solving ProportionsOBJ: 2-7.1 To solve and apply proportions NAT: N.3.b| N.3.f| N.4.cTOP: 2-7 Problem 1 Solving a Proportion Using the Multiplication PropertyKEY: proportion DOK: DOK 1
34. ANS: 34.7
PTS: 1 DIF: L3 REF: 2-7 Solving ProportionsOBJ: 2-7.1 To solve and apply proportions NAT: N.3.b| N.3.f| N.4.cTOP: 2-7 Problem 2 Solving a Proportion Using the Cross Products PropertyKEY: proportion | cross products | Cross Products Property DOK: DOK 1
35. ANS: 212
PTS: 1 DIF: L2 REF: 2-7 Solving ProportionsOBJ: 2-7.1 To solve and apply proportions NAT: N.3.b| N.3.f| N.4.cTOP: 2-7 Problem 3 Solving a Multi-Step Proportion KEY: proportion | cross products | Cross Products Property DOK: DOK 1
36. ANS: 194
PTS: 1 DIF: L3 REF: 2-7 Solving ProportionsOBJ: 2-7.1 To solve and apply proportions NAT: N.3.b| N.3.f| N.4.cTOP: 2-7 Problem 3 Solving a Multi-Step Proportion KEY: proportion | cross products | Cross Products Property DOK: DOK 1
37. ANS: x ≥ 67
PTS: 1 DIF: L3 REF: 3-1 Inequalities and Their GraphsOBJ: 3-1.1 To write, graph, and identify solutions of inequalities TOP: 3-1 Problem 1 Writing Inequalities KEY: solution of an inequalityDOK: DOK 1

ID: A
7
38. ANS: B PTS: 1 DIF: L3 REF: 3-1 Inequalities and Their GraphsOBJ: 3-1.1 To write, graph, and identify solutions of inequalities TOP: 3-1 Problem 1 Writing Inequalities KEY: solution of an inequalityDOK: DOK 1
39. ANS: D PTS: 1 DIF: L3 REF: 3-1 Inequalities and Their GraphsOBJ: 3-1.1 To write, graph, and identify solutions of inequalities TOP: 3-1 Problem 2 Identifying Solutions by Evaluating KEY: solution of an inequalityDOK: DOK 1
40. ANS: A PTS: 1 DIF: L2 REF: 3-1 Inequalities and Their GraphsOBJ: 3-1.1 To write, graph, and identify solutions of inequalities TOP: 3-1 Problem 2 Identifying Solutions by Evaluating KEY: solution of an inequalityDOK: DOK 1
41. ANS: D PTS: 1 DIF: L3 REF: 3-1 Inequalities and Their GraphsOBJ: 3-1.1 To write, graph, and identify solutions of inequalities TOP: 3-1 Problem 2 Identifying Solutions by Evaluating KEY: solution of an inequalityDOK: DOK 1
42. ANS: n > 45
PTS: 1 DIF: L3 REF: 3-1 Inequalities and Their GraphsOBJ: 3-1.1 To write, graph, and identify solutions of inequalities TOP: 3-1 Problem 5 Writing Real-World Inequalities KEY: solution of an inequalityDOK: DOK 1
43. ANS: x ≤ − 9
PTS: 1 DIF: L3 REF: 3-2 Solving Inequalities Using Addition or SubtractionOBJ: 3-2.1 To use addition or subtraction to solve inequalities STA: A1.2.1| A1.2.3 TOP: 3-2 Problem 1 Using the Addition Property of Inequality KEY: equivalent inequalities DOK: DOK 1
44. ANS: 3.50p ≥ 140; p ≥ 40
PTS: 1 DIF: L3 REF: 3-3 Solving Inequalities Using Multiplication or Division OBJ: 3-3.1 To use multiplication or division to solve inequalities STA: A1.2.3 TOP: 3-3 Problem 3 Dividing by a Positive NumberDOK: DOK 2
ID: A
8
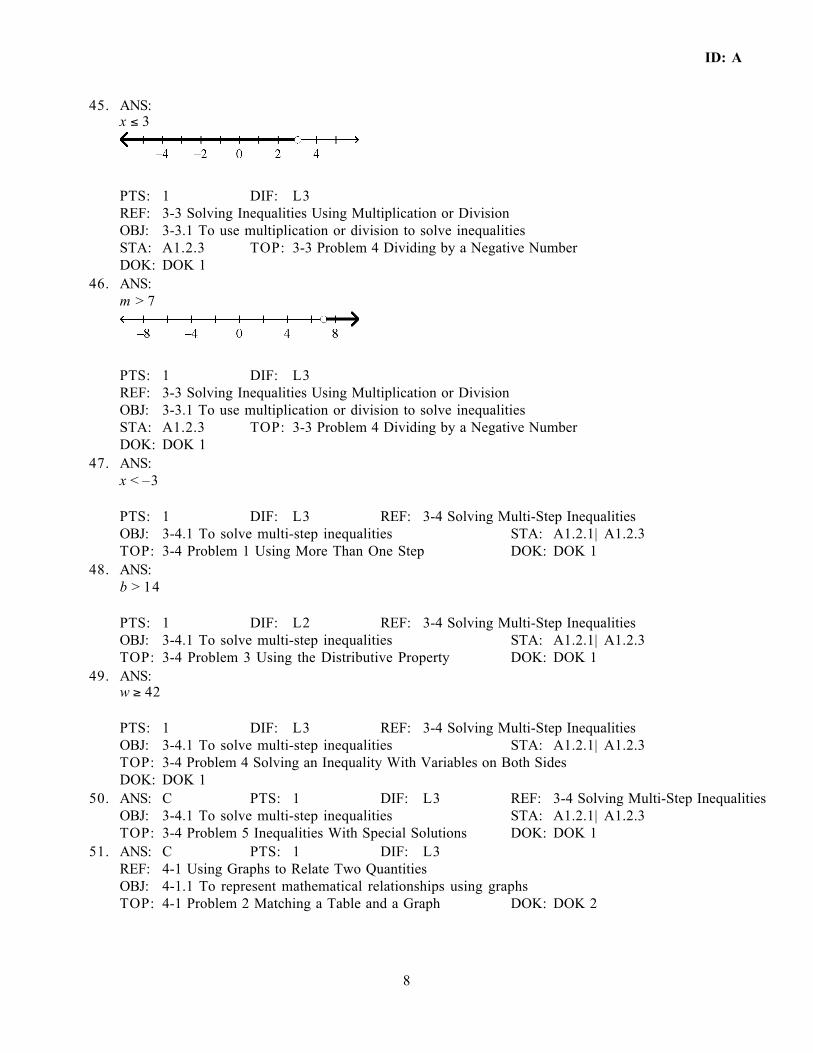
45. ANS: x ≤ 3
PTS: 1 DIF: L3 REF: 3-3 Solving Inequalities Using Multiplication or Division OBJ: 3-3.1 To use multiplication or division to solve inequalities STA: A1.2.3 TOP: 3-3 Problem 4 Dividing by a Negative NumberDOK: DOK 1
46. ANS: m > 7
PTS: 1 DIF: L3 REF: 3-3 Solving Inequalities Using Multiplication or Division OBJ: 3-3.1 To use multiplication or division to solve inequalities STA: A1.2.3 TOP: 3-3 Problem 4 Dividing by a Negative NumberDOK: DOK 1
47. ANS: x < –3
PTS: 1 DIF: L3 REF: 3-4 Solving Multi-Step InequalitiesOBJ: 3-4.1 To solve multi-step inequalities STA: A1.2.1| A1.2.3TOP: 3-4 Problem 1 Using More Than One Step DOK: DOK 1
48. ANS: b > 14
PTS: 1 DIF: L2 REF: 3-4 Solving Multi-Step InequalitiesOBJ: 3-4.1 To solve multi-step inequalities STA: A1.2.1| A1.2.3TOP: 3-4 Problem 3 Using the Distributive Property DOK: DOK 1
49. ANS: w ≥ 42
PTS: 1 DIF: L3 REF: 3-4 Solving Multi-Step InequalitiesOBJ: 3-4.1 To solve multi-step inequalities STA: A1.2.1| A1.2.3TOP: 3-4 Problem 4 Solving an Inequality With Variables on Both SidesDOK: DOK 1
50. ANS: C PTS: 1 DIF: L3 REF: 3-4 Solving Multi-Step InequalitiesOBJ: 3-4.1 To solve multi-step inequalities STA: A1.2.1| A1.2.3TOP: 3-4 Problem 5 Inequalities With Special Solutions DOK: DOK 1
51. ANS: C PTS: 1 DIF: L3 REF: 4-1 Using Graphs to Relate Two Quantities OBJ: 4-1.1 To represent mathematical relationships using graphs TOP: 4-1 Problem 2 Matching a Table and a Graph DOK: DOK 2

ID: A
9
52. ANS: A PTS: 1 DIF: L3 REF: 4-1 Using Graphs to Relate Two Quantities OBJ: 4-1.1 To represent mathematical relationships using graphs TOP: 4-1 Problem 3 Sketching a Graph DOK: DOK 2
53. ANS: D PTS: 1 DIF: L3 REF: 4-2 Patterns and Linear FunctionsOBJ: 4-2.1 To identify and represent patterns that describe linear functionsNAT: A.1.a| A.1.b| A.1.e| A.1.h STA: A2.1.1| A2.3.2| A2.1.3| A2.1.7| A2.3.1TOP: 4-2 Problem 1 Representing a Geometric Relationship KEY: dependent variable | independent variable | function | linear functionDOK: DOK 2
54. ANS:
Number of Triangles Perimeter
1 19
2 24
3 29
PTS: 1 DIF: L3 REF: 4-2 Patterns and Linear FunctionsOBJ: 4-2.1 To identify and represent patterns that describe linear functionsNAT: A.1.a| A.1.b| A.1.e| A.1.h STA: A2.1.1| A2.3.2| A2.1.3| A2.1.7| A2.3.1TOP: 4-2 Problem 1 Representing a Geometric Relationship KEY: independent variable | dependent variable | function | linear function | input | outputDOK: DOK 2

ID: A
10
55. ANS:
PTS: 1 DIF: L3 REF: 4-2 Patterns and Linear FunctionsOBJ: 4-2.1 To identify and represent patterns that describe linear functionsNAT: A.1.a| A.1.b| A.1.e| A.1.h STA: A2.1.1| A2.3.2| A2.1.3| A2.1.7| A2.3.1TOP: 4-2 Problem 1 Representing a Geometric Relationship KEY: dependent variable | independent variable | function | linear functionDOK: DOK 2
56. ANS: A PTS: 1 DIF: L3 REF: 4-2 Patterns and Linear FunctionsOBJ: 4-2.1 To identify and represent patterns that describe linear functionsNAT: A.1.a| A.1.b| A.1.e| A.1.h STA: A2.1.1| A2.3.2| A2.1.3| A2.1.7| A2.3.1TOP: 4-2 Problem 2 Representing a Linear Function KEY: dependent variable | independent variable | function | linear functionDOK: DOK 2
57. ANS: For every sports team the person joins, he or she spends 7 hours per week practicing. So, the amount of free time the person has, F, is the amount of free time they would have if they did not belong to any sports teams minus 7 times the number of teams they belong to. In equation form this is F = 46 − 7n.
PTS: 1 DIF: L3 REF: 4-2 Patterns and Linear FunctionsOBJ: 4-2.1 To identify and represent patterns that describe linear functionsNAT: A.1.a| A.1.b| A.1.e| A.1.h STA: A2.1.1| A2.3.2| A2.1.3| A2.1.7| A2.3.1TOP: 4-2 Problem 2 Representing a Linear Function KEY: dependent variable | independent variable | function | linear functionDOK: DOK 2
58. ANS: A PTS: 1 DIF: L3 REF: 4-3 Patterns and Nonlinear Functions OBJ: 4-3.1 To identify and represent patterns that describe nonlinear functionsNAT: A.1.a| A.1.e STA: A2.1.2| A2.1.3| A2.1.7| A2.3.1| A2.3.2 TOP: 4-3 Problem 1 Classifying Functions as Linear or Nonlinear DOK: DOK 2

ID: A
11
59. ANS: B PTS: 1 DIF: L3 REF: 4-3 Patterns and Nonlinear Functions OBJ: 4-3.1 To identify and represent patterns that describe nonlinear functionsNAT: A.1.a| A.1.e STA: A2.1.2| A2.1.3| A2.1.7| A2.3.1| A2.3.2 TOP: 4-3 Problem 1 Classifying Functions as Linear or Nonlinear KEY: nonlinear function DOK: DOK 2
60. ANS: A PTS: 1 DIF: L3 REF: 4-3 Patterns and Nonlinear Functions OBJ: 4-3.1 To identify and represent patterns that describe nonlinear functionsNAT: A.1.a| A.1.e STA: A2.1.2| A2.1.3| A2.1.7| A2.3.1| A2.3.2 TOP: 4-3 Problem 3 Writing a Rule to Describe a Nonlinear FunctionKEY: nonlinear function DOK: DOK 2
61. ANS: D PTS: 1 DIF: L4 REF: 4-3 Patterns and Nonlinear Functions OBJ: 4-3.1 To identify and represent patterns that describe nonlinear functionsNAT: A.1.a| A.1.e STA: A2.1.2| A2.1.3| A2.1.7| A2.3.1| A2.3.2 TOP: 4-3 Problem 3 Writing a Rule to Describe a Nonlinear FunctionKEY: nonlinear function DOK: DOK 2
62. ANS:
PTS: 1 DIF: L3 REF: 4-4 Graphing a Function RuleOBJ: 4-4.1 To graph equations that represent functions NAT: A.1.bSTA: A2.1.2| A2.1.3| A2.1.7 TOP: 4-4 Problem 2 Graphing a Real-World Function RuleKEY: continuous graph DOK: DOK 2
63. ANS: C = 11n; discrete
PTS: 1 DIF: L3 REF: 4-4 Graphing a Function RuleOBJ: 4-4.1 To graph equations that represent functions NAT: A.1.bSTA: A2.1.2| A2.1.3| A2.1.7 TOP: 4-4 Problem 3 Identifying Continuous and Discrete Graphs KEY: continuous graph | discrete graph DOK: DOK 2

ID: A
12
64. ANS: C = 1.90p; continuous
PTS: 1 DIF: L3 REF: 4-4 Graphing a Function RuleOBJ: 4-4.1 To graph equations that represent functions NAT: A.1.bSTA: A2.1.2| A2.1.3| A2.1.7 TOP: 4-4 Problem 3 Identifying Continuous and Discrete Graphs KEY: continuous graph | discrete graph DOK: DOK 2
65. ANS:
PTS: 1 DIF: L2 REF: 4-4 Graphing a Function RuleOBJ: 4-4.1 To graph equations that represent functions NAT: A.1.bSTA: A2.1.2| A2.1.3| A2.1.7 TOP: 4-4 Problem 4 Graphing Nonlinear Function RulesKEY: continuous graph DOK: DOK 2
66. ANS:
PTS: 1 DIF: L3 REF: 4-4 Graphing a Function RuleOBJ: 4-4.1 To graph equations that represent functions NAT: A.1.bSTA: A2.1.2| A2.1.3| A2.1.7 TOP: 4-4 Problem 4 Graphing Nonlinear Function RulesKEY: continuous graph DOK: DOK 2

ID: A
13
67. ANS: d(t) = 2.35t; 11.75 ft
PTS: 1 DIF: L2 REF: 4-5 Writing a Function RuleOBJ: 4-5.1 To write equations that represent functions NAT: A.1.bSTA: A2.1.2| A2.1.3| A2.1.7 TOP: 4-5 Problem 2 Writing and Evaluating a Function RuleDOK: DOK 2
68. ANS: m(h) = 5.50h; $20.63
PTS: 1 DIF: L3 REF: 4-5 Writing a Function RuleOBJ: 4-5.1 To write equations that represent functions NAT: A.1.bSTA: A2.1.2| A2.1.3| A2.1.7 TOP: 4-5 Problem 2 Writing and Evaluating a Function RuleDOK: DOK 2
69. ANS: B PTS: 1 DIF: L3 REF: 4-6 Formalizing Relations and Functions OBJ: 4-6.1 To determine whether a relation is a function NAT: N.2.c| A.1.b| A.1.g| A.1.i| A.3.fSTA: A2.1.1| A2.1.2| A2.1.3| A2.1.7 TOP: 4-6 Problem 1 Identifying Functions Using Mapping Diagrams KEY: relation | domain | range DOK: DOK 2
70. ANS: D PTS: 1 DIF: L3 REF: 4-6 Formalizing Relations and Functions OBJ: 4-6.1 To determine whether a relation is a function NAT: N.2.c| A.1.b| A.1.g| A.1.i| A.3.fSTA: A2.1.1| A2.1.2| A2.1.3| A2.1.7 TOP: 4-6 Problem 1 Identifying Functions Using Mapping Diagrams KEY: relation | domain | range DOK: DOK 2
71. ANS: A PTS: 1 DIF: L2 REF: 4-6 Formalizing Relations and Functions OBJ: 4-6.2 To find domain and range and use function notation NAT: N.2.c| A.1.b| A.1.g| A.1.i| A.3.f STA: A2.1.1| A2.1.2| A2.1.3| A2.1.7TOP: 4-6 Problem 3 Evaluating a Function KEY: function notationDOK: DOK 1
72. ANS: A PTS: 1 DIF: L2 REF: 4-6 Formalizing Relations and Functions OBJ: 4-6.2 To find domain and range and use function notation NAT: N.2.c| A.1.b| A.1.g| A.1.i| A.3.f STA: A2.1.1| A2.1.2| A2.1.3| A2.1.7TOP: 4-6 Problem 3 Evaluating a Function KEY: function notationDOK: DOK 1
73. ANS: B PTS: 1 DIF: L3 REF: 4-6 Formalizing Relations and Functions OBJ: 4-6.2 To find domain and range and use function notation NAT: N.2.c| A.1.b| A.1.g| A.1.i| A.3.f STA: A2.1.1| A2.1.2| A2.1.3| A2.1.7TOP: 4-6 Problem 5 Identifying a Reasonable Domain and Range KEY: domain | range | function notation DOK: DOK 3
ID: A
14
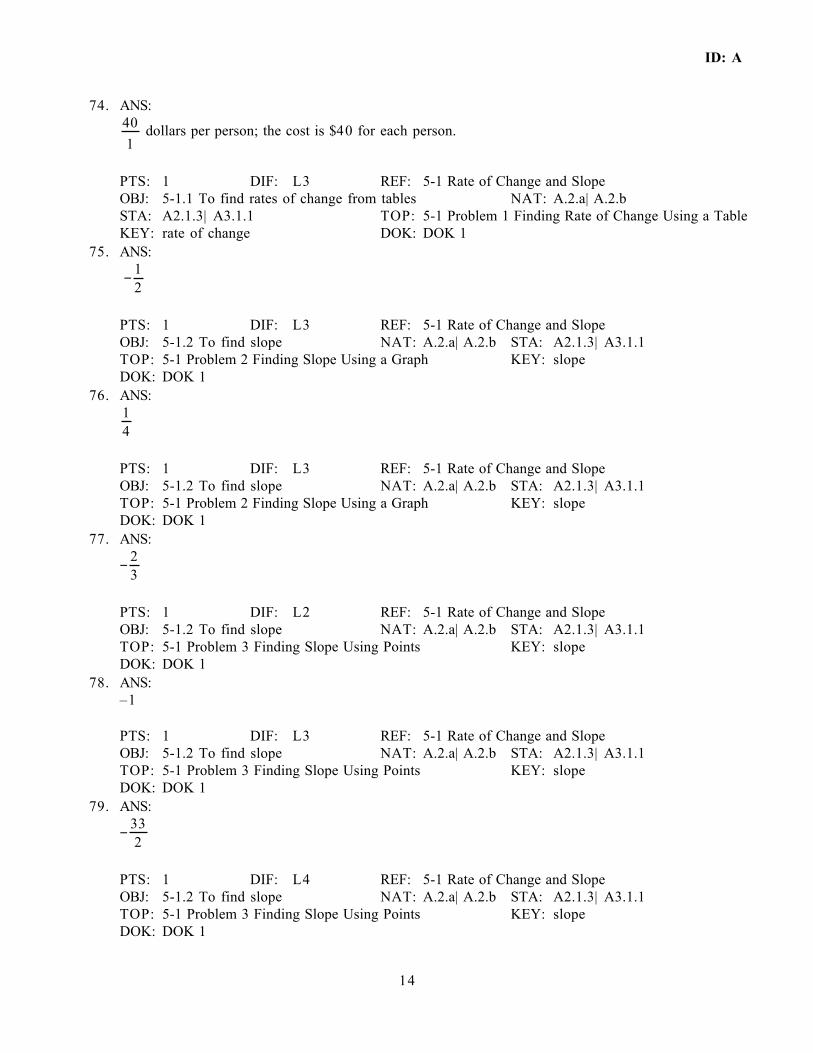
74. ANS: 401
dollars per person; the cost is $40 for each person.
PTS: 1 DIF: L3 REF: 5-1 Rate of Change and SlopeOBJ: 5-1.1 To find rates of change from tables NAT: A.2.a| A.2.bSTA: A2.1.3| A3.1.1 TOP: 5-1 Problem 1 Finding Rate of Change Using a TableKEY: rate of change DOK: DOK 1
75. ANS:
− 12
PTS: 1 DIF: L3 REF: 5-1 Rate of Change and SlopeOBJ: 5-1.2 To find slope NAT: A.2.a| A.2.b STA: A2.1.3| A3.1.1TOP: 5-1 Problem 2 Finding Slope Using a Graph KEY: slopeDOK: DOK 1
76. ANS: 14
PTS: 1 DIF: L3 REF: 5-1 Rate of Change and SlopeOBJ: 5-1.2 To find slope NAT: A.2.a| A.2.b STA: A2.1.3| A3.1.1TOP: 5-1 Problem 2 Finding Slope Using a Graph KEY: slopeDOK: DOK 1
77. ANS:
− 23
PTS: 1 DIF: L2 REF: 5-1 Rate of Change and SlopeOBJ: 5-1.2 To find slope NAT: A.2.a| A.2.b STA: A2.1.3| A3.1.1TOP: 5-1 Problem 3 Finding Slope Using Points KEY: slopeDOK: DOK 1
78. ANS: –1
PTS: 1 DIF: L3 REF: 5-1 Rate of Change and SlopeOBJ: 5-1.2 To find slope NAT: A.2.a| A.2.b STA: A2.1.3| A3.1.1TOP: 5-1 Problem 3 Finding Slope Using Points KEY: slopeDOK: DOK 1
79. ANS:
− 332
PTS: 1 DIF: L4 REF: 5-1 Rate of Change and SlopeOBJ: 5-1.2 To find slope NAT: A.2.a| A.2.b STA: A2.1.3| A3.1.1TOP: 5-1 Problem 3 Finding Slope Using Points KEY: slopeDOK: DOK 1

ID: A
15
80. ANS: 0
PTS: 1 DIF: L3 REF: 5-1 Rate of Change and SlopeOBJ: 5-1.2 To find slope NAT: A.2.a| A.2.b STA: A2.1.3| A3.1.1TOP: 5-1 Problem 4 Finding Slopes of Horizontal and Vertical Lines KEY: slope DOK: DOK 1
81. ANS: undefined
PTS: 1 DIF: L3 REF: 5-1 Rate of Change and SlopeOBJ: 5-1.2 To find slope NAT: A.2.a| A.2.b STA: A2.1.3| A3.1.1TOP: 5-1 Problem 4 Finding Slopes of Horizontal and Vertical Lines KEY: slope DOK: DOK 1
82. ANS:
yes; k = − 53
PTS: 1 DIF: L3 REF: 5-2 Direct Variation OBJ: 5-2.1 To write and graph an equation of a direct variation NAT: A.2.a| A.2.b STA: A2.1.3| A3.1.1| A3.1.2 TOP: 5-2 Problem 1 Identifying a Direct Variation KEY: direct variation | constant of variation for a direct variation DOK: DOK 1
83. ANS:
yes; k = 12
PTS: 1 DIF: L3 REF: 5-2 Direct Variation OBJ: 5-2.1 To write and graph an equation of a direct variation NAT: A.2.a| A.2.b STA: A2.1.3| A3.1.1| A3.1.2 TOP: 5-2 Problem 1 Identifying a Direct Variation KEY: direct variation | constant of variation for a direct variation DOK: DOK 1
84. ANS: no
PTS: 1 DIF: L3 REF: 5-2 Direct Variation OBJ: 5-2.1 To write and graph an equation of a direct variation NAT: A.2.a| A.2.b STA: A2.1.3| A3.1.1| A3.1.2 TOP: 5-2 Problem 1 Identifying a Direct Variation KEY: direct variation | constant of variation for a direct variation DOK: DOK 1

ID: A
16
85. ANS: y = –1.33x; 2.67
PTS: 1 DIF: L4 REF: 5-2 Direct Variation OBJ: 5-2.1 To write and graph an equation of a direct variation NAT: A.2.a| A.2.b STA: A2.1.3| A3.1.1| A3.1.2 TOP: 5-2 Problem 2 Writing a Direct Variation Equation KEY: direct variation | constant of variation for a direct variation DOK: DOK 1
86. ANS:
y = 9512
x; − 66572
PTS: 1 DIF: L3 REF: 5-2 Direct Variation OBJ: 5-2.1 To write and graph an equation of a direct variation NAT: A.2.a| A.2.b STA: A2.1.3| A3.1.1| A3.1.2 TOP: 5-2 Problem 2 Writing a Direct Variation Equation KEY: direct variation | constant of variation for a direct variation DOK: DOK 1
87. ANS: The slope is –9 and the y-intercept is 2.
PTS: 1 DIF: L2 REF: 5-3 Slope-Intercept FormOBJ: 5-3.1 To write linear equations using slope-intercept form NAT: A.2.a| A.2.b STA: A2.1.3| A3.1.1| A3.1.2| A3.1.3 TOP: 5-3 Problem 1 Identifying Slope and y-intercept KEY: linear equation | y-intercept | slope-intercept form DOK: DOK 1
88. ANS: y = x + 4
PTS: 1 DIF: L2 REF: 5-3 Slope-Intercept FormOBJ: 5-3.1 To write linear equations using slope-intercept form NAT: A.2.a| A.2.b STA: A2.1.3| A3.1.1| A3.1.2| A3.1.3 TOP: 5-3 Problem 2 Writing an Equation in Slope-Intercept Form KEY: linear equation | slope-intercept form | y-intercept DOK: DOK 1
89. ANS:
y = 58
x + 12
PTS: 1 DIF: L3 REF: 5-3 Slope-Intercept FormOBJ: 5-3.2 To graph linear equations in slope-intercept form NAT: A.2.a| A.2.b STA: A2.1.3| A3.1.1| A3.1.2| A3.1.3 TOP: 5-3 Problem 3 Writing an Equation From a Graph KEY: slope-intercept form | linear equation | y-intercept DOK: DOK 1

ID: A
17
90. ANS:
y = − 37
x + 417
PTS: 1 DIF: L2 REF: 5-3 Slope-Intercept FormOBJ: 5-3.1 To write linear equations using slope-intercept form NAT: A.2.a| A.2.b STA: A2.1.3| A3.1.1| A3.1.2| A3.1.3 TOP: 5-3 Problem 4 Writing an Equation From Two Points KEY: linear equation | y-intercept | slope-intercept form DOK: DOK 1
91. ANS:
PTS: 1 DIF: L3 REF: 5-3 Slope-Intercept FormOBJ: 5-3.2 To graph linear equations in slope-intercept form NAT: A.2.a| A.2.b STA: A2.1.3| A3.1.1| A3.1.2| A3.1.3 TOP: 5-3 Problem 5 Graphing a Linear Function KEY: linear equation | y-intercept | slope-intercept form DOK: DOK 1
ID: A
18
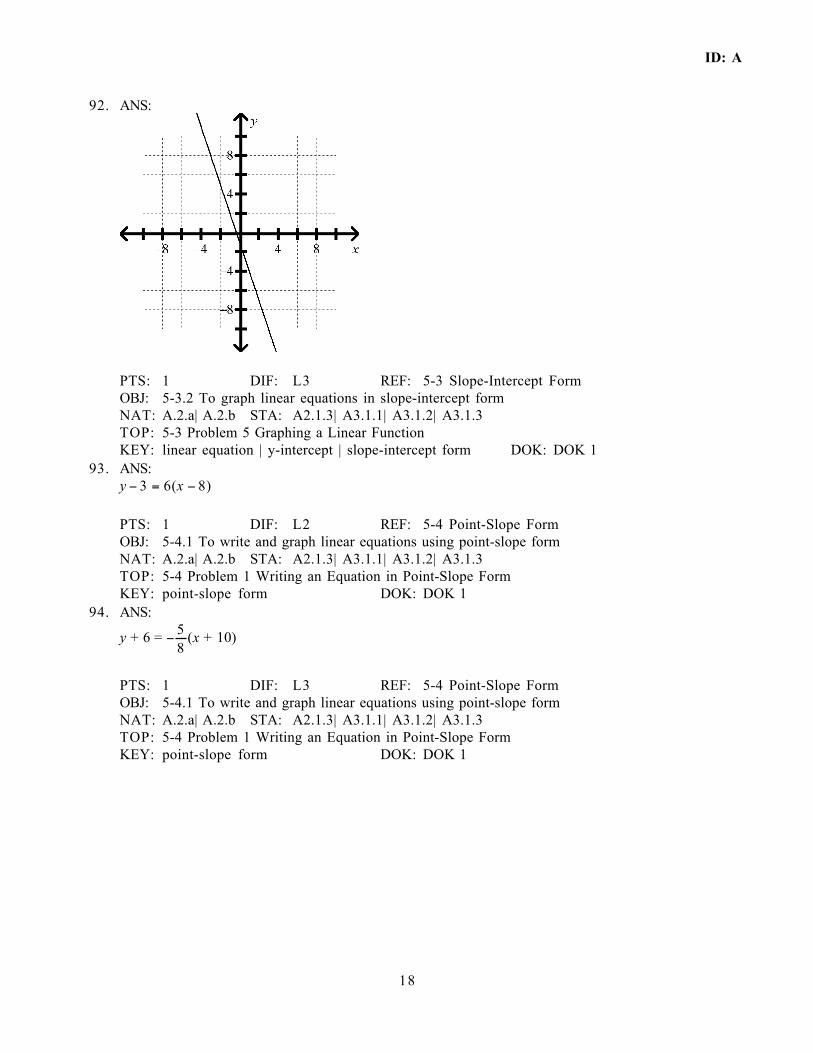
92. ANS:
PTS: 1 DIF: L3 REF: 5-3 Slope-Intercept FormOBJ: 5-3.2 To graph linear equations in slope-intercept form NAT: A.2.a| A.2.b STA: A2.1.3| A3.1.1| A3.1.2| A3.1.3 TOP: 5-3 Problem 5 Graphing a Linear Function KEY: linear equation | y-intercept | slope-intercept form DOK: DOK 1
93. ANS: y − 3 = 6(x − 8)
PTS: 1 DIF: L2 REF: 5-4 Point-Slope FormOBJ: 5-4.1 To write and graph linear equations using point-slope formNAT: A.2.a| A.2.b STA: A2.1.3| A3.1.1| A3.1.2| A3.1.3 TOP: 5-4 Problem 1 Writing an Equation in Point-Slope Form KEY: point-slope form DOK: DOK 1
94. ANS:
y + 6 = − 58
(x + 10)
PTS: 1 DIF: L3 REF: 5-4 Point-Slope FormOBJ: 5-4.1 To write and graph linear equations using point-slope formNAT: A.2.a| A.2.b STA: A2.1.3| A3.1.1| A3.1.2| A3.1.3 TOP: 5-4 Problem 1 Writing an Equation in Point-Slope Form KEY: point-slope form DOK: DOK 1

ID: A
19
95. ANS:
PTS: 1 DIF: L3 REF: 5-4 Point-Slope FormOBJ: 5-4.1 To write and graph linear equations using point-slope formNAT: A.2.a| A.2.b STA: A2.1.3| A3.1.1| A3.1.2| A3.1.3 TOP: 5-4 Problem 2 Graphing Using Point-Slope Form KEY: point-slope formDOK: DOK 1
96. ANS:
PTS: 1 DIF: L3 REF: 5-4 Point-Slope FormOBJ: 5-4.1 To write and graph linear equations using point-slope formNAT: A.2.a| A.2.b STA: A2.1.3| A3.1.1| A3.1.2| A3.1.3 TOP: 5-4 Problem 2 Graphing Using Point-Slope Form KEY: point-slope formDOK: DOK 1

ID: A
20
97. ANS:
PTS: 1 DIF: L3 REF: 5-4 Point-Slope FormOBJ: 5-4.1 To write and graph linear equations using point-slope formNAT: A.2.a| A.2.b STA: A2.1.3| A3.1.1| A3.1.2| A3.1.3 TOP: 5-4 Problem 2 Graphing Using Point-Slope Form KEY: point-slope formDOK: DOK 1
98. ANS: y + 3 = 2(x + 2)
PTS: 1 DIF: L3 REF: 5-4 Point-Slope FormOBJ: 5-4.1 To write and graph linear equations using point-slope formNAT: A.2.a| A.2.b STA: A2.1.3| A3.1.1| A3.1.2| A3.1.3 TOP: 5-4 Problem 3 Using Two Points to Write an Equation KEY: point-slope form DOK: DOK 1
99. ANS: x-intercept is 12; y-intercept is –2
PTS: 1 DIF: L2 REF: 5-5 Standard Form OBJ: 5-5.1 To graph linear equations using intercepts NAT: A.2.a| A.2.bSTA: A2.1.3| A3.1.1| A3.1.2| A3.1.3 TOP: 5-5 Problem 1 Finding x- and y-interceptsKEY: x-intercept | standard form of a linear equation DOK: DOK 1
100. ANS: x-intercept is –10.4; y-intercept is –9.2
PTS: 1 DIF: L3 REF: 5-5 Standard Form OBJ: 5-5.1 To graph linear equations using intercepts NAT: A.2.a| A.2.bSTA: A2.1.3| A3.1.1| A3.1.2| A3.1.3 TOP: 5-5 Problem 1 Finding x- and y-interceptsKEY: x-intercept | standard form of a linear equation DOK: DOK 1
ID: A
21
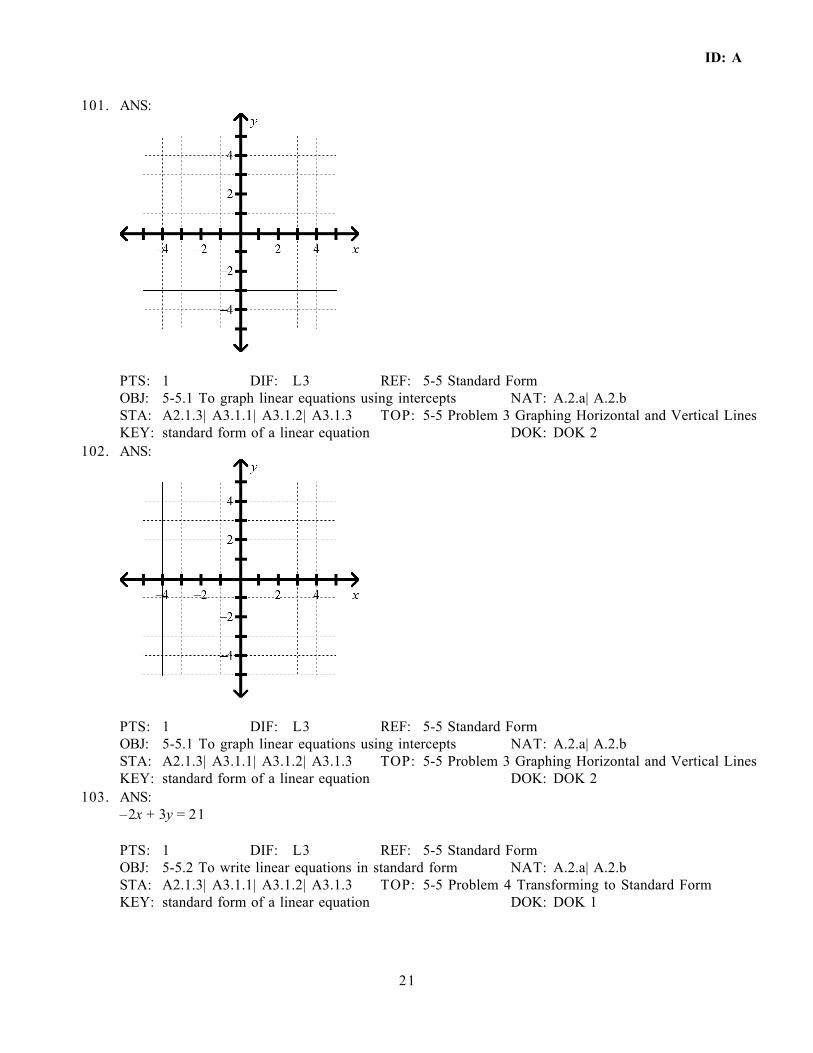
101. ANS:
PTS: 1 DIF: L3 REF: 5-5 Standard Form OBJ: 5-5.1 To graph linear equations using intercepts NAT: A.2.a| A.2.bSTA: A2.1.3| A3.1.1| A3.1.2| A3.1.3 TOP: 5-5 Problem 3 Graphing Horizontal and Vertical LinesKEY: standard form of a linear equation DOK: DOK 2
102. ANS:
PTS: 1 DIF: L3 REF: 5-5 Standard Form OBJ: 5-5.1 To graph linear equations using intercepts NAT: A.2.a| A.2.bSTA: A2.1.3| A3.1.1| A3.1.2| A3.1.3 TOP: 5-5 Problem 3 Graphing Horizontal and Vertical LinesKEY: standard form of a linear equation DOK: DOK 2
103. ANS: –2x + 3y = 21
PTS: 1 DIF: L3 REF: 5-5 Standard Form OBJ: 5-5.2 To write linear equations in standard form NAT: A.2.a| A.2.bSTA: A2.1.3| A3.1.1| A3.1.2| A3.1.3 TOP: 5-5 Problem 4 Transforming to Standard FormKEY: standard form of a linear equation DOK: DOK 1

ID: A
22
104. ANS: 28.25p + 6.25r = 145
PTS: 1 DIF: L3 REF: 5-5 Standard Form OBJ: 5-5.2 To write linear equations in standard form NAT: A.2.a| A.2.bSTA: A2.1.3| A3.1.1| A3.1.2| A3.1.3 TOP: 5-5 Problem 5 Using Standard Form as a ModelKEY: standard form of a linear equation DOK: DOK 2
105. ANS: 4.75d + 2g = 12
PTS: 1 DIF: L3 REF: 5-5 Standard Form OBJ: 5-5.2 To write linear equations in standard form NAT: A.2.a| A.2.bSTA: A2.1.3| A3.1.1| A3.1.2| A3.1.3 TOP: 5-5 Problem 5 Using Standard Form as a ModelKEY: standard form of a linear equation DOK: DOK 2
106. ANS: A PTS: 1 DIF: L3 REF: 5-7 Scatter Plots and Trend LinesOBJ: 5-7.1 To write an equation of a trend line and of a line of best fitNAT: D.1.c| D.2.e| D.5.d| A.2.a| A.2.b STA: L1.2.4| S2.1.1| S2.1.2| S2.1.4TOP: 5-7 Problem 1 Making a Scatter Plot and Describing Its CorrelationKEY: scatter plot DOK: DOK 2
107. ANS: B PTS: 1 DIF: L3 REF: 5-7 Scatter Plots and Trend LinesOBJ: 5-7.1 To write an equation of a trend line and of a line of best fitNAT: D.1.c| D.2.e| D.5.d| A.2.a| A.2.b STA: L1.2.4| S2.1.1| S2.1.2| S2.1.4TOP: 5-7 Problem 1 Making a Scatter Plot and Describing Its CorrelationKEY: scatter plot DOK: DOK 2
108. ANS: C PTS: 1 DIF: L3 REF: 5-7 Scatter Plots and Trend LinesOBJ: 5-7.1 To write an equation of a trend line and of a line of best fitNAT: D.1.c| D.2.e| D.5.d| A.2.a| A.2.b STA: L1.2.4| S2.1.1| S2.1.2| S2.1.4TOP: 5-7 Problem 1 Making a Scatter Plot and Describing Its CorrelationKEY: scatter plot DOK: DOK 2
109. ANS: D PTS: 1 DIF: L3 REF: 5-7 Scatter Plots and Trend LinesOBJ: 5-7.2 To use a trend line and a line of best fit to make predictionsNAT: D.1.c| D.2.e| D.5.d| A.2.a| A.2.b STA: L1.2.4| S2.1.1| S2.1.2| S2.1.4TOP: 5-7 Problem 2 Writing an Equation of a Trend Line KEY: scatter plot | trend lineDOK: DOK 2
110. ANS: C PTS: 1 DIF: L3 REF: 5-7 Scatter Plots and Trend LinesOBJ: 5-7.2 To use a trend line and a line of best fit to make predictionsNAT: D.1.c| D.2.e| D.5.d| A.2.a| A.2.b STA: L1.2.4| S2.1.1| S2.1.2| S2.1.4TOP: 5-7 Problem 2 Writing an Equation of a Trend Line KEY: scatter plot | trend lineDOK: DOK 2
111. ANS: A PTS: 1 DIF: L3 REF: 5-7 Scatter Plots and Trend LinesOBJ: 5-7.2 To use a trend line and a line of best fit to make predictionsNAT: D.1.c| D.2.e| D.5.d| A.2.a| A.2.b STA: L1.2.4| S2.1.1| S2.1.2| S2.1.4TOP: 5-7 Problem 4 Identifying Whether Relationships Are Causal KEY: causation | positive correlation DOK: DOK 3
ID: A
23
112. ANS: B PTS: 1 DIF: L3 REF: 5-7 Scatter Plots and Trend LinesOBJ: 5-7.2 To use a trend line and a line of best fit to make predictionsNAT: D.1.c| D.2.e| D.5.d| A.2.a| A.2.b STA: L1.2.4| S2.1.1| S2.1.2| S2.1.4TOP: 5-7 Problem 4 Identifying Whether Relationships Are Causal KEY: causation | negative correlation DOK: DOK 3
113. ANS: There is likely to be a positive correlation because as the number of people in a city increases, the number of pets and doctors will tend to increase. However, an increase in the number of pets in a city does not cause an increase in the number of doctors.
PTS: 1 DIF: L4 REF: 5-7 Scatter Plots and Trend LinesOBJ: 5-7.2 To use a trend line and a line of best fit to make predictionsNAT: D.1.c| D.2.e| D.5.d| A.2.a| A.2.b STA: L1.2.4| S2.1.1| S2.1.2| S2.1.4TOP: 5-7 Problem 4 Identifying Whether Relationships Are Causal KEY: causation | no correlation | positive correlation | negative correlationDOK: DOK 2
114. ANS: A PTS: 1 DIF: L2 REF: 6-1 Solving Systems By GraphingOBJ: 6-1.1 To solve systems of equations by graphing NAT: A.4.dSTA: A1.2.3 TOP: 6-1 Problem 1 Solving a System of Equations by GraphingKEY: system of linear equations | solution of a system of linear equations | consistent | independentDOK: DOK 1
115. ANS:
PTS: 1 DIF: L3 REF: 6-1 Solving Systems By GraphingOBJ: 6-1.1 To solve systems of equations by graphing NAT: A.4.dSTA: A1.2.3 TOP: 6-1 Problem 1 Solving a System of Equations by GraphingKEY: consistent | independent | solution of a system of linear equations | system of linear equationsDOK: DOK 1

ID: A
24
116. ANS:
PTS: 1 DIF: L3 REF: 6-1 Solving Systems By GraphingOBJ: 6-1.1 To solve systems of equations by graphing NAT: A.4.dSTA: A1.2.3 TOP: 6-1 Problem 1 Solving a System of Equations by GraphingKEY: consistent | independent | solution of a system of linear equations | system of linear equationsDOK: DOK 1
117. ANS:
PTS: 1 DIF: L3 REF: 6-1 Solving Systems By GraphingOBJ: 6-1.1 To solve systems of equations by graphing NAT: A.4.dSTA: A1.2.3 TOP: 6-1 Problem 1 Solving a System of Equations by GraphingKEY: consistent | independent | solution of a system of linear equations | system of linear equationsDOK: DOK 1

ID: A
25
118. ANS:
no solutions
PTS: 1 DIF: L3 REF: 6-1 Solving Systems By GraphingOBJ: 6-1.2 To analyze special systems NAT: A.4.d STA: A1.2.3TOP: 6-1 Problem 3 Systems With Infinitely Many Solutions or No SolutionKEY: system of linear equations | solution of a system of linear equations | inconsistentDOK: DOK 1
119. ANS:
infinitely many solutions
PTS: 1 DIF: L3 REF: 6-1 Solving Systems By GraphingOBJ: 6-1.2 To analyze special systems NAT: A.4.d STA: A1.2.3TOP: 6-1 Problem 3 Systems With Infinitely Many Solutions or No SolutionKEY: system of linear equations | solution of a system of linear equations | consistent | dependentDOK: DOK 1

ID: A
26
120. ANS: (6, 12)
PTS: 1 DIF: L2 REF: 6-2 Solving Systems Using SubstitutionOBJ: 6-2.1 To solve systems of equations using substitution NAT: A.4.dTOP: 6-2 Problem 1 Using Substitution KEY: substitution method DOK: DOK 1
121. ANS: (5, –4)
PTS: 1 DIF: L3 REF: 6-2 Solving Systems Using SubstitutionOBJ: 6-2.1 To solve systems of equations using substitution NAT: A.4.dTOP: 6-2 Problem 1 Using Substitution KEY: substitution method DOK: DOK 1
122. ANS: (10, –1)
PTS: 1 DIF: L3 REF: 6-2 Solving Systems Using SubstitutionOBJ: 6-2.1 To solve systems of equations using substitution NAT: A.4.dTOP: 6-2 Problem 1 Using Substitution KEY: substitution method DOK: DOK 1
123. ANS: (1.5, 10)
PTS: 1 DIF: L3 REF: 6-2 Solving Systems Using SubstitutionOBJ: 6-2.1 To solve systems of equations using substitution NAT: A.4.dTOP: 6-2 Problem 2 Solving for a Variable and Using Substitution KEY: substitution method DOK: DOK 1
124. ANS: (–4, –21)
PTS: 1 DIF: L3 REF: 6-2 Solving Systems Using SubstitutionOBJ: 6-2.1 To solve systems of equations using substitution NAT: A.4.dTOP: 6-2 Problem 2 Solving for a Variable and Using Substitution KEY: substitution method DOK: DOK 1
125. ANS: (3, 9)
PTS: 1 DIF: L2 REF: 6-2 Solving Systems Using SubstitutionOBJ: 6-2.1 To solve systems of equations using substitution NAT: A.4.dTOP: 6-2 Problem 2 Solving for a Variable and Using Substitution KEY: substitution method DOK: DOK 1

ID: A
27
126. ANS: 8 cakes
PTS: 1 DIF: L3 REF: 6-2 Solving Systems Using SubstitutionOBJ: 6-2.1 To solve systems of equations using substitution NAT: A.4.dTOP: 6-2 Problem 3 Using Systems of Equations KEY: substitution methodDOK: DOK 2
127. ANS: C PTS: 1 DIF: L3 REF: 6-2 Solving Systems Using Substitution OBJ: 6-2.1 To solve systems of equations using substitution NAT: A.4.dTOP: 6-2 Problem 4 Systems With Infinitely Many Solutions or No SolutionKEY: substitution method DOK: DOK 2
128. ANS: D PTS: 1 DIF: L3 REF: 6-2 Solving Systems Using Substitution OBJ: 6-2.1 To solve systems of equations using substitution NAT: A.4.dTOP: 6-2 Problem 4 Systems With Infinitely Many Solutions or No SolutionKEY: substitution method DOK: DOK 2
129. ANS: (–3, 1)
PTS: 1 DIF: L3 REF: 6-3 Solving Systems Using EliminationOBJ: 6-3.1 To solve systems by adding or subtracting to eliminate a variableNAT: A.4.d TOP: 6-3 Problem 1 Solving a System by Adding EquationsKEY: elimination method DOK: DOK 1
130. ANS: (2, –3)
PTS: 1 DIF: L3 REF: 6-3 Solving Systems Using EliminationOBJ: 6-3.1 To solve systems by adding or subtracting to eliminate a variableNAT: A.4.d TOP: 6-3 Problem 1 Solving a System by Adding EquationsKEY: elimination method DOK: DOK 1
131. ANS: (2, –30)
PTS: 1 DIF: L2 REF: 6-3 Solving Systems Using EliminationOBJ: 6-3.1 To solve systems by adding or subtracting to eliminate a variableNAT: A.4.d TOP: 6-3 Problem 1 Solving a System by Adding EquationsKEY: elimination method DOK: DOK 1
132. ANS: (–9, –9)
PTS: 1 DIF: L3 REF: 6-3 Solving Systems Using EliminationOBJ: 6-3.1 To solve systems by adding or subtracting to eliminate a variableNAT: A.4.d TOP: 6-3 Problem 1 Solving a System by Adding EquationsKEY: elimination method DOK: DOK 1

ID: A
28
133. ANS: 34 wraps
PTS: 1 DIF: L4 REF: 6-3 Solving Systems Using EliminationOBJ: 6-3.1 To solve systems by adding or subtracting to eliminate a variableNAT: A.4.d TOP: 6-3 Problem 2 Solving a System by Subtracting EquationsKEY: elimination method DOK: DOK 2
134. ANS: (–9, 2)
PTS: 1 DIF: L3 REF: 6-3 Solving Systems Using EliminationOBJ: 6-3.1 To solve systems by adding or subtracting to eliminate a variableNAT: A.4.d TOP: 6-3 Problem 3 Solving a System by Multiplying One EquationKEY: elimination method DOK: DOK 1
135. ANS: (–4, 3)
PTS: 1 DIF: L2 REF: 6-3 Solving Systems Using EliminationOBJ: 6-3.1 To solve systems by adding or subtracting to eliminate a variableNAT: A.4.d TOP: 6-3 Problem 3 Solving a System by Multiplying One EquationKEY: elimination method DOK: DOK 1
136. ANS: (–4, –1)
PTS: 1 DIF: L2 REF: 6-3 Solving Systems Using EliminationOBJ: 6-3.1 To solve systems by adding or subtracting to eliminate a variableNAT: A.4.d TOP: 6-3 Problem 3 Solving a System by Multiplying One EquationKEY: elimination method DOK: DOK 1
137. ANS: (–2, 3)
PTS: 1 DIF: L4 REF: 6-3 Solving Systems Using EliminationOBJ: 6-3.1 To solve systems by adding or subtracting to eliminate a variableNAT: A.4.d TOP: 6-3 Problem 3 Solving a System by Multiplying One EquationKEY: elimination method DOK: DOK 1
138. ANS: (5, 1)
PTS: 1 DIF: L2 REF: 6-3 Solving Systems Using EliminationOBJ: 6-3.1 To solve systems by adding or subtracting to eliminate a variableNAT: A.4.d TOP: 6-3 Problem 4 Solving a System by Multiplying Both EquationsKEY: elimination method DOK: DOK 1

ID: A
29
139. ANS: (–1, 4)
PTS: 1 DIF: L3 REF: 6-3 Solving Systems Using EliminationOBJ: 6-3.1 To solve systems by adding or subtracting to eliminate a variableNAT: A.4.d TOP: 6-3 Problem 4 Solving a System by Multiplying Both EquationsKEY: elimination method DOK: DOK 1
140. ANS: (–3, 2)
PTS: 1 DIF: L4 REF: 6-3 Solving Systems Using EliminationOBJ: 6-3.1 To solve systems by adding or subtracting to eliminate a variableNAT: A.4.d TOP: 6-3 Problem 4 Solving a System by Multiplying Both EquationsKEY: elimination method DOK: DOK 1
141. ANS: C PTS: 1 DIF: L3 REF: 6-3 Solving Systems Using Elimination OBJ: 6-3.1 To solve systems by adding or subtracting to eliminate a variableNAT: A.4.d TOP: 6-3 Problem 5 Finding the Number of SolutionsKEY: elimination method DOK: DOK 2
142. ANS: D PTS: 1 DIF: L3 REF: 6-3 Solving Systems Using Elimination OBJ: 6-3.1 To solve systems by adding or subtracting to eliminate a variableNAT: A.4.d TOP: 6-3 Problem 5 Finding the Number of SolutionsKEY: elimination method DOK: DOK 2
143. ANS: x ≥ −40
PTS: 1 DIF: L3 REF: 3-3 Solving Inequalities Using Multiplication or Division OBJ: 3-3.1 To use multiplication or division to solve inequalities STA: A1.2.3 TOP: 3-3 Problem 2 Multiplying by a Negative NumberDOK: DOK 2
144. ANS: The variables are distance and time. The distance from the store increases as she drives, and it stays constant each time she stops for a traffic light or to stop at a customer’s house. After her third stop, she starts heading back to the store. The distance from the store decreases as she drives, and it stays constant for one more stop. Finally, she makes it back to the store and the distance is zero again.
PTS: 1 DIF: L3 REF: 4-1 Using Graphs to Relate Two QuantitiesOBJ: 4-1.1 To represent mathematical relationships using graphs TOP: 4-1 Problem 1 Analyzing a Graph DOK: DOK 2
ID: A
30
145. ANS: The variables are the number of handbags and time. The flat parts of the graph show either where Mandy is working on a handbag or taking a break. As soon as Mandy finishes a bag, the graph jumps up a level to show that she has completed one more bag.
PTS: 1 DIF: L3 REF: 4-1 Using Graphs to Relate Two QuantitiesOBJ: 4-1.1 To represent mathematical relationships using graphs TOP: 4-1 Problem 1 Analyzing a Graph DOK: DOK 2