alfalfa meal in poultry feeds- an economic …
TRANSCRIPT

AGRICULTURAL ECONOMIC REPORT NO. 130
^'^''''' ; GELTSVILLE BRANCH
LIBRARY RECE!V"D
FfTR- q lOhP;
ALFALFA MEAL IN POULTRY FEEDS-
AN ECONOMIC EVALUATION USING
PARAMETRIC LINEAR PROGRAMMING
ECONOMIC RESEARCH SERVICE # UNITED STATES DEPARTMENT OF AGRICULTURE
PREFACE
The use of dehydrated alfalfa meal in animal feeds--particularly poultry feeds-- has been receiving increased attention and emphasis in recent years. The Western Utilization Research and Development Division of the Departmtent's Agricultural Research Service has developed a m.ethod of separating dehydrated alfalfa meal into high protein leaf m.eal and low protein (high fiber) stem meal. Animal nu- tritionists have found that each of these products can be utilized more efficiently by different types of animals.
Protein content is a fairly good indicator of overall quality of alfalfa meal. However, the content of other nutrients must be known before the economic value of alfalfa meal can be determined relative to the value of other ingredients that would supply the same nutrients. The Western Division has made chemical analyses of dehydrated alfalfa meals of differing protein content which provide a breakdown of the quantities of amino acids, xanthophyll, vitannin A, etc., but little information is available on the econonaic value of these constituents in different mixed feeds.
The Marketing Econonaics Division, Economic Research Service, in cooperation with the Western Division and the Monsanto Company, has undertaken this study in an attempt to provide this information* The study is one of a series in a continuing program, of cooperative research between the U.S. Department of Agriculture's. Marketing Economics Division and Utilization Research and Development Divisions and various agribusiness firms. The objective of these studies is to help provide economic evaluation and guidance to physical science research in the Department of Agriculture, so that it may best serve the needs of U.S. agriculture.
11

CONTENTS
Summary and conclusions •••••• •••..• «.iv Introduction« • •••••••••.••• ••••• 1 Method of study ••• ••• 2
Linear progranuning, •••• • ^ Parametric linear programming ^ Procedure •••« ••• • ••• 4
Dehy in broiler finisher ration. • •••••••••••• •• 5 Dehy 20 .•••.. ^ Quality conaparisons • •«••••••«•• "
Dehy in different rations compared • 7 Evaluation of various components of dehy ••••••••••• 8
Xanthophyll 8 Vitamin A •••••••«••••••••••••• ^ Tryptophan ••••••••••• •••••••••••••••H Metabolizable energy •••••« ••••••«•••••• 12 Lysine «..««•••••••••• ; ••••••12
Parametric linear programjning as an evaluator of research Appendix ••
14 14
For sate by the Superinfendent of Documents, U.S. Government Printing Office,-Washington, D.C. 20402
Washington, D.C. January 1968
111
SUMMARY AND CONCLUSIONS
To determine the value of dehydrated alfalfa meal (dehy) in poultry feeds, intrinsic value curves were developed using the parametric linear programj:ning technique« The points on the curves corresponded to points of substitut ion--point s at which a nutritional factor in dehy substituted for a nutritional factor fronn. sonae other source. Configuration of the curves was dependent on the quality of dehy, the specifications of the ration being formulated, competitive ingredients, and ingredient prices. Changes in any of these factors usually resulted in significant alterations in curve configurations. At each solution point (point of substitution) on the curve, a complete ration formula was obtained, shadow prices were established for ingredients not entering the solutions, and opportunity costs were specified for ration requirenaents.
The price of dehy was allowed to decrease from. $1,000 to $0 per ton in all tests. As the price decreased in very small increments, the amount of dehy used in the ration increased. The increases were not continuous but steplike. The most im.portant points of substitution were the xanthophy 11, vitam.in A, and tryptophan points. The tryptophan point defined the point of entry for dehy into the ration; the vitamin A point was where vitamin A in dehy became cheaper than the synthetic source; the xanthophyll point was where dehy could supply the xanthophyll require- naent at less cost than high protein corn gluten meal.
The xanthophyll point of substitutionis them.ost significant for alfalfa dehydrators. It is a point where the price for dehy is still high, and where a comparatively large am.ount is called for by the ration. As an exanaple, in the broiler finisher ration, for 20 percent protein dehy, the xanthophyll point of substitution called for 3 percent dehy in the ration at a price of $71 a ton. The next point of substitution, vitamin K, called for 6 percent dehy in the ration at a price of $32 a ton. A price of $71 a ton for dehy would be highly profitable for most dehydrators; a price of $32 a ton would not meet the cost of production.
In all cases, as the protein content of dehy increased, the value curve rose at a faster rate. At the xanthophyll point of substitution for the broiler finisher ration, dehy was valued at $71 a ton with 20 percent protein but increased to $130 a ton with 28 percent protein. The value curve for dehy also varied according to the ration being formulated. The value of dehy was greater in the layer ration than in either the broiler starter or broiler finisher rations. Changes in requirements of specific rations also greatly affected value curves. This was especially the case with xanthophyll requirements.
This was a pioneering study in evaluating a feed ingredient by using param.etric linear programming. Only one situation, the fornaulation of poultry feeds using one set of prices, was evaluated. Work by others using more varied prices and feeding situations is encouraged in order to better deternaine the true value of dehy in specific feeds under specific feeding and pricing conditions. The technique described is adequate in testing the value of dehy or any other ingredient, where nutrient paranaeters have been determined.
In addition to evaluating feed ingredients, paranaetric linear programming can help scientists evaluate the potentials of other research such as investigations of m.ethods of altering the content of an ingredient. As an example, tests showed that a 40-percent increase in the naetabolizable energy content of dehy would increase its value $10.80 per ton, whereas the same percentage increase in lysine content would increase its value only $2 a ton.

ALFALFA MEAL IN POULTRY FEEDS ... AN ECONOMIC EVALUATION USING PARAMETRIC LINEAR PROGRAMMING
Reed D. Taylor, George O. Köhler, Kenneth H. Maddy, and Robert V. Enochian \J
INTRODUCTION
Dehydrated alfalfa naeal, *'dehy,** like many other feedstuffs, contributes a connplexity of nutrients, vitamins, and minerals to a feed formula. Many of its contributions have been identified and quantified; some have not. The most rec- ognized contributions are amino acids; pigmenting xanthophylls; provitamins A (carotene)p K, and E; and the minerals, calciumi and phosphorus. Unidentified growth and reproductive factors also may make valuable contributions, but they cannot be quantified« Dehy also has some negative aspects. Its greatest weaknesses probably are its high fiber and low energy content. The energy to weight ratio is much less than required in most rations and naust be offset by addition of high energy ingredients to the ration«
The protein content of dehy is related to other quality factors. In general, the higher the protein content, the greater the concentration of amino acids, xan- thophylls, vitamins, and minerals. The energy content is also positively correlated with protein level, while the fiber content is negatively correlated. Standard grades of alfalfa meal are the 15, 17, and 20 percent protein grades. Some 22 percent protein meal is sold from time to time.
The alfalfa plant is made up of two major fractions--leaf and stem. Each fraction differs significantly from the other in physical and chem.ical properties. The leaves of any given alfalfa plant will have a much higher protein content than the stenci. The leaf fraction, containing a higher percentage of "plus" factors, is well suited for monogastric (one-stomach) animals such as poultry and swine. The stem fraction is suitable for ruminant (multiple-stomach) animals which have higher fiber tolerances.
Research at the Western Regional Research Laboratory of the U.S. Departnaent of Agriculture in cooperation with the State Department of Agriculture of Nebraska resulted in a process for separation of the alfalfa plant into stem and leaf fractions. 2/
\J Reed D. Taylor is now with the Monsanto Company, St. Louis, Mo«, as a Project Supervisor in the Agricultural Development Departm.ent. At the time the study was conducted he was an Agricultural Economist, Marketing Economics Division, Economic Research Service, U.S. Department of Agriculture, Albany, Calif.
George O. Köhler is Chief of the Field Crops Laboratory, Western Utilization Research and Development Division, Agricultural Research Service, U.S. Department of Agriculture, Albany, Calif.
Kenneth H. Maddy is Manager of New Projects Development, Developnaent Departm.ent, Agricultural Division, Monsanto Company, St. Louis, Mo.
Robert V. Enochian is Agricultural Economist of the Western Research Office, Marketing Econonnics Division, Economic Research Service, U.S. Department of Agriculture, Albany, Calif.
2/ Joseph Chrisman, G. O. Kbhler, A. C. Mottola, and J, W. Nelson. Separation-- Nebraska St age-of-Growth Study, p. 17. Jn Ninth Technical Alfalfa Conference Proceedings, ARS 74-36, Nov. 17, 1965.
G. Oo Köhler, J. Chrisman, R. Palter. J. Guggolz, and V. Herring. Composition of Standard and Super Grades of Alfalfa. In Ninth Technical Alfalfa Conference Proceedings, ARS 74-36, Nov. 17, 1965.

If the process proves to be commercially feasible, such separation will allow a processor to market several higher grades of dehy than have previously been avail- able (that is, over 22 percent protein). A feed formulator can, in turn, select the grade that is best suited for a given ration«
The value of a given feed ingredient, like dehy, is dependent on many factors. Some of these are (1) the composition of the ingredient, (2) specifications of the ration being considered, (3) availability, composition, and prices of other com- petitive ingredients, and (4) items such as contractual arrangements between buyers and sellers.
If all feed ingredients supplied only one positive factor and no detrinnental factors, feed formulation would be sim.ple. That ingredient supplying a specific requirement at the least cost per unit would always be selected in a ration* All competitive ingredients would be evaluated in relationship to it. An ingredient supplying nutrients, vitamins, and minerals in the exact proportions called for by a ration also would simplify feed formulation. Most feed ingredients, however, are rich in some essential nutrients and deficient in others. Dehy is not an exception.
The objective of feed fornciulation is to combine ingredients in such a manner that ration requirements are met at the lowest possible cost. Ingredients are competitors in meeting ration requirements, and because of their multifactor com- position this evaluation becomes complex. As an exanaple, dehy may, according to the current prices of each ingredient, compete with soybean meal as a source of tryptophan at one time and as a source of m.etabolizable energy at another. At the same time, it will be conapeting with other ingredients as a source of these and other required factors. It requires linear programm.ing and the capacity of a m.odern electronic computer to handle this complexity of possible substitutions.
METHOD OF STUDY
Linear Progranaming
Technically, the definition of linear program.naing is as follows: "A technique for obtaining a xinique value-weighted solution to a set of simultaneous linear equations in which the number of unknowns may exceed the number of equations and in which no variate has a negative value." Zj The purpose of this report is to show how linear programming can be used in feed blending to develop a series of solutions to the problem of how to supply, at least-cost, specified nutrients for meeting specified requirements from specified feeds of known compositions.
The least-cost linear progranaming matrix can be divided into three nnajor areas for discussion--ration requirements and restrictions, ingredient analysis, and objective function of ingredients. Ration requirenaents and restrictions set the standards a formulation must naeet. These may be put in the form of minimum, miaximum, or equality statements. For exam.ple, a given ration will have minimuna requirements for energy and protein, maxinaum limitations on fiber and added fat, and equality (exact) requirenaents for medicaments and premixes. Each ingredient considered must be completely analyzed in relation to the nutrients required to
3/ R. H. McAlexander, and R. F. Hutton, Linear Programming Techniques Applied to Agricultural Problems. A.E. &R. S. 18, Agr. Expt. Sta., Pa. State Univ., May 1959.
meet the ration requirements. To achieve optimum results, coefficients for both ration requirements and ingredient analysis of nutrient content and biological avail- ability must be as accurate as possible. The objective function is the factor that correlates the two sides of the problem (requirements and suppliers). It is that portion of the matrix that provides the weighting factor that enables all ration requirements to be met at the lowest possible cost. In least-cost formulation, the objective function is derived from ingredient prices. Pricing for the objective function can reflect nnany circumstances: it can be based on prices at a specific time and place, average prices over a period of years, or any other prices that reflect the logic of the problena under consideration.
While linear progranaming is an excellent analytical tool, it has linciitations. First, most relationships deviate from linearity. Ingredients tend to interact to some degree, sind the efficiency of livestock utilization of ingredients depends on feeding leveL In naost cases, however, an assumption of linearity is safer than an assumption of sonae other naathematical function. Second, one naust assign specific values to each coefficient. Since values vary significantly, especially for ingredient analysis and prices, assignments should be on the conservative side. Third, while linear programming will give the least-cost ration for a given set of assum.ptions, the indicated least-cost ration may not return as high a profit as would some other formulation« This may be true because ingredient availability, level of inventories, plant layout, and other factors associated with frequent formiilation changes were not properly taken into account in the assumptions. Most of these problems can be m.inimized by building proper restrictions into the matrix. As an example, if milo is in short supply, its use could be restricted to, say, 10 percent of a broiler ration«
In linear programnaing, as in other research methods, a final note of warning is appropriate: *'The answer obtained can never be more important than the problem., no matter how refined the tools of analysis used in reaching the answer. Moreover, the answer to a problem, can be no m.ore accurate than the measurements used in the analysis regardless of the technique used." 4/ In linear programming, matrix construction is the most important factor in reaching legitimate solutions. Logical and realistic coefficients are essential.
Once the matrix is constructed, the solution is reached by routine linear program- ming techniques. Linear progranonaing problenas can be solved by hand, with a desk calculator, or by electronic conaputer. The complexity of the problem dictates the method used. The complexity of naost feed formulation problems, however, requires the conaputer.
In order to solve a problem on a computer, three itenas are required: hardware, software, and data. The hardware consists of the actual conaputer conaponents; the software, of the progranas that instruct the conaputer in solving specific problenas. The data consist of infornaation that has been systenaatically recorded, and is needed to reach a problem solution. In linear progrananaing, the mathenaatical matrix is conaposed of data. Solving a conaputer problena is much like driving an autonaobile. The hardware is like the automobile itself, the driver is the software, and the fuel is the data. All three are necessary for successful operation«
4/ Ro Ho McAlexander and R. F. Hutton, Linear Progrananaing Techniques Applied to Agricultural Problems« A.E. & R.S. 18, Agr. Expt. Sta., Pa. State Univ., May 1959.

Parametric Linear Programming
Parametric linear programming is a further development of linear programming« It adds a degree of flexibility to an otherwise rigid structure. Its use enables one to parameterize (to analyze at different levels) at least one coefficient. The coef- ficient in this case may be either a ration requirement, an ingredient conaponent, or price. In least-cost feed analysis, price is usually chosen as the flexible item. The researcher chooses that ingredient he wants to study, and then lets price range through a broad spectrum to determine effects of change. The prices of competing ingredients remain fixed.
To parameterize an ingredient, the researcher must specify the price ranges and the increm.ents of increase or decrease in price the computer is to consider. These increments may be very small, oftentimes less than a cent a ton in feed cost« The computer will reach an optimum least-cost solution at the first price given. It then exanciimes the solution at each increment of price change to see if a new formulation would lower cost. At each point at which reformulation would result in cost reductions, the new least cost formulation is given in detail. As an example, if one is reducing the cost of the ingredient, each new solution will result in greater use of the ingredient at reduced ingredient price. By using this procedure, a series of points on a value plane can be determined that evaluate the ingredient at each level of use in the ration, relative to the com.petitive ingredients considered in the matrix.
Procedure
Dehy was tested as an ingredient in pioultry feed, using a mathematical matrix developed by the Monsanto Company and modified by the authors for the present work. Computer runs were made at the Monsanto Computer Center at St. Louis, Mo. 5/ The test matrix had over 50 ration specifications and considered up to 100 ingredients. Ration specifications for broiler starter, broiler finisher, and layer rations are shown in appendix table 1. The computers could easily have handled much larger matrices, but this matrix was large enough for present food formulation technology. Twenty-nine ingredients, other than dehy, were included in the matrix. At the time of the test, these feedstuffs were in sufficient supply for consideration in the Kansas City market. Appendix table 2 lists the ingredients used and their prices in December 1966.
Dehy samples of the seven levels of protein used in the tests were analyzed by scientists at the Western Regional Laboratory. The results are given in appendix table 3. The data were used without adjustment for biological availability of nutrients. Such data on dehy are sketchy and the relative differences between grades would probably not greatly affect the results. In each test made, the specific dehy to be tested was included in the matrix.
Economic analyses were made after nutritional parameters were determined. Price of dehy was allowed to vary from $1,000 per ton to $0.0, and the prices for all other ingredients were held constant.
5/ Use of the name of the Monsanto Company is for identification only and does not constitute special endorsenn.ent of the products of the company or discrimination against other products by the U.S. Department of Agriculture.
DEHY IN BROILER FINISHER RATION
Dehy 20
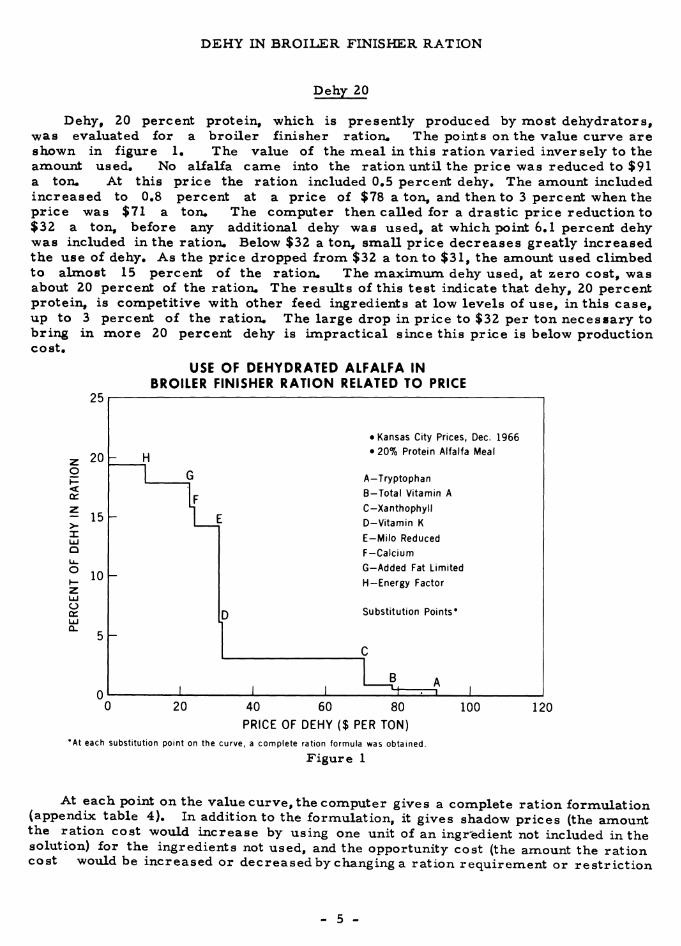
Dehy, 20 percent protein, which is presently produced by most dehydrators, ■was evaluated for a broiler finisher ration« The points on the value curve are shown in figure 1, The value of the meal in this ration varied inversely to the amount used. No alfalfa cancie into the ration until the price was reduced to $91 a ton« At this price the ration included 0.5 percent dehy. The amount included increased to 0.8 percent at a price of $78 a ton, and then to 3 percent when the price was $71 a ton. The computer then called for a drastic price reduction to $32 a ton, before any additional dehy was used, at which point 6.1 percent dehy was included in the ration« Below $32 a ton, small price decreases greatly increased the use of dehy. As the price dropped from. $32 a tonto $31, the anaount used climbed to almost 15 percent of the ration« The nciaximum dehy used, at zero cost, was about 20 percent of the ration« The results of this test indicate that dehy, 20 percent protein, is competitive with other feed ingredients at low levels of use, in this case, up to 3 percent of the ration« The large drop in price to $32 per ton necessary to bring in more 20 percent dehy is impractical since this price is below production cost.
USE OF DEHYDRATED ALFALFA IN BROILER FINISHER RATION RELATED TO PRICE
25
20 -
<
^ 15
O
o
o er
10 -
• Kansas City Prices, Dec. 1966 L, »20% Protein Alfalfa Meal
~ n
G A-Tryptophan
F
1 E
B-Total Vitamin A
- C-Xanthophyll D-Vitamin K E-Milo Reduced F-Caicium G-Added Fat Limited H-Energy Factor
Q Substitution Points*
C
B ^ 1 1 1 1 H r-? 1
0 20 40 60 80 PRICE OF DEHY ($ PER TON)
•At each substitution point on the curve, a connplete ration formula was obtained.
Figure 1
100 120
At each point on the valuecurve, the computer gives a complete ration formulation (appendix table 4). In addition to the formulation, it gives shadow prices (the amount the ration cost would increase by using one unit of an ingr'edient not included in the solution) for the ingredients not used, and the opportunity cost (the amount the ration cost would be increased or decreased by changing a ration requirement or restriction
- 5
one unit) of requirements in scarce supply. By examining fornaulations, shadow prices, and opportunity costs, the significance ofeachpoint can usually be determined. At point Aonthe curve infigure 1, the tryptophan in dehy was substituted for tryptophan from some other source. At point B, dehy vitamin A was substituted for synthetic vitanain A« At point C, the substitution was dehy xanthophyll for corn gluten meal xanthophyll« The xanthophyll point was the most significant. At this point 20 percent dehy was valued at $71 a ton and made up 3 percent of the ration. The greatest value of dehy in broiler finisher rations was in supplying xanthophyll, vitamin A, and tryptophan« These factors could change if other ingredients were considered or if prices varied.
Quality Comparisons
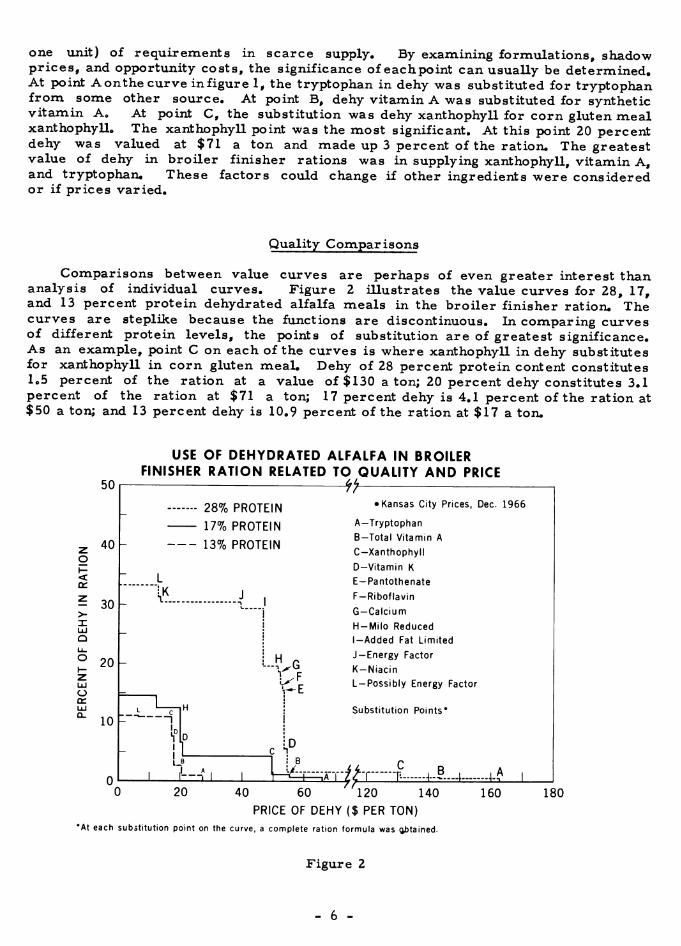
Comparisons between value curves are perhaps of even greater interest than analysis of individual curves. Figure 2 illustrates the value curves for 28, 17, and 13 percent protein dehydrated alfalfa meals in the broiler finisher ration. The curves are steplike because the functions are discontinuous. In conaparing curves of different protein levels, the points of substitution are of greatest significance. As an exanciple, point C on each of the curves is where xanthophyll in dehy substitutes for xanthophyll in corn gluten meaL Dehy of 28 percent protein content constitutes 1.5 percent of the ration at a value of $130 a ton; 20 percent dehy constitutes 3.1 percent of the ration at $71 a ton; 17 percent dehy is 4.1 percent of the ration at $50 a ton; and 13 percent dehy is 10.9 percent of the ration at $17 a ton.
50
40
<
- 30 >- X LÜ O
° 20
o
10
USE OF DEHYDRATED ALFALFA IN BROILER FINISHER RATION RELATED TO QUALITY AND PRICE
28% PROTEIN
17% PROTEIN
13% PROTEIN
L "LK
A rí
'■-? 1_
B
H |A I
-^^ • Kansas City Prices, Dec. 1966
A-Tryptophan
B-Total Vitamin A
C-Xanthophyll
D-Vitamin K
E-Pantothenate
F-Riboflavin
G-Calcium
H-Milo Reduced l-Added Fat Limited
J-Energy Factor
K —Niacin
L-Possibly Energy Factor
Substitution Points*
.^. c '111 d: B JA
0 20 40 60 "120 140
PRICE OF DEHY {$ PER TON) 'At each subätitution point on the curve, a complete ration formula was ftbtained.
160 180
Figure 2
6 -

With only minor exceptions, the total cost of the ration was identical no matter which protein level of dehy was used (appendix table 5), At point C, the xanthophyll substitution point, the cost of the ration for six of the seven protein levels of dehy was exactly $74.87« Also the cost of the dehy in the ration remained at approximately $2 regardless of the quality of dehy used. Thus a feed formulator could alternatively use 1.5 percent of the 28 percent naeal at a price of $130 a ton, 4.1 percent of the 17 percent meal at $50 a ton, or 10.9 percent of the 13 percent naeal at a price of $17 a ton*
Parametric linear programming can be used to determine the break-even point between prices and quantities used for different levels of dehy. A small anciount of a very high protein dehy at a high price is no nciore costly to the formulator than a large quantity of low protein dehy at a low price.
DEHY IN DIFFERENT RATIONS COMPARED
The value of dehy is dependent onthe ration being formulated. Since specifications change, the relationships between ingredients also differ. Figure 3 compares broiler finisher, broiler starter, and layer rations for 15 percent dehy. Any other quality dehy would have been as effective in demonstrating the principle, but dehy 15 allows a scale with reasonable limits. (Dehy 28, for example, would have entered the layer ration at $321 per ton and constituted less than 0.7 percent of the ration.)
USE OF DEHYDRATED ALFALFA IN POULTRY RATIONS RELATED TO PRICE
<
>- X ÜJ O
o er,
25
20
15
10
— t
• Kansas City Prices, Dec. 1966 •15% Protein Alfalfa Meal
Layer Ration
Broiler Starter Ration
Broiler Finisher Ration
T—^r- 10 20 30 40 50
PRICE OF DEHY ($ PER TON)
Figure 3
60 80
Alfalfa meal had the highest value in the layer ration at almost all comparative points of substitut ion* In the layer ration, dehy came into the formula at $72 per ton as 2,3 percent of the ration. For the broiler finisher ration, the coniparable figures

were $50 and 0,75 percent^ and for the broiler starter ration, $47 and 1,0 percent. At the xanthophyll point of substitution, dehy at $65 per ton made up 5.6 percent of the formula in the layer ration. The com.parable figures for the broiler finisher ration were $33 and 6.4 percent, and for the broiler starter ration, $41 and 3.2 percent.
The energy factor was not as restricting in the broiler starter and layer rations as in the broiler finisher ration. At zero cost for dehy, the layer ration included 22 percent dehy, the broiler starter, 21.5 percent, but the broiler finisher only 13.5 percent. The layer and broiler starter rations each required 2,970 calories of metabolizable enery per kilo of feed, while the broiler finisher ration required 3,200. With a 10 percent lim.it on the amount of added fat (a nutritional parameter) that could be in the ration, energy becanae a critical factor in formulation.
With the ration requirements, ingredient analyses, and price combinations specified, dehy showed the greatest intrinsic value when used in layer rations. A change in any of these factors could change the solution to some degree, but it is reasonable to assume that the layer ration will continue to be the ration of choice for dehy.
EVALUATION OF VARIOUS COMPONENTS OF DEHY
Xanthophyll
Xanthophyll is the mixture of pignaenting substances found in dehy, corn gluten meal, corn, and other ingredients. Feed blenders require it inmost poultry rations to give eggs and carcasses their characteristic yellow coloring. In previous sections it was pointed out that xanthophyll content was very important in evaluating dehy. To further examine this factor, dehy 20 was analyzed in a broiler finisher ration«
Three computer runs were made. In the first run, no xanthophyll was required in the ration; in the second run, the requirement was set at 12 nnilligrams of xan- thophyll per kilogram of ration, and in the third run, the requirement was increased to 30 nailligrams (fig. 4). These represented low, m.edium., and high ranges of actual commercial requirements for xanthophyll. In the case of no xanthophyll requirement, it was necessary to lower the price of dehy to $40 a ton before it canae into the ration. At this price, the ration would contain 1 percent dehy. In the second situation (12 milligrams per kilogram), dehy entered the ration at $91 a ton and made up 0.5 percent of the formula. In the third situation (30 milligrams per kilogram), dehy entered the ration at $147 a ton, at which price it made up 0.25 percent of the formula.
In the formula requiring 12 miligrams of xanthophyll per kilograna, the ration would include 3 percent dehy and could cost up to $71 per ton. The ration requiring 30 nailligrams of xanthophyll per kilogram would include 9.3 percent dehy at a price of $70 per ton. The price of dehy at the xanthophyll point of substitution was approximately the same in both rations, but the amount used varied with the amount of xanthophyll required. This resulted because the xanthophyll of dehy was substituting for the xanthophyll of high protein corn gluten meaL As dehy became cheaper than high protein corn gluten meal in supplying xanthophyll, sub- stitution could occur as long as there was high protein corn gluten meal in the solution to be replaced.

USE OF DEHYDRATED ALFALFA IN BROILER FINISHER RATION RELATED TO XANTHAPHYLL REQUIREMENT AND PRICE 25
20
< oc
? 15
LiJ O
10
o er.
^
• Kansas City Prices, Dec. 1966 • 20% Protein Alfalfa Meal
Xanthophyll Requirement = 30McGm/kg
Xanthophyll Requirement = 12McGm/kg
No Xanthophyll Requirement
,
s. ,
I U •1-, 30 60 90
PRICE OF DEHY($ PER. TON)
Figure 4
120 150
It is obvious that xanthophyll is one of the most valuable components in dehy. In a ration where xanthophyll is not required, and the nutrients in dehy must compete with nutrients from other feed ingredients, dehy has little competitive advantage. With no xanthophyll requirement, dehy would enter the broiler finisher ration at approximiately $40 a ton to meet the vitamin A requirement. At this price, dehy would make up only 1 percent of the ration. It would be necessary for the price to drop to $32 a ton before a larger amount would enter the ration.
The price of other ingredients containing xanthophyll greatly affects the value of dehy. If the price of high protein corn gluten meal shoiild drop drastically, or if a cheap substitute for xanthophyll were found, dehy would be considerably devaluated at the xanthophyll point of substitution« In contrast, if methods could be devised to increase the amount of xanthophyll in dehy, its value would be increased. At present production costs, xanthophyll is without question the decisive factor in making dehy competitive with other ingredients in poultry rations.
Vitanfiin A
The value of carotene (vitamin A) in dehy has been recognized for nciany years. Alfalfa dehydrators provide guarantees to feed blenders on vitam.in A content. Use of either or both controlled atmospheric storage and ethoxyquin (a chemical anti- oxidation agent) at dehydrator plants prevents loss of carotene by oxidation.
The m.ajor conapetitor of dehy for providing vitamin A in a ration is synthetic vitamin A, which has the advantage of increased uniformity and stability. Due to the stability factor, some feed blenders specify that a certain portion of total vitamin A requirement must be met by a synthetic source. In the original matrix, 50 percent of total vitanain A requirement was supplied by synthetic vitamin A.
- 9
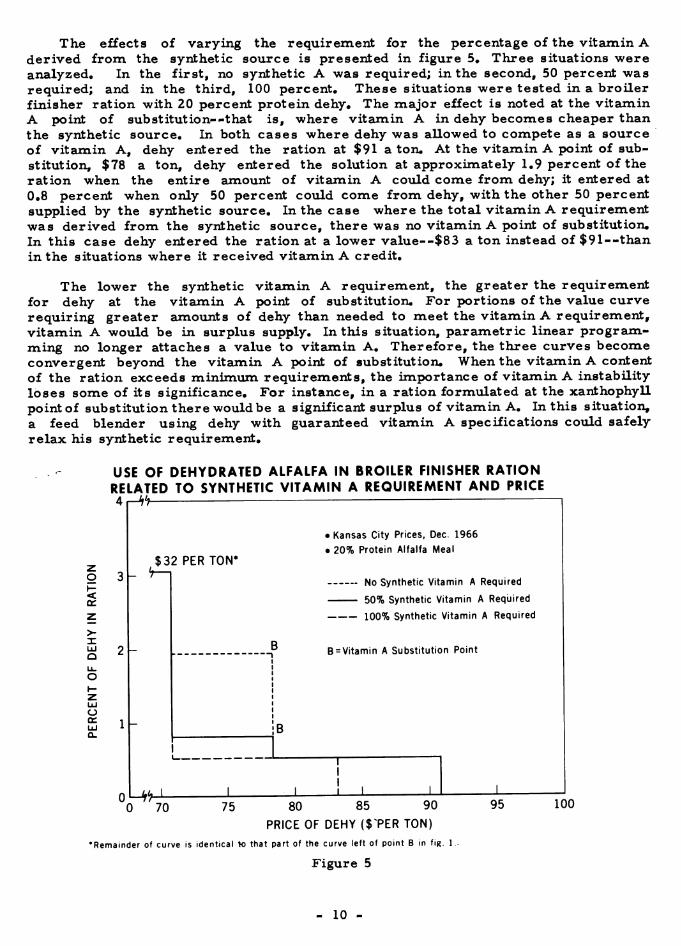
The effects of varying the requirement for the percentage of the vitamin A derived from the synthetic source is presented in figure S. Three situations were analyzed« In the first, no synthetic A was required; in the second, 50 percent was required; and in the third, 100 percent* These situations were tested in a broiler finisher ration with 20 percent protein dehy« The major effect is noted at the vitamin A point of substitut ion--that is, where vitannin A in dehy becomes cheaper than the synthetic source. In both cases where dehy was allowed to conapete as a source of vitamin A, dehy entered the ration at $91 a ton* At the vit ana in A point of sub- stitution, $78 a ton, dehy entered the solution at approximately 1.9 percent of the ration when the entire anaount of vitamin A could come from dehy; it entered at 0«8 percent when only 50 percent could come from, dehy, with the other 50 percent supplied by the synthetic source. In the case where the total vit am. in A requirement was derived from the synthetic source, there was no vitamin A point of substitution« In this case dehy entered the ration at a lower value--$83 a ton instead of $91--than in the situations where it received vitamin A credit.
The lower the synthetic vitanain A requirement, the greater the requirenaent for dehy at the vitamin A point of substitution. For portions of the value curve requiring greater amounts of dehy than needed to meet the vitamin A requirement, vitanain A would be in surplus supply. In this situation, paranaetric linear prograna- naing no longer attaches a value to vitamin A. Therefore, the three curves become convergent beyond the vitamin A point of substitution. When the vitamin A content of the ration exceeds minimum, requirements, the importance of vitanain A instability loses sonae of its significance. For instance, in a ration fornaulated at the xanthophyll point of substitution there would be a significant surplus of vitanain A. In this situation, a feed blender using dehy with guaranteed vitamin A specifications could safely relax his synthetic requirenaent.
USE OF DEHYDRATED ALFALFA IN BROILER FINISHER RATION RELATED TO SYNTHETIC VITAMIN A REQUIREMENT AND PRICE Ar^h—
<
>- X LÜ O Li. O
o er
$32 PER TON*
• Kansas City Prices, Dec. 1966
• 20% Protein Alfalfa Meal
No Synthetic Vitamin A Required
50% Synthetic Vitamin A Required
100% Synthetic Vitamin A Required
B = Vitamin A Substitution Point
-^^ 70 75 80 85 90 95 100
PRICE OF DEHY ($TER TON)
•Remainder of curve is identical to that part of the curve left of point B in fig. 1.
Figure 5
10

Tryptophan
Tryptophan (one of the essential amino acids) was the first factor for which dehy was brought into the ration. To meet this requirement in the broiler finisher ration, using 20 percent protein naaterial, dehy came in at 0,5 percent of the ration at a price of $91 a ton. At higher levels of dehy usage surplus tryptophan would exist in the ration, resulting in its being considered a free factor.
To further test the tryptophan effect, dehy 20 was tested in the broiler finisher ration at three arbitrarily chosen tryptophan levels. In the original nriatrix, dehy is rated as being 0.488 percent tryptophan. In the test, dehy with assigned levels of 0.4, 0.5, and 0.6 percent tryptophan was used. The results of these tests are shown in figure 6.
DEHYDRATED ALFALFA IN BROILER FINISHER RATION RELATED TO TRYPTOPHAN CONTENT AND PRICE
4
<
X
Q
O
o er
2 -
1 -
-^/
«Kansas City Prices, Dec. 1966
, $32 PER TON' • 20% Protein Alfalfa Meal
Tryptophan Content .4% T *^«l ^^«*^-* C«
1 1 jr)jLU|jiiaii v^uii cm .^ to
Tryptophan Content .6%
A = Tryptophan Substitution Point
A ^ f A 1 1
-J,'^±- \
1
1 1 0 70 75 80 85 90 95 100
PRICE OF DEHY ($ PER TON)
•Remainder of curve is identical to that part of the curve left of point A in fig. 1.
Figure 6.
The tryptophan effect is manifest at the entry portion of the curve. This is where dehy usage is low but value high. The higher the concentration of tryptophan, the lower the amount of dehy required to meet the tryptophan requirement, and the greater the value attributed to dehy. At 0.4 percent tryptophan, the point of sub- stitution was 0.65 percent dehy in the ration at a price of $88 a ton. For dehy with 0.5 percent tryptophan the point of substitution was 0.51 percent dehy at $92 a ton, and for dehy with 0.6 percent tryptophan it was 0.42 percent dehy at $94 a ton. While these figures are very impressive at the tryptophan point of substitution, they, of course, have no significance throughout the rest of the value curve. In a ration fornaulated at the xanthophyll point of substitution, as an exam.ple, the solution would rem.ain constant with dehy making up 3 percent of the ration at a price of $71 a ton regardless of dehy's tryptophan content. The tryptophan effect is isolated to its point of substitution.
11

Tryptophan is one of the components of feed stuffs "which is difficult to measure accurately« Hence, further research will be valuable in determining its true significance«
Metabolizable Energy
The broiler finisher ration specified 3,200 calories of metabolizable energy per kilo of feed« Dehy, 20 percent protein, supplies 1,351 calories of metabolizable energy per kiloo In the formiulations, this energy deficit was offset by high energy feedstuffs, princiarily fat.
Recent research has indicated that the nnetabolizable energy in dehy can be increased through various mechanical and chemical treatments, 6^/ Tests were conducted to determine the intrinsic values of dehy with varying metabolizable energy contents. The energy factor was tested at three points of substitution on the dehy 20 value curve. The tryptophan, xanthophy 11, and vitam.in K points were chosen (fig, 7), Metabolizable energy was tested at seven levels, 1,100, 1,300, 1,500, 1,700, 1,900, 2,100, and 2,300 calories per kilo (fig, 7), At the tryptophan point of substitution (0,5 percent dehy in the ration), the value of dehy ranged frona $85 a ton at 1,100 calories per kilo to $112 a ton at 2,300 calories per kilo. At the xanthophyll point of substitution (3 percent dehy in the ration), the price for dehy ranged from $65 a ton to $92 a ton, and at the vitannin K point of substitution (6 percent dehy in the ration), the price ranged from $26 to $52, These increases were at the rate of $2,20 per tonof dehy for each 100 calorie increase of metabolizable energy per kilo. On a weight basis this n:ieans that for each 100 calorie increase of metabolizable energy per pound the value of dehy would increase $4 a ton. This effect would hold true throughout the entire value curve for dehy.
It is easily seen that any procedure increasing the metabolizable energy content of dehy would increase its value significantly. Whether such procedures would be profitable depends on both cost and return factors. Economic analysis on energy increasing procedures would be highly useful as the procedures are developed. At this point in the analysis, however, it seem.s that physical research on increasing energy content would be feasible and desirable.
Lysine
Research work has indicated that the content of lysine (one of the essential amino acids) in dehydrated alfalfa varies with conditions, Dehy is somewhat deficient in lysine since the broiler finisher ration requirements specified 1,03 percent lysine whereas dehy 20 contained 0,884 percent. This deficiency was compensated for by other ingredients which increased the cost of the ration.
In parametric linear programming, the lysine effect was similar to the energy effect. Increasing the lysine content of dehy increased its value at each substitution point. In the tests, lysine content was increased 40 percent, from 0.884 percent of dehy to 1,238. The effects at three points of substitution, tryptophan (0.5 percent dehy in the ration), xanthophyll (3,0 percent dehy in the ration), and vitamin K (6,0 percent dehy in the ration), are presented in figure 8, At the tryptophan point of substitution, the value of dehy increased frona $91 a ton to $93, at the xanthophyll point of substitution the increase was from $71 to $73, and at che vitamin K point of substitution, it was from $32 to $34, At all points of substitution, a 40 percent increase in lysine content increased the value of dehy $2 a ton.
6^/ Anon. Pelleting*s Effects on Energy Values, Ingredient Use Outlined, Feedstuffs 38 (15): 9, Apr, 16, 1966,
12

120|-^í^
100 -
ECONOMIC VALUE OF INCREASING ENERGY LEVEL IN DEHYDRATED ALFALFA
o tt 80
> 60
o u. O ÜJ o ce o.
40
20
DEHY = .5% OF RATION
DEHY=3% OF RATION
^h-
DEHY=6%0F RATION
• Kansas City Prices, Dec. 1966 • Broiler Finisher Ration • 20% Protein Alfalfa Meal
(Approximate Rate of Increase = $2.20 Per 100 Calories)
I 1 I I 0 1,100 1,300 1,500 1,700 1,900 2,100
ENERGY LEVEL (CALORIES PER KILO)
Figure 7
ECONOMIC VALUE OF INCREASING LYSINE LEVEL IN DEHYDRATED ALFALFA
2,300
100 H'i'
80 z o
ce LlJ
Û- 60
X
40
er Q.
20
DEHY=.5%0F RATION
DEHY = 3%0F RATION
• Kansas City Prices,Dec. 1966 • Broiler Finisher Ration • 20% Protein Alfalfa Meal
DEHY = 6%0F RATION
oH'H- 0 0.8
(Approximate Rate of lncrease= $.64 Per Eacti 1/10 of 1 Percent)
I \ \ I 0.9 1.0 1.1 1.2 LYSINE CONTENT OF DEHY (PERCENT)
Figure 8
1.3
13

This increase seems rather small compared with the increase of $10.40 per ton resulting from a 40 percent increase in energy content. Whether procedures designed to increase lysine content would be profitable would depend on their cost« It appears, however, that research directed toward increasing energy content of dehy has a larger potential return than research directed toward increasing lysine contento
PARAMETRIC LINEAR PROGRAMMING AS AN
EVALUATOR OF RESEARCH
Parametric linear programming can serve as a useful tool in evaluating alternative research proposals. In this study, the econonaic significance of altering ration requirements for xanthophyll and vitamin A and of changing the dehy analysis for tryptophan, metabolizable energy, and lysine was analyzed. Physical scientists in the Western Division, at Albany, Calif., are presently evaluating these results as a guide to their research on dehy.
This same technique can be used in evaluating other feed ingredients and in directing the research efforts of scientists interested in improving their value in mixed feeds.
APPENDIX
Table abbreviations, in order of their appearance, are as follows:
Cal/kg =« Kilogram calories per kilogram. ^g/kg *" Milligrams per kilogram MlU/kg = Thousand international units per kilogram McGm/kg = Micrograms per kilogram MICU/kg " Thousands of international chick units per kilogram MM = Million lU/kg = International units per kilogrann ICU/kg = International chick units per kilogram Gm./kg = Grams per kilogram
14
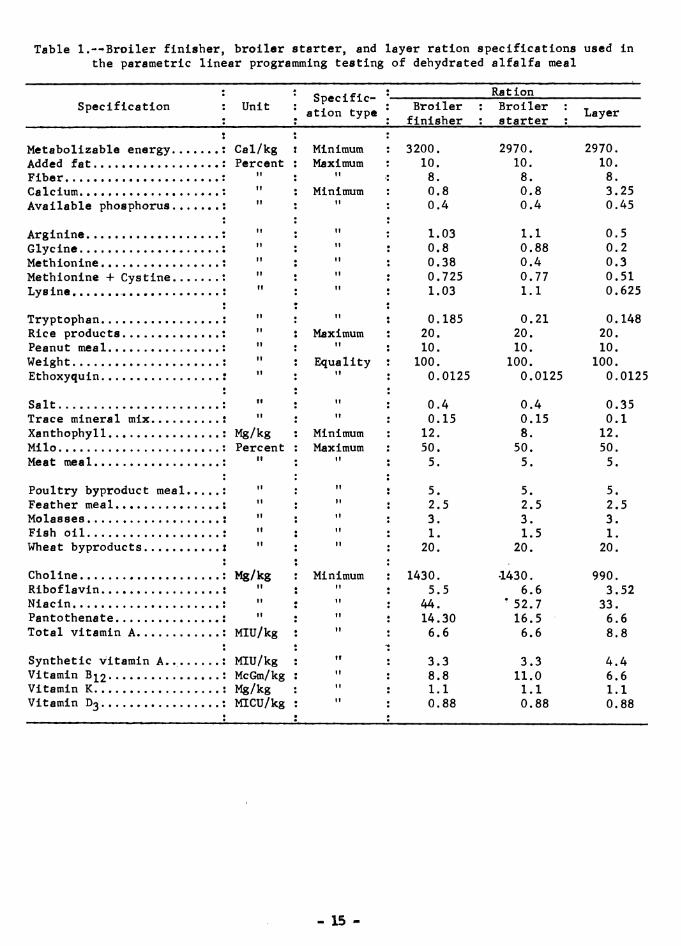
Table 1.--Broiler finisher, broiler starter, and layer ration specifications used in the parametric linear programming testing of dehydrated alfalfa meal
Specification Unit Specific-
ation type
Ration Broiler finisher
Broiler starter
Layer
Metabolizable energy. Added fat Fiber Calcium Available phosphorus.
Cal/kg I Minimum Percent
Arginine Glycine Methionine Methionine + Cystine. Lysine
Tryptophan..., Rice products. Peanut meal... Weight Ethoxyquin....
Salt Trace mineral mix. Xanthophyll Milo Meat meal
Mg/kg Percent
Poultry byproduct meal : " Feather meal : " Molasses : " Fish oil : " Wheat byproducts : "
Choline : Mg/kg Riboflavin : " Niacin : Pantothenate : " Total vitamin A : MlU/kg
Synthetic vitamin A... : MlU/kg Vitamin B]^2 • McGm/kg Vitamin K : Mg/kg Vitamin D3 : MICU/kg
Maximum n
Minimum
Maximum II
Equality
Minimum Maximum
Minimum
3200. 10. 8. 0.8 O.A
1.03 0.8 0.38 0.725 1.03
0.185 20. 10.
100. 0.0125
0.4 0.15
12. 50. 5.
5. 2.5 3. 1.
20.
1430. 5.5
44. 14.30 6.6
3.3 8.8 1.1 0.88
2970. 10. 8. 0.8 0.4
1.1 0.88 0.4 0.77 1.1
0.21 20. 10.
100. 0.0125
0.4 0.15 8.
50. 5.
5. 2.5 3. 1.5
20.
•1430. 6.6
• 52.7 16.5 6.6
3.3 11.0 1.1 0.88
2970. 10. 8. 3.25 0.45
0.5 0.2 0.3 0.51 0.625
0.148 20. 10.
100. 0.0125
0.35 0.1
12. 50. 5.
5. 2.5 3. 1.
20.
990. 3.52
33. 6.6 8.8
4.4 6.6 1.1 0.88
15 -

Table 2.—Prices of feed Ingredients, J./ Kansas City Market, December 1966
Ingredient Price per kilo * Price per ton I
Milo : Corn : Oats r Barley meal : Wheat shorts :
Soybean meal (447o protein) : Soybean meal (50% protein) : Corn gluten meal (low protein) : Corn gluten meal (60% protein) r Dried whey r
Fishmeal, sardine (65% protein) r Meat and bone scraps (50% protein) : Feather meal (85% protein) : Poultry byproduct meal (557o protein) : Fat, vegetable :
Calcium carbonate : Dicalcium phosphate (18.5% available : phosphorus ) :
Choline chloride (70% choline) : Salt : Trace minerals :
Ethoxyquin. : MHA (methionine hydroxy analogue) : Vitamin A (325 MM lU/kg) : Vitamin D3 (400 MM ICU/kg) : Vitamin K (282 gm/kg) :
Vitamin B^2 (^ mg/kg) î Niacin (10%) ' : Riboflavin (10%) : Pantothenic acid (80.3%) 2/ :
Dollars Dollars
.0495 45.00 ,0594 54.00 .0561 51.00 .0605 55.00 .0517 47.00
.1078 98.00
.1248 113.45
.1111 101.00
.1753 159,36
.1111 101.00
.1892 172.00
.1287 117.00
.1210 110.00
.1265 115.00
.1672 152.00
.0088 8.00
.1056 96.00
.297 270.00
.0220 20.00
.341 310.00
2.46 2236.36 2.04 1854.54 9.24 8400.00 7.24 6581.81
14.20 12909.00
.264 240.00
.225 204.55 2.70 2454.25 1.44 1309.09
\/ Prices were quoted by the Monsanto Company as being available to large feed formulators in December 1966,
2/ In the form of calcium pantothenate.
16

Table 3. — Nutrient, vitamin, and mineral analysis of dehydrated alfalfa meals of differing protein content
Item Unit
Metabolizable energy : Cal/kg Net energy : " Fat (ether extract) : Percent Fiber : Calcium :
Phosphorus : " Arglnine : " Glycine : " Methionlne : " Methionlne + Cystlne : "
Lysine : " Tryptophan : " Leucine : " Isoleucine : " Phenylalanine : "
Phenylalanine + Tryosine : " Threonine : " Valine : " Histldine : " Xanthophyll : Mg/kg
Vitamin A (carotene) : MlU/kg Vitamin K : Mg/kg Choline : " Riboflavin : Nlacin : "
Pantothenic acid : " Tocopherol : "
13% 15% Dehy vith protein content of— 17% 20% 22% 25% 28%
788. 942. 938. 1092.
2. 2.5 28.9 26.1
1.15 1.22
0.2 0.22 0.473 0.584 0.595 0.710 0.187 0.222 0.326 0.384
0.A86 0.594 0.317 0.366 0.874 1.045 0.551 0.669 0.564 0.684
0.923 1.110 0.471 0.579 0.702 0.831 0.247 0.291
110. 165.
100. 159. 14. 16.
500. 1540. 10. 11. 38. 42.
15. 21. 90. 110.
1100. 1351. 1509. 1250. 1501. 1659.
3.0 3.6 4.0 24.1 21.1 18.9 1.28 1.3 1.3
0.24 0.27 0.28 0.700 0.884 0.999 0.826 1.008 1.133 0.262 0.324 0.365 0.442 0.536 0.598
0.707 0.884 0.999 0.415 0.488 0.537 1.231 1.524 1.729 0,791 0.984 1.111 0.813 1.020 1.170
1.309 1.626 1.848 0.694 0.872 0.990 0.962 1.172 1.320 0.337 0.406 0.453
240. 310. 375.
220. 309. 368. 17. 18. 18.
1560. 1620. 1710. 12. 15. 17. 46. 55. 59.
27. 33. 40. 120. 140. 160.
1694. 1844.
4.7 16.9 1.3
0.31 1.165 1.303 0.433 0.690
1.135 0.610 2.045 1.270 1.400
2.185 1.135 1.540 0.530
485.
459. 19.
1780. 21. 62.
46. 180.
1804. 1954.
5.3 12.9 3.4
0.33 1.327 1.459 0.498 0.781
1.249 0.683 2.349 1.400 1.624
2.509 1.240 1.764 0.608
570.
548. 20.
1840. 24. 67.
48. 200.
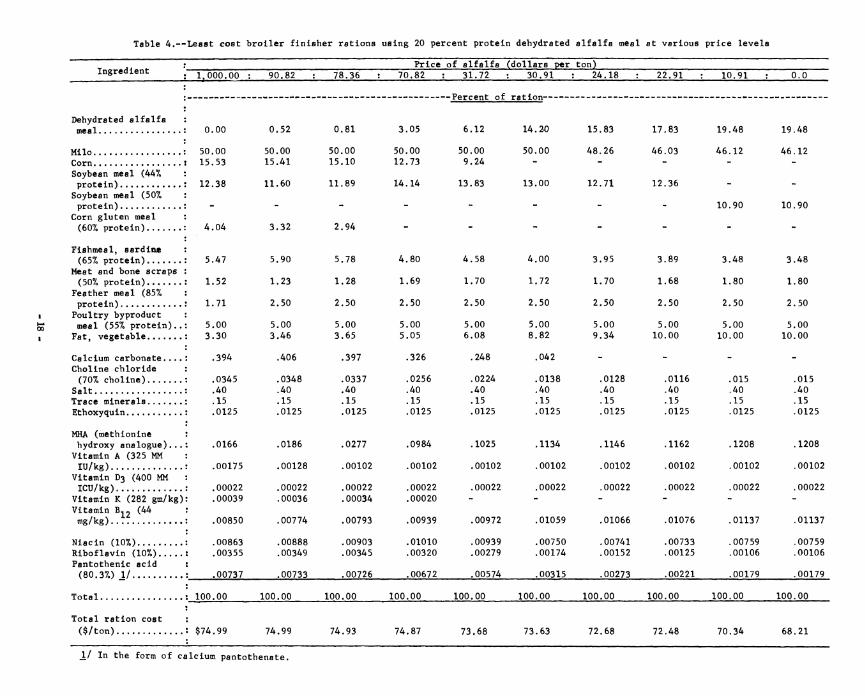
Table 4.—Least cost broiler finisher rations using 20 percent protein dehydrated alfalfa meal at various price levels
Ingredient Price of alfalfa (dollars per ton)
1^000.00 : 90.82 : 78.36 Î 70.82 31.72 : 30.91 24.18 : 22.91 : 10.91 : 0.0
Dehydrated alfalfa
meal 0.00
50.00
t 15.53
0.52
50.00
15.41
0.81
50.00
15.10
3.05
50.00
12.73
6.12
50.00
9.24
14.20
50.00
15.83
48.26
17.83
46.03
19.48
46.12
19.48
Milo 46.12
Corn
Soybean meal (44%
protein) • 12.38 11.60 11.89 14.14 13.83 13.00 12.71 12.36 - - Soybean meal (507o
protein) - - - - - - - - 10.90 10.90
Corn gluten meal
(60% protein) 4.04 3.32 2.94 - - - - - - -
Fishmeal, sardine
(657o protein) : 5.47 5.90 5.78 4.80 4.58 4.00 3.95 3.89 3.48 3.48
Meat and bone scraps
(50% protein) : 1.52 1.23 1.28 1.69 1.70 1.72 1.70 1.68 1.80 1.80
Feather meal (85%
protein) : 1.71 2.50 2.50 2.50 2.50 2.50 2.50 2.50 2.50 2.50
Poultry byproduct
meal (55% protein).. : 5.00 5.00 5.00 5.00 5.00 5.00 5.00 5.00 5.00 5.00
Fat, vegetable : 3.30 3.46 3.65 5.05 6.08 8.82 9.34 10.00 10.00 10.00
Calcium carbonate.... : .394 .406 .397 .326 .248 .042 _ _ _ - Choline chloride
(70% choline) : .0345 .0348 .0337 .0256 .0224 .0138 .0128 .0116 .015 .015
Salt .40
: .15
.40
.15
.40
.15
.40
.15
.40
.15
.40
.15
.40
.15
.40
.15
.40
.15
.40 Trace minerals .15 Ethoxyquin : .0125 .0125 .0125 .0125 .0125 .0125 .0125 .0125 .0125 .0125
MHA (methionine
hydroxy analogue)... .0166 .0186 .0277 .0984 .1025 .1134 .1146 .1162 .1208 .1208
Vitamin A (325 MM
lU/kg) : .00175 .00128 .00102 .00102 .00102 .00102 .00102 .00102 .00102 .00102
Vitamin D3 (400 MM
ICU/kg) : .00022 .00022 .00022 .00022 .00022 .00022 .00022 .00022 .00022 .00022
Vitamin K (282 gm/kg) : .00039 .00036 .00034 .00020 - - - - - - Vitamin B^2 <^ mg/kg) : .00850 .00774 .00793 .00939 .00972 .01059 .01066 .01076 .01137 .01137
Niacin i'10%') ... .00863
: .00355
.00888
.00349
.00903
.00345
.01010
.00320
.00939
.00279
.00750
.00174
.00741
.00152 .00733
.00125
.00759
.00106
.00759
Riboflavin (10%) .00106
Pantothenic acid : (80.3%) 1/ : .00737 .00733 .00726 .00672 .00574 .00315 .00273 .00221 .00179 .00179
Total i 100.00 100.00 100.00 100.00 100.00 100.00 100.00 100.00 100.00 100.00
Total ration cost
i'S/ton'i : $74.99 74.99 74.93 74.87 73.68 73.63 72.68 72.48 70.34 68 21
\/ In the form of calcium pantothenate.

Table 5.~CoinparlsoiiB of dehydrated alfalfa product» at the xanthophyll point of substitution
Protein level of product
Intrinsic value of dehy
Dehy in ration
Cost of dehy per ton of ration
Total cost of ration
Percent Dollars/ton Percent Dollars Do liars/ton
13 1/ 17.27 10.90 1.88 74.82
15 32,55 6.38 2.08 74.87
17 A9.91 4.09 2.04 74.87 20 70.82 3.05 2.16 74.87 22 86.91 2.47 2.15 74.87
25 111.18 1.88 2.09 74.87 28 130.09 1.58 2.06 74.87
1/ 13 percent protein dehydrated alfalfa did not correspond to the same pattern as the other fractions. This was probably due to the Influence of factors other than
xanthophyll.
19

UNITED STATES DEPARTMENT OF AGRICULTURE Washington, D.C. 20250
POSTAGE AND FEES PAID DEPARTMENT OF AGRICULTURE
OFFICIAL BUSINESS
C^OPS PR0TF.C1I0N RESEARCH BRANCH
Rec FEB 1 1958
Answered
0- UJS. 00VEHÍMENT PRINnN G OFFICES I968 301-755 (ffiS-128)