alexander robertson - spanglefishs3.spanglefish.com/s/3643/documents/wind reader (english)/2... ·...
TRANSCRIPT

Alexander Robertson
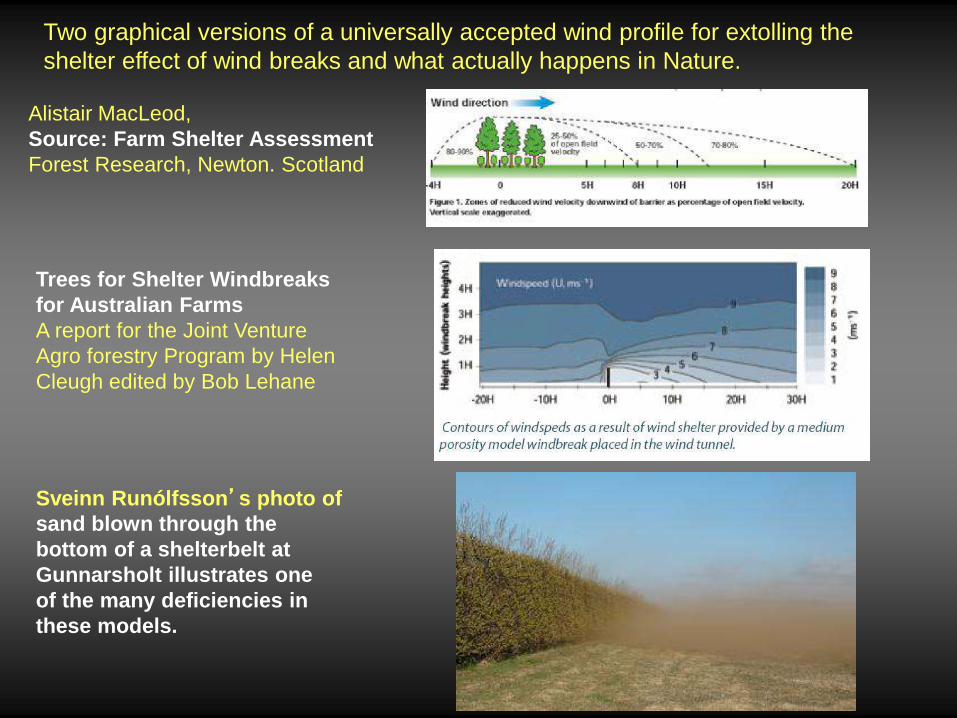
Two graphical versions of a universally accepted wind profile for extolling the
shelter effect of wind breaks and what actually happens in Nature.
Alistair MacLeod,
Source: Farm Shelter Assessment
Forest Research, Newton. Scotland
Trees for Shelter Windbreaks
for Australian Farms
A report for the Joint Venture
Agro forestry Program by Helen
Cleugh edited by Bob Lehane
Sveinn Runólfsson’s photo of
sand blown through the
bottom of a shelterbelt at
Gunnarsholt illustrates one
of the many deficiencies in
these models.
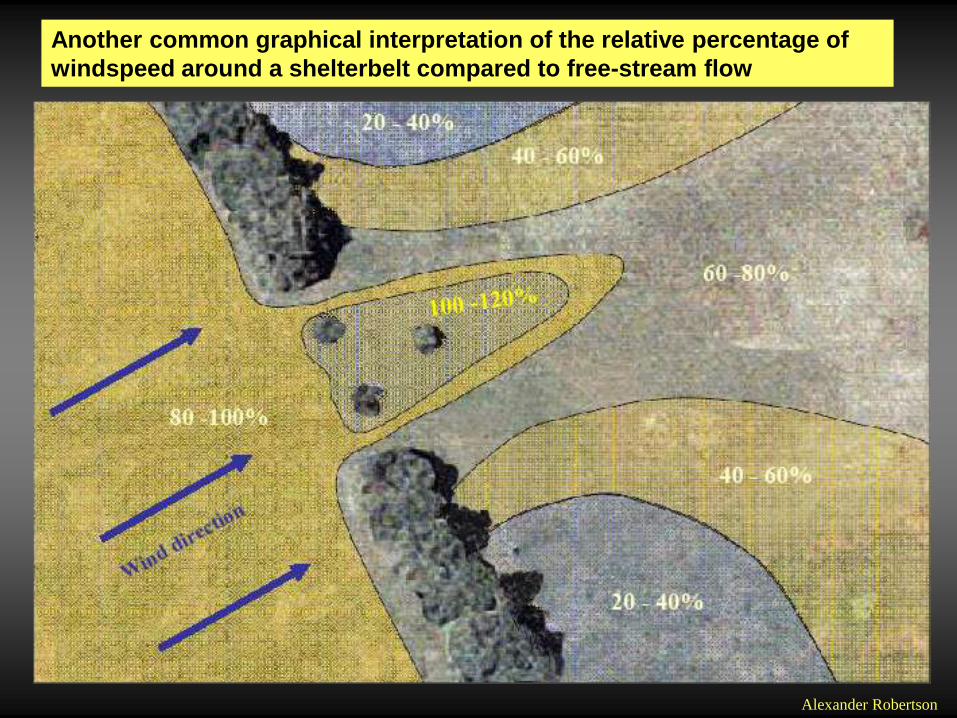
Another common graphical interpretation of the relative percentage of
windspeed around a shelterbelt compared to free-stream flow
Alexander Robertson

The age-old cycle of pollarding shelterbelts in Oxfordshire to keep them healthy
while providing an endless source of fuel wood and small timbers.
Alexander Robertson

The effectiveness of particular styles of shelterbelts is commonly rated in terms of porosity, area of
windnspeed reduction compared to the reduction of ‘free-stream’ wind speed. In fact, poplar
clones have been bred for porosity (centre). The idea is that porous clones filters the wind and
dampen gustiness and to avoid flattening cereal crops as dense shelterbelts tend to do. While the
theory is sound enough, in practice, it does not apply when there are biotic and abiotic influences
which tend to interfere with the desire for a perfect shelterbelt geometry, such as :
Alexander Robertson
- erratic wind directions;
- leaf fall, competition, and structural
- changes due to ageing;
- browsing by animals and insects;
- catastrophic weather events such as ice
- snow loading, very strong winds.
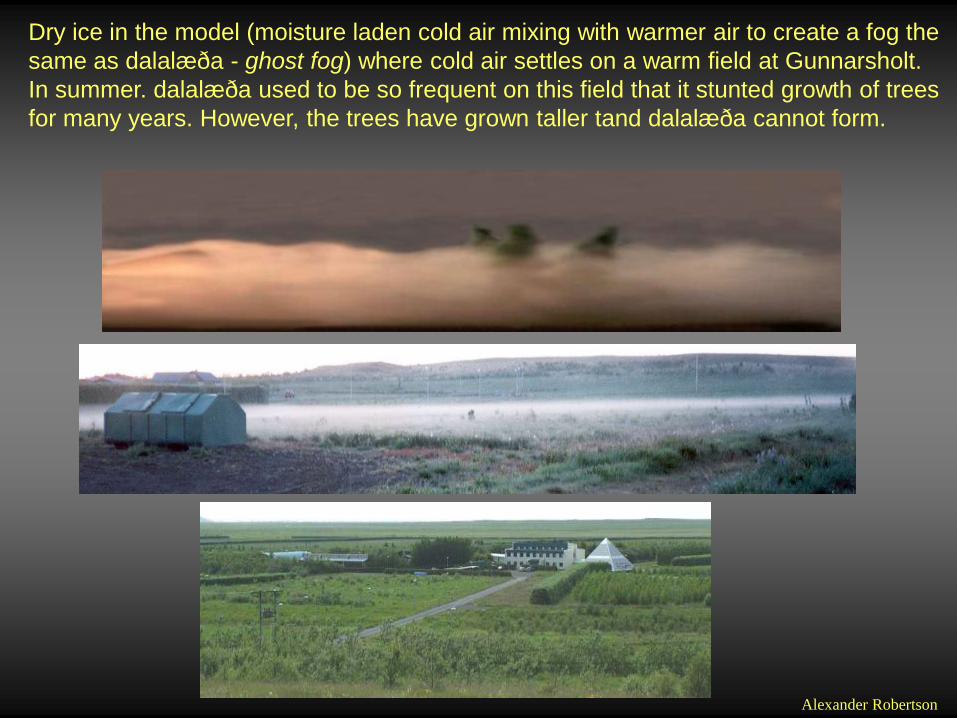
Dry ice in the model (moisture laden cold air mixing with warmer air to create a fog the
same as dalalæða - ghost fog) where cold air settles on a warm field at Gunnarsholt.
In summer. dalalæða used to be so frequent on this field that it stunted growth of trees
for many years. However, the trees have grown taller tand dalalæða cannot form.
Alexander Robertson
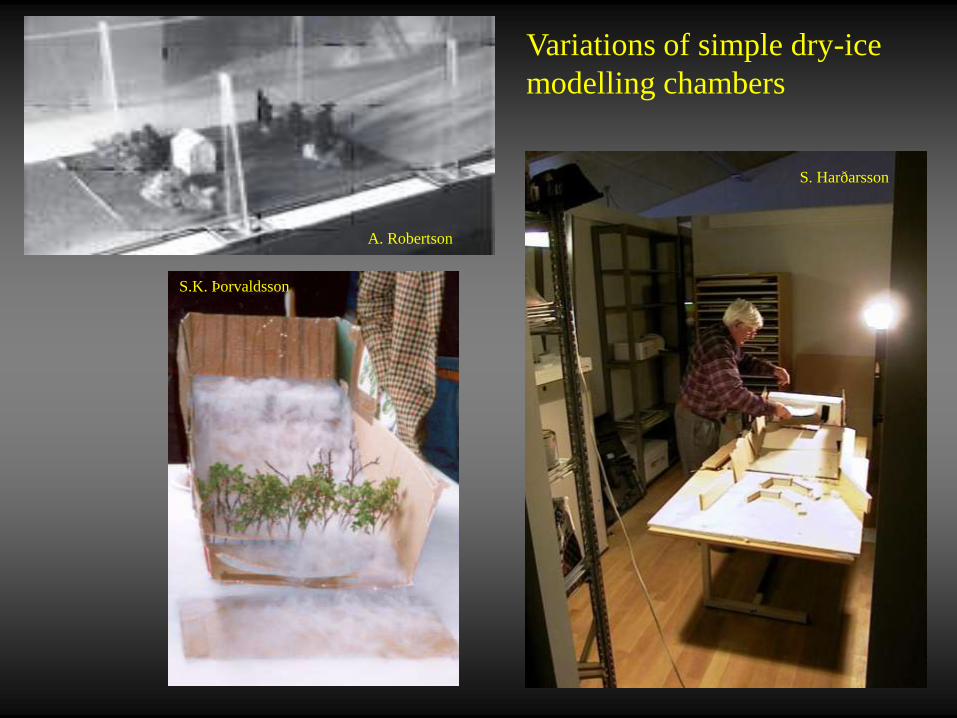
Variations of simple dry-ice
modelling chambers
A. Robertson
S. Harðarsson
S.K. Þorvaldsson
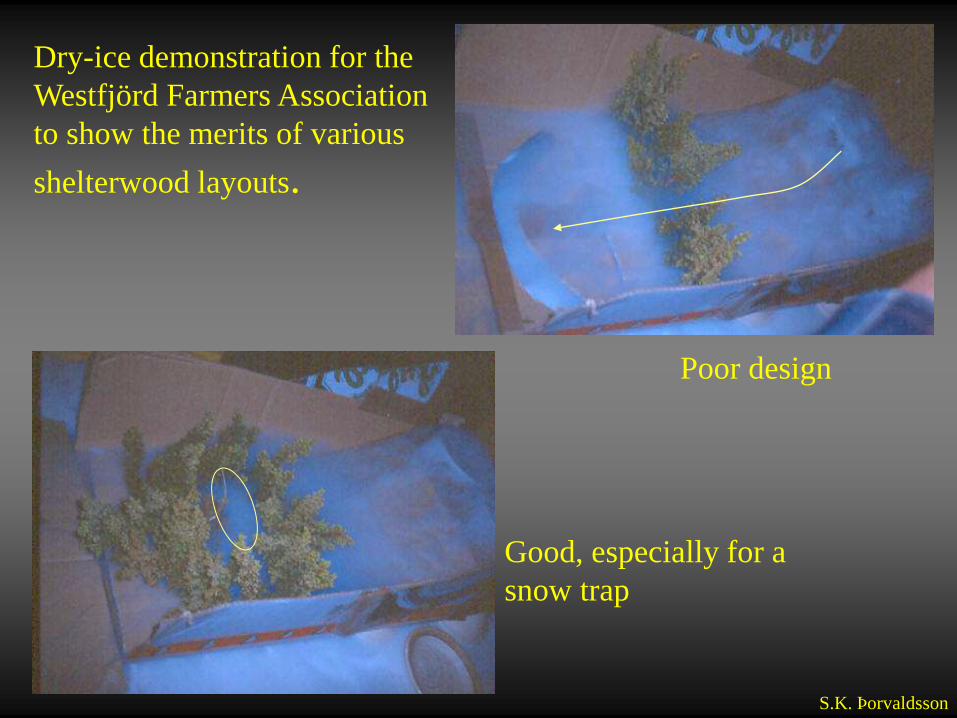
Poor design
Good, especially for a
snow trap
Dry-ice demonstration for the
Westfjörd Farmers Association
to show the merits of various
shelterwood layouts.
S.K. Þorvaldsson

L
Tc
Td
Tm
Laminar Flow
Turbulence (convergence dominant)
Turbulence (divergence dominant)
Turbulence (mixing)
Revealing the basic structure surface wind
Alexander Robertson
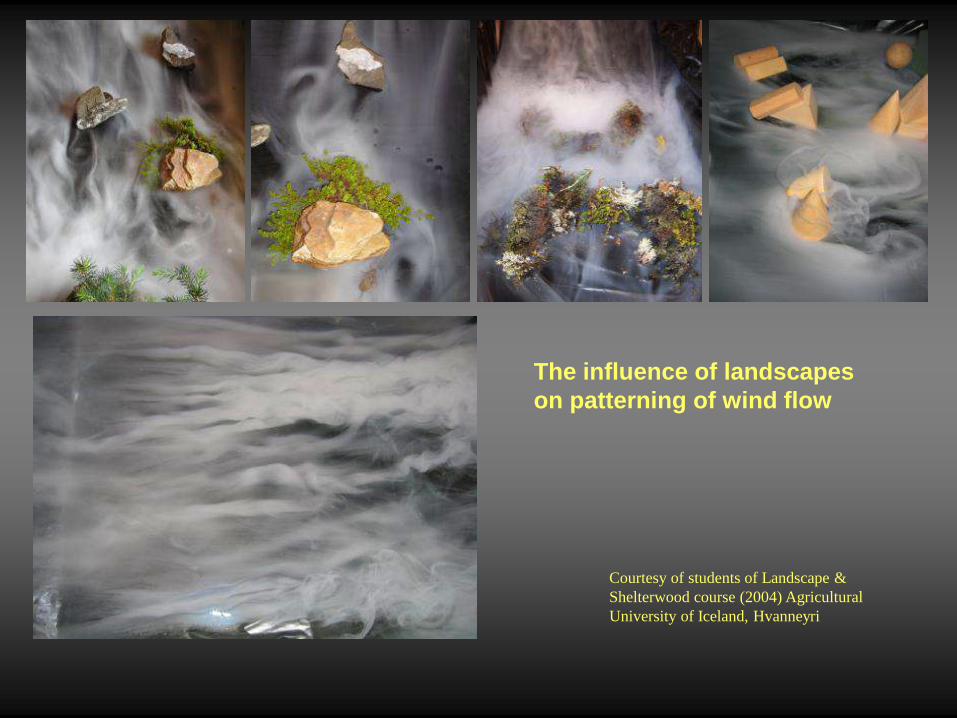
The influence of landscapes
on patterning of wind flow
Courtesy of students of Landscape &
Shelterwood course (2004) Agricultural
University of Iceland, Hvanneyri
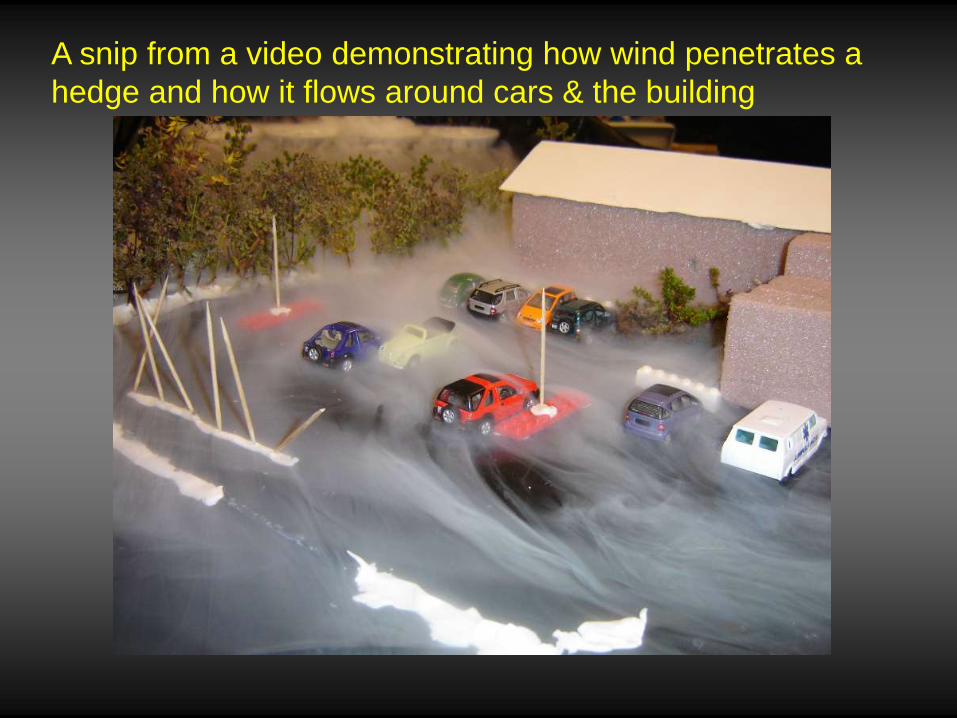
A snip from a video demonstrating how wind penetrates a
hedge and how it flows around cars & the building
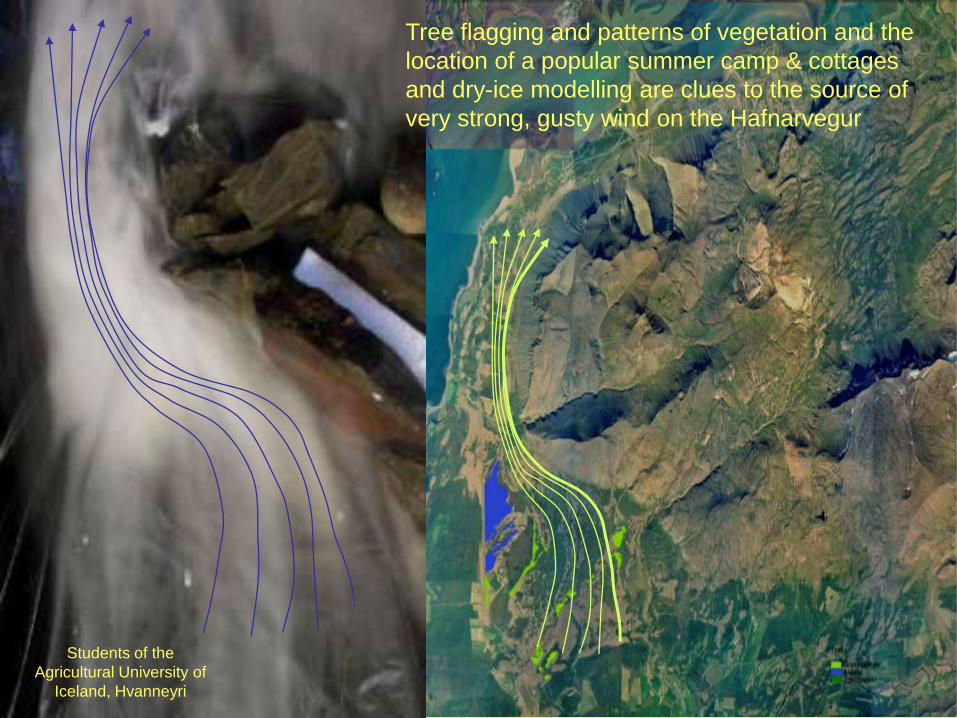
Tree flagging and patterns of vegetation and the
location of a popular summer camp & cottages
and dry-ice modelling are clues to the source of
very strong, gusty wind on the Hafnarvegur
Students of the
Agricultural University of
Iceland, Hvanneyri
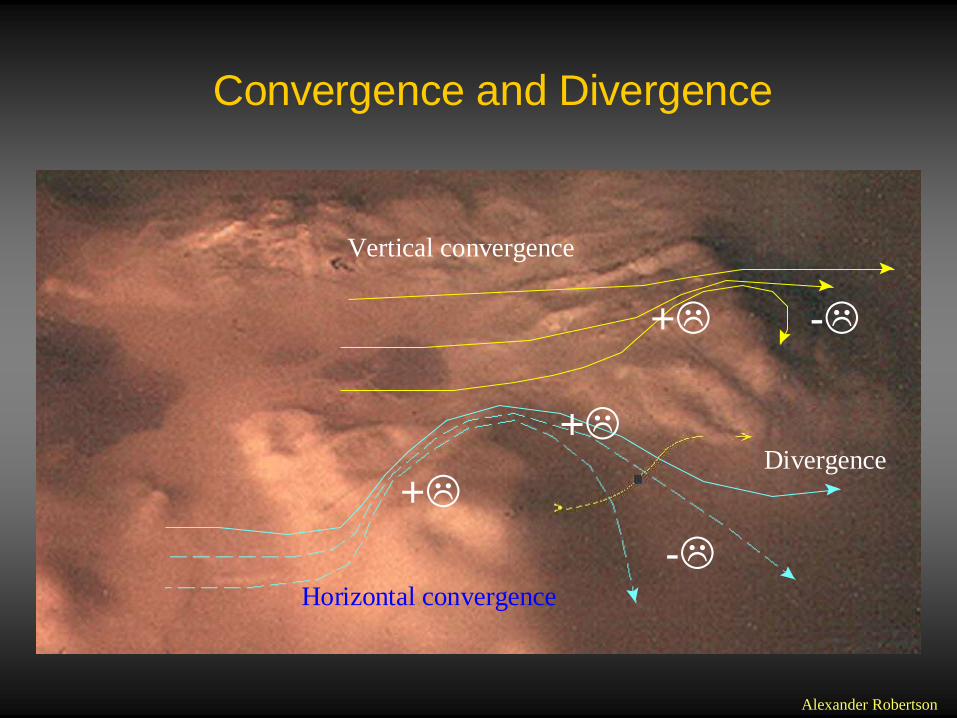
Convergence and Divergence
+
+
-
+
-
Vertical convergence
Horizontal convergence
Divergence
Alexander Robertson
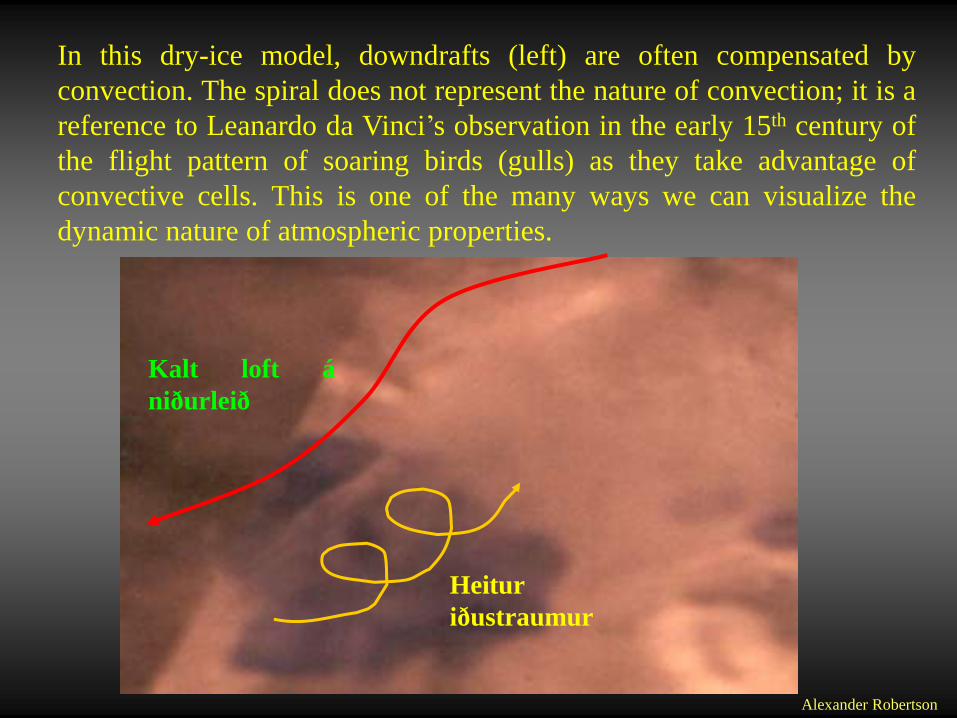
Kalt loft á
niðurleið
Heitur
iðustraumur
In this dry-ice model, downdrafts (left) are often compensated by
convection. The spiral does not represent the nature of convection; it is a
reference to Leanardo da Vinci’s observation in the early 15th century of
the flight pattern of soaring birds (gulls) as they take advantage of
convective cells. This is one of the many ways we can visualize the
dynamic nature of atmospheric properties.
Alexander Robertson
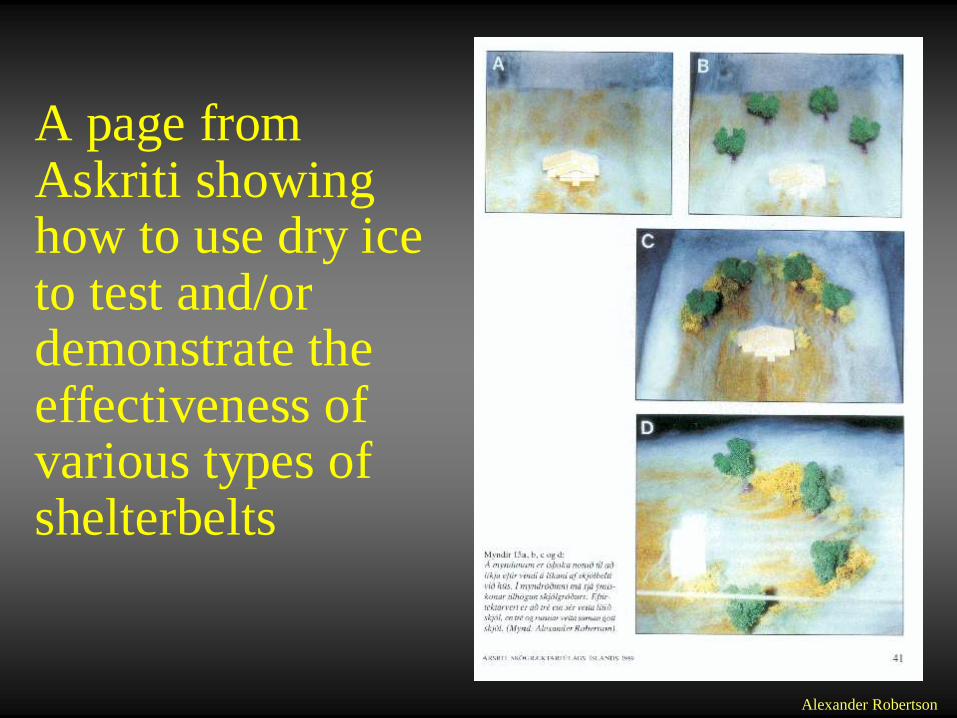
A page fromAskriti showinghow to use dry iceto test and/ordemonstrate theeffectiveness ofvarious types ofshelterbelts
Alexander Robertson
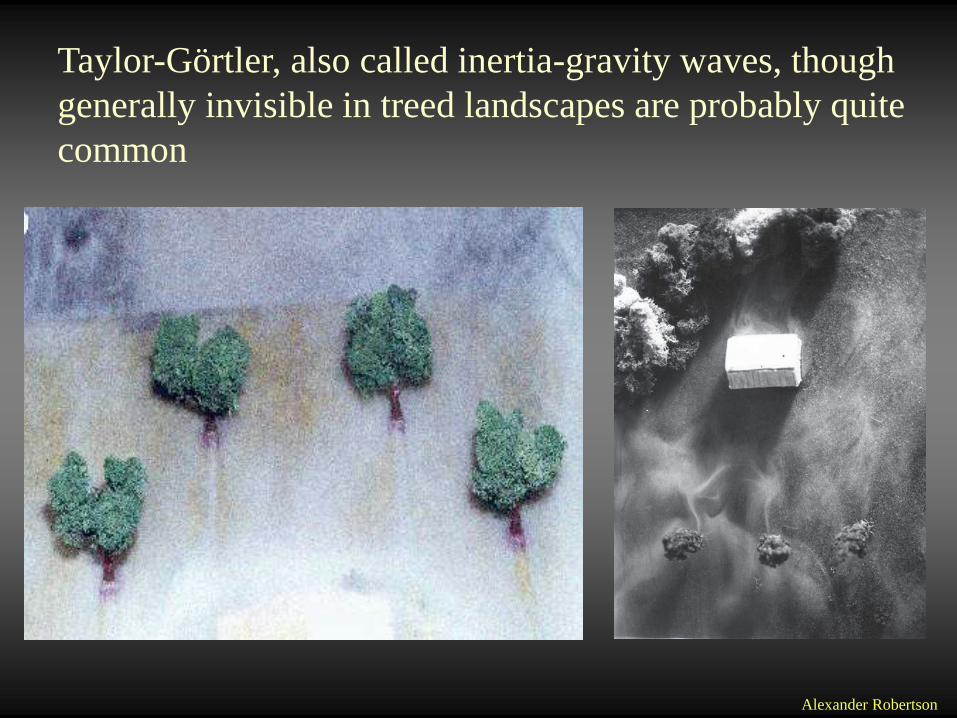
Taylor-Görtler, also called inertia-gravity waves, though
generally invisible in treed landscapes are probably quite
common
Alexander Robertson

Left:- stable longitudinal (Görtler) vortices develop from trunks of standard trees
(with no lower branches) compared to unstable (chaotic) turbulence created by
feathered trees (with lower branches).
Alexander Robertson
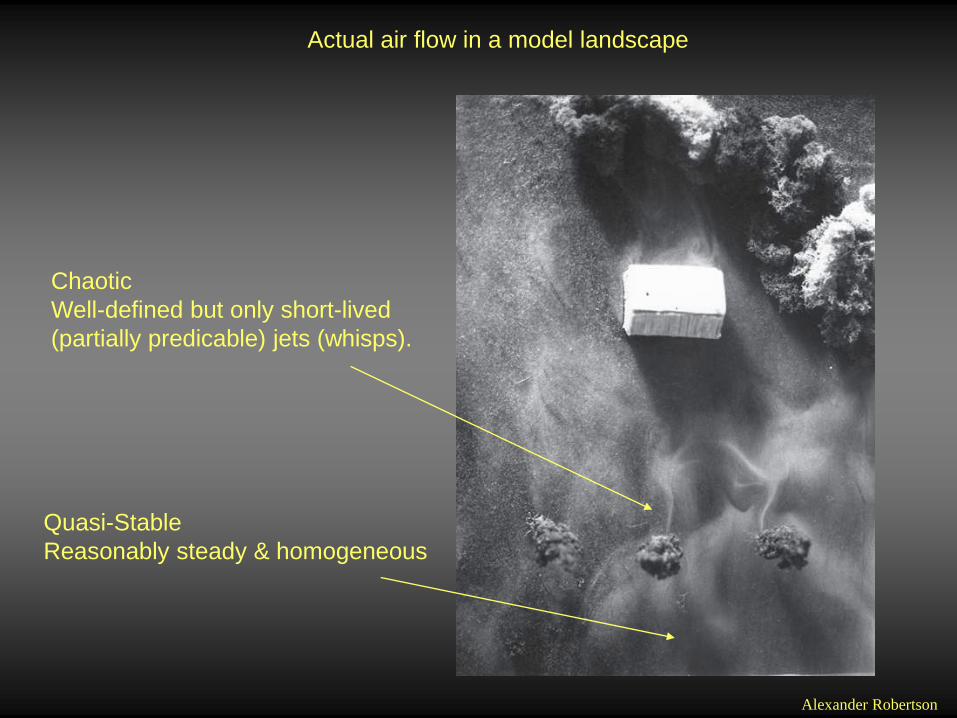
Actual air flow in a model landscape
Quasi-Stable
Reasonably steady & homogeneous
Chaotic
Well-defined but only short-lived
(partially predicable) jets (whisps).
Alexander Robertson

A Einsleitur – loftstreymi (og snjór) yfir slétt
yfirborð.
B Ólgandi þétting – loft (og snjór) stingst niður og
lyftist upp þegar kemur að trjánum.
C Ólgandi dreifing – lofti (og snjó) er þjappað
saman, það stingst niður, sveipirnir þéttast og orka
losnar.
D Ólgandi blanda – loftmassi (og snjór sem berst
með honum) þenst út og skaflar hlaðast upp vegna
minni hreyfingar
A. Robertson
General Direction of Wind
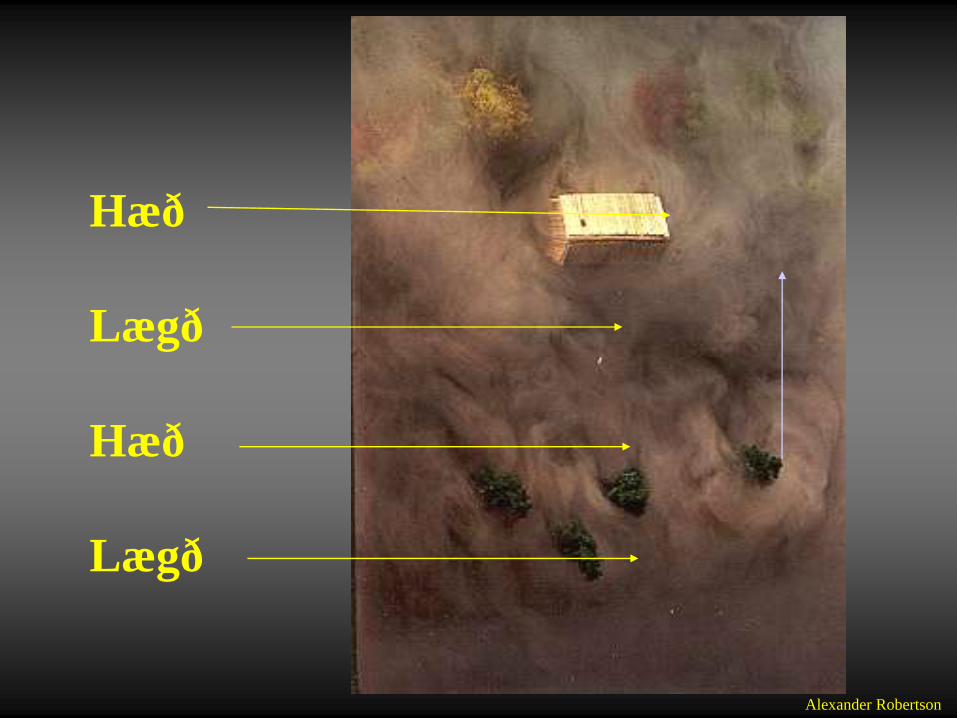
Hæð
Lægð
Hæð
Lægð
Alexander Robertson

At Hvanneyri, a strong east wind flattened the grass, while a cold, north wind
was blowing (from right to left) when this photo was taken. The following day it
blew from the south (left to right) but the biological indicators of this wind are not
in view. It gives some idea of how shelterwoods should be aligned.
Alexander Robertson
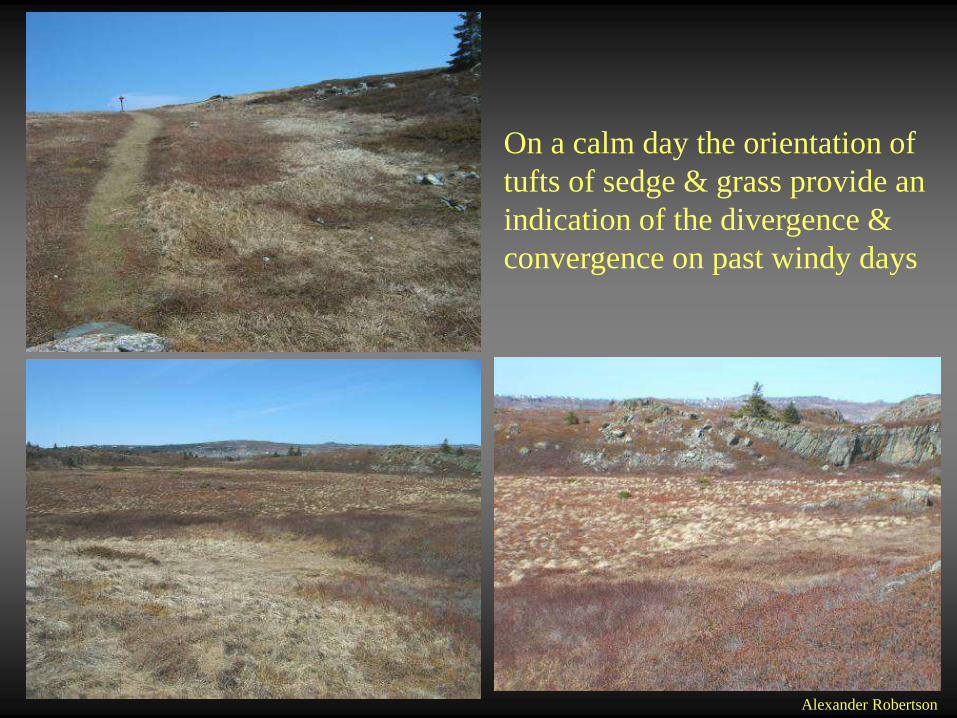
On a calm day the orientation of
tufts of sedge & grass provide an
indication of the divergence &
convergence on past windy days
Alexander Robertson

Alexander Robertson
The Persiistent wind shear and frequent bouts of freezing rain are obvious in the
stature and roughness of these stands of balsam fir.

Alexander Robertson
Wind shaped wave-like
feature of ‘spinneys’ are
common in the the British
Isles and elswhere in
coastal Europe which in
summer have a persistent
but relatively low average
windspeed. In areas where
the wind speed is a little
higher than average they
often a have double curve
where the profile of the
younger understory is also
curved

Deciduous trees are the best biological indicators of summer winds; whereas
evergreens tend to tell us more about the severity of winter weather events such as
loading by snow and freezing rain
Alexander Robertson

These c300 year old tall, straight, symmetrical-boled trees in this plantation
forest in Karelia, Russia are an obvious indication of an area with very low
average wind speeds, apart from an occasional storm.
Alexander Robertson

Alexander Robertson
Patterns of structure, colonization and biomass yields of vegetation at
many scales across a landscape are often inextricably linked to wind.
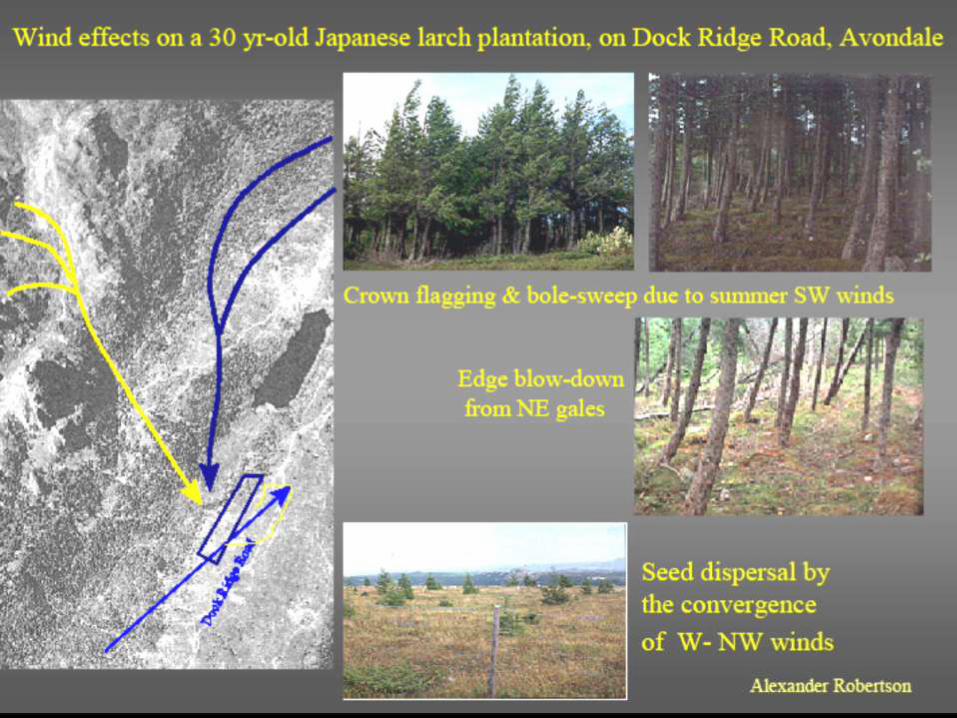
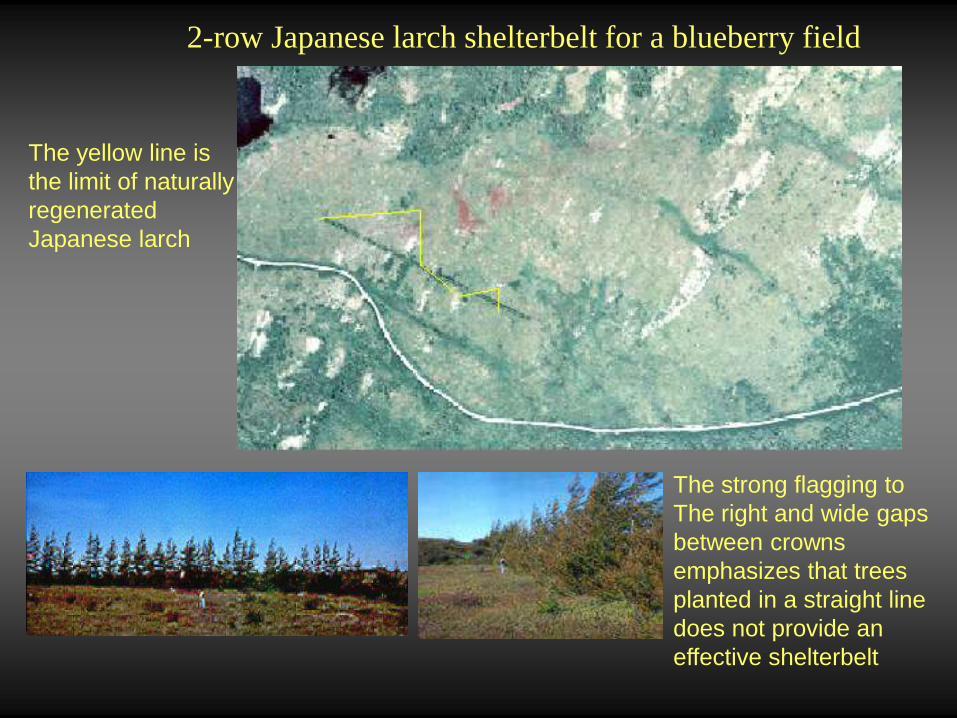
2-row Japanese larch shelterbelt for a blueberry field
The strong flagging to
The right and wide gaps
between crowns
emphasizes that trees
planted in a straight line
does not provide an
effective shelterbelt
The yellow line is
the limit of naturally
regenerated
Japanese larch
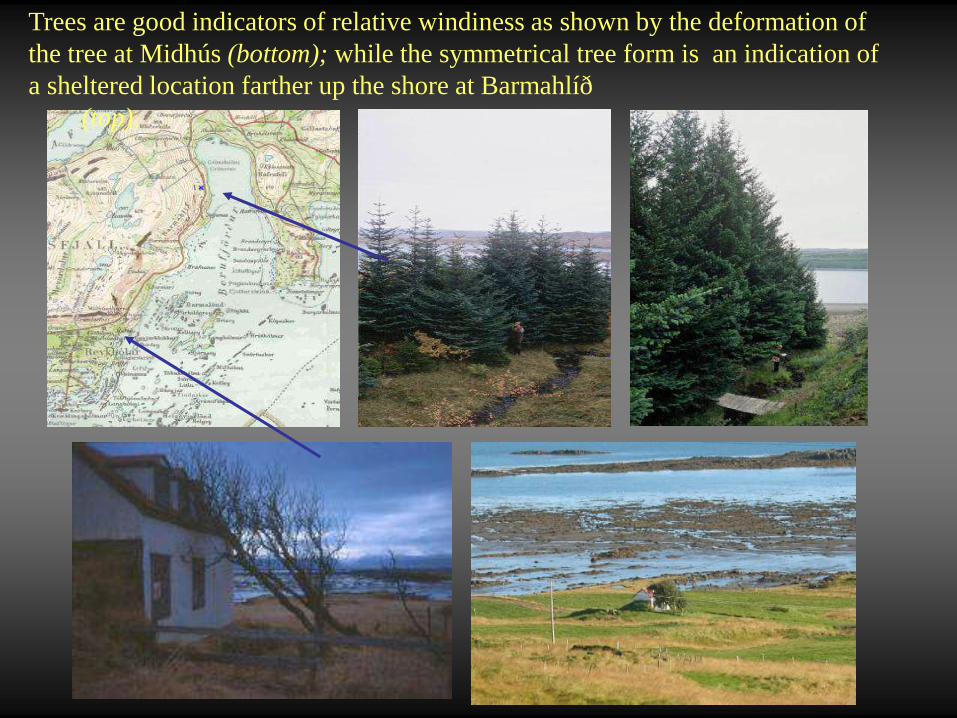
Trees are good indicators of relative windiness as shown by the deformation of
the tree at Midhús (bottom); while the symmetrical tree form is an indication of
a sheltered location farther up the shore at Barmahlíð
(top).

This tilted tree illustrates a very
local effect of strong cornering
winds that only affects a
comparatively small area of
about 10-20 hectares around
Midhús
Alexander Robertson
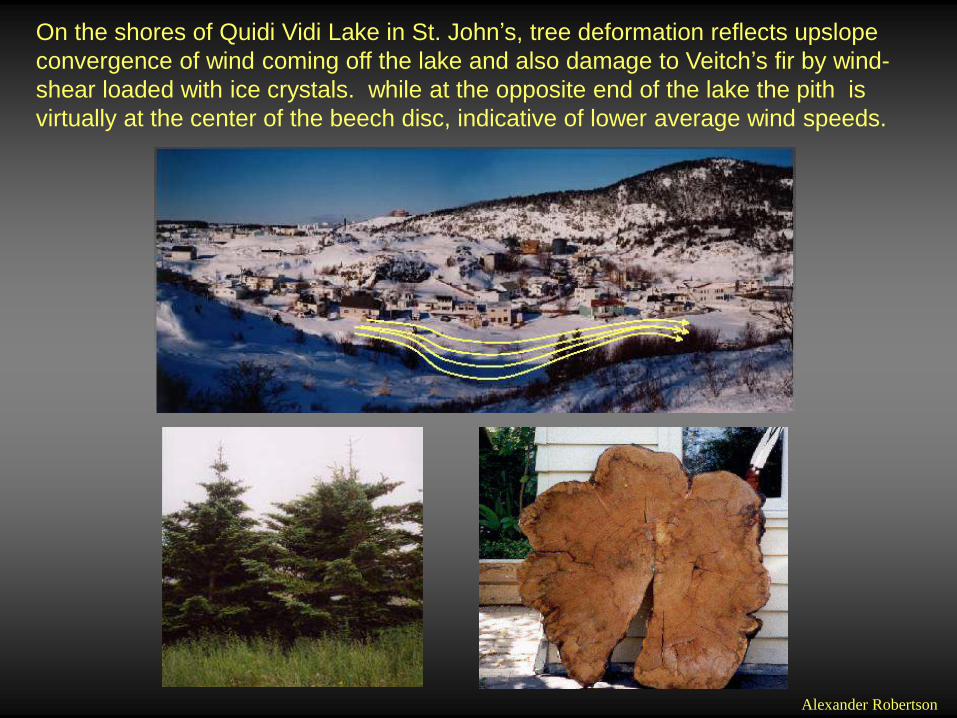
On the shores of Quidi Vidi Lake in St. John’s, tree deformation reflects upslope
convergence of wind coming off the lake and also damage to Veitch’s fir by wind-
shear loaded with ice crystals. while at the opposite end of the lake the pith is
virtually at the center of the beech disc, indicative of lower average wind speeds.

Micro- to mega-scale signatures of wind in the Westfjörds: a) micro- scale buoyancy
and gravity effects around a ditch; b) linear patterns created by a combination of soil
frost and preferential plant colonization of aspects on a slope at Lækur, Núpsdalur;
and c) on the map violent turbulence at Mjólkárstöö hydro village caused by the
displacement of cold air from Gláma (bottom).
Alexander Robertson

Divergence of down-valley winds are easily distinguished from effects of snow
and rock creep and probably skiers, and tree flagging in the early stages of the
plantation at Skrúõur and Núpur
Alexander Robertson

Alexander Robertson
The deformation of trees, directional growth of grass and microsite preferences
of heath and moss vegetation are visual clues to angular direction of cornering
winds around the base of Núpur.

Wind flow around a mountain modeled with dry-ice
Alexander Robertson
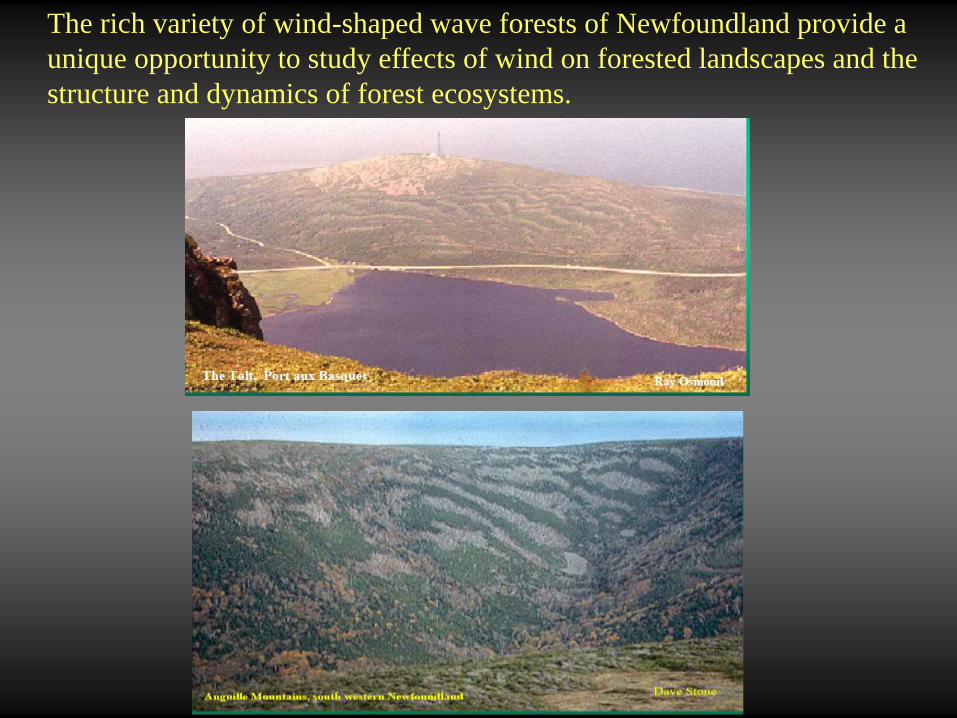
The rich variety of wind-shaped wave forests of Newfoundland provide a
unique opportunity to study effects of wind on forested landscapes and the
structure and dynamics of forest ecosystems.
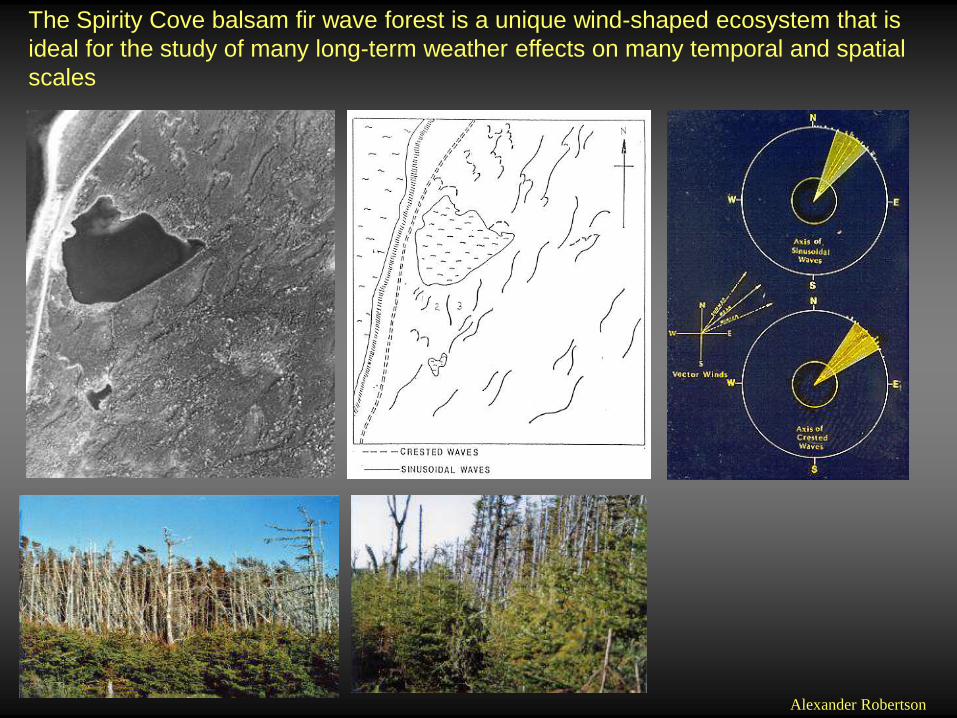
The Spirity Cove balsam fir wave forest is a unique wind-shaped ecosystem that is
ideal for the study of many long-term weather effects on many temporal and spatial
scales
Alexander Robertson
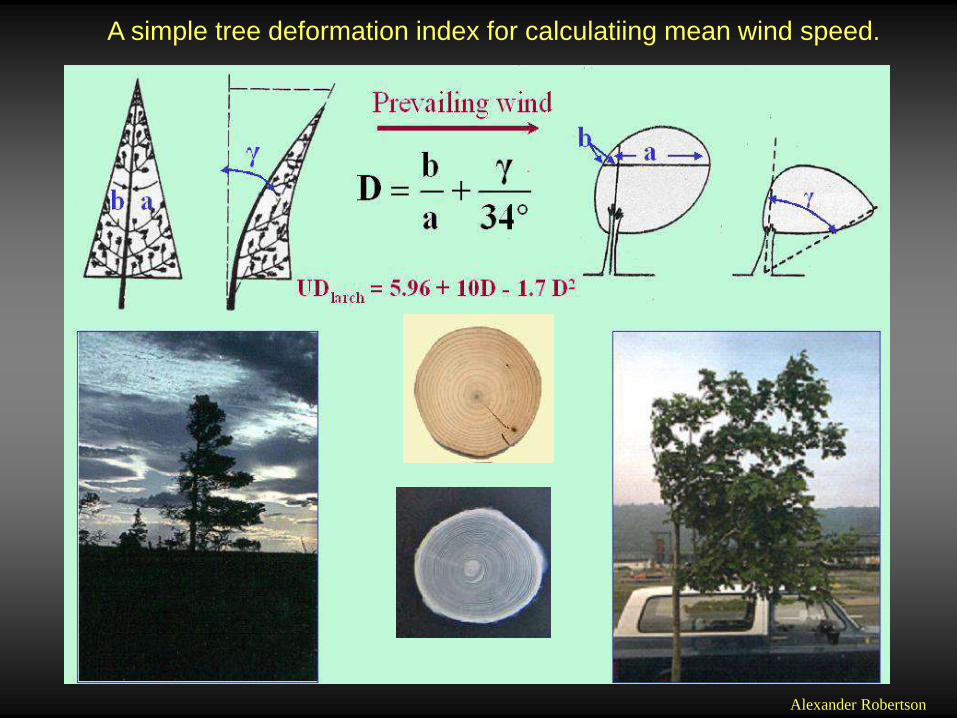
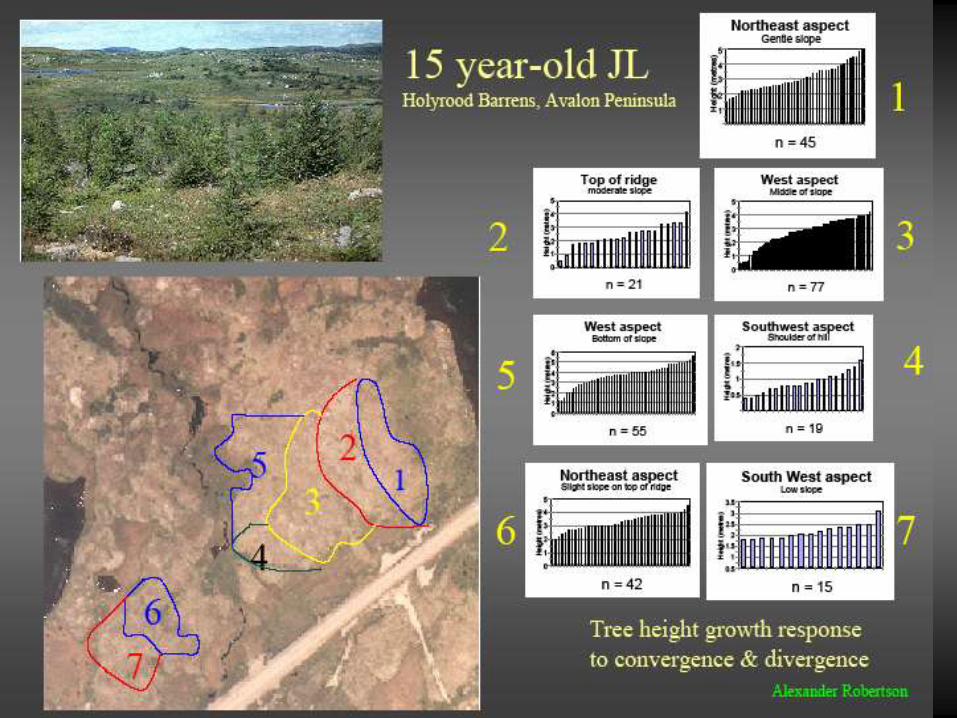
A simple tree deformation index for calculatiing mean wind speed.
Alexander Robertson

The degree of flagging of trees and asymmetric tree rings calibrated with wind data
from climate stations are useful biological indicators of turbulence in remote regions

Brisk persistent wind
15-20 ms-1
Low wind
< 5 ms-1
Moderate,
persistent wind
10-15 ms-1
Occasionally windy
5-10 ms-1
Examples of larch deformation as a biological indicator of wind speed
Alexander Robertson

Sycamore
Mountain
paper birch
European
birch English oak Mountain
paper birch Oak
Circle of European beech
Skemmt
svæði
Tamarack Spruce
Alexander Robertson
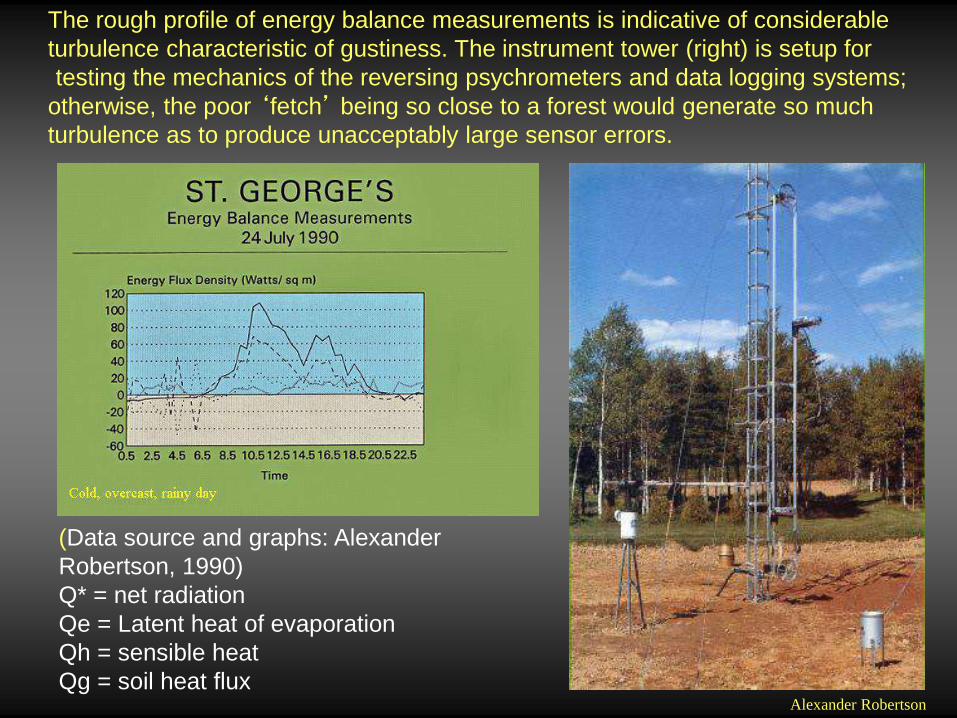
(Data source and graphs: Alexander
Robertson, 1990)
Q* = net radiation
Qe = Latent heat of evaporation
Qh = sensible heat
Qg = soil heat flux
The rough profile of energy balance measurements is indicative of considerable
turbulence characteristic of gustiness. The instrument tower (right) is setup for
testing the mechanics of the reversing psychrometers and data logging systems;
otherwise, the poor ‘fetch’ being so close to a forest would generate so much
turbulence as to produce unacceptably large sensor errors.
Alexander Robertson

Q* = net radiation
Qe = Latent heat of evaporation
Qh = sensible heat
Qg = soil heat flux
Energy flux measurements for 2 days near St. George’s, Newfoundland hints that a
sunny, but cooler day has a higher net radiation. By inference, it explains, for
example, why a cooler and sunnier Iceland is much more pleasant than the warmer,
overcast and often misty weather of the Scottish Highlands and the Hebrides.
Alexander Robertson
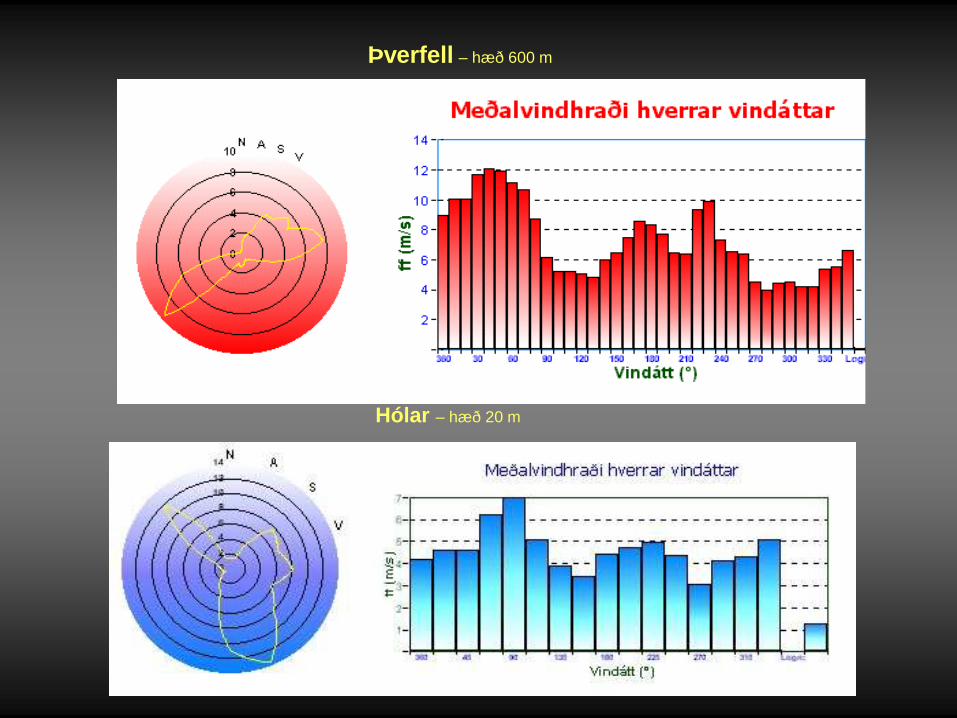
Þverfell – hæð 600 m
Hólar – hæð 20 m
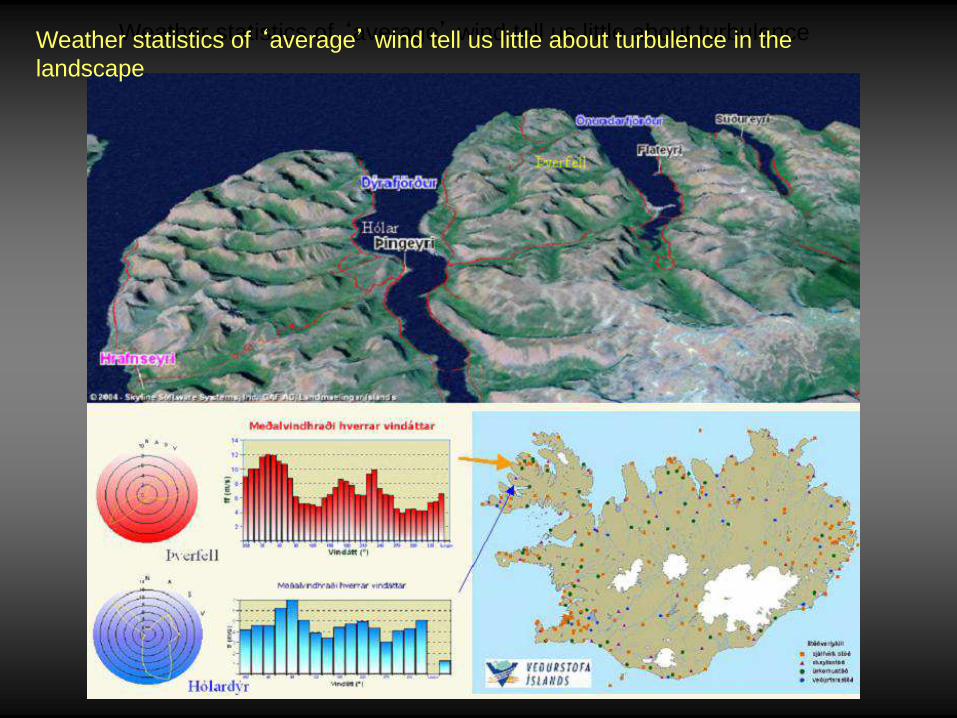
Weather statistics of ‘average’ wind tell us little about turbulence Weather statistics of ‘average’ wind tell us little about turbulence in the
landscape
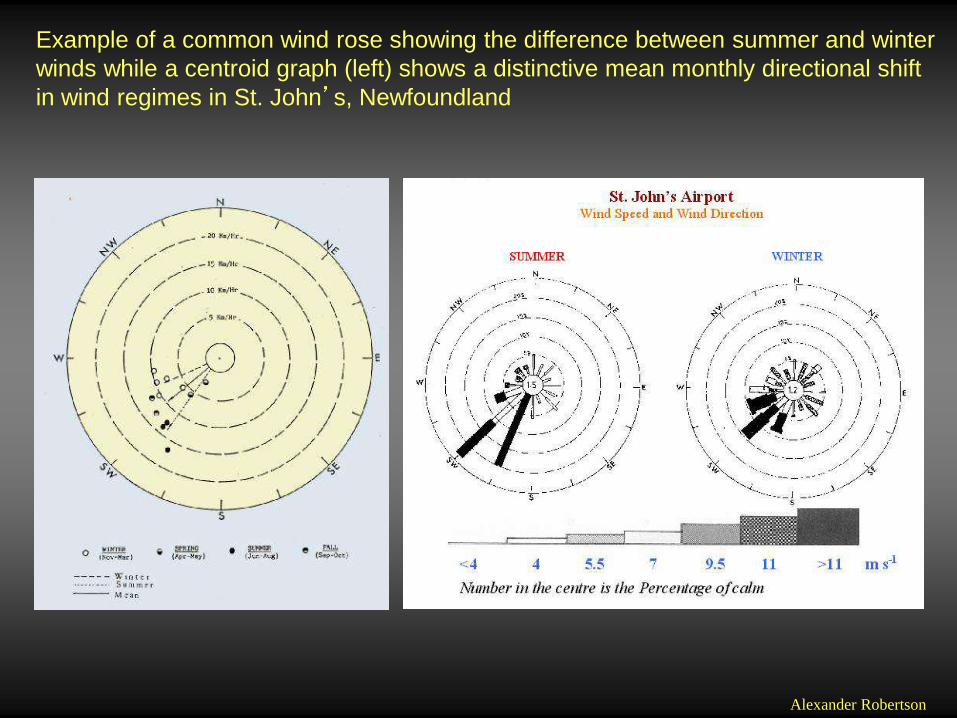
Example of a common wind rose showing the difference between summer and winter
winds while a centroid graph (left) shows a distinctive mean monthly directional shift
in wind regimes in St. John’s, Newfoundland
Alexander Robertson
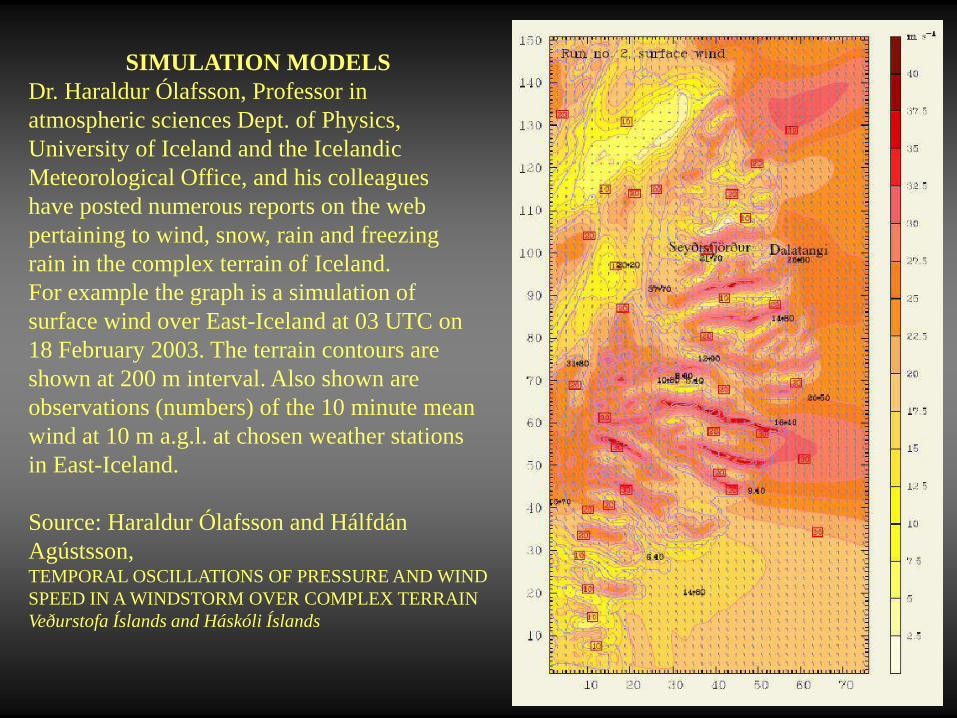
SIMULATION MODELS
Dr. Haraldur Ólafsson, Professor in
atmospheric sciences Dept. of Physics,
University of Iceland and the Icelandic
Meteorological Office, and his colleagues
have posted numerous reports on the web
pertaining to wind, snow, rain and freezing
rain in the complex terrain of Iceland.
For example the graph is a simulation of
surface wind over East-Iceland at 03 UTC on
18 February 2003. The terrain contours are
shown at 200 m interval. Also shown are
observations (numbers) of the 10 minute mean
wind at 10 m a.g.l. at chosen weather stations
in East-Iceland.
Source: Haraldur Ólafsson and Hálfdán
Agústsson, TEMPORAL OSCILLATIONS OF PRESSURE AND WIND
SPEED IN A WINDSTORM OVER COMPLEX TERRAIN
Veðurstofa Íslands and Háskóli Íslands
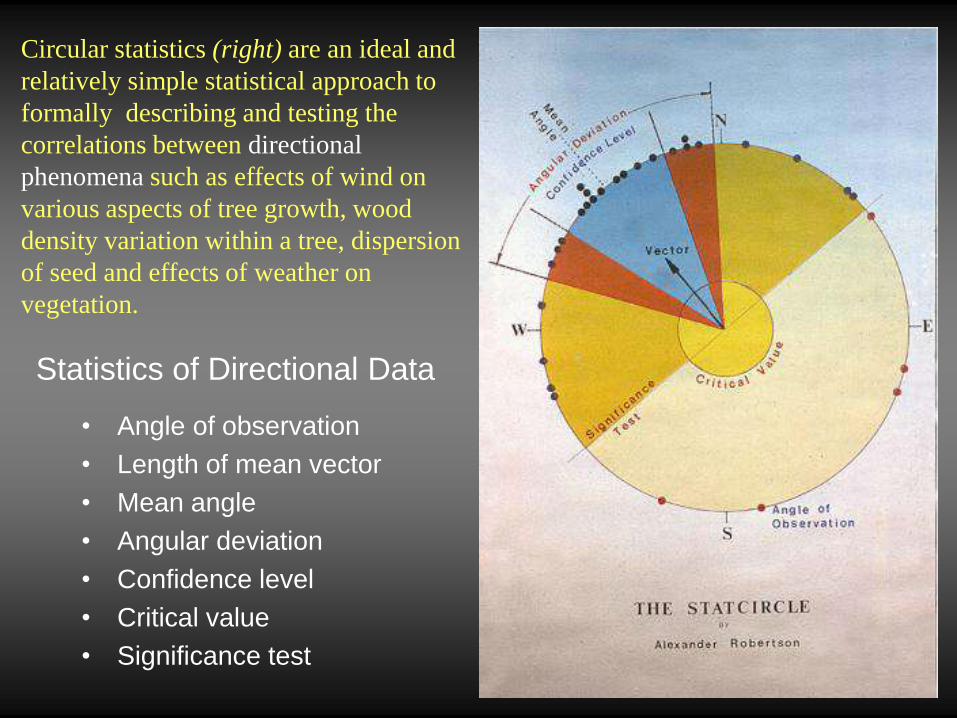
Circular statistics (right) are an ideal and
relatively simple statistical approach to
formally describing and testing the
correlations between directional
phenomena such as effects of wind on
various aspects of tree growth, wood
density variation within a tree, dispersion
of seed and effects of weather on
vegetation.
Statistics of Directional Data
• Angle of observation
• Length of mean vector
• Mean angle
• Angular deviation
• Confidence level
• Critical value
• Significance test
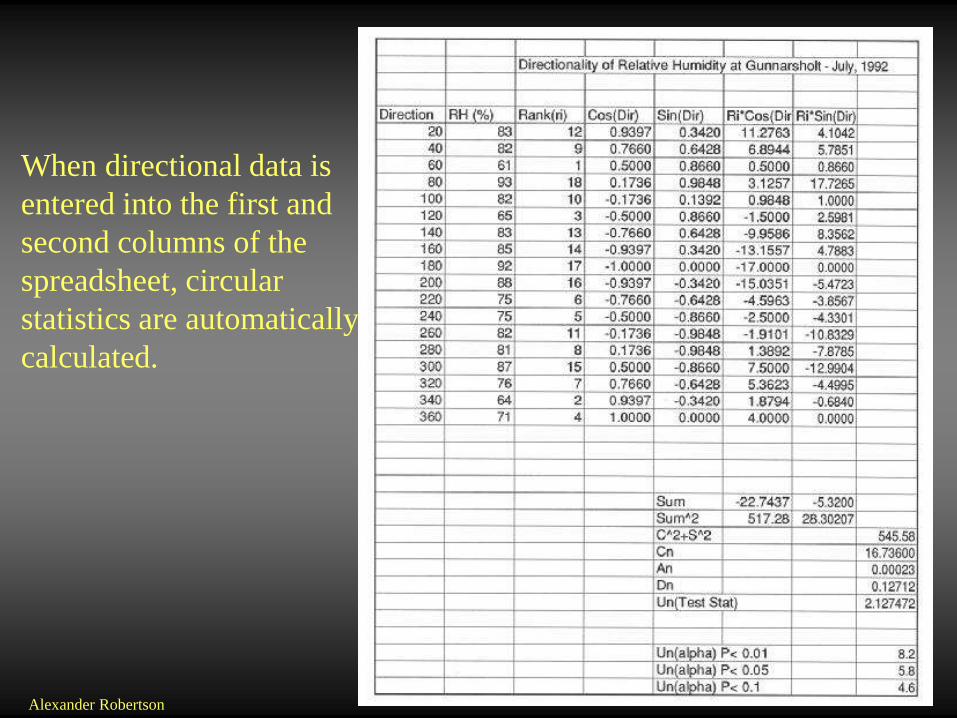
When directional data is
entered into the first and
second columns of the
spreadsheet, circular
statistics are automatically
calculated.
Alexander Robertson
Alexander Robertson
Alexander Robertson
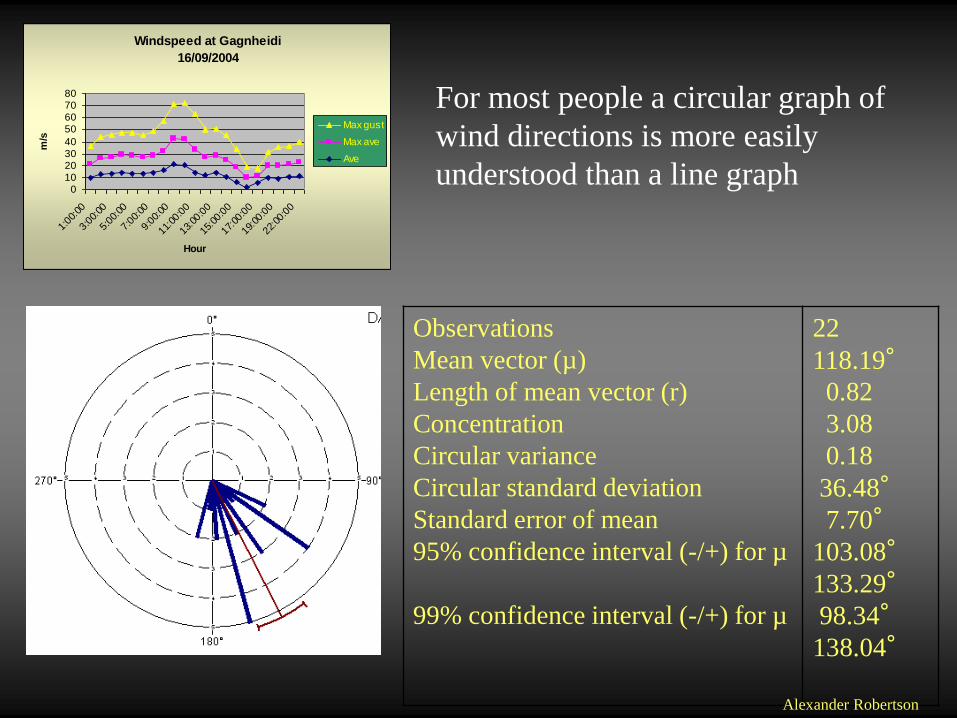
Windspeed at Gagnheidi
16/09/2004
010203040
50607080
1:00
:00
3:00
:00
5:00
:00
7:00
:00
9:00
:00
11:0
0:00
13:0
0:00
15:0
0:00
17:0
0:00
19:0
0:00
22:0
0:00
Hour
m/s
Max gust
Max ave
Ave
Observations
Mean vector (µ)
Length of mean vector (r)
Concentration
Circular variance
Circular standard deviation
Standard error of mean
95% confidence interval (-/+) for µ
99% confidence interval (-/+) for µ
22
118.19°
0.82
3.08
0.18
36.48°
7.70°
103.08°
133.29°
98.34°
138.04°
For most people a circular graph of
wind directions is more easily
understood than a line graph
Alexander Robertson
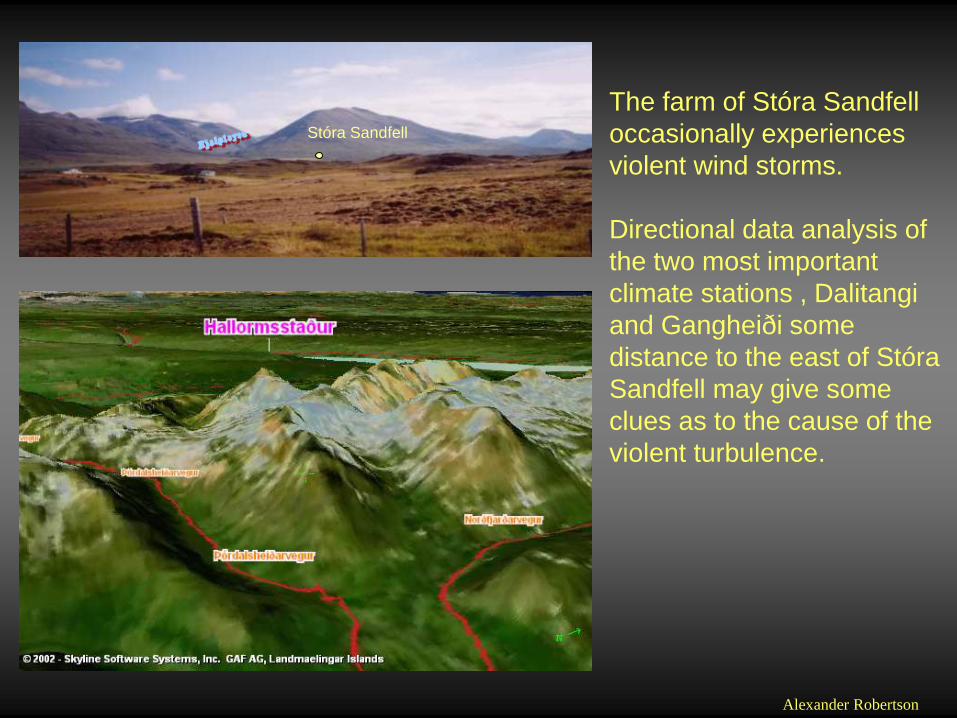
Stóra Sandfell
The farm of Stóra Sandfell
occasionally experiences
violent wind storms.
Directional data analysis of
the two most important
climate stations , Dalitangi
and Gangheiði some
distance to the east of Stóra
Sandfell may give some
clues as to the cause of the
violent turbulence.
Alexander Robertson

Dalatang
i
GagnheidI
Stóra
Sandfell
N
N
Simple circular statistical graphs show the
effect of fjords in changing the wind
direction and gives the first clue for the
source of the violent gusts occassionally
experienced at Stóra Sandfell which is
normally a very sheltered location.
Dalitangi
Alexander Robertson

Solid Arrows - direction of stable gravity waves at a height of roughly 1500-2000 m
Dashed Arrows – redirection and perturbation of gravity waves by fiords and mountains in
crosswinds resulting and strong down-slope winds with violent gusts in the lee of the mountains
Stóra Sandfell
Alexander Robertson
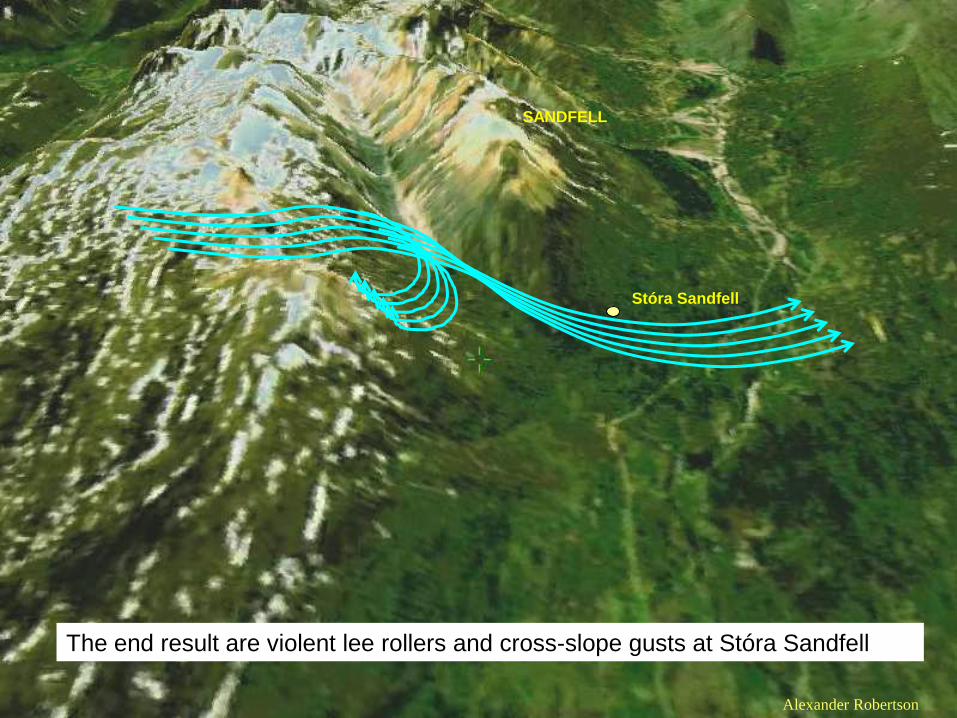
SANDFELL
Stóra Sandfell
The end result are violent lee rollers and cross-slope gusts at Stóra Sandfell
Alexander Robertson
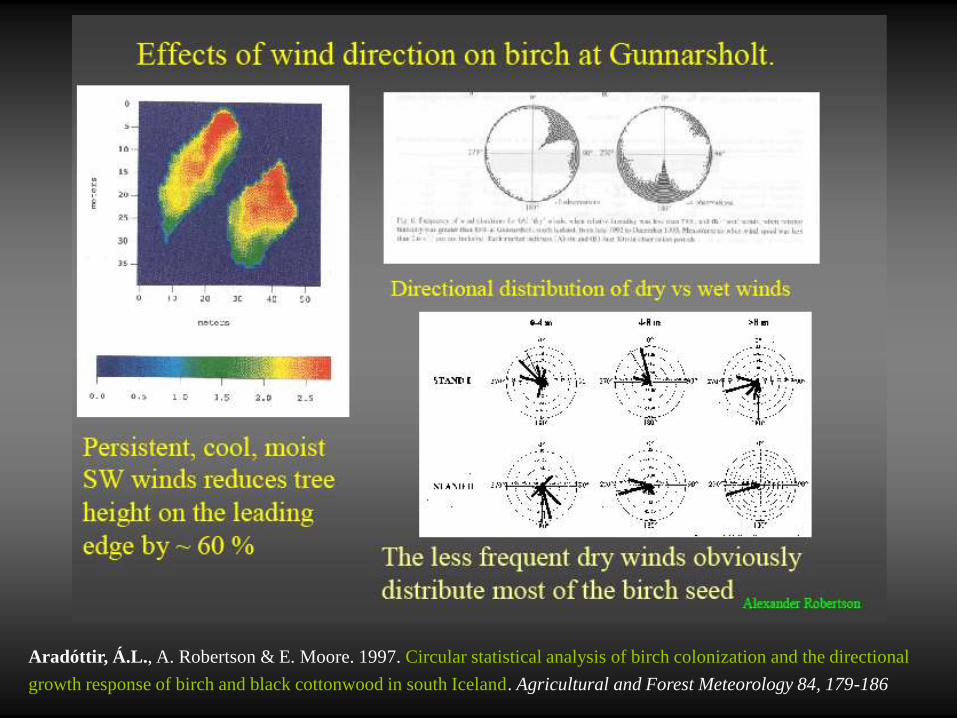
Aradóttir, Á.L., A. Robertson & E. Moore. 1997. Circular statistical analysis of birch colonization and the directional
growth response of birch and black cottonwood in south Iceland. Agricultural and Forest Meteorology 84, 179-186
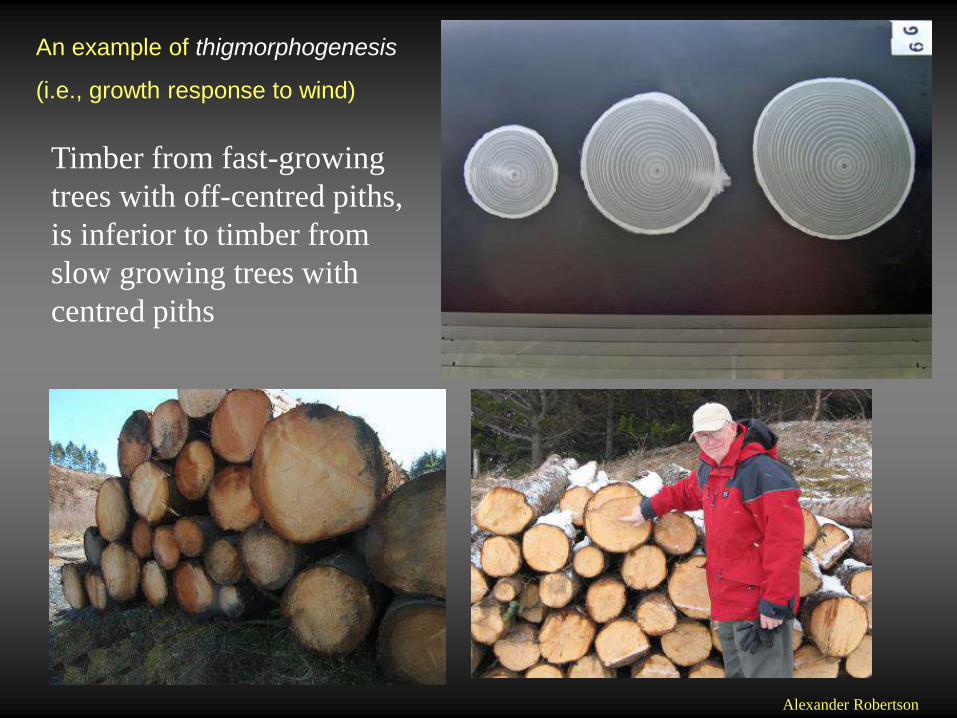
Timber from fast-growing
trees with off-centred piths,
is inferior to timber from
slow growing trees with
centred piths
An example of thigmorphogenesis
(i.e., growth response to wind)
Alexander Robertson

Example of formal circular WIND CAUSES COMPRESSION WOOD IN TREES.
Examples of circular statistical graphs and a simple plot of the distribution
of compression wood derived from X-Ray densitometry of 30 discs from
wave forest trees in relation to seasonal wind direction vectors
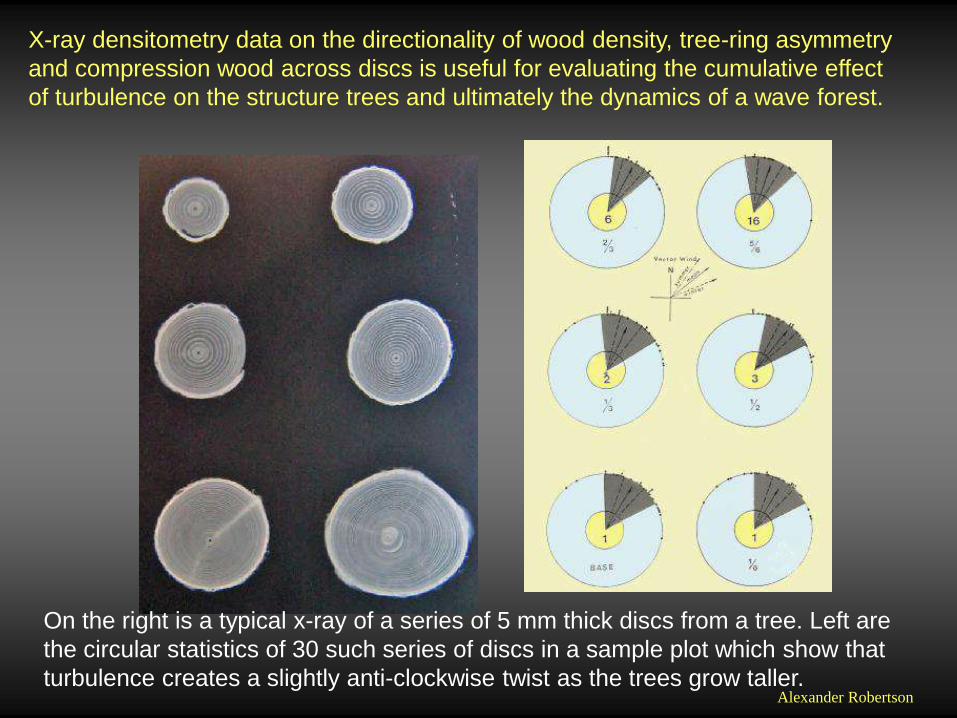
X-ray densitometry data on the directionality of wood density, tree-ring asymmetry
and compression wood across discs is useful for evaluating the cumulative effect
of turbulence on the structure trees and ultimately the dynamics of a wave forest.
On the right is a typical x-ray of a series of 5 mm thick discs from a tree. Left are
the circular statistics of 30 such series of discs in a sample plot which show that
turbulence creates a slightly anti-clockwise twist as the trees grow taller. Alexander Robertson
FRACTAL GEOMETRY:
THE CALCULUS OF HETEROGENEITY
Or simply put - a measure of
roughness
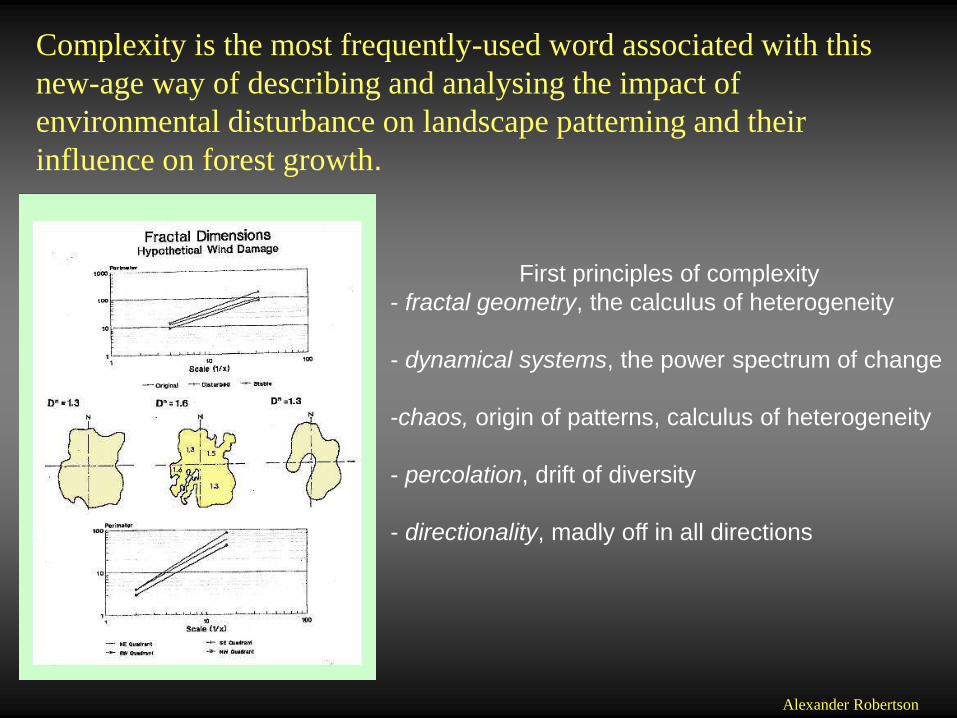
First principles of complexity
- fractal geometry, the calculus of heterogeneity
- dynamical systems, the power spectrum of change
-chaos, origin of patterns, calculus of heterogeneity
- percolation, drift of diversity
- directionality, madly off in all directions
Complexity is the most frequently-used word associated with this
new-age way of describing and analysing the impact of
environmental disturbance on landscape patterning and their
influence on forest growth.
Alexander Robertson
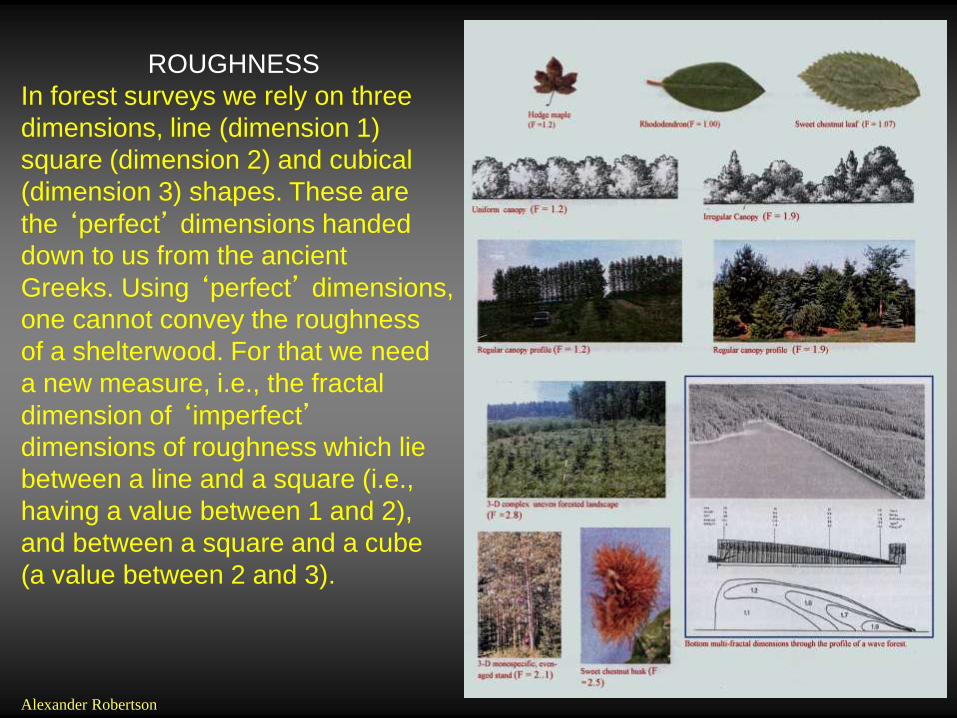
ROUGHNESS
In forest surveys we rely on three
dimensions, line (dimension 1)
square (dimension 2) and cubical
(dimension 3) shapes. These are
the ‘perfect’ dimensions handed
down to us from the ancient
Greeks. Using ‘perfect’ dimensions,
one cannot convey the roughness
of a shelterwood. For that we need
a new measure, i.e., the fractal
dimension of ‘imperfect’ dimensions of roughness which lie
between a line and a square (i.e.,
having a value between 1 and 2),
and between a square and a cube
(a value between 2 and 3).
Alexander Robertson
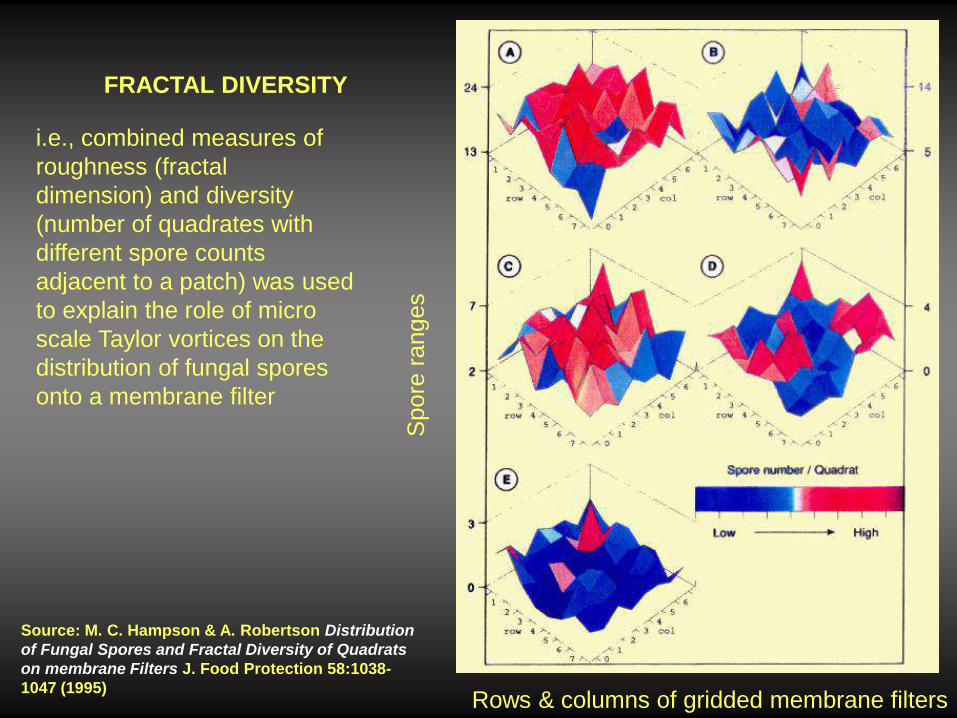
i.e., combined measures of
roughness (fractal
dimension) and diversity
(number of quadrates with
different spore counts
adjacent to a patch) was used
to explain the role of micro
scale Taylor vortices on the
distribution of fungal spores
onto a membrane filter
Source: M. C. Hampson & A. Robertson Distribution
of Fungal Spores and Fractal Diversity of Quadrats
on membrane Filters J. Food Protection 58:1038-
1047 (1995)
Spore
ranges
Rows & columns of gridded membrane filters
FRACTAL DIVERSITY

A simple way to visualize turbulent phase changes in fluid flow is to open a tap
and gradually increase flow. The same principle applies to ‘phase changes’ in
wind; for example, from a gentle breeze to a gale.
Quasi-laminar Chaotic Stable+chaotic Stable
Alexander Robertson

Turbulent Time Series 1
Log-Log plots of Correlation Integral /C(r) versus Hyersphere of
Radius (r) for a range of embedding dimensions C
orr
ela
tio
n d
ime
ns
ion
(L
nC
(r)
Logarithm of hypersphere radius (Ln r)
The slopes of the periodic case are coincidental. Veering of wind direction, associated with
frontal passages, produces a time series with well-defined patterns as indicated by the
slightly divergent curves. The wind speed time series by comparison, is characteristically
noisy; but still has some pattern (if it were truly random the last curve on the right would be
vertical). Graphs pertaining to wind were derived from analysis of averages at 3 minute
intervals over an 18 months period measured at the Gunnarsholt experimental site.
Source: Alexander Robertson. Directionality, fractals and chaos in wind-shaped forests. Agric. For. Meteorology 72:133-166 (1994)

Source: Alexander Robertson. Directionality, fractals and chaos in wind-shaped forests. Agric. For. Meteorology 72:133-166 (1994)

Turbulence in Mathematical, Ecological and Dynamical Systems
Source: Alexander Robertson Planting trees on the Avalon Peninsula
Government of Newfoundland and Labrador, Department of Natural Resources (Forestry)