alcoholic beverage task force report - cga.ct.gov20120711_competitive alcoholic liquor...3 the...
TRANSCRIPT
1
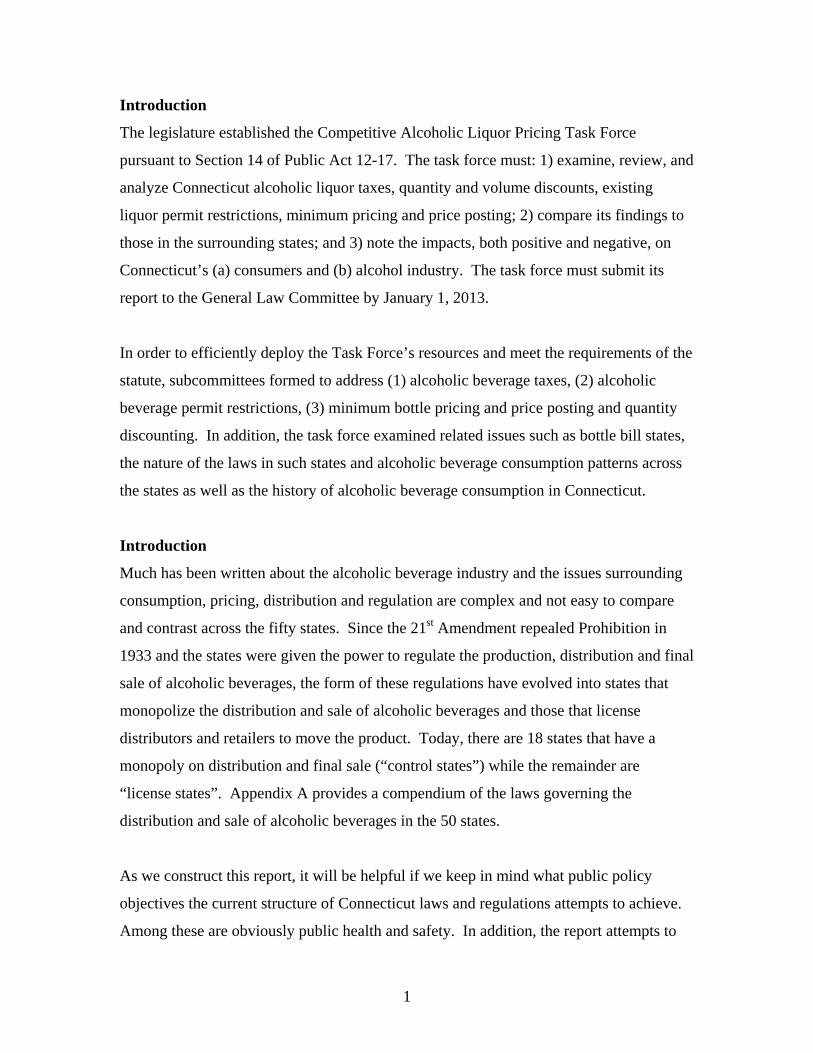
Introduction
The legislature established the Competitive Alcoholic Liquor Pricing Task Force
pursuant to Section 14 of Public Act 12-17. The task force must: 1) examine, review, and
analyze Connecticut alcoholic liquor taxes, quantity and volume discounts, existing
liquor permit restrictions, minimum pricing and price posting; 2) compare its findings to
those in the surrounding states; and 3) note the impacts, both positive and negative, on
Connecticut’s (a) consumers and (b) alcohol industry. The task force must submit its
report to the General Law Committee by January 1, 2013.
In order to efficiently deploy the Task Force’s resources and meet the requirements of the
statute, subcommittees formed to address (1) alcoholic beverage taxes, (2) alcoholic
beverage permit restrictions, (3) minimum bottle pricing and price posting and quantity
discounting. In addition, the task force examined related issues such as bottle bill states,
the nature of the laws in such states and alcoholic beverage consumption patterns across
the states as well as the history of alcoholic beverage consumption in Connecticut.
Introduction
Much has been written about the alcoholic beverage industry and the issues surrounding
consumption, pricing, distribution and regulation are complex and not easy to compare
and contrast across the fifty states. Since the 21st Amendment repealed Prohibition in
1933 and the states were given the power to regulate the production, distribution and final
sale of alcoholic beverages, the form of these regulations have evolved into states that
monopolize the distribution and sale of alcoholic beverages and those that license
distributors and retailers to move the product. Today, there are 18 states that have a
monopoly on distribution and final sale (“control states”) while the remainder are
“license states”. Appendix A provides a compendium of the laws governing the
distribution and sale of alcoholic beverages in the 50 states.
As we construct this report, it will be helpful if we keep in mind what public policy
objectives the current structure of Connecticut laws and regulations attempts to achieve.
Among these are obviously public health and safety. In addition, the report attempts to
2
describe what we might achieve if the structure were changed. This report describes
some aspects of Connecticut’s current structure and compares and contrasts it with other
states’ structures where feasible1 while mentioning the challenges states face today from
legal challenges to post and hold laws and the distribution of certain alcoholic beverages
from the World Trade Organization (WTO) among others. The report attempts to
illuminate the possibilities for legislative change and proposes specific recommendations
that could make Connecticut more competitive to surrounding states, increase our state’s
consumer wellbeing, spur growth in the alcoholic beverage and related industries as well
as increase public health and safety.
The Three-Tier System
A three-tier system consisting of the production, distribution and final sale of alcoholic
beverages evolved after the repeal of Prohibition and exists in various forms in the states
today. A producer must sell to a distributor who must then sell to a retailer. Producers
include brewers, wine makers, distillers and importers. States have various exceptions to
this rule, the most prevalent one being the case of a brewpub, which is simultaneously a
producer and retailer and has no requirement to sell to a distributor. Some states allow an
entity to have a part in two of the tiers, letting small breweries act as their own
distributor, for example. In the wine industry, many states permit wineries to sell bottles
of wine on-site to customers, and some states, such as Oregon, permit intrastate
shipments of wine directly from the producer to the customer. Usually producers give a
distributor exclusive rights to market their product within a geographical area, so that
there will not be, for example, two distributors of Anheuser-Busch products competing
against each other. Rules vary according to what kind of relationships each of the tiers
can enter in to with the other two tiers. For example, a producer may not be allowed to
give promotional items or services to a retailer. A beer distributor might be responsible
for setting up and maintaining draft lines in a restaurant, or may be legally prohibited
from doing so, depending on the state.
1 The region we analyze in this report consists of the six New England states, New York, New Jersey and Pennsylvania and is consistent with the 2011 OLR Research Report 2011-R-0252 (revised). These states’ web of laws and regulations is exceedingly complex and difficult to portray simply.

3
The distributor must establish a relationship with a retailer. The distributor may not
purchase shelf space or exclusivity, furnish equipment such as draft coolers, offer loans
or create a feeling of obligation or offer discriminatory promotional pricing. Distributors
are supposed to provide all retailers the same pricing. Distributors maintain large
refrigerated warehouses to store beer and fine wine and fleets of trucks to ship product
around the state. This reduces the inventory a retailer needs to carry and some
distributors can quickly and efficiently provide a huge variety in any quantity to
retailers.2
Alcoholic Beverage Consumption
How does Connecticut compare with other states in the consumption of alcoholic
beverages? The National Institute of Alcohol Abuse and Alcoholism produces an annual
report on the apparent per capita consumption of beer, wine and spirits in the states.3 The
25th annual surveillance report from August 2011 is based on alcoholic beverage sales
data collected directly by the Alcohol Epidemiologic Data System (AEDS) from the
states or provided by beverage industry sources. Population data for persons older than
14 provided by the U.S. Census Bureau provide the basis for per capita rates. The
following are highlights from the current report, which updates consumption trends from
1977 through 2009:
In the United States, per capita consumption of ethanol from all alcoholic
beverages combined in 2009 was 2.30 gallons, representing a 0.9 percent decrease
from 2.32 gallons in 2008.
Between 2008 and 2009, changes in overall per capita consumption of ethanol
included
increases in nine states, decreases in 34 States and the District of Columbia, and
no change in seven states.
Analysis of overall per capita alcohol consumption by census region between
2008 and 2009 indicated decreases of 0.4% in the Midwest, 0.9% in the South,
and 1.2% in the West, with no change in the Northeast. 2 See http://www.fermentarium.com/industry/how-the-three-tiered-beer-distribution-system-works/ for more information. 3 See http://pubs.niaaa.nih.gov/publications/Surveillance92/CONS09.htm#list for more information.
4
Healthy People 2010 (U.S. Department of Health and Human Services 2000) has set the
national objective for reducing per capita alcohol consumption to no more than 1.96
gallons of ethanol. However, the prospect of reaching the Year 2010 national objective
does not appear promising. From 1999 to 2008, there was a trend of increasing per capita
consumption. However, 2009 is the first year in a decade in which a decrease in per
capita consumption was observed. To meet the 2010 objective, U.S. per capita alcohol
consumption will need to decrease by 14.8% within one year.
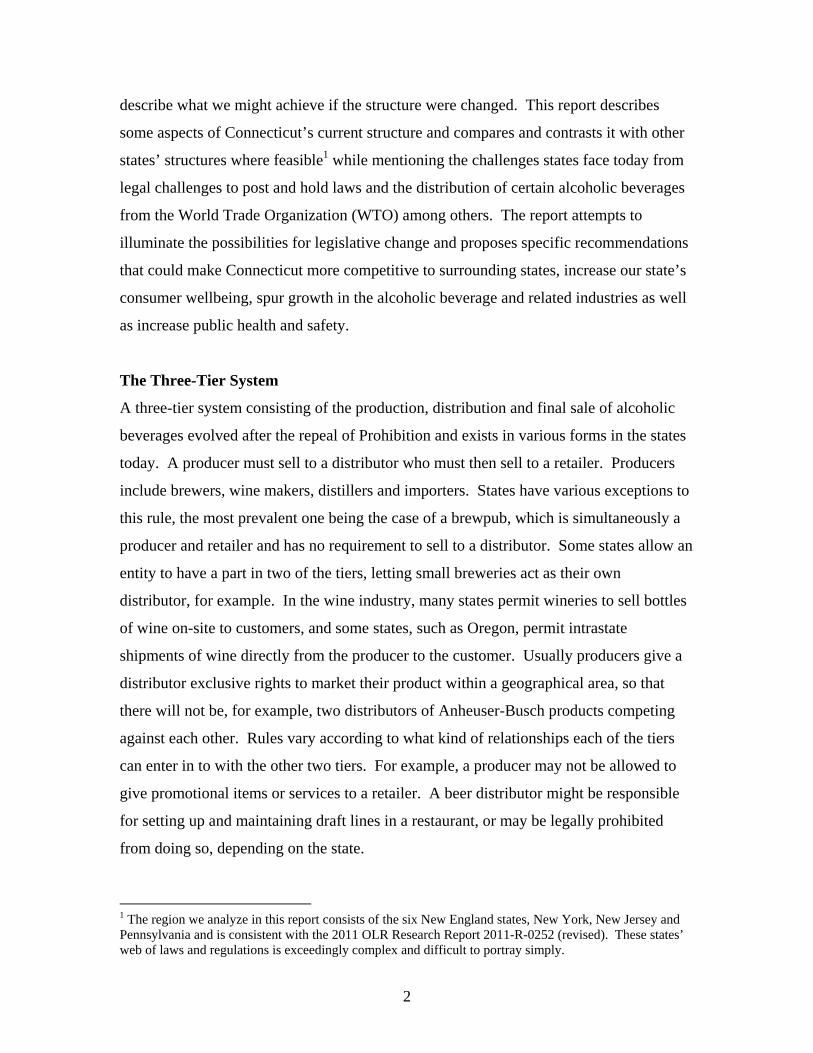
Figure 1 shows consumption of beer, wine and spirits across the states in 2009.
Connecticut ranked 25th at 2.34 gallons per capita.4 New Hampshire has the largest
apparent consumption per capita because it sells a large quantity to residents of other
states.
Figure 1: Alcoholic Beverage Consumption by State 2009
All Alcoholic Beverage Per Capita Consumption by State 2009
0
0.5
1
1.5
2
2.5
3
3.5
4
4.5
5
UT TN KY GA AL NC IN PA M
IMS TX AZ IA IL W
A NE
WEST
NM ME HI O
R SD ID VT WI
AK DE DC
Gal
lons
Ann
ually
CT 2.34 gal per cap
U.S. 2.3South 2.23
Midwest 2.31West 2.4
4 AEDS uses an estimate of average ethanol content in the alcoholic beverages to convert the gallons of sold or shipped beer, wine and spirits into gallons of ethanol (pure alcohol) before calculating per capita consumption estimates. The ethanol conversion coefficients (ECC, i.e., proportion of pure alcohol for each beverage type) are 0.045 for beer, 0.129 for wine, and 0.411 for spirits.

5
Figures 2, 3 and 4 show per capita consumption for beer, wine and spirits across the
states in 2009. New Hampshire has the largest apparent beer consumption for the same
reason as above. Washington, D.C. and Idaho had the largest per capita wine
consumption in 2009, while New Hampshire was the third highest apparent consumer.
Figure 2: Per Capita Beer Consumption by State 2009
Beer Per Capita Consumption 2009
0
0.2
0.4
0.6
0.8
1
1.2
1.4
1.6
1.8
2
UT CT NY NJ MD
MA CA ID TN NE AR GA IN WA MI
NC RI KY VAWEST
US KS OK AZ MN AL FL CO IL
SOUT
H ME
WV
MID DC OH OR HI MO AK DE PA SC VT NM MS IA TX WY
NE WI
LA SD NV ND MT
NH
Gal
lons
Ann
ually
CT 0.89 West 1.12 South 1.22
Midwest 1.25
U.S. 1.17
New Hampshire, Washington, D.C. and Delaware were the top three per capita
consumers of spirits in 2009. These states and the District are likely exporters to nearby
states because they are relatively price competitive with their near neighbors.
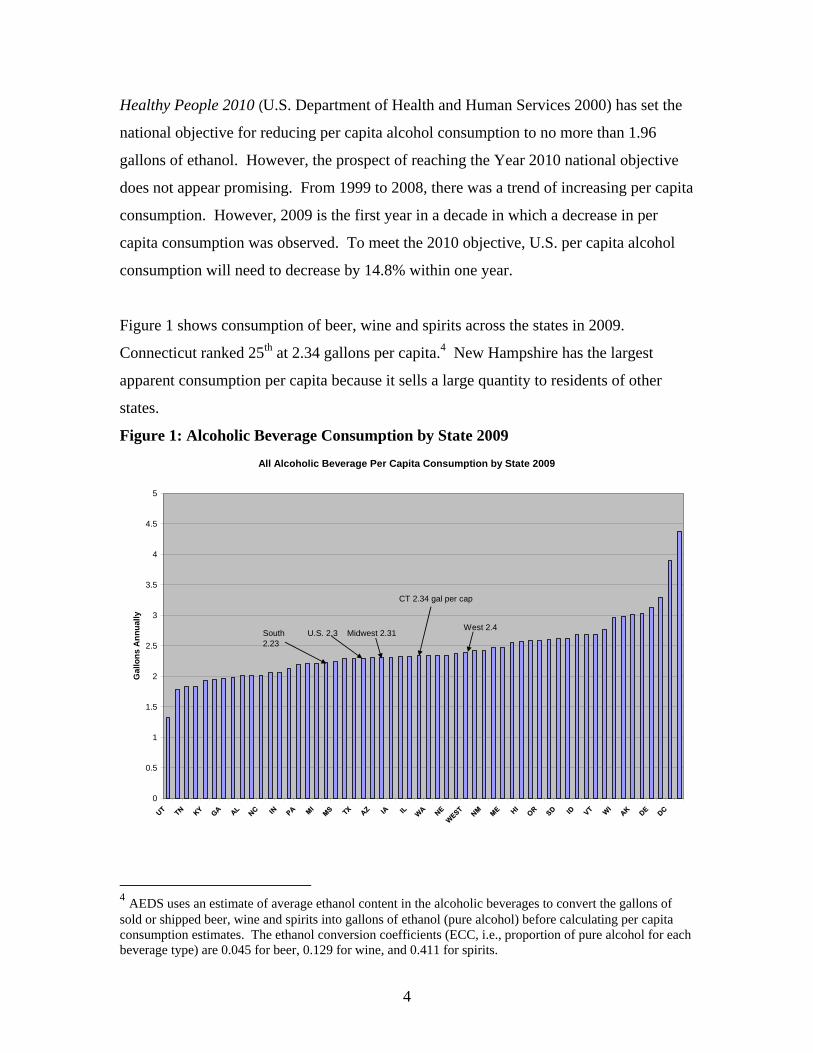
Figure 5 shows Connecticut’s annual per capita consumption of beer, wine and spirits
from 1977 through 2009. We notice that the trend for all alcoholic beverages has been
declining over the past 32 years consistent with the U.S. trend. The trend for all alcoholic
beverages is the sum of the three subtrends for beer, wine and spirits. While the trend for
Connecticut beer consumption has been consistently declining, the trend for spirits
consumption declined until about 1996 and was flat until 2002 when a slight uptrend
occurred. Connecticut wine consumption has slowly but steadily increased over the
period.

6
Figure 3: Per Capita Wine Consumption by State 2009
Wine Per Capita Consumption 2009
0
0.2
0.4
0.6
0.8
1
1.2
WV KS AR OK NE AL SD SC IN OH LA M
O
SOUT
HNM M
D US IL VA NY CO OR
WEST HI CA DE CT VT ID
Gal
lons
Ann
ually CT 0.59
South 0.31
Midwest 0.3
U.S. 0.38
West 0.51
Figure 4: Per Capita Spirits Consumption by State 2009
Spirits Per Capita Consumption 2009
0
0.2
0.4
0.6
0.8
1
1.2
1.4
1.6
1.8
2
WV
OH NC AL VA PA KY NE
SOUT
H VT IA IN WA AZ HI
WEST SC OR M
O LA NJ SD RI CO WY
AK ND DC
Gal
lons
Ann
ually
CT 0.86
South 0.69U.S. 0.74
Midwest 0.77West 0.77
7
Figure 5: Historic Consumption of Beer, Wine and Spirits in Connecticut
CT Per Capita Alcohol Consumption 1977-2009
0
0.5
1
1.5
2
2.5
3
1977
1978
1979
1980
1981
1982
1983
1984
1985
1986
1987
1988
1989
1990
1991
1992
1993
1994
1995
1996
1997
1998
1999
2000
2001
2002
2003
2004
2005
2006
2007
2008
2009
Gal
lons
Ann
ually
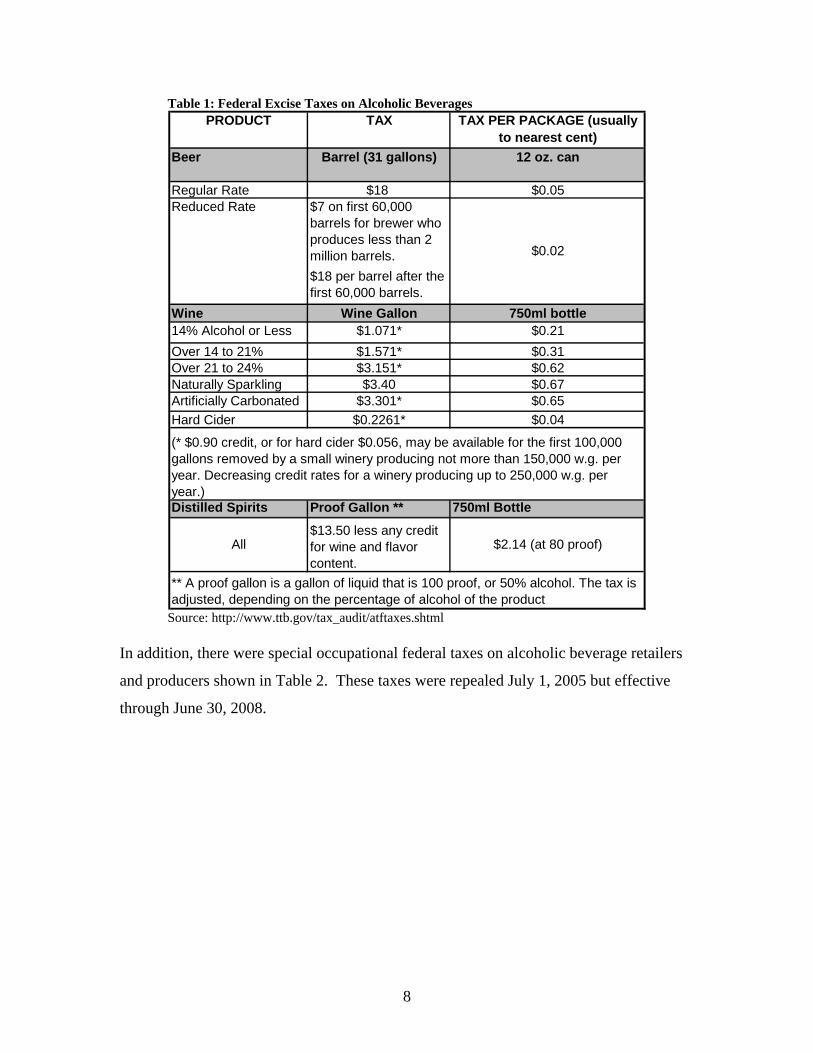
Beer Wine Spirits All beverages Taxes and Tax Revenue Taxes on alcoholic beverages occur at the federal and state levels and may be levied at
the county level as well. Federal taxes are excise or per unit (equivalent alcohol by
volume) taxes paid by the producer of the beverage. State taxes include excise taxes and
sales taxes that are ad valorem or a percent of the final sale price. Table 1 shows federal
excise taxes on alcoholic beverages as of September 2012.
8
Table 1: Federal Excise Taxes on Alcoholic Beverages PRODUCT TAX TAX PER PACKAGE (usually
to nearest cent)Beer Barrel (31 gallons) 12 oz. can
Regular Rate $18 $0.05 $7 on first 60,000 barrels for brewer who produces less than 2 million barrels.$18 per barrel after the first 60,000 barrels.
Wine Wine Gallon 750ml bottle14% Alcohol or Less $1.071* $0.21 Over 14 to 21% $1.571* $0.31 Over 21 to 24% $3.151* $0.62 Naturally Sparkling $3.40 $0.67 Artificially Carbonated $3.301* $0.65 Hard Cider $0.2261* $0.04
Distilled Spirits Proof Gallon ** 750ml Bottle
(* $0.90 credit, or for hard cider $0.056, may be available for the first 100,000 gallons removed by a small winery producing not more than 150,000 w.g. per year. Decreasing credit rates for a winery producing up to 250,000 w.g. per year.)
Reduced Rate
$0.02
** A proof gallon is a gallon of liquid that is 100 proof, or 50% alcohol. The tax is adjusted, depending on the percentage of alcohol of the product
All$13.50 less any credit for wine and flavor content.
$2.14 (at 80 proof)
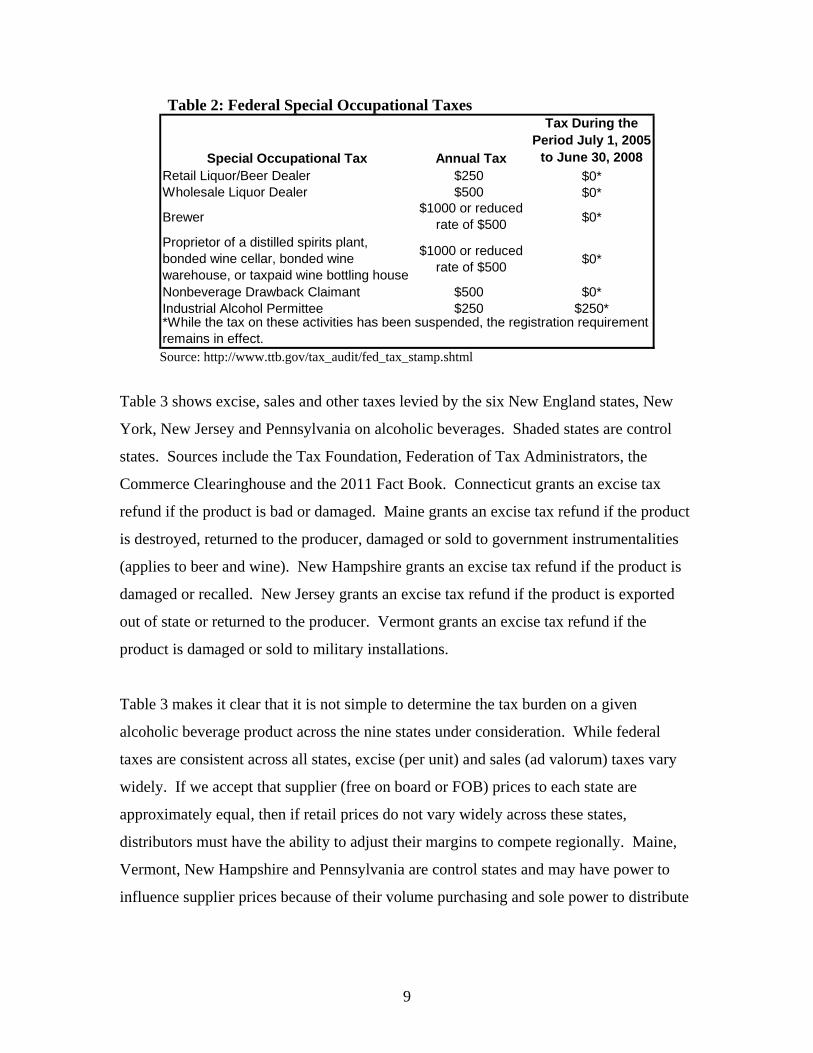
Source: http://www.ttb.gov/tax_audit/atftaxes.shtml In addition, there were special occupational federal taxes on alcoholic beverage retailers
and producers shown in Table 2. These taxes were repealed July 1, 2005 but effective
through June 30, 2008.
9
Table 2: Federal Special Occupational Taxes
Special Occupational Tax Annual Tax
Tax During the Period July 1, 2005
to June 30, 2008Retail Liquor/Beer Dealer $250 $0*Wholesale Liquor Dealer $500 $0*
Brewer$1000 or reduced
rate of $500 $0*
Proprietor of a distilled spirits plant, bonded wine cellar, bonded wine warehouse, or taxpaid wine bottling house
$1000 or reduced rate of $500 $0*
Nonbeverage Drawback Claimant $500 $0*Industrial Alcohol Permittee $250 $250**While the tax on these activities has been suspended, the registration requirement remains in effect.
Source: http://www.ttb.gov/tax_audit/fed_tax_stamp.shtml
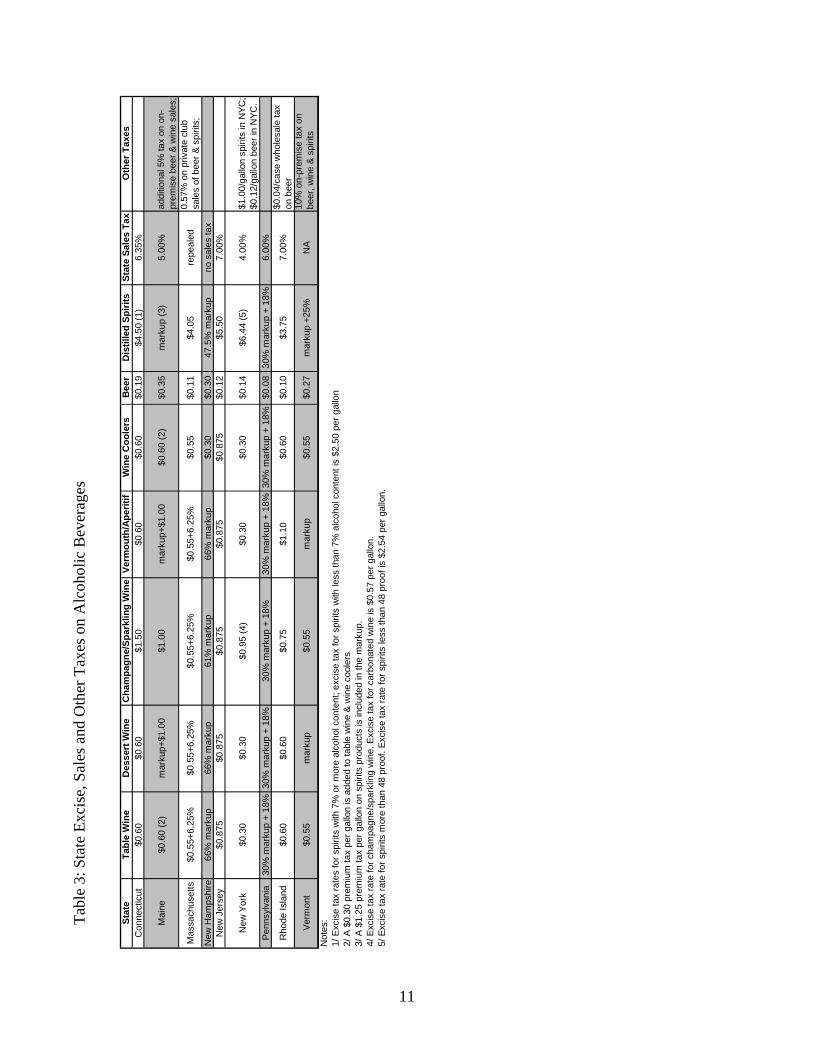
Table 3 shows excise, sales and other taxes levied by the six New England states, New
York, New Jersey and Pennsylvania on alcoholic beverages. Shaded states are control
states. Sources include the Tax Foundation, Federation of Tax Administrators, the
Commerce Clearinghouse and the 2011 Fact Book. Connecticut grants an excise tax
refund if the product is bad or damaged. Maine grants an excise tax refund if the product
is destroyed, returned to the producer, damaged or sold to government instrumentalities
(applies to beer and wine). New Hampshire grants an excise tax refund if the product is
damaged or recalled. New Jersey grants an excise tax refund if the product is exported
out of state or returned to the producer. Vermont grants an excise tax refund if the
product is damaged or sold to military installations.
Table 3 makes it clear that it is not simple to determine the tax burden on a given
alcoholic beverage product across the nine states under consideration. While federal
taxes are consistent across all states, excise (per unit) and sales (ad valorum) taxes vary
widely. If we accept that supplier (free on board or FOB) prices to each state are
approximately equal, then if retail prices do not vary widely across these states,
distributors must have the ability to adjust their margins to compete regionally. Maine,
Vermont, New Hampshire and Pennsylvania are control states and may have power to
influence supplier prices because of their volume purchasing and sole power to distribute
10
and sell at retail. This seems to be the case in New Hampshire and possibly
Pennsylvania.
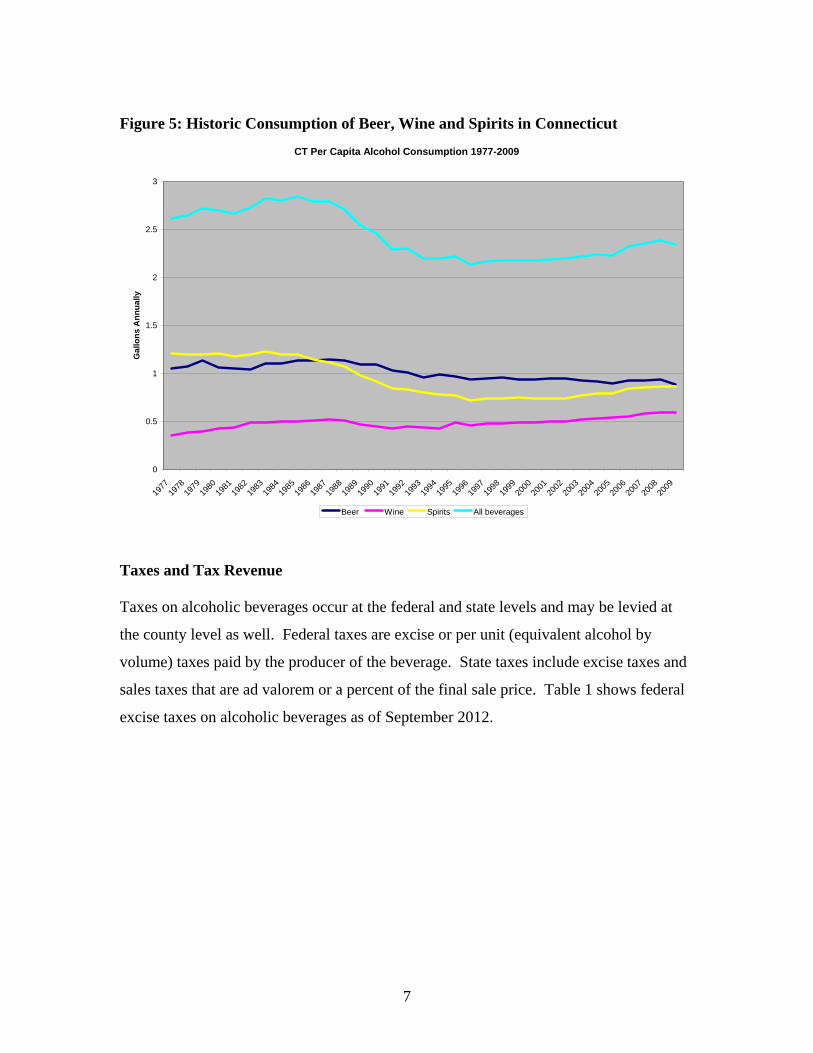
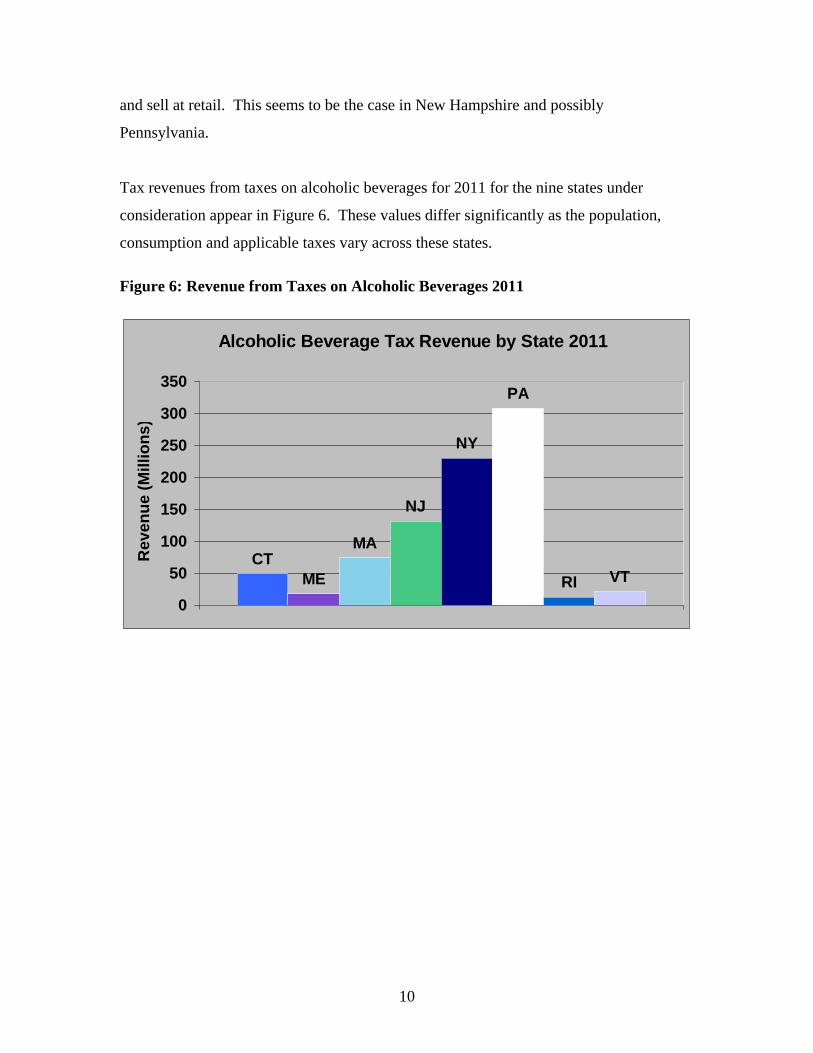
Tax revenues from taxes on alcoholic beverages for 2011 for the nine states under
consideration appear in Figure 6. These values differ significantly as the population,
consumption and applicable taxes vary across these states.
Alcoholic Beverage Tax Revenue by State 2011
CTME
MA
NJ
NY
PA
RI VT
0
50
100
150
200
250
300
350
Rev
enue
(Mill
ions
)
Figure 6: Revenue from Taxes on Alcoholic Beverages 2011
11
Stat
eTa
ble
Win
eD
esse
rt W
ine
Cha
mpa
gne/
Spar
klin
g W
ine
Verm
outh
/Ape
ritif
Win
e C
oole
rsB
eer
Dis
tille
d Sp
irits
Stat
e Sa
les
Tax
Oth
er T
axes
Con
nect
icut
$0.6
0$0
.60
$1.5
0$0
.60
$0.6
0$0
.19
$4.5
0 (1
)6.
35%
Mai
ne$0
.60
(2)
mar
kup+
$1.0
0$1
.00
mar
kup+
$1.0
0$0
.60
(2)
$0.3
5m
arku
p (3
)5.
00%
addi
tiona
l 5%
tax
on o
n-pr
emis
e be
er &
win
e sa
les;
Mas
sach
uset
ts$0
.55+
6.25
%$0
.55+
6.25
%$0
.55+
6.25
%$0
.55+
6.25
%$0
.55
$0.1
1$4
.05
repe
aled
0.57
% o
n pr
ivat
e cl
ub
sale
s of
bee
r & s
pirit
s;N
ew H
amps
hire
66%
mar
kup
66%
mar
kup
61%
mar
kup
66%
mar
kup
$0.3
0$0
.30
47.5
% m
arku
pno
sal
es ta
xN
ew J
erse
y$0
.875
$0.8
75$0
.875
$0.8
75$0
.875
$0.1
2$5
.50
7.00
%
New
Yor
k$0
.30
$0.3
0$0
.95
(4)
$0.3
0$0
.30
$0.1
4$6
.44
(5)
4.00
%$1
.00/
gallo
n sp
irits
in N
YC;
$0.1
2/ga
llon
beer
in N
YC.
Penn
sylv
ania
30%
mar
kup
+ 18
%30
% m
arku
p +
18%
30%
mar
kup
+ 18
%30
% m
arku
p +
18%
30%
mar
kup
+ 18
%$0
.08
30%
mar
kup
+ 18
%6.
00%
Rho
de Is
land
$0.6
0$0
.60
$0.7
5$1
.10
$0.6
0$0
.10
$3.7
57.
00%
$0.0
4/ca
se w
hole
sale
tax
on b
eer
Ver
mon
t$0
.55
mar
kup
$0.5
5m
arku
p$0
.55
$0.2
7m
arku
p +2
5%N
A10
% o
n-pr
emis
e ta
x on
be
er, w
ine
& s
pirit
sN
otes
: 1/
Exc
ise
tax
rate
s fo
r spi
rits
with
7%
or m
ore
alco
hol c
onte
nt; e
xcis
e ta
x fo
r spi
rits
with
less
than
7%
alc
ohol
con
tent
is $
2.50
per
gal
lon
2/ A
$0.
30 p
rem
ium
tax
per g
allo
n is
add
ed to
tabl
e w
ine
& w
ine
cool
ers
3/ A
$1.
25 p
rem
ium
tax
per g
allo
n on
spi
rits
prod
ucts
is in
clud
ed in
the
mar
kup.
4/ E
xcis
e ta
x ra
te fo
r cha
mpa
gne/
spar
klin
g w
ine.
Exc
ise
tax
for c
arbo
nate
d w
ine
is $
0.57
per
gal
lon.
5/ E
xcis
e ta
x ra
te fo
r spi
rits
mor
e th
an 4
8 pr
oof.
Exc
ise
tax
rate
for s
pirit
s le
ss th
an 4
8 pr
oof i
s $2
.54
per g
allo
n.
Tabl
e 3:
Sta
te E
xcis
e, S
ales
and
Oth
er T
axes
on
Alc
ohol
ic B
ever
ages
12
Price Posting and Post and Hold Laws
Connecticut law mandates that each manufacturer (i.e., supplier), wholesaler (i.e.,
distributor) and out-of-state shipper post their prices with the Connecticut Department of
Consumer Protection (DCP) on a monthly basis. Connecticut and 18 other states
mandate that distributors post their prices for the coming period (e.g., the following
month) with the state’s agency responsible for regulating alcoholic beverage sales.
Distributors must hold their posted prices for the duration of the coming period. In
Connecticut, suppliers and distributors must post prices for each product each month,
which will be in effect the following month. Distributors may amend prices within four
days to meet (but not beat) a lower price offered by another wholesaler. Posted prices
may not be changed during the month they are in effect. Liquor and wine distributors
must in addition post a “bottle price” for each product. The bottle price is the actual cost
charged to a retailer and an additional amount determined solely by the distributor.
Distributors must file a schedule of “suggested consumer retail prices”.
As another example, New York’s post and hold law requires beer, wine, and spirits
distributors to file by the fifth day of each month the prices that they intend to charge the
following month. New York wholesalers must hold these prices for the following month.
Hold periods vary with some states mandating longer hold periods for price reductions
than for price increases. Some states’ post and hold laws make planned future prices
available to competing wholesalers and allow wholesalers to adjust their posted prices
downward as in Connecticut. New York law makes posted prices available to
competitors ten days after they are filed and allows distributors three business days to
adjust their prices to meet lower competing prices.5 Table 4 shows the 19 states that
adopted post and hold laws since 1983 (*Washington repealed their post and hold laws in
2008 as a result of a federal appeals court hearing).
5 State alcoholic beverage laws appear in Appendix A. Much of the material for this section comes from the Bureau of Economics, Federal Trade Commission, Working Paper No. 304, “State Regulation of Alcohol Distribution: The Effects of Post & Hold Laws on Consumption and Social Harms,” by James C. Cooper and Joshua D. Wright, September 2010.

13
Table 4: States with Post and Hold Laws State Wine Beer Spirits
Connecticut Y Y YDelaware Off in 1999 Y Off in 1999Georgia N Y YIdaho Y Y NMaine Y Y NMaryland Off in 2004 Off in 2004 Off in 2004Massachusetts Off in 1998 Off in 1998 Off in 1998Michigan Y Y YMissouri Y N YNebraska Off in 1984 N Off in 1984New Jersey Y Y YNew York Y N YOklahoma Y Y YOregon Off in 1990 Off in 1990 NPennsylvania N Off in 1999 NSouth Dakota Y N YTennessee N Y N
WashingtonOn in 1995, Off
2008*On in 1995, Off
2008* N
West Virginia N N Y Source: References cited in footnote 5.
As of mid-2010, ten states had post and hold laws applying to wine wholesalers, nine
states had post and hold laws applying to beer wholesalers, and nine states had post and
hold laws applying to spirit distributors. Since 1983, seven states have repealed their PH
laws, primarily because of court decisions.
Post and hold laws require distributors to adhere to the prices they announce and thus
they make a credible commitment to charge announced prices subject to amendment
where possible. The history of announced prices provides distributors with information
useful in setting future prices and shows who the leading price setters were. It is
conceivable that announcing wholesale prices before the period of final sale may reduce
competition by discouraging distributors from undercutting (e.g., by offering discounts to
certain retailers) each other.6 Several courts have found that post and hold laws mimic
agreements between rival distributors to hold prices, which constitute per se illegal
6 Cooper and Wright (2010) cite evidence for this effect.
14
conduct under the Sherman Act. In one case, a distributor testified that he and rival
wholesalers used the public posting to reach an agreement on a new price for beer.
Holding requirements make experimenting with price reductions untenable for
distributors especially in states where price-holding requirements are relatively longer.
Longer price holding periods expose distributors to fluctuations in supply and demand
that may increase their costs.
Cooper and Wright (see footnote 5) discuss the consequences of post and hold laws with
respect to the Sherman Act and the 21st Amendment that gave states exclusive rights to
regulate the importation and transportation of alcoholic beverages within their borders.
These two federal legal constructs are in tension and courts have to decide each case on
its merits. As mentioned above, several states have abandoned their post and hold laws
because of court challenges and there may be others in process.
If post and hold laws reduce competition, they may promote higher prices and thereby
reduce consumption. Reduced consumption may be a public policy objective in that
public health and safety are improved. One must consider whether increased prices
achieve the objective or if there are other potentially more effective means of improving
public health and safety where alcohol is concerned such as zero tolerance and reduced
blood alcohol content laws. With respect to increased prices, one must consider the
responsiveness or sensitivity of consumption changes to price changes that result from
tax changes and other contributors to overall cost such as convenience (these are time
costs arising from the availability of product) and regulatory costs.
If a ten percent increase in the price of an alcoholic beverage occurs, what will be the
percent change in consumption? Several studies estimate the short- and long-run
sensitivities (economists call them elasticities) of consumption to price changes. These
studies are contained in the research papers cited in footnotes 5 and 7. Elasticities less
than one mean that a ten-percent price increase will result in a less than ten-percent
reduction in consumption. Elasticities greater than one mean that a ten-percent price
15
increase will result in a more than ten-percent reduction in consumption. Long-run (a
period of a year or more) elasticities are larger than short-run elasticities because in the
long run, people can find suitable substitutes for the higher-priced beverage.
Chaloupka, Grossman and Saffer (2002) cite evidence from several studies that estimate
the price elasticities of demand for beer, wine, and distilled spirits are -0.3, -1.0, and -1.5,
respectively.7 This means that a ten percent increase in the retail price for beer reduces
consumption by three percent, reduces wine consumption by ten percent and reduces
consumption of spirits by 15 percent. These estimates suggest that beer consumption is
relatively insensitive to price increases, while wine consumption decreases in the same
percentage as its price increases. The consumption of spirits is quite responsive to price
increases as people reduce consumption and/or find reasonably close substitutes. These
are estimates based on a large sample of alcoholic beverage consumers and several
studies and represent a best summary guess at the elasticities for the three beverage
categories. Other studies look at the price elasticity of demand for alcoholic beverages as
a whole and some studies differentiate among teenage drinkers, heavy and binge drinkers.
Elasticity estimates for these groups vary widely.8 Long-run estimates corresponding to
the three presented above are somewhat larger.
Cooper and Wright (2010, see footnote 5) perform econometric analysis to determine the
effects of post and hold laws on consumption and public health and safety. If post and
hold laws act as a tax, the effective price increases should show up in reduced
consumption and social harms such as teen drinking and drunk driving among others.
Their results indicate a small effect of post and hold laws on consumption perhaps
because the tax effect is quite small relative to other retail price determinants. In
addition, Cooper and Wright (2010) find that post and hold laws do not reduce social
harms as much as targeted penalties such as zero tolerance and reductions in blood
alcohol content that impact offenders and not the responsible consumer. Further, post 7 Chaloupka, F. A., Grossman, M. and H. Saffer (2002), “The Effects of Price on Alcohol Consumption and Alcohol-Related Problems,” NIAA paper, pubs.niaaa.nih.gov/publications/arh26-1/22-34.pdf. 8 See the blogs at http://offsettingbehaviour.blogspot.com/2012/07/price-elasticity-of-alcohol-demand.html and cites therein and the PowerPoint by Chaloupka, et al. at tigger.uic.edu/~fjc/Presentations/Slides/alcohol_policy_XI1.ppt
16
and hold laws to the extent they benefit distributors are not as effective at reducing
consumption as taxes that return money to the state for alcohol abuse programs and
education. Finally, to the extent that post and hold laws are anticompetitive, they invite
challenges that in many cases have resulted in states abandoning them.
Alcoholic Beverage Permitting
Permitting regulations determine what beverages can be sold in what venues at what days
and times and what other goods can (must) be sold in these venues and other constraints.
The DCP provided an overview of Connecticut’s current liquor permitting regulations
attached as Appendix B. In 2004, the Legislative Program Review and Investigations
Committee produced a report on the state’s liquor permitting regulations and made
several recommendations.9 They noted that in 2004 the DCP administered more than 60
types of liquor permits through the provisions of the state Liquor Control Act (C.G.S.
Chapter 545). Under the system at the time, permits with varying fees and regulatory
requirements were based on the type of alcohol (e.g., beer, wine, all liquor) served and/or
sold and the nature of the business operation. The then existing permit structure resulted
in different permits issued to substantially similar establishments, for example, to
restaurants, cafes and taverns. Another impact of the system (in 2004) is that permit
categories had to be added or revised to reflect new or slightly different business
operations. Legislation enacted in 2003 to ban smoking in restaurants and bars raised
questions about the growing complexity of Connecticut’s liquor permitting structure.
The LPRIC report reviews liquor control policies and the role of governments in
regulating alcoholic beverage distribution and sale. The report analyzed the type,
purpose and fees of state liquor permits with a goal of simplifying and clarifying the
regulatory structure. LPRIC examined how liquor permitting addresses local community
concerns regarding regulated entities as well. Specifically, the 2004 LPRIC study
analyzed:
9 The report is available at http://www.cga.ct.gov/2004/pridata/Studies/pdf/Liquor_Permits_Final_Report.pdf.
17
What types of liquor permits were issued in 2004 and what regulatory
requirements and fees were associated with each type?
What was the purpose of each permit type and to what extent was there overlap or
duplication in 2004?
What was the basis for the 2004 fees and how were these fees related to permit
type and purpose?
How did Connecticut’s liquor permit structure compare to those in states with
similar regulatory systems in 2004?
What impact did the 2004 permit structure have on regulatory efficiency and
effectiveness?
How did state permitting consider and respond to local community concerns
about the location and operation of regulated entities in 2004?
What implications would changes to the state permit and fee structures have had
with respect to federal and local liquor regulation in 2004?
What changes were needed to simplify and clarify the then existing liquor permit
and fee structure in 2004?
In addition, the LPRIC 2004 report describes Connecticut’s liquor regulatory system at
the time and reviews the initiatives intended to streamline the system. The study did not
address the administration of the permitting process and liquor permit enforcement
activities. Based on its analysis, LRPRIC made recommendations to streamline the
liquor regulatory system and in the process reduce regulatory costs to the state and costs
to businesses making, distributing, selling and serving alcoholic beverages. The LPRIC
report could be updated to reflect current law and alcoholic beverage permitting
regulations and its recommendations could be considered for implementation.
The review of the LPRIC study is in lieu of a detailed comparison of the nine states’
liquor permitting regulations that would take more time than is available to complete this
report. A detailed review and comparison of the liquor permitting regulations in the nine
states may not be productive as it may reveal different public policy objectives and the
uniqueness of the state’s approach to achieve them. Further, the complexity of state
18
permitting regulations renders a comparison among the nine states difficult to interpret.
If Connecticut’s permitting regulations were streamlined as LRIC recommends, a
comparison with other states would be less arduous.
Alcoholic Beverage Pricing Practices
As mentioned above the three-tier system of production, distribution to retailers and final
sale to consumers intends to avoid the problems of the pre-Prohibition era and provide
independent ownership of firms in each tier.10 Some states elected to be the distributor
and retailer and currently comprise the 18 control states. Ostensibly, the three-tier
structure makes tax collection by the states and the federal government easier. Firms in
each tier have costs and markups over cost to provide a reasonable or normal profit.11 If
profits in a market (tier) were abnormally high, firms would enter the market segment
and drive down prices as the supply of the product increased. This would happen in a
perfectly competitive market. To the extent there are barriers to entry, whether legal or
high levels of required startup capital for example, firms able to produce, distribute or
retail the product at lower cost cannot enter the market. The fact that the U.S. market is
legally segmented prevents vertical integration of production, distribution and final sale
except in control states where the latter two functions are accomplished by state
monopoly. This structure has benefits and costs to consumers. One benefit to consumers
is that governments at each level have great control over the distribution and sale of
alcoholic beverages through taxes and regulations that ostensibly mitigate social harms
associated with excess consumption. The market and regulatory structure may increase
costs unnecessarily for consumers because market structures that are more efficient are
forbidden. In addition, the three-tier structure invites challenges from international
producers and distributors as well as domestic big box retailers.
Producers set the price of their product based on their costs of production and a
reasonable profit. They sell to Connecticut distributors at the free on board (FOB) price,
10 There are some exceptions to this structure, for example brewpubs and farm wineries that sell directly to consumers. 11 A reasonable or normal profit is a return that anyone could make investing similar resources in this or similar industry.
19
say $35 for a case of some alcoholic beverage. The federal excise tax is $30 on this case
and the Connecticut state excise tax is $15 on this case. It costs the distributor $2 to ship
this case to a retailer yielding a laid in (that is, FOB+federal tax+state tax+S&H) cost
before a depletion allowance may be applied12 of $82 to the retailer. With a distributor
gross profit of $23 or 21.9%, the price to the retailer is $105.13 Connecticut law forbids
retailers from selling the case below this price.14 The minimum retail price for a single
bottle of this case is $105/12 plus a per bottle charge for breaking the case (eight cents).
The distributor must post the case and bottle price below which the retailer cannot sell.
The posted prices therefore contain the retailer’s markup that the retailer may increase as
desired. The retail pricing system in Connecticut therefore establishes a price floor that
typically encourages greater supply of the product and simultaneously less demand
because prices are higher than the free market would otherwise dictate. Depletion
allowances granted by suppliers ensure that the distributor and the retailer will be price
competitive with surrounding regions product by product.
This pricing process is largely followed in many license states in which the three-tier
system exists. Suppliers want their product to move and they must provide distributors
with acceptable profit margins and consumers with competitive prices. Therefore,
pricing works backwards from a proposed retail price to an acceptable distributor margin
to an acceptable FOB price that includes costs of production and reasonable or normal
producer profit. The process may be iterative, moving backward and forward until an
acceptable price to retailers and margins to the distributor are determined.
In Massachusetts for example, retailers may not sell below the distributor’s invoice price
(we ignore quantity discounts for the moment). The price-setting mechanism for
Massachusetts distributors is likely similar to Connecticut distributors’ process.
Similarly, in Rhode Island the case price (cost) of the retail licensee’s alcoholic beverage is
the distributor’s invoice price. The retail cost of a bottle or drink is then determined by 12 A depletion allowance is a rebate, discount or other inducement given to a distributor as a sales promotion. 13 According to First Research Industry Profiles, the average gross profit for the U.S. beer, wine and spirit wholesalers industry is between 20% and 25%. The average net income is 2.5% for this industry. 14 See for example, OLR Research Report 2009-R-0171, April 6, 2009 for a summary.
20
dividing the total price by the number of bottles or single drinks included in the total figure.
If the “price” figure works out to a fractional cent, the lowest amount at which the bottle or
drink may be sold by the retailer is the next highest cent.15 New Jersey uses the same retail
pricing process.16 It is reasonable to assume that distributors in these (and other license)
states use the process described above to establish their selling prices to retailers. Suppliers’
depletion allowances provide room to adjust distributors’ prices to retailers ensuring their
profitability as well as the profitability of the distributor tier. Thus, it appears that
Connecticut’s minimum bottle pricing requirement is similar to other license states’
requirement that retailers cannot sell below their cost of acquisition (the invoice price). The
difference appears to be that the Connecticut distributor in posting (and holding) the
minimum retail price is determining the retailer’s minimum profit.
There are exceptions in some states in which large retailers may negotiate directly with
suppliers and where retailers may contract with a (wine) supplier to provide a private label
product to the retailer. There are national distributors that may have bargaining power with
certain suppliers that state-bound distributors do not. Further, control states have monopoly
pricing power over wholesale and retail sales and their pricing mechanisms are in many cases
invisible. This makes region-to-region price comparisons difficult. This problem is further
complicated because some states allow quantity discounts. These are reductions in the
distributor’s price to retailers conditioned on the quantity ordered. This pricing mechanism
allows large retailers or owners of several retail establishments to reduce their cost of
acquisition and pass these savings on to consumers. This practice may put pressure on small
retailers.
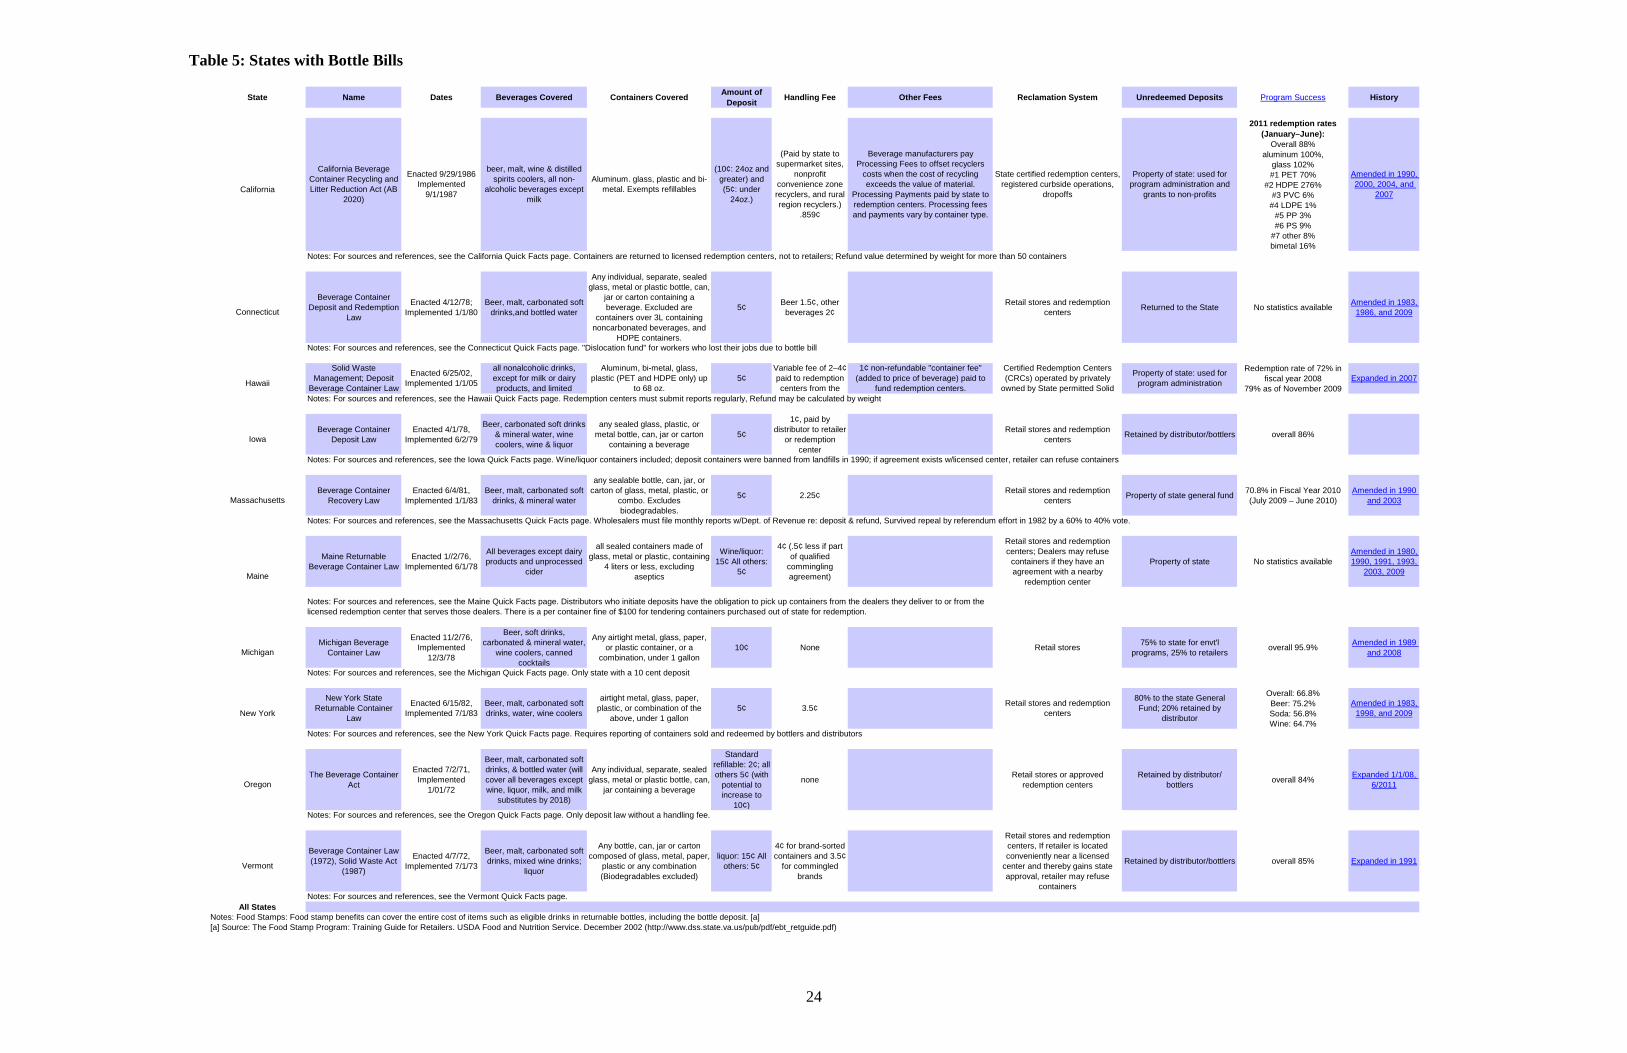
Bottle Bill States
Though not part of the charge of the Task Force, we examined states that currently have
bottle bills and states that once had them and have since abandoned them. Table 5 shows
the states with bottle bill laws as of November 2012. In May 2010, Delaware repealed its
bottle bill requiring a five-cent deposit and replaced it with a controversial four-cent 15 Rule 28 in the Rhode Island Commercial Licensing Regulation 8, Liquor Control Administration, page 17. Available at www.dbr.ri.gov/documents/divisions/commlicensing/liquor/Commercial_Licensing_Regulation_8.pdf. 16 From the “Alcoholic Beverage Control Handbook for Retail Licensees,” page 21. Available at www.nj.gov/oag/abc/downloads/abchandbook02.pdf.
21
recycling fee. Delaware officials testified that the state’s bottle recycling rate was 12
percent because many retailers refused to accept returned bottles, while recycling rates
range from 70% to 97% (Michigan) in the ten other states with bottle bills. The four-cent
per container recycling fee intends to provide start-up funds to help waste-haulers start
single-stream curbside recycling. The fee is scheduled for sunset Dec. 1, 2014 or after
$22 million is raised. The bill mandates that all municipal and private waste haulers
provide curbside recycling pickup for single-family homes starting Sept. 15, 2011, for
multi-family residences starting Jan. 1 2013 and for commercial sites by 2014. Retailers
have to remit the four-cent per bottle fee to the Division of Revenue. Retailers must also
obtain a State of Delaware Retail Beverage Container Business License (at no cost) for
each location at which the four-cent beverage containers are sold. The four-cent fee must
be remitted monthly to the Division of Revenue on before the 30th day of each month,
for beverage containers sold the previous month.
While single-stream recycling ostensibly makes collecting recyclable material easier for
households and businesses, the costs and benefits of bottle bills compared to single-
stream recycling is unclear. Vermont intends to study the costs and benefits of single-
stream recycling and their bottle bill because of a new law passed in 2012.17 The debate
occurs in other states as well, for example, Tennessee.18 The issue is complicated by the
tradeoffs between the convenience of disposing of all recyclable material in one container
at curbside and collecting and transporting containers subject to the fee (an incentive) to a
recycling center, typically a supermarket or alcoholic beverage retailer. In addition, there
are overhead costs associated with the bottle bill administration and maintenance of
collection centers’ equipment. Single-stream recycling mixes low-value recyclables
(e.g., corrugated cardboard) with high-value material such as aluminum without
maintaining collection centers at retail outlets. Machines in supermarkets mix glass of
different colors rendering it less useful for recycled use, while single-stream processors
can separate glass by color to some degree. However, single-stream material recovery
centers have higher costs than when households and businesses separated recyclables and
17 See http://www.wasterecyclingnews.com/article/20120706/NEWS02/120709961/after-passing-anti-landfill-law-vermont-seeks-someone-to-study-likely-impact. 18 See http://www.discoveret.org/pipermail/eqab-list/2010-February/000426.html.

22
cross-contamination (e.g., plastic and glass shards mixed with paper) creates lower value
recyclable material.19
There are alternatives to single-stream recycling such as dual stream in which households
combine their food and beverage containers (aluminum and steel cans, glass jars and
bottles, and some or all plastic bottles) in one bin and put their newspapers and/or mixed
paper in another bin or in a paper grocery bag. The two material streams are picked up
curbside, placed in separate compartments on the recycling truck and taken to a material
recovery center. The fiber is sent to market with little or no processing and containers go
through a variety of automated sorting equipment and handpicking before being baled or
containerized and sent to market. In Oregon, most household recycling and much
commercial recycling is collected as mixed material. Oregon programs pick up glass
containers separate from other materials or do not include glass in the curbside collection
program, instead collecting glass through recycling depots or some other method. This is
unlike single-stream collection programs in much of the nation that collect all materials
including glass together.
While the goals of bottle bills are to increase recycling, reduce litter, reduce waste
disposal costs and landfill requirements and create jobs in recycling-related industries,
among others, there are tradeoffs compared to single- or dual-stream recycling. Several
states have expanded their bottle bills and some have attempted repeal (Maine and
Iowa).20 Nevada like Vermont passed a bill to study the bottle bill issue. It will be
informative to read these studies’ results.
Unclaimed bottle deposits known as escheats accrued to Connecticut distributors prior to
2010. Escheats consisted of soft drink and beer container unclaimed container deposits,
however, with the passage of PA 09-2, water bottles were added to the bottle deposit
category effective April 1, 2009. Further, on July 1, 2010, the state began claiming
escheats and these included water bottles. There was a brief transition as water bottles
19 See http://www.container-recycling.org/index.php/issues/single-stream-recycling. 20 See http://www.bottlebill.org/legislation/campaigns.htm.
23
were added and then escheats were turned over to the state. The question of the escheats
collected prior to and after water bottles were added to the bottle bill is not easily
answered because the state began collecting escheats from all unclaimed deposits around
the same time.
24
State Name Dates Beverages Covered Containers Covered Amount of Deposit Handling Fee Other Fees Reclamation System Unredeemed Deposits Program Success History
2011 redemption rates (January–June):
Overall 88%aluminum 100%,
glass 102%#1 PET 70%
#2 HDPE 276%#3 PVC 6%
#4 LDPE 1%#5 PP 3%#6 PS 9%
#7 other 8%bimetal 16%
Notes: For sources and references, see the California Quick Facts page. Containers are returned to licensed redemption centers, not to retailers; Refund value determined by weight for more than 50 containers
Beverage Container Deposit and Redemption
Law
Enacted 4/12/78; Implemented 1/1/80
Beer, malt, carbonated soft drinks,and bottled water
Any individual, separate, sealed glass, metal or plastic bottle, can,
jar or carton containing a beverage. Excluded are
containers over 3L containing noncarbonated beverages, and
HDPE containers.
5¢ Beer 1.5¢, other beverages 2¢
Retail stores and redemption centers Returned to the State No statistics available Amended in 1983,
1986, and 2009
Notes: For sources and references, see the Connecticut Quick Facts page. "Dislocation fund" for workers who lost their jobs due to bottle bill
Redemption rate of 72% in fiscal year 2008
79% as of November 2009Notes: For sources and references, see the Hawaii Quick Facts page. Redemption centers must submit reports regularly, Refund may be calculated by weight
Beverage Container Deposit Law
Enacted 4/1/78, Implemented 6/2/79
Beer, carbonated soft drinks & mineral water, wine coolers, wine & liquor
any sealed glass, plastic, or metal bottle, can, jar or carton
containing a beverage5¢
1¢, paid by distributor to retailer
or redemption center
Retail stores and redemption centers Retained by distributor/bottlers overall 86%
Notes: For sources and references, see the Iowa Quick Facts page. Wine/liquor containers included; deposit containers were banned from landfills in 1990; if agreement exists w/licensed center, retailer can refuse containers
Beverage Container Recovery Law
Enacted 6/4/81, Implemented 1/1/83
Beer, malt, carbonated soft drinks, & mineral water
any sealable bottle, can, jar, or carton of glass, metal, plastic, or
combo. Excludes biodegradables.
5¢ 2.25¢ Retail stores and redemption centers Property of state general fund 70.8% in Fiscal Year 2010
(July 2009 – June 2010)Amended in 1990
and 2003
Notes: For sources and references, see the Massachusetts Quick Facts page. Wholesalers must file monthly reports w/Dept. of Revenue re: deposit & refund, Survived repeal by referendum effort in 1982 by a 60% to 40% vote.
Maine Returnable Beverage Container Law
Enacted 1//2/76, Implemented 6/1/78
All beverages except dairy products and unprocessed
cider
all sealed containers made of glass, metal or plastic, containing
4 liters or less, excluding aseptics
Wine/liquor: 15¢ All others:
5¢
4¢ (.5¢ less if part of qualified
commingling agreement)
Retail stores and redemption centers; Dealers may refuse
containers if they have an agreement with a nearby
redemption center
Property of state No statistics availableAmended in 1980, 1990, 1991, 1993,
2003, 2009
Michigan Beverage Container Law
Enacted 11/2/76, Implemented
12/3/78
Beer, soft drinks, carbonated & mineral water,
wine coolers, canned cocktails
Any airtight metal, glass, paper, or plastic container, or a
combination, under 1 gallon10¢ None Retail stores 75% to state for envt'l
programs, 25% to retailers overall 95.9% Amended in 1989 and 2008
Notes: For sources and references, see the Michigan Quick Facts page. Only state with a 10 cent deposit
Overall: 66.8%Beer: 75.2%Soda: 56.8%Wine: 64.7%
Notes: For sources and references, see the New York Quick Facts page. Requires reporting of containers sold and redeemed by bottlers and distributors
The Beverage Container Act
Enacted 7/2/71, Implemented
1/01/72
Beer, malt, carbonated soft drinks, & bottled water (will cover all beverages except wine, liquor, milk, and milk
substitutes by 2018)
Any individual, separate, sealed glass, metal or plastic bottle, can,
jar containing a beverage
Standard refillable: 2¢; all others 5¢ (with
potential to increase to
10¢)
none Retail stores or approved redemption centers
Retained by distributor/ bottlers overall 84% Expanded 1/1/08,
6/2011
Notes: For sources and references, see the Oregon Quick Facts page. Only deposit law without a handling fee.
Beverage Container Law (1972), Solid Waste Act
(1987)
Enacted 4/7/72, Implemented 7/1/73
Beer, malt, carbonated soft drinks, mixed wine drinks;
liquor
Any bottle, can, jar or carton composed of glass, metal, paper,
plastic or any combination (Biodegradables excluded)
liquor: 15¢ All others: 5¢
4¢ for brand-sorted containers and 3.5¢
for commingled brands
Retail stores and redemption centers, If retailer is located conveniently near a licensed
center and thereby gains state approval, retailer may refuse
containers
Retained by distributor/bottlers overall 85% Expanded in 1991
Notes: For sources and references, see the Vermont Quick Facts page.All States
Notes: Food Stamps: Food stamp benefits can cover the entire cost of items such as eligible drinks in returnable bottles, including the bottle deposit. [a][a] Source: The Food Stamp Program: Training Guide for Retailers. USDA Food and Nutrition Service. December 2002 (http://www.dss.state.va.us/pub/pdf/ebt_retguide.pdf)
California
California Beverage Container Recycling and Litter Reduction Act (AB
2020)
Enacted 9/29/1986 Implemented
9/1/1987
beer, malt, wine & distilled spirits coolers, all non-
alcoholic beverages except milk
Aluminum. glass, plastic and bi-metal. Exempts refillables
(10¢: 24oz and greater) and (5¢: under
24oz.)
(Paid by state to supermarket sites,
nonprofit convenience zone recyclers, and rural region recyclers.)
.859¢
Beverage manufacturers pay Processing Fees to offset recyclers
costs when the cost of recycling exceeds the value of material.
Processing Payments paid by state to redemption centers. Processing fees and payments vary by container type.
State certified redemption centers, registered curbside operations,
dropoffs
Property of state: used for program administration and
grants to non-profits
Amended in 1990, 2000, 2004, and
2007
Connecticut
Hawaii
Solid Waste Management; Deposit
Beverage Container Law
Enacted 6/25/02, Implemented 1/1/05
all nonalcoholic drinks, except for milk or dairy products, and limited
Aluminum, bi-metal, glass, plastic (PET and HDPE only) up
to 68 oz.5¢
Variable fee of 2–4¢ paid to redemption centers from the
1¢ non-refundable "container fee" (added to price of beverage) paid to
fund redemption centers.
Certified Redemption Centers (CRCs) operated by privately
owned by State permitted Solid
Property of state: used for program administration Expanded in 2007
Iowa
Massachusetts
Maine
Michigan
Notes: For sources and references, see the Maine Quick Facts page. Distributors who initiate deposits have the obligation to pick up containers from the dealers they deliver to or from the licensed redemption center that serves those dealers. There is a per container fine of $100 for tendering containers purchased out of state for redemption.
New York
New York State Returnable Container
Law
Enacted 6/15/82, Implemented 7/1/83
Beer, malt, carbonated soft drinks, water, wine coolers
airtight metal, glass, paper, plastic, or combination of the
above, under 1 gallon5¢ 3.5¢ Retail stores and redemption
centers
80% to the state General Fund; 20% retained by
distributor
Amended in 1983, 1998, and 2009
Oregon
Vermont
Table 5: States with Bottle Bills

25
Economic Impact
We need to be clear what we mean by economic impact, that is, the economic impact of
what on whom? As well, we need to define economic impact. In the context of alcoholic
beverage manufacture, distribution and final sale, we mean to discuss the structure of the
industry, the legal environment in which it operates and the consequences of these factors
and public policies on consumers, distributors and suppliers. Some of these topics have
been covered above, namely, the three-tier industry structure, product price posting and
holding and the minimum prices at which alcoholic beverages can sold at retail each of
which is mandated by Connecticut statute. In addition, we mentioned federal and state
taxes on alcoholic beverages and the restrictions on availability that impose monetary and
time costs on consumers. One approach to the economic impact is to assess the effects of
current industry structure and public polices on pricing and availability on consumer and
producer (supplier) welfare or wellbeing. Economists like to talk about market efficiency
and the equity of distribution of goods and services. We assess economic impact in these
contexts and note that economic impact typically measures changes in welfare, efficiency
and equity as a result of changes in the industry and/or public policy changes. In the
absence of significant changes, notwithstanding the public policy changes affecting
availability enacted in 2012, we attempt an analysis of the status quo.
Taxes drive a wedge between buyers and sellers of a product which means the market
contracts and buyers pay a higher price and sellers receive a lower price than before the
tax was imposed. The contraction of the market creates a deadweight loss to consumers
and producers that consists of lost production (fewer and/or smaller producers or
distributors) and fewer consumers in the market. It does not matter whether the tax is
imposed on a seller or consumer; the effect is the same. What does matter is how sellers
or buyers share the tax. The share (percentage paid) depends on the relative elasticities of
supply and demand. In English, this means that if buyers (consumers) are more
responsive to an increase in price due to a tax than sellers are, sellers will bear a larger
share of the tax. Conversely, if sellers are more responsive to a change in price due to a
tax than buyers, buyers will bear a larger share of the tax. In this way, taxes introduce a
distortion into the market that is shared unequally by consumers and sellers in that
26
market. The important point is that both sellers and buyers are affected by the tax. In
this discussion, we recognize that taxes are necessary to support the many roles of
governments at all levels to provide goods and services that would otherwise not be
provided or insufficiently provided. Many of these goods and services (libraries, parks,
public schools) improve the wellbeing of citizens and taxes are accepted as way to pay
for such “public goods”. Some taxes do not distort the market. One category is
corrective taxes that encourage producers of an externality such as pollution to find
cleaner methods of production while the taxes collected can help defray the costs of clean
up and alleviate health problems. Another category of non-distorting taxes is one in
which the tax moves the private costs of supply in line with the social costs of supply.
An example in our current context is that left alone there may be too much alcohol
provided by producers to consumers in the sense that an unacceptable level of social
harms ensues and the costs to society are not taken into account by private producers.
Taxes on alcoholic beverages attempt to reduce consumption by raising the private costs
of supply to the socially optimum level at which the cost of social harms is acceptable.
Just as we can’t have zero pollution, we can’t have zero social harms. There are pollution
and social harm levels that are socially acceptable that may change over time.
There is no doubt that the increased costs of alcoholic beverages due to sales and excise
taxes have reduced consumption and the social harms associated with excess
consumption and underage drinking. Restricting availability in time and place imposes
time costs that reduce consumption. The question is whether these approaches have
achieved their goals and whether there may be better methods of reducing social harms.
For example, if responsible adults are taxed they may reduce consumption, but they are
not the population that primarily causes social harms. It is conceivable and the evidence
supports the claim that targeted zero tolerance and low blood alcohol content policies do
as well or better at reducing social harms caused by excessive alcohol consumption (see
the references in Cooper and Wright described in footnote 5). Therefore it is conceivable
that alcoholic beverage taxes could be reduced and other policies implemented that would
improve social wellbeing through the targeted reduction of social harms. Responsible
consumers would see two effects: to the extent they experience lower prices they would

27
consume more of everything as they would have more money in their pockets and they
might buy more premium alcoholic beverages. These are the income and substitution
effects due to relative price changes. The wellbeing of the responsible adult alcohol
consumer would be improved. In addition, if the availability was increased in terms of
times and places of purchase (including convenience stores), time costs of consumption
would be reduced and again the wellbeing of responsible consumers would be increased.
These imagined changes could benefit the distribution and supplier tiers as well.
Consumption would increase slightly (we assume responsible consumers do not become
irresponsible because of a change in their costs and we assume other targeting policies
are implemented) and as premium beverages become more affordable, the composition of
consumption could change as well. In addition, if such changes in prices and availability
made Connecticut more competitive than its neighbors, the two tiers could experience
greater growth than if the state were isolated.
The effects of minimum pricing would appear to remove the ability of distributors and
retailers to compete in a way that would improve efficiency and reduce prices on some
products some of the time. Removing this restriction would as a reduction in taxes
improve consumer wellbeing and make Connecticut a potentially more attractive place
relative to its neighbors to purchase alcoholic beverages. Several states (some mentioned
above) do not have minimum pricing regulations and could serve as models for
consideration. It may be that with increased competition, some retailers and some
distributors may shrink or go out of business. Some retailers and distributors may expand
as their efficiencies translate into growth. It is conceivable that growing businesses in
each tier could absorb some of the resources (labor and capital) of declining businesses.
The net outcome for employment and value added of the industry is unknown, but if the
industry as a whole grows as a result of price and time cost reductions, the net effect
could be positive growth in employment and value added.
To the extent that post and hold laws reduce competition, their removal could reduce
prices and improve consumer wellbeing as described above. Thirty-one states do not
28
have post and hold laws (some of which are control states). In addition, several states
have abandoned their post and holds laws in the face of legal challenges that are costly
and appear likely to succeed. Therefore, it would appear that Connecticut should
consider removing these laws perhaps using the examples of states that have recently
done so and those that have had no such laws.
Permit restrictions impose a variety of costs as well on consumers, retail establishments
including restaurants, cafes, clubs and liquor stores among others. The LPRIC report (see
footnote 9) describes these issues and recommends simplifying and streamlining the
state’s permit restrictions. These actions could reduce costs to consumers and retail
establishments as well as enforcement costs. The reduction in permit enforcement costs
could improve enforcement of serving underage drinkers and other tasks more directly
related to reducing social harms. The reduction in costs to businesses could encourage
growth in the sector keeping in mind the checks and balances available at the local level
to restrict permitees.
Reducing prices to consumers through lower taxes, increased competition and reduced
compliance costs (permit-related costs) usually encourages growth in an industry at all
levels. For alcoholic beverage consumption, the public has an interest in keeping the
level of social harms as low as possible. Raising prices and enacting tougher laws helps
reduce social harms. There will always be binge drinkers, people addicted to alcohol and
underage drinkers. It is not possible to reduce social harms to zero but it is possible to
reduce them to an acceptable level that is not easy to determine. That level is arrived at
through a political process and the tradeoffs between increasing responsible consumer
wellbeing on the one hand and holding the costs of social harms as low as possible are
the challenges elected officials face.
Economic theory would suggest removing as many of the impediments and restrictions as
possible and enacting the stiffest penalties possible for harmful, alcohol-related behavior.
29
Conclusion
Connecticut alcoholic beverage laws that regulate the production, distribution and sale of
alcoholic beverages intend to create an orderly market that ensures fair treatment of all
participants and reasonable prices for consumers as well as mitigate to the extent possible
the social harms associated with excessive consumption. The system of laws and
regulations has evolved since the 21st Amendment repealed Prohibition in 1933 and is
now complex and unwieldy as the LPRIC report describes. That report describes several
permitting changes that would simplify and therefore reduce costs in establishing and
maintaining businesses in the alcoholic beverage production, distribution and retail
market segments, while reducing enforcement costs. Such changes could stimulate
growth of the industry and make it more competitive with neighboring states.
Connecticut’s minimum pricing policy does not seem to place the state’s consumers at a
price disadvantage over neighboring states because suppliers and distributors have the
ability to keep Connecticut retailers competitive. The retail price determination in other
license states seems to be similar to Connecticut’s process without calling the practice
minimum bottle pricing. If restrictions on retail pricing were removed, distributors would
still charge a price that afforded them a reasonable gross profit given their costs.
Retailers would sell at whatever price they thought would cover their costs and afford
them a reasonable profit. More efficient retailers would be more price competitive than
their less efficient neighbors. Retailers might specialize in certain types of beverages,
offer tastings and classes as well as other services that support and help their business
grow. Retail prices alone do not exclusively determine consumer satisfaction.
Convenience in terms of what products (alcoholic beverages and complementary goods)
may be sold in which venues at what days and times influence consumer behavior
because they involve time costs. These are issues the legislature can address looking at
models in other states. As well, one must be cognizant of changes in enforcement costs
and consumption behavior that may result from increasing convenience and are issues
that other states have faced.

30
The post and hold laws in Connecticut and the other 18 states that have them may be
challenged under the fair trade practices of the Sherman Act and other relevant national
and state statutes as cited in Cooper and Wright’s 2010 paper (see footnote 5). The three-
tier system may be challenged as well as the Compliance Service of America reports.21
The challenges arise from the globalization of the trade in alcoholic beverages, the
consolidation of huge producer conglomerates (e.g., AB InBev) and the big-box retailers
in this country. Alcoholic beverage markets in other countries are lightly regulated and
international players view the complex web of U.S. federal, state and local laws and
regulations as anti-competitive. In addition, consumers and alcoholic beverage industry
members are pushing for the elimination of barriers to the direct shipment of wine from
vineyard to consumer or retailer.
Where does this leave us? First, because much work has already been done in analyzing
Connecticut’s alcoholic beverage permitting structure and there have been initiatives for
changes in that system, we suggest a thorough and critical review of the LPRIC report
could be a useful starting point for legislative action to simplify the current system of
alcoholic beverage permits in the state. Second, we believe the threats to post and hold
laws and the three-tier system are credible and suggest that the legislature and the
Governor’s office consult with industry and other experts to determine what changes
could be made to Connecticut’s laws regulating the production, distribution and sale of
alcoholic beverages to reduce or eliminate these threats. Such action could save the state
resources needed for other purposes. Finally, in considering the current system of laws
and regulations, we should ask what public policy objectives do they serve and what
alternative policies would serve them better. In this consideration, the efficiency and
equity of free markets can be used as a measuring device to gauge how close Connecticut
can approach that ideal trading off the benefits to responsible consumers and the
reduction of social harms caused by irresponsible consumers.
21 http://www.csa-compliance.com/html/CSA-Articles/three-tier-or-free-trade.html