alcohol and substance use in saskatoon: emerging trends (2010)
TRANSCRIPT
Alcohol and Substance Use in Saskatoon: Emerging Trends (2010)
Canadian Community Epidemiology Network on Drug Use Inaugural Site Report
March 2011
Molly Bell, Colleen Anne Dell, Randy Duncan
1
ACKNOWEDGEMENTS
The authors would like to sincerely thank the following individuals and organizations that helped make this project possible:
• The Denver, Colorado Epidemiology Work Group for sharing its survey and PowerPoint presentation, which were used to guide the development of this report,
• The Calder Centre for providing a meeting room for an interpretation panel and the participants who shared their expertise,
• The Canadian Centre on Substance Abuse for funding this project,
• The various individuals who participated in the questionnaire and/or facilitated the recruitment of participants, and
• The key experts who reviewed a draft copy of this report.

2
Introduction
Aim This report presents the results of a data-collection project, commissioned by the Canadian Community
Epidemiology Network on Drug Use (CCENDU), to identify available substance use-related data and relay
current trends in alcohol, drug, and other substance use in Saskatoon, SK over the past 12 months.
CCENDU, organized by the Canadian Centre on Substance Abuse (CCSA), is a collaborative project
involving federal, provincial, and community agencies, and focuses on monitoring drug use, health and
legal consequences of use, treatment, and law enforcement. Local sites across Canada collect, collate,
and interpret data and information in eight major drug use areas: alcohol, cocaine, cannabis, heroin,
sedative-hypnotics and tranquilizers, hallucinogens other than cannabis, stimulants other than cocaine,
and licit drugs. For each of these drug use areas, data is collected on prevalence, law enforcement,
treatment, morbidity, mortality, and HIV/AIDS/HepC, including injection drug use and needle exchange
information. Information on emerging drugs and trends is also collected.
The goal of this report is to provide the array of organizations and individuals working in fields related to
alcohol and drug use with real-time information about the current context of substance use and
problematic use in Saskatoon. It is not meant to deliver large-scale statistical data collection on
substance use in the city, but rather aims to provide individuals working in the substance use field with
current information about what has been seen “on the street” over the past year. It is intended that
the information presented herein will serve as a discussion point between the various sectors working
within the field. In addition to this report, the results are available in a PowerPoint presentation (with
notes that anyone can use to present the findings). Additionally, a network of individuals with an
interest in substance use in Saskatoon was identified through this project; it is intended that this
network will continue to communicate about current drug- and alcohol-related issues in the city. This
will better enable individuals working in the field to be aware of what other sectors are witnessing, with
the ultimate goal of providing better informed service to their client populations.
Demographics of Saskatoon Saskatoon, located in the south-central region of Saskatchewan, is the most populous city in the
province and has been recently identified as the fastest growing region in Canada (Hutton, 2011).
3
The Saskatoon Health Region (SHR) accounts for 30% of the province’s population (300,638 in 2009),
with 71 communities, 33 whole and partial rural municipalities, and 6 First Nations reserves (2 of which
are urban reserves). Eighty-four percent of the SHR population (252,536) resides within the Saskatoon
Census Metropolitan Area (CMA) (Saskatoon Health Region, 2009).
As of 2009, 18.12% (54,478) of the population of the SHR was under the age of 15, and there were
approximately 15,000 seniors over the age of 75 living in the CMA. There were just over 17,600 people
of Registered Indian Status (RIS) residing in the SHR in 2009, with slightly less than 80% living in the
CMA. Notably, the RIS population is significantly younger than the non-RIS population—55% of the RIS
population is under the age of 25 compared to 31% of the non-RIS population (SHR, 2009). There are a
significant number of recent immigrants settled in Saskatoon. The latest available estimates indicate
that there were just under 17,000 immigrants living in the city in 2006 (Statistics Canada, 2007). In
comparison to the time period of 2001-1005, the number of recent immigrants in Saskatoon (arriving in
Canada within the past five years) has tripled from 2006-2010 (Marko, 2011).
Saskatoon is home to several institutions of higher learning, including the University of Saskatchewan,
the Saskatchewan Institute of Applied Science and Technology (SIAST), the Gabriel Dumont Institute, the
Saskatchewan Indian Institute of Technologies, and the First Nations University of Canada. Agriculture
and mining are important industries in Saskatoon and the surrounding region, and the SHR and
University of Saskatchewan are the city’s largest employers (Saskatoon Regional Economic Development
Authority, 2011). As of February 2010, the unemployment rate for the Saskatoon Census Metropolitan
Area was 4.3%—the lowest in Canada (StatsCan, 2010).
Social Determinants of Health According to a 2009 report on the health status of residents of the Saskatoon Health Region, significant
health disparities exist between affluent and low-income residents (Neudorf et al., 2009). These
inequities are particularly apparent in the city of Saskatoon, where residents of several core
neighbourhoods on the West Side—nearly half of who live in poverty—experience adverse health
outcomes at higher rates than those living in more affluent neighbourhoods. With a large proportion of
Saskatoon’s Aboriginal population living in the core neighbourhoods, this population tends to face
adverse health outcomes at higher rates than the rest of the city’s population. There is also a perceived
social division corresponding to the city’s physical division into “East Side” and “West Side” by the South
Saskatchewan River. The association of the East Side with affluence and desirability as a place to live
4
contrasts sharply with the stereotypical image of the West Side as dangerous, run down, and poor,
further reinforcing inequities extant in the city. These social factors provide context for the current
trends in alcohol, drug and other substance use, and related harms, in Saskatoon.
Methods With the goal of relaying emerging trends in substance use in Saskatoon, data was gathered from a wide
variety of expert sources and key informants. While the focus of this project was on collecting original,
timely, qualitative data (see below), several sources of existing quantitative data were identified and are
presented.
Quantitative data There are numerous existing sources of quantitative data related to substance use for the City of
Saskatoon. Some datasets are readily available, while others are difficult to access or may be available
for a fee. The following data sources have been identified as potentially useful for future work in
substance use and related outcomes monitoring in the Saskatoon Health Region. Where
applicable/available, data from the sources listed below are presented in the report. (Please see
Appendix I for relevant contact information/web addresses for the data sources.)
Prevalence:
• Canadian Alcohol and Drug Use Monitoring Survey (CADUMS) – annual survey providing national
and provincial estimates of alcohol and illicit drug use among Canadians aged 15 years and
older.
• Canadian Tobacco Use Monitoring Survey (CTUMS) – annual tobacco use survey. Information
available by province.
• Youth Smoking Survey (YSS) – national survey of student smoking. Data available by province.
• Healthy Behaviour in School Age Children (HBSC) – World Health Organization cross-national
study. Canada-specific information available in published reports.
• Saskatchewan Liquor and Gaming Authority (SLGA) – annual sales reports; liquor sales detailed
by store and city, and divided by wine and spirits vs. beer. Reports can be accessed by
contacting SLGA’s central office.
• Saskatoon Student Health Survey – survey of students in grades 5 through 8 in Saskatoon Public
and Catholic schools. Questions cover health behaviours including smoking and drinking. De-
identified data potentially available upon request.
5
• Enhanced Street Youth Study (E-SYS) – national survey of risk factors associated with sexually
transmitted infections and bloodborne pathogens among street-involved youth 15-24 years.
Data collected on social determinants of health, including education, income, interaction with
justice system, social services, and barriers to services. Site-specific information is available on
request. National reports are available from the Public Health Agency of Canada.
• Saskatoon Health Region – reports data in such areas as intravenous drug use, health status of
Saskatoon residents, HIV/AIDS cases, and needle exchange. Depending on data required,
different access protocols may apply.
Enforcement:
• Saskatchewan Government Insurance (SGI) – traffic collision statistics, including alcohol
involvement, available for download on SGI website.
• Uniform Crime Reporting (UCR) survey – Statistics Canada annual survey designed to measure
the incidence of crime in Canadian society and its characteristics. Cost associated with access.
• Saskatoon Police Services – month end and year end crime statistics for the city of Saskatoon
available for download on the Police Services website.
• Adult Criminal Court Survey – Statistics Canada database of information on appearances,
charges, and cases in adult criminal courts. Updated annually. Data available for download on
website.
• Youth Court Survey – Statistics Canada database of statistical information on appearances,
charges, and cases in youth courts. Updated annually. Data available for download on website.
• RCMP Drug Situation Reports – information about the illicit drug trade in Canada; some
provincial data available. Can be downloaded from RCMP website.
• Health Canada Drug Analysis Service – analyzes suspected illegal drugs seized by Canadian police
and Canada Customs. Contact for information about accessibility of data.
Treatment:
• Saskatchewan College of Physicians and Surgeons – records of methadone prescriptions.
Contact for access to information.
• Saskatchewan Ministry of Health Community Care Branch – data on admissions, outpatient
treatment, and demographics of clients seeking treatment. Contact for access to information.
6
Morbidity:
• Saskatchewan Government Insurance (SGI) – traffic collision statistics, including alcohol
involvement, available for download on SGI website.
• Saskatoon Health Region – records of alcohol-related diagnoses and other substance-related
diagnoses. Depending on data required, different access protocols may apply.
• Canadian Institutes for Health Information – hospital separation data may be available for a fee;
potentially dated by the time data is cleaned and publically available.
Mortality:
• Vital Statistics – deaths related to drugs and alcohol. May be available; fee associated with use.
HIV/AIDS/Hepatitis C:
• Saskatoon Health Region – data on new cases of HIV/AIDS/HepC and needle exchange data
available. Contact for access to information.
• Needle Safe Saskatoon – data on numbers of discarded needles collected annually in the
community; statistics available in Needle Safe Saskatoon’s annual report.
Qualitative data While some sources of qualitative data about substance use and related consequences exist for
Saskatoon (see Appendix II), the focus of this project was to collect new, current data on emerging
trends over the past 12 months. Where applicable/available, existing studies are drawn upon to
contextualize the current project’s findings.
A comprehensive Saskatoon-specific questionnaire was developed in each of the CCENDU indicator
areas, and included a focus on how social factors relate to drug use. The 114-question survey was pre-
tested by two individuals, and included a combination of mainly fixed-response and several open-ended
questions covering topics spanning the problematic nature of various substances in the city,
demographics of “typical” users of each substance, crimes related to substance use, rates of treatment
episodes, morbidity and mortality, and HIV/AIDS/Hep C and pregnancy in the context of substance use.
With the focus on emerging trends, participants were asked to focus on the past 12 months when
answering the questions. They were also asked to indicate which, if any, of a list of social factors might
be driving an increase and/or decrease in substance use-related crime, treatment, morbidity, and
mortality. A complete copy of the questionnaire is available at:
http://www.addictionresearchchair.com/disseminating-knowledge/ccendu/
7
The questionnaire was completed by 51 individuals from various sectors between January 11 and March
5, 2011. Participants were initially recruited according to categories identified by the Denver
Epidemiology Work Group. In turn, these key representatives identified others in their field (or a related
field) who would likely have valuable input. The questionnaire respondents ultimately included
pharmacists, emergency physicians, treatment professionals, drug enforcement officers, paramedics,
drug users, nurses, social workers, medical health officers, and representatives from non-profit
organizations. The majority of questionnaires were completed online using Survey Monkey. Two were
self-administered with paper copies and four were administered in person; all six were later entered
into Survey Monkey for analysis.
It is important to point out that the recruitment of a convenience sample, rather than a stratified
sampling procedure with the Saskatoon resident population, has both strengths and limitations. The
obvious limitation is that the current sample (n=51) is not generalizable to or representative of the
general population of the City of Saskatoon. However, given that the aim of this report is to identify in
an efficient manner what has been experienced “on the streets of Saskatoon” over the past year, the
respondents were selected for their expertise. It follows that the data represent their individual (and
their colleagues’ and clients’) collective experience. An additional limitation is presented by the use of
the term “problem” in the questionnaire. Individuals were asked how serious a problem various
substances were based on the use of the term “problematic substance use,” which is generally
understood to mean dependent or recreational use that can lead to or causes social, psychological,
financial, health and/or legal problems for individuals and communities. Because this term is subjective
(i.e., problematic because use is widespread versus because of consequences to users), interpretation
may not be straightforward. Future versions of the questionnaire will address this by providing the
general definition.
Interpretation panel Following the CCENDU questionnaire data collection process, all respondents were invited to participate
in a review of the preliminary results. Six individuals, representing a cross-section of the CCENDU
indicator fields in the Saskatoon, attended an interpretation panel to accomplish the following: a)
further contextualize the descriptive data in the six indicator areas, and b) provide an evaluative or
substantive judgement on the degree to which the collected empirical evidence supported an overall
depiction of recent emerging drug use trends in Saskatoon. The interpretation panel process provided
an additional content validation step for the findings.

8
Engagement of stakeholders Through the course of this project, feedback was requested from those who completed the survey on
the type of format(s) that would be the most beneficial for them to receive/access the gathered data. It
was determined that a report and accompanying PowerPoint of the findings would be the best way for
most participants to receive the results. An additional goal of this project is the creation of a network of
stakeholders who can contribute to and benefit from ongoing interaction with the larger local group.
The potential creation of such a network has thus far been met with approval and interest from the
majority of participants. Such a network would enable organizations and individuals from various sectors
to share ideas, expertise, and data to enhance existing and collaborative efforts related to substance use
in Saskatoon. As this network develops, information will be available at:
http://www.addictionresearchchair.com/disseminating-knowledge/ccendu/
Indicators This section details the findings from the questionnaire covering each of the indicator areas outlined by
CCENDU.
Prevalence Results from the 2009 Canadian Alcohol and Drug Use Monitoring Survey suggest that rates of drug and
alcohol use in Saskatchewan were lower than the Canadian average for that year (Canadian Alcohol and
Drug Use Monitoring Survey, 2010). While these data apply to the province as a whole, it may provide
useful context for interpreting the Saskatoon-specific qualitative data collected.
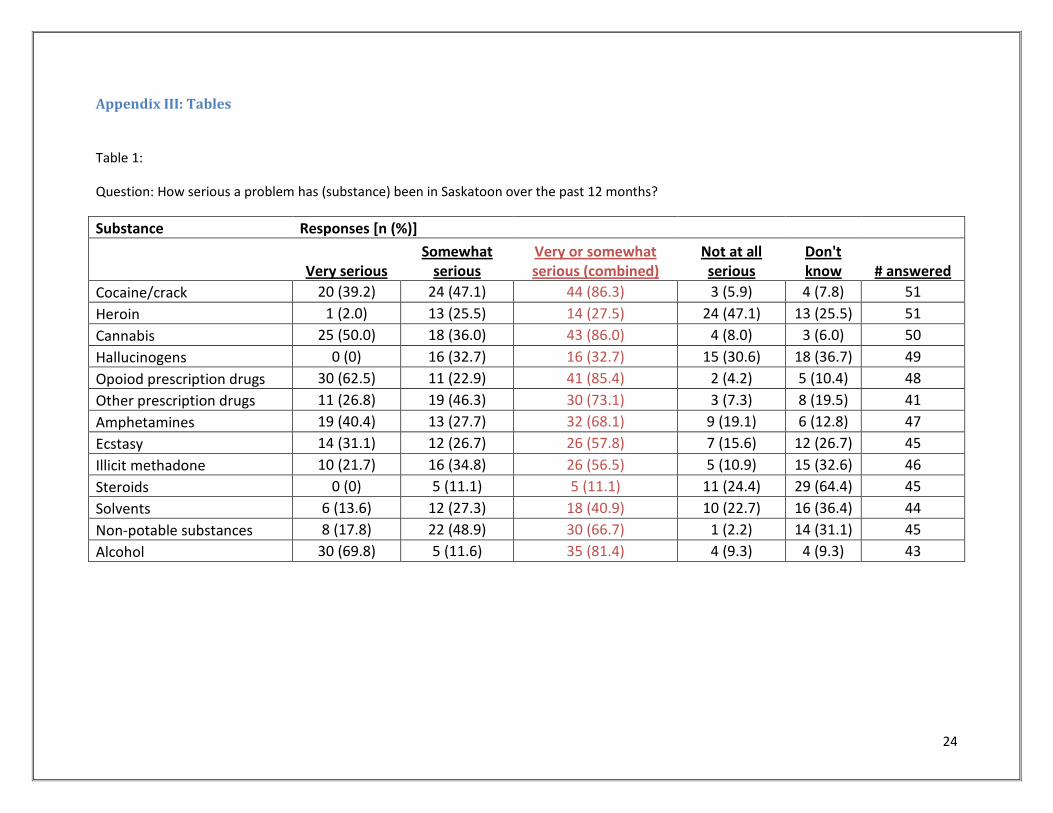
Findings from the Saskatoon CCENDU questionnaire suggest that nine of the substances within the
prevalence indicator area are considered to be a very serious or a somewhat serious problem on the
streets of Saskatoon. The substances described as emerging problems (by at least half of respondents)
within the past 12 months are (in descending order): cocaine/crack, cannabis, opioid prescription drugs,
alcohol, other prescription drugs, amphetamines, non-potable substances, ecstasy, and illicit
methadone. The range of seriousness reported ranges from a low of 56.5% (illicit methadone) to a high
of 86.3% (cocaine/crack) (See Appendix III – Table 1). In a similar way to the 2009 Canadian Alcohol and
Drug Use Monitoring Survey, this questionnaire helps provide a more informed context for
interpretation of the findings in the indicator areas of enforcement, treatment, morbidity, and mortality.
The four remaining substances within the prevalence indicator area (heroin, hallucinogens, steroids, and
solvents) were not considered to be a recent problem on the streets of Saskatoon. Further, the two

9
indicator areas of steroids and solvents were primarily reported as substances not well-known to the
respondents. Of interest was the identified concern over the use of energy drinks, both in combination
with alcohol and not.
Cocaine/crack The majority of respondents (86%) indicated that cocaine/crack has been a very serious (39%) or
somewhat serious (47%) problem over the past 12 months in Saskatoon. Only 6% indicated that it has
not been a serious problem, while the remainder indicated they did not know how serious a problem it
has been. Thirteen percent of respondents indicated that there had been a decreased purity of supply
over the past 12 month, but the majority (70%) indicated they did not know of any changes to supply.
The majority indicated that males and females between the ages of 19 and 29 were typical users of
cocaine/crack, with adults between 30 and 49 and youth under 19 comprising secondary user groups of
concern (see Appendix III – Table 2).
Heroin1
Heroin was not found to be a major drug of concern. Twenty-six percent of respondents felt it has been
a somewhat serious problem, and 47% felt it was has not been a serious problem at all. Just 2% (one
respondent) indicated it has been a very serious problem and the remainder indicated they did not
know how serious it has been. There were no notable changes in purity or price over the past 12
months. Males and females between 19 and 29 years of age comprised the user group of most concern,
followed by males and females between 30 and 49. Other groups were identified by a handful of
respondents, including female and male youth under 19 and male older adults between 50 and 69.
Cannabis Eighty-six percent of respondents indicated that cannabis has been a very serious (50%) or somewhat
serious (36%) problem over the past 12 months. The remainder of participants felt that it has not been a
problem, or did not know how serious it has been. Twelve percent of respondents felt that there had
been an increase in purity2
1 On March 17, 2011 RCMP and Saskatoon Police confiscated what was considered to be ‘a large amount of heroin’ intended for distribution in the city.
of supply over the past 12 months, but the majority (86%) indicated that
there had been no changes or they did not know of any changes in supply. Typical user groups were
identified as males and females under age 19, followed by males and females between 19 and 29, and
then males and females from 30-49. Adults age 50 and over were identified far less frequently.
2 A more accurate term is “concentration;” however, the term “purity” was used in the questionnaire.
10
Hallucinogens While 33% of respondents indicated that hallucinogens have been a somewhat serious problem in
Saskatoon, the majority indicated that they have not been serious at all (31%) or that they didn’t know
how serious they have been (37%).3
Opioid Prescription Drugs
No major changes in purity or price were noted. Typical users were
identified as males and females under age 19, followed by males and females 29 and under. Ten percent
of respondents indicated that males and females between 30 and 49 years of age were also typical
users. In spite of the perception that hallucinogens are not problematic in Saskatoon, it is important to
note that in light of relatively recent findings about the potential effects of such drugs on individuals
with a predisposition to such diseases as bipolar disorder and schizophrenia, hallucinogens may have
particular consequences for this population.
Opioid prescription drugs were perceived to have been a very serious (63%) or somewhat serious (23%)
problem in Saskatoon over the past 12 months. Four percent felt that they have not been a serious
problem at all, and the remainder did not know how serious they have been. Increased purity4
Other prescription drugs
of supply
and decreased price at street level over the past 12 months were identified by 16% of participants, but
the majority (70%) indicated no changes or they did not know of any changes. In addition, 7% indicated
an increased price at street level. Females and males between the ages of 19 and 49 were the most
frequently identified user groups, with youth under 19 and older adults between 50 and 69 comprising
secondary groups of concern. Twelve percent of respondents also identified adults age 70 and above.
The majority of respondents indicated that other prescription drugs (which we identified as depressants
such as tranquillizers and benzodiazepines5
3 Numbers are rounded and so do not add up to 100%. See Appendix III for breakdown of percentages.
) have been a very serious (27%) or somewhat serious (46%)
problem. Seven percent indicated they have not been a serious problem, and the remainder did not
know how serious they have been. No major changes in purity or price were noted. Typical users were
identified as males and females between the ages of 19 and 49, and, less frequently, older adults
between age 50 and 69 and youth under 19. Adults age 70 and above were identified by 10% of
respondents.
4 Note that in the case of prescription drugs, “purity” was generally interpreted to indicate name brand versus generic brand. 5 Note that the survey was missing a category for prescription stimulants; this will be addressed in future versions.

11
Amphetamines Most respondents felt that amphetamines have been a very serious (40%) or somewhat serious (28%)
problem in Saskatoon over the past 12 months. Nineteen percent indicated they have not been a
serious problem, and the remainder didn’t know how serious they have been.6
Ecstasy
No discernible trends in
purity or price were noted. Typical users of amphetamines were identified as males and females age 19
to 29, closely followed by males and females age under than 19. Males and females between 30 and 49
comprised an additional user group of concern.
Ecstasy was perceived as a very serious (31%) or somewhat serious (27%) problem by over half of the
respondents. Sixteen percent indicated that it has not been a serious problem at all and the remainder
did not know how serious it has been. No discernible trends in purity or price were noted. Typical users
of ecstasy were most frequently identified as males and females under the age of 19, followed by young
adults between 19 and 29 years of age.
Illicit methadone Fifty-seven percent of respondents indicated that the illegitimate use of methadone has been a very
serious (22%) or somewhat serious (35%) problem. Eleven percent felt it has not been a serious problem
at all, and the remainder did not know how serious it has been. There were no discernible changes in
purity or price during this time period. All age groups were indicated to be typical users of illicit
methadone by at least some participants. However, user groups most frequently identified were
comprised of males and females between 19 and 29 years of age, followed by males and females
between 30 and 49 years of age.
Steroids The majority of respondents (64%) indicated that they did not know how serious of a problem steroids
have been over the past 12 months. Eleven percent felt they have been a somewhat serious problem
and the remainder felt they have not been a serious problem at all. No discernible trends in purity or
price were noted. Typical users were most frequently identified as males between 19 and 29, closely
followed by male youth under 19. Male adults between 30 and 49 were also identified as typical users,
although less frequently. The interpretation panel indicated that one of the reasons local service
6 The numbers for amphetamines should be interpreted with caution. In the small number of in-person questionnaires completed, respondents indicated that while drugs like crystal meth are not used by many, the consequences for those users are very serious. It may be that the perceived relative danger of these drugs is the reason for the perception of their problematic nature, in spite of many comments as to how (relatively) uncommon they are in Saskatoon. This understanding was supported by the interpretation panel.
12
providers may have limited understanding of the nature of steroid use in the city may be because they
are potentially used by a particular demographic (athletes), and can easily be purchased over the
Internet.
Solvents While 36% of respondents indicated that they did not know how serious of a problem solvents have
been over the past 12 months, 14% felt they have been a very serious problem, 27% felt they have been
a somewhat serious problem, and the remainder felt they have not been a problem at all. All age groups
were identified to be typical users of solvents, with youth under 19 identified most frequently and males
identified slightly more frequently than females.
Non-potable substances Just under half of respondents (49%) indicated that non-potable substances (e.g., mouth wash, hand
sanitizer, hairspray) have been a somewhat serious problem over the past 12 months. Eighteen percent
felt they have been very a serious problem, and 2% indicated they have not been a problem at all. All
age groups under 69 were identified as typical users, with males and females between 30 and 49 being
identified most frequently, closely followed by individuals under 30 and 50 to 69. The interpretation
panel indicated that non-potable substances generally tend to be more problematic in specific areas. For
example, they indicated that hand sanitizer is a significant concern in northern mining communities,
where it is used to avoid being detected of being in possession of alcohol.
Alcohol The majority (70%) of respondents indicated that alcohol has been a very serious problem in Saskatoon
over the past 12 months. Twelve percent felt it has been a somewhat serious problem, and 9% felt it has
not been a problem at all. All types of alcohol (beer, wine, and spirits) were identified as problematic,
but beer was identified most frequently (by 97% of respondents). Interestingly, this corresponds with
the larger sales peak recorded by the Saskatchewan Liquor and Gaming Authority. Saskatoon liquor
store overall sales for the 2009-2010 fiscal year were up 7% compared to the previous year. Sales of
wine, coolers, and spirits were up 6% and beer sales were up 13% (Saskatchewan Liquor and Gaming
Authority, 2009, 2010). The primary user group of alcohol in the CCENDU questionnaire was identified
as males and females age 29 and under, closely followed by males and females between the ages of 30
and 69. Older adults (70 and above) were identified much less frequently.

13
Other substances Participants were asked to identify other substances of concern in Saskatoon over the past 12 months.
Several people indicated that youth were frequently using energy drinks, both with and without alcohol.
Additionally, two respondents noted the use of salvia. No concern over the recent attention to “bath
salts”7
Geographic distribution of substance use in Saskatoon
was identified.
The results of the survey indicate that several neighbourhoods on the West Side of Saskatoon are
somewhat more of a concern regarding problematic substance use, particularly for substances like
methadone, non-potable substances, and cocaine/crack. However, it is important to note that six
substances were identified as being recent problems (past 12 months) on a city-wide basis; alcohol,
cannabis, opioid prescription drugs, other prescription drugs, amphetamines, and ecstasy were
identified as emerging problems throughout all neighbourhoods of the city. Cocaine/crack, while not
identified as a city-wide problem, was mentioned as a substance that can also be found in East Side
neighbourhoods, including the more affluent areas of the city. Finally, hallucinogens, while not
considered a city-wide problem, were also mentioned as being found in several East Side
neighbourhoods.
Enforcement According to data from the Saskatoon Police Service8
7 Synthetic hallucinogens that have been legally sold over-the-counter as “bath salts” or “plant food.” See
, there were 940 reported violations of the
Controlled Drug and Substance Act in 2010, down from 983 the previous year. Specifically, in 2010 there
were 779 counts of possession (down from 831 in 2009), 147 counts of trafficking (up from 137 in 2009),
1 count of importation (there were none in 2009), and 13 counts of production (down from 15 in 2009).
Additionally, there were 544 counts of impaired operation of a motor vehicle, down from 625 in 2009
(Saskatoon Police Service, 2010). The most recent available data from Saskatchewan Government
insurance indicates that there were 1,594 collisions, 56 of which involved fatalities, involving alcohol in
Saskatchewan in 2008. This represents a decrease in collisions of 10% compared to the previous three-
year average (Saskatchewan Government Insurance, 2011).
http://www.npr.org/2011/02/08/133399834/florida-bans-cocaine-like-bath-salts-sold-in-stores for more information. 8 It is important to note that these are Controlled Drugs and Substances Act arrests only, and do not account for crimes where alcohol and/or drugs contributed to the crime (e.g., alcohol intoxication as a contributing factor in an assault).
14
Results from the CCENDU questionnaire indicate increased trafficking in all the substances covered.
Those most frequently indicated were cocaine/crack, cannabis, opioids, and ecstasy. Respondents noted
that the strongest factor influencing this increase was demand from consumers, closely followed by
availability from suppliers, poverty, lack of affordable housing, and difficulty in accessing treatment
programs. Ineffective public health policies and unemployment were cited less often. Several
respondents also indicated their belief that Saskatoon’s healthy economy has in part been driving the
increase due to the fact that people in general have more money to spend.
While some participants did indicate an increase in property (16%), traffic (16%), and violent (11%)
crimes related to alcohol use, the majority (73%) indicated they did not know of any increases. Among
those who indicated an increase in crime, 72% indicated that rates of alcohol use were a contributing
factor. Other social factors were indicated with less frequency.
Treatment
Of the 8,256 individuals who accessed alcohol and drug services in the SHR in 2009-2010, 5,150 (67%)
were male and 2,746 (33%) were female. Nine percent of the admissions were for youth under the age
of 19. Additionally, there were 2,702 outpatient treatment admissions, 2 day-patient treatment
admissions, and 88 methadone-assisted recovery admissions in 2009-2010 in the SHR (Saskatchewan
Ministry of Health, 2011). Currently there are 2,168 individuals in the Methadone Assisted Recovery
Program (Spitzig, 2011).
Several respondents indicated that there has been an increase in individuals seeking treatment for
multiple substances over the past year in Saskatoon. Substances most frequently cited include alcohol,
cocaine/crack, cannabis, and opioid prescription drugs. The other substances were indicated much less
frequently (i.e., by 1 to 4 respondents) and steroids were not identified at all. Decreased health and
wellness of individuals, lack of affordable housing, and poverty were the most commonly cited factors
contributing to this increase in treatment seeking.
Respondents indicated that the group most likely seeking treatment was males and females 49 and
under. Males and females 50 and over were indentified much less frequently. It is important to note
that the Saskatchewan Ministry of Health statistics do not represent individuals who do not access
treatment.
15
Morbidity9
The CCENDU questionnaire results indicate that there has been an increase in individuals seeking
medical care over the past year in Saskatoon due to all substances, except steroids. Alcohol,
cocaine/crack, and opioid prescription drugs were cited most frequently. Poverty was the factor most
frequently noted as responsible for this increase in morbidity, along with other social factors (e.g.,
decreased health and wellness of individuals, availability from suppliers, absence of affordable housing,
low employment levels). All age groups were indicated as seeking medical care related to problematic
substance use; males and females 49 and under were cited most frequently.
Mortality
The CCENDU questionnaire respondents indicated that there has been an increase in deaths related to
alcohol, cocaine/crack, opioid prescription drugs, and methadone10
Males and females age 19 to 49 were most frequently indicated as suffering drug related deaths over
the past year in Saskatoon, with males indicated slightly more frequently than females. The other age
groups were cited less frequently. All age groups were indentified as suffering alcohol-related deaths
over the past year. Males and females were identified with equal frequency for individuals age 50 and
above. For age 49 and younger, males were indicated much more frequently than females (up to twice
as often).
HIV/AIDS/Hepatitis C
Rates of HIV in Saskatchewan have been rising, and Saskatoon has experienced some of the largest
increases in the province. In 2009, there were 94 cases of HIV, 7 cases of AIDS, and 156 cases of
Hepatitis C diagnosed in the SHR (SHR, unpublished data). HIV continues to disproportionately affect
over the past year. The other
substances were indicated with less frequency, aside from hallucinogens, ecstasy, steroids, and non-
potables, which were not identified. Lack of affordable housing and poverty were most frequently cited
as factors driving this increase in mortality, closely followed by decreased health and wellness of
individuals and difficulty in accessing treatment programs. Under-employment, poor public health
policies, availability from suppliers, and demand from consumers were also noted by some respondents.
9 It is important to note that many respondents indicated complications from injection drug use, such as hepatitis C or endocarditis, as causing increases in morbidity and mortality over the past year. 10 One of the drug users interviewed vehemently opposed the practice of giving individuals with methadone prescriptions “carries,” stating he had seen several overdoses and that someone in his family had died from using illegitimate methadone. He felt strongly that methadone prescriptions should require observed dosing.

16
marginalized populations, including young Aboriginal women and street-involved individuals (AIDS
Saskatoon, 2010). According to 2009 data, 77% of new cases of HIV diagnosed in the province were
among individuals who inject drugs, and of this group, 84% were of Aboriginal ancestry (Opondo, 2010).
Additionally, 2010 data indicate that 70% of HIV positive individuals in Saskatchewan are also infected
with Hepatitis C (Saskatchewan Ministry of Health, nd). Preliminary results from the Public Health
Agency of Canada’s 2009 Enhanced Street Youth Study indicate that almost one in twenty youth
interviewed were HIV positive, one in three have used injection drugs at least once, and homelessness
and abuse were significantly associated with injection drug use. Less than half of the interviewed youth
who inject drugs reported knowing where to go to discuss a mental or physical health problem (SHR,
nd). In May, 2010 the province unveiled its multi-year HIV strategy, aimed at both reducing new cases of
HIV and improving the lives of those already living with the disease (Saskatchewan Ministry of Health,
2010).
There are several providers of needle exchange services in Saskatoon, one of which is Public Health
Services. In 2009 the Street Outreach Department issued 1,099,214 needles and an estimated
1,221,960 needles were collected from needle exchange, needles collected in the community, and
needles collected by needle drop boxes, for a return rate of 111.2% (SHR, unpublished data). 11
Data from 2009-2010 indicates that of a total of 8,256 admissions to drug and alcohol treatment in the
SHR, 1,175 (14%) reported having used injection drugs in the past month. Cocaine and morphine were
most frequently reported as injected drugs. Talwin/Ritalin, heroin, and other drugs were also reported,
but with much lower frequency (Saskatchewan Ministry of Health, 2011).
Included
in the number of needles collected in 2009, 11,216 of them were recovered from Saskatoon
neighbourhoods. This number represented a decrease of over 50% from the previous year (Needle Safe
Saskatoon, 2010) and is explained in part by needle drop boxes that replaced other collection methods.
Forty-four percent of respondents in the CCENDU questionnaire indicated that there has been an
increase in HIV/AIDS cases over the past year in Saskatoon related to drug and/or alcohol use. Most of
those who indicated an increase felt that it was due to sharing of needles and/or risky sexual behaviour
while under the influence. Thirty-four percent of respondents indicated an increase in Hepatitis C due to
drug and/or alcohol use. Sharing of needles and risky sexual behaviour while under the influence were
again cited as driving this increase.
11 This number is significantly higher than the number of needles collected in Vancouver and Toronto, much larger cities, according to information presented at the 2011 national CCENDU conference.

17
Thirty-three percent of respondents indicated that there has been an increase in injection drug use (IDU)
over the past year; 10% thought the rate has remained stable, and the remainder reported to not know.
Cocaine/crack was indentified most frequently (by 73% of respondents) as being injected, followed by
heroin12 and methadone (each by 30% of respondents).13 Several respondents also indicated the
prevalence of injection of non-heroin opiates, along with other prescription drugs such as Ritalin. Thirty-
five percent of respondents felt that here had been an increase in risky behaviours (e.g., sharing or
reusing needles, having unprotected sex) over the past 12 months, while 10% felt there had not. It was
discussed in the interpretation panel that when the attention deficit hyperactivity disorder (ADHA) drug
Concerta© was placed on the Saskatchewan Formulary, which is longer acting and more difficult to
misuse than Ritalin, individuals took on the risky behaviour of hot injecting Concerta©.14
Males and females between 19 and 29 years of age comprised the group most frequently indicated as
injecting drugs, closely followed by males and females between 30 and 49 and then those under 19.
Older adults between 50 and above were also indicated as a user group, although less frequently.
While 14% of respondents indicated that medical and social services have been working well for people
who inject drugs, most of those who responded (range of 29-34% for the various services) felt that these
services, as well as parenting and child welfare, housing, and income security, have not been working
well. Specific organizations were cited as working well with individuals who inject drugs, and include
AIDS Saskatoon, the Building Relationships with Injection Drug Users for Greater Engagement (BRIDGE)
program, the Saskatoon Tribal Council Urban Health Centre, the Methadone Assisted Recovery Program,
detox services, the Westside Community Clinic, the Friendship Inn, and SHR programs such as the
LiveWell Positive Living Program.
Pregnancy Of 1,632 women age 15-40 admitted for drug and alcohol treatment in 2009-2010, 62 (4%) were
pregnant at the time of admission (Saskatchewan Ministry of Health, 2011).
Results of the CCENDU questionnaire suggest an increasing trend among women using various
substances during their pregnancies. Indications are that the most frequently used substances were
12 Note that SHR staff indicate that heroin is very rarely seen being used by injection drug users who access the SHR’s Street Outreach Program (Wright, 2011). 13 Note that respondents could choose as many substances as applicable, meaning percentages will not add up to 100 in the event that some individuals indicated more than one substance. 14 The EROWID website (http://www.erowid.org/) is a common place where individuals access and share information about psychoactive plants, chemicals, and related issues.
18
alcohol, cocaine/crack, and cannabis. These substances, with the exception of opioid prescription drugs,
represent the next three highest reported problem substances on the streets of Saskatoon generally
(reported as being very serious or somewhat serious by 81-86% of respondents). One contributing cause
of this emerging trend was identified as the lack of services specifically designed to support pregnant
women with substance use issues.
The results also indicate an increase in numbers of pregnant women accessing treatment, needing
medical care, being involved with the law, and having Hepatitis C and HIV infections.
Conclusion Alcohol, drug, and other substance use in Saskatoon is problematic. As the results of the CCENDU
questionnaire suggest, cocaine/crack, cannabis, prescription drugs, and methadone, along with alcohol,
are primary substances of concern. While selected neighbourhoods on the West Side of the city are
identified as areas that are disproportionately affected by substance-related issues, as noted above,
multiple substances have been identified as being city-wide problems. Additionally, the results indicate
that nearly all age groups are affected by drugs and alcohol and related harms.
While several sources of data regarding alcohol, drug and other substance use (and consequences) exist,
there is clearly a need for better collection and consolidation of information. For example, hospital
emergency department monitoring systems, such as those established in Vancouver and Victoria,15
15 See
would provide invaluable real-time information about patterns of problematic substance use in
Saskatoon. Additionally, greater collaboration and information sharing between various sectors could
enhance understanding of and response to what is currently going on “on the streets,” and in turn
improve services for clients and potentially reduce related harms. An area in which the greatest gap in
information exists within the CCENDU questionnaire is in relation to youth under the age of 19. This was
confirmed by the interpretation panel, who indicated that while those seeking services often indicate
that their substance use started in their youth, they do not routinely see youth accessing services, such
as needle exchange and the Street Health Van. While some data on youth do exist (e.g., the E-SYS), there
is a perception among respondents that there is a lack of information on the youth population generally.
The panel also indicated that data on tobacco use should be collected.
http://carbc.ca/AODMonitoring/ResearchComponents/EmergencyDepartments.aspx

19
It is intended that representatives from the various sectors that participated in this project will form a
surveillance or early detection network—one that can cooperatively work to improve the understanding
of alcohol, drug and other substance use in Saskatoon. Such a network could work together toward
effective and relevant community-based solutions appropriate to the current context of problematic
substance use in the city. This report, along with an accompanying PowerPoint presentation, is available
at: http://www.addictionresearchchair.com/disseminating-knowledge/ccendu/ Information on the
emerging Saskatoon CCENDU network can also be found on this site.
20
References: AIDS Saskatoon. (2010). AIDS awareness week. Retrieved from: http://www.aidssaskatoon.ca/web/node/191
Canadian Alcohol and Drug Use Monitoring Survey. (2010). Summary of results for 2009. Retrieved from: http://www.hc-sc.gc.ca/hc-ps/drugs-drogues/stat/_2009/summary-sommaire-eng.php
Hutton, D. (2011). Saskatoon the fastest growing region in Canada: Statistics Canada report. Saskatoon Star Phoenix. Retrieved from: http://www.thestarphoenix.com/technology/Saskatoon+fastest+growing+region+Canada+Statistics+Canada+report/4220473/story.html
Marko, J. (2011). Personal communication. Needle Safe Saskatoon. (2010). 2010 Newsletter. Retrieved from: http://www.aidssaskatoon.ca/web/sites/default/files/NSS%202010%20Newsletter%20FINAL.pdf Neudorf, C., Marko, J., Wright, J., Ugolini, C., Kershaw, T., Whitehead, S., et al. (2009). Health status report 2008: A report of the Chief Medical Health Officer. Saskatoon: SHR. Opondo J. (2010). Saskatoon: Updated information on an HIV epidemic in the prairies. PowerPoint Presentation. Saskatoon.
Saskatchewan Government Insurance. (2011). 2009 Saskatchewan traffic accident facts. Regina. Retrieved from: https://www.sgi.sk.ca/sgi_pub/road_safety/trafficcollisionstats/pdf/2009/TAIS2009section10.pdf
Saskatchewan Liquor and Gaming Authority. (2009). Saskatchewan Liquor and Gaming Authority 2008-09 Annual Report: Supplementary Information. Regina: SLGA. SLGA. (2010). Saskatchewan Liquor and Gaming Authority 2009-10 Annual Report: Supplementary Information. Regina: SLGA. Saskatchewan Ministry of Health. (2011). Community Care Branch, Community Program Profile 2009-10, unpublished. Regina: Ministry of Health. Saskatchewan Ministry of Health. (nd). Saskatchewan’s HIV strategy: 2010-2014. Regina: Ministry of Health. Retrieved from: http://www.allnationshope.ca/Documents/hiv-strategy-2010-2014.pdf Saskatchewan Ministry of Health. (2010). Saskatchewan unveils multi-year HIV strategy. Regina: Ministry of Health. Retrieved from: http://www.gov.sk.ca/news?newsId=55fce4d6-0116-4b87-b300-c9250d71105a Saskatoon Health Region. (nd). Preliminary results from the 2009 Enhanced Street Youth Survey. Saskatoon Health Region. (2009). – 2009-2010 Annual Report to The Minister of Health. Saskatoon: SHR. Retrieved from:

21
http://www.saskatoonhealthregion.ca/about_us/documents/shr_annual_report_2009_10.pdf Saskatoon Police Service. (2010). Month-end and year-end crime statistics. Retrieved from: http://www.police.saskatoon.sk.ca/pdf/Dec_Monthend_Detail.pdf
Saskatoon Regional Economic Development Authority. (2011). Business statistics. Retrieved from: http://www.sreda.com/en/pages/354/business_statistics.html
Spitzig, Doug. (2011). Personal communication. Statistics Canada. (2007). Saskatoon, Saskatchewan (Code4711066) (table). 2006 Community Profiles. 2006 Census. Statistics Canada Catalogue no. 92-591-XWE. Ottawa. Retrieved from: http://www12.statcan.ca/census-recensement/2006/dp-pd/prof/92-591/index.cfm?Lang=E Statistics Canada. (2010). Labour Force Information. Catalogue no. 71-001-X. Ottawa. Retrieved from: http://www.statcan.gc.ca/pub/71-001-x/71-001-x201003_eng.html Wright, J. (2011). Personal communication.

22
Appendices
Appendix I: Quantitative Data Sources
• Canadian Alcohol and Drug Use Monitoring Survey (CADUMS): http://www.hc-sc.gc.ca/hc-ps/drugs-drogues/stat/index-eng.php
• Canadian Tobacco Use monitoring Survey (CTUMS): http://www.hc-sc.gc.ca/hc-ps/tobac-tabac/research-recherche/stat/ctums-esutc_2008-eng.php
• Youth Smoking Survey (YSS): http://www.yss.uwaterloo.ca/index.cfm?section=1&page=111
• Healthy Behavior in School Age Children (HBSC): http://www.hbsc.org/countries/canada.html
• SLGA contact information for annual sales reports: Communications Branch Saskatchewan Liquor and Gaming Authority P.O Box 5054 2500 Victoria Avenue Regina, Saskatchewan S4P 3M3 Phone: (306) 787-1721 Fax: (306) 787-8468
• Saskatoon Student Health Survey: http://www.saskatoonhealthregion.ca/your_health/ps_public_health_pho_student_health_survey.htm
• Enhanced Street Youth Study: http://www.phac-aspc.gc.ca/sti-its-surv-epi/report07/index-eng.php
• Saskatoon Health Region Reports: http://www.saskatoonhealthregion.ca/news_you_need/media_centre/publications.htm
Data access: http://www.saskatoonhealthregion.ca/about_us/privacy_access.htm
• Needle Safe Saskatoon: Newsletter may be accessed through AIDS Saskatoon website http://www.aidssaskatoon.ca/web/node/37
• SGI Traffic Collision Statistics: https://www.sgi.sk.ca/sgi_pub/road_safety/trafficcollisionstats/index.htm
• Uniform Crime Reporting Survey: http://www.statcan.gc.ca/cgi-bin/imdb/p2SV.pl?Function=getSurvey&SDDS=3302&lang=en&db=imdb&adm=8&dis=2
• Saskatoon Police Services crime statistics: http://www.police.saskatoon.sk.ca/index.php?loc=downloads.php
• Adult Criminal Court Survey: http://www.statcan.gc.ca/cgi-bin/imdb/p2SV.pl?Function=getSurvey&SDDS=3312&lang=en&db=imdb&adm=8&dis=2

23
• Youth Court Survey: http://www.statcan.gc.ca/cgi-bin/imdb/p2SV.pl?Function=getSurvey&SDDS=3309&lang=en&db=imdb&adm=8&dis=2
• RCMP Drug Situation Reports: http://www.rcmp-grc.gc.ca/drugs-drogues/index-eng.htm
• Drug Analysis Service: http://www.hc-sc.gc.ca/hc-ps/substancontrol/analys-drugs-drogues/index-eng.php
• College of Physicians and Surgeons: http://www.quadrant.net/cpss/index.html
• Saskatchewan Ministry of Health Community Care Branch: http://www.health.gov.sk.ca/community-care
• Canadian Institutes for Health Information: http://www.cihi.ca/CIHI-ext-portal/internet/EN/Home/home/cihi000001
Appendix II: Sources of qualitative data for Saskatoon:
• AIDS Saskatoon newsletters and reports: http://www.aidssaskatoon.ca/web/
• Saskatoon Health Region reports and publications:
http://www.saskatoonhealthregion.ca/news_you_need/media_centre/publications.htm
• Local studies by U of S researchers
24
Appendix III: Tables
Table 1:
Question: How serious a problem has (substance) been in Saskatoon over the past 12 months?
Substance Responses [n (%)]
Very serious Somewhat
serious Very or somewhat serious (combined)
Not at all serious
Don't know # answered
Cocaine/crack 20 (39.2) 24 (47.1) 44 (86.3) 3 (5.9) 4 (7.8) 51 Heroin 1 (2.0) 13 (25.5) 14 (27.5) 24 (47.1) 13 (25.5) 51 Cannabis 25 (50.0) 18 (36.0) 43 (86.0) 4 (8.0) 3 (6.0) 50 Hallucinogens 0 (0) 16 (32.7) 16 (32.7) 15 (30.6) 18 (36.7) 49 Opoiod prescription drugs 30 (62.5) 11 (22.9) 41 (85.4) 2 (4.2) 5 (10.4) 48 Other prescription drugs 11 (26.8) 19 (46.3) 30 (73.1) 3 (7.3) 8 (19.5) 41 Amphetamines 19 (40.4) 13 (27.7) 32 (68.1) 9 (19.1) 6 (12.8) 47 Ecstasy 14 (31.1) 12 (26.7) 26 (57.8) 7 (15.6) 12 (26.7) 45 Illicit methadone 10 (21.7) 16 (34.8) 26 (56.5) 5 (10.9) 15 (32.6) 46 Steroids 0 (0) 5 (11.1) 5 (11.1) 11 (24.4) 29 (64.4) 45 Solvents 6 (13.6) 12 (27.3) 18 (40.9) 10 (22.7) 16 (36.4) 44 Non-potable substances 8 (17.8) 22 (48.9) 30 (66.7) 1 (2.2) 14 (31.1) 45 Alcohol 30 (69.8) 5 (11.6) 35 (81.4) 4 (9.3) 4 (9.3) 43

25
Table 2:
Question: Who are the typical users of (substance) in Saskatoon? (check all that apply)
Youth under 19 Age 19-29 Age 30-49 Age 50-69 Age 70 and above
Typical users of: Females Males Females Males Females Males Females Males Females Males Don't know # answered
Cocaine/crack 9 (19.1) 10 (21.3) 32 (68.1) 35 (74.5) 16 (34.0) 20 (42.6 2 (4.3) 3 (6.4) 0 (0) 0 (0) 7 (14.9 47
Heroin 2 (5.6) 1 (2.8) 10 (27.8) 13 (36.1) 9 (25.0) 10 (27.8) 1 (2.8) 2 (5.6) 0 (0) 0 (0) 20 (55.6) 36
Cannabis 37 (80.4) 39 (84.8) 35 (76.1) 36 (78.3) 28 (60.9) 31 (67.4) 6 (13.0) 6 (13.0) 1 (2.2) 1 (2.2) 2 (4.3) 46
Hallucinogens 16 (51.6) 17 (54.8) 14 (45.2) 15 (48.4) 3 (9.7) 3 (9.7) 0 (0) 0 (0) 0 (0) 0 (0) 11 (35.5) 31 Opoiod prescription drugs 22 (52.4) 21. (50.0) 37 (88.1) 36 (85.7) 35 (83.3) 33 (78.6) 19 (45.2) 18 (42.9) 5 (11.9( 5 (11.9) 3 (7.1) 42 Other prescription drugs 14 (35.9) 14 (35.9) 29 (74.4) 27 (69.2) 30 (76.9) 28 (71.9) 20 (51.3) 18 (46.2) 4 (10.3) 4 (10.3) 8 (20.5) 39
Amphetamines 22 (61.1) 24 (66.7) 27 (65.0) 27 (65.0) 13 (36.1 12 (33.3) 0 (0) 0 (0) 0 (0) 0 (0) 6 (16.7) 36
Ecstasy 28 (82.4) 27 (79.4) 22 (64.7) 22 (64.7) 1 (2.9) 1 (2.9) 0 (0) 0 (0) 0 (0) 0 (0) 4 (11.8) 34
Illicit methadone 3 (10.0) 2 (6.7) 20 (66.7) 19 (63.3) 15 (50.0) 15 (50.0) 7 (23.3) 7 (23.3) 4 (13.3) 4 (13.3) 9 (30.0) 30
Steroids 0 (0) 8 (66.7) 0 (0) 9 (75.0) 0 (0) 4 (33.3) 0 (0) 0 (0) 0 (0) 0 (0) 3 (25.0) 12
Solvents 13 (54.2) 15 (62.5) 7 (29.2) 11 (48.8) 5 (20.8) 8 (33.3) 5 (20.8) 5 (20.8) 2 (8.3) 2 (8.3) 3 (12.5) 24 Non-potable substances 13 (43.3) 12 (40.0) 15 (50.0) 15 (50.0) 18 (60.0) 20 (66.7) 12 (40.0) 12 (40.0) 4 (13.3) 4 (13.3) 3 (10.0) 30
Alcohol 33 (91.7) 34 (94.4) 35 (97.2) 35 (97.2) 27 (75.0) 29 (80.6) 23 (63.9) 24 (66.7) 7 (19.4) 7 (19.4) 0 (0) 36