alcohol analytes collected on synthetic charcoal sorbent tubes
TRANSCRIPT

OSHA Method 5001 1 of 7
Organic Vapor Sampling Group 2 (OVSG-2)
Alcohol Analytes Collected on Synthetic Charcoal Sorbent Tubes
Method number: 5001
Version number: 1.2
Validated analytes: Analyte CAS No. 2-Butoxyethanol 111-76-2 n-Butyl alcohol 71-36-3 sec-Butyl alcohol 78-92-2 Ethyl alcohol (ethanol) 64-17-5 Isobutyl alcohol 78-83-1 Isopropyl alcohol 67-63-0 Methyl alcohol 67-56-1 n-Propyl alcohol 71-23-8
Procedure: Collect samples by drawing workplace air containing specified alcohol vapors through two Anasorb 747 synthetic charcoal sorbent tubes connected in series. Extract samples with 60/40 (v/v) N,N-dimethylformamide/carbon disulfide (DMF/CS2) and analyze by gas chromatography (GC) using a flame ionization detector (FID). The analytes listed above are compatible with the sorbent, extraction solvent, and analytical parameters of Method 5001, and may be sampled separately or together.
Recommended sampling time and sampling rate:
*240 min at 50 mL/min (12 L) *exceptions: methyl alcohol 100 min at 50 mL/min (5 L) if relative humidity is ≥ 50% at 25 °C methyl alcohol 60 min at 50 mL/min (3 L) if relative humidity is < 50% at 25 °C
Special requirements: Immediately after sampling, separate and cap the two sampling tubes to prevent post-sampling migration.
Validation status: Data found in the respective method appendices have been subjected to the established validation procedures of the OSHA Method Development Team. The method is considered to be fully validated for all analytes so designated.
March 2019 (Version 1.0) Michael Simmons February 2021 (Version 1.1, format change only) June 2021 (Version 1.2, added Appendix H for 2-Butoxyethanol)
Method Development Team
Industrial Hygiene Chemistry Division OSHA Salt Lake Technical Center
Sandy UT 84070-6406
OSHA Method 5001 2 of 7
1 Introduction
For assistance with accessibility problems in using figures and illustrations presented in this method, please contact the Salt Lake Technical Center (SLTC) at (801) 233-4900. This procedure was designed and tested for internal use by OSHA personnel. Mention of any company name or commercial product does not constitute endorsement by OSHA. This method harmonizes the sampling, sample preparation and analysis of alcohol analytes collected on two Anasorb 747 sorbent tubes connected in series that are extracted with 60/40 (v/v) N,N-dimethylformamide/carbon disulfide (DMF/CS2). Validation data for each analyte are described in the relevant appendices.
2 Sampling Procedure
Follow all safety practices that apply to the work area where sampling occurs. Wear eye protection when breaking off ends of flame-sealed glass sampling tubes.
2.1 Apparatus
Two single section 8-mm x 110-mm glass sampling tubes packed with 20/40 mesh Anasorb 747 sorbent are required for sampling. The front tube contains 400 mg and the back tube contains 200 mg. Connect the tube in series with a 1-inch length of ¼ -inch i.d. silicone tubing. The sorbent is held in place with glass wool on the inlet side and a foam plug on the outlet side. Commercially available tube sets were purchased from SKC Inc. (catalog no. 226-82) for method development. Sorbent tubes are provided to OSHA field activities through official sampling media procurement channels, and sorbent tubes are labeled with expiration dates. Store unused sorbent tubes at room temperature prior to use, and discard sorbent tubes when expiration dates are exceeded. A sampling tube holder, such as SKC Inc. tube cover D (catalog no. 224-29D), is used to protect a sampled worker from the sharp ends of the glass sampling tubes. A personal sampling pump calibrated to within ±5.0% of the recommended flow rate with a representative sampling device in-line is used to draw air through a sampling tube. When possible, sample over the duration specified for the specific target analyte. If sampling for multiple target analytes, sample no longer than the shortest duration specified for each of those analytes.
2.2 Reagents
None Required
2.3 Technique
Immediately before sampling, break off the ends of the flame-sealed tubes to provide an opening approximately half the internal diameter of the tube. Connect the outlet end of the 400-mg tube to the inlet end of the 200-mg tube with a 1-inch length of ¼-inch i.d. silicone tubing. Place tubes into a sampling tube holder to minimize the hazard to the worker from the broken ends of the tubes. All tubes submitted for analysis (including field blanks) should be from the same lot. Attach the tube holder (with the adsorbent tubes) to the sampling pump so that the inlet side adsorbent tube is in an approximately vertical position with the inlet facing down in the worker’s breathing zone during sampling. Position the sampling pump, tube holder, and tubing so they do not impede worker performance or safety of an employee being sampled. The air being sampled should not pass through any hose or tubing before entering the inlet sampling tube. Sample at 50 mL/min for 240 min (12 L) for all analytes except as specified under “recommended sampling time and sampling rate” on page 1 of this method and as explained in the respective method appendices.

OSHA Method 5001 3 of 7
After sampling for the appropriate time, seal each tube with plastic end-caps. Seal each sample end-to-end with a Form OSHA-21 as soon as possible. Submit at least one field blank sample with each set of samples. Handle the field blank sample in the same manner as the other samples except draw no air through it. Record sample air volume (liters), sampling time (min) and sampling rate (mL/min) for each sample, along with any potential interference on the Form OSHA-91A. Submit samples to the laboratory for analysis as soon as possible after sampling. If a delay is unavoidable, store the samples in a refrigerator as a precaution.
3 Analytical Procedure
3.1 Apparatus
• Mechanical vial rotator • One liter amber glass solvent dispenser capable of dispensing 2.00 mL • Syringes (10 and 50-µL) • Class A graduated cylinder to deliver (100-mL) • Class A volumetric pipette (1-mL) • Class A volumetric flasks (2 and 500-mL) • Amber glass vials with polytetrafluoroethylene (PTFE)-lined screw caps (2 and 4-mL) • GC instrument with FID
3.2 Reagents
• 2-Butoxyethanol (>99%, analytical grade) • n-Butyl alcohol (>99%, analytical grade) • sec-Butyl alcohol (>99%, analytical grade) • Ethyl alcohol (ethanol) (>99%, analytical grade) • Isobutyl alcohol (>99%, analytical grade) • Isopropyl alcohol (>99%, analytical grade) • Methyl alcohol (>99%, analytical grade) • n-Propyl alcohol (>99%, analytical grade) • Carbon disulfide (CS2, reagent grade or better) • N,N-Dimethylformamide (DMF, reagent grade or better) • 1-Octanol (> 99%, analytical grade)
3.3 Reagent Preparation
Extraction solvent (60/40 (v/v) DMF/CS2 with 2.00 µL/mL 1-octanol as an internal standard (ISTD)): To a 500-mL volumetric flask add 300 mL of N,N-dimethylformamide, 1.00 mL of 1-octanol, then carbon disulfide to the mark. Immediately mix the solution and transfer to an amber glass solvent dispenser.
3.4 Standard Preparation
Prepare calibration standards by injecting microliter amounts of the neat chemical into various 2-mL volumetric flasks containing approximately 1 mL of the extraction solvent. Fill to the mark with extraction solvent, mix, and transfer to 2-mL amber glass autosampler vials. Multiple analytes in one calibration standard can substantially dilute the final concentration of the ISTD when it is pre-mixed with the extraction solvent. To minimize this effect on the calibration,

OSHA Method 5001 4 of 7
correct the ISTD concentration for each standard when calibrating. If sample concentrations are greater than the range of prepared standards, dilute high samples with extraction solvent and reanalyze the diluted samples.
3.5 Sample Preparation
Remove the plastic end-caps from the 400-mg and 200-mg sample tubes. Transfer the respective 400 and 200-mg Anasorb 747 sections into separate 4-mL vials. Discard glass tubes, foam, and glass wool plugs. Add 2.00 mL of extraction to each vial and immediately seal with PTFE-lined caps. Extract the samples by rotating for 1 hour. Transfer the extraction solution in each 4-mL vial to a 2-mL amber glass autosampler vial and seal with PTFE-lined caps.
3.6 Analysis
Analyze samples using a GC-FID instrument and the analytical parameters described below. Use an ISTD calibration method. For each analyte, construct an ordinary least-squares linear regression curve by plotting ISTD-corrected response of standard injections versus micrograms of analyte per sample. A weighted least-squares linear curve using a x-1 weight can be used to minimize the influence of heteroscedasticity and improve accuracy at the lower end of the regression curve. Confirm the presence of analytes when an OSHA Permissible Exposure Limit (PEL) value has been exceeded, as described in Section 3.8. See Figure 1 below for an example of chromatograms obtained from standards containing analyte mass concentrations equivalent to sampling for the recommended time with each analyte at its respective OSHA 8-hour time weighted average PEL value. GC parameters
column: Agilent J&W DB-WAX capillary column, 60-m × 0.32-mm i.d., df = 0.5-µm, or equivalent
inlet liner: Restek Topaz 4.0-mm ID Precision Inlet Liner w/wool (Catalog no. 23305, or equivalent)
carrier: hydrogen, constant flow 2 mL/min
septum purge: hydrogen, 3.0 mL/min
injection: 1.0 µL, split injection, 150:1 ratio
inlet temperature: 235 °C oven temperature program: 40 °C (hold 4 min), ramp to 70 °C at 5 °C/min (hold 0 min), ramp to 205 °C at 15 °C/min
(hold 0 min), ramp to 240 °C at 35 °C/min (hold 0 min)
run time: 20 min retention times: 4.72 min - CS2
7.88 min - methyl alcohol 8.76 min - isopropyl alcohol 8.95 min - ethyl alcohol (ethanol) 11.39 min - sec-butyl alcohol 11.71 min - n-propyl alcohol 12.80 min - isobutyl alcohol

OSHA Method 5001 5 of 7
13.78 min - n-butyl alcohol 16.63 min - DMF 17.20 min - 2-butoxyethanol 18.53 min - ISTD
FID parameters
detector temperature: 240 °C
hydrogen flow: 40 mL/min
air flow: 450 mL/min
nitrogen make up flow: 45 mL/min
Figure 1. Example chromatogram. Peak labels: (1) CS2, (2) methyl alcohol, (3) isopropyl alcohol, (4) ethyl alcohol (ethanol), (5) sec-butyl alcohol, (6) n-propyl alcohol, (7) isobutyl alcohol, (8) n-butyl alcohol, (9) DMF, (10) 2-butoxyethanol, (11) ISTD.
3.7 Calculations
Calculate the micrograms recovered per sample (m) for each analyte. The back sorbent section is analyzed primarily to determine the extent of sampler saturation. If any analyte is found on the back section, it is added to the amount found on the front section. If more than 20% of the total amount is found on the back section, report that the sampler may have been saturated on the Form OSHA-91B. Correct m for each sample by subtracting the mass of analyte (if any) found on the sample blank. The analyte air concentration (C ) is calculated in mass per volume units (mg/m3) using Equation 1, where V is the volume of air sampled (L), and EE is the extraction efficiency expressed in decimal format.
𝐶𝐶 =𝑚𝑚𝑉𝑉𝐸𝐸𝐸𝐸
Equation 1
The air concentration (Cppm) in terms of parts of analyte vapor per million parts of air (ppm) is obtained using Equation 2, where C is the air concentration with mass per volume units (mg/m3) calculated using Equation 1, VM is the molar volume of an ideal gas or vapor at 25 °C and 760 Torr (24.46 L/mol), and M is the analyte molar mass (g/mol).
𝐶𝐶𝑝𝑝𝑝𝑝𝑝𝑝 =𝐶𝐶𝑉𝑉𝑀𝑀𝑀𝑀 Equation 2
Values for EE, obtained during validation studies, and M are listed in Table 1 along with the OSHA Integrated Management Information System (IMIS) numbers for each analyte.
0
100
200
0 5 10 15 20
11
10
9
87
65
4
3
21
Time (min)
Resp
onse
(pA)

OSHA Method 5001 6 of 7
Table 1. Molar mass, extraction efficiencies, and OSHA Integrated Management Information System (IMIS) numbers for Method 5001 analytes.
analyte M (g/mol) EE IMIS 2-butoxyethanol 118.2 1.000 0435 n-butyl alcohol 74.12 1.015 0460 sec-butyl alcohol 74.12 1.025 0461 ethyl alcohol (ethanol) 46.07 1.009 1060 isobutyl alcohol 74.12 1.022 1536 isopropyl alcohol 60.09 1.024 1560 methyl alcohol 32.04 0.988 1660 n-propyl alcohol 60.09 1.017 2170
3.8 Qualitative Analysis
When necessary, the identity of an analyte peak can be confirmed by gas chromatography – mass spectrometry (GC-MS) using the analytical parameters described below. Confirm the presence of an analyte by matching the retention time and fragmentation pattern of a standard at a similar concentration. See Figure 2 for an example total ion current (TIC) chromatogram obtained from a standard containing analyte concentrations equivalent to sampling for the recommended time for each analyte at its respective OSHA 8-hour time weighted average PEL value. GC parameters
column: Agilent J&W DB-WAX capillary column, 60-m × 0.32-mm i.d., df = 0.5-µm, or equivalent
inlet liner: Restek Topaz 4.0-mm ID Precision Inlet Liner w/wool (Catalog no. 23305, or equivalent)
carrier: helium, constant flow 1.6 mL/min
septum purge: helium, 3.0 mL/min
injection: 1.0 µL, split injection, 150:1 ratio
inlet temperature: 235 °C
oven temperature program: 40 °C (hold 4.15 min), ramp to 70 °C at 4.7 °C/min (hold 0 min), ramp to 205 °C at 13 °C/min (hold 0 min), ramp to 240 °C at 35 °C/min (hold 0 min)
run time: 21.9 min
retention times: 8.80 min - methyl alcohol 8.96 min - isopropyl alcohol 9.16 min - ethyl alcohol (ethanol) 11.92 min - sec-butyl alcohol 12.28 min - n-propyl alcohol 13.56 min - isobutyl alcohol 14.71 min - n-butyl alcohol 18.79 min - 2-butoxyethanol 20.39 min - ISTD
mass spectrometer parameters
mode: 70 eV electron ionization

OSHA Method 5001 7 of 7
acquisition mode: scan, m/z 20 – 150
solvent delay: 6 min
timed events: 17.8 – 18.20 min MS off
EMV mode: gain factor (1)
temperatures: 250 °C (source), 200 °C (quadrupole assembly), 250 °C (transfer line)
Figure 2. Example TIC GC-MS chromatogram. Peak labels: (1) methyl alcohol, (2) isopropyl alcohol, (3) ethyl alcohol (ethanol), (4) sec-butyl alcohol, (5) n-propyl alcohol; (6) isobutyl alcohol, (7) n-butyl alcohol, (8) 2-butoxyethanol, (9) ISTD.
0
2x10⁶
4x10⁶
6 8 10 12 14 16 18 20
9
8
76
54
32
1
Time (min)
Abun
danc
e (T
IC)

OSHA Method 5001, Appendix A, Methyl Alcohol 1 of 7
OSHA 5001, Appendix A Methyl Alcohol
Version: 1.1 OSHA PEL: ACGIH TLV:
200 ppm (260 mg/m3) 8-Hour TWA, General Industry, Construction, Shipyard 200 ppm (262 mg/m3) 8-Hour TWA, 250 ppm (328 mg/m3) 15-Minute STEL
Recommended sampling time and sampling rate:
100 min at 50 mL/min (5 L) if relative humidity is ≥ 50% at 25 °C 60 min at 50 mL/min (3 L) if relative humidity is < 50% at 25 °C
Reliable quantitation limit: 1.1 ppm (1.4 mg/m3) Standard error of estimate: 5.2% Status: Fully validated. Method 5001 has been subjected to the established validation
procedures of the Method Development Team for sampling and analysis of methyl alcohol.
October 1991 (OSHA 91) Warren Hendricks March 2019 (OSHA 5001, Version 1.0) Michael Simmons February 2021 (OSHA 5001, Version 1.1)
1 Introduction
1.1 Previous Methods used by OSHA for Sampling and Analysis of Methyl Alcohol
The specific analyte described in this appendix is methyl alcohol, CAS No. 67-56-1. The methodologies described in this appendix for methyl alcohol are based on OSHA Method 91.0F
1 That method requires the collection of samples using two Anasorb 747 sorbent tubes, extraction using 50/50 (v/v) N,N-dimethylformamide/carbon disulfide, and analysis by gas chromatography using a flame ionization detector.
1.2 Changes to the Previously-Used Method
This appendix represents an update of OSHA Method 911, which was fully validated at the time it was published based on the validation guidelines in effect at that time. Compared to the previous method used this method includes new analytical parameters, internal standard (ISTD), extraction solvent, and extraction solvent volume. Data presented from the previously used method are identified by the statement “Pre-existing data from OSHA Method 911 are presented in this section”. The changes were made to allow the standardized collection and analysis of methyl alcohol with other analytes found in Organic Vapor Sampling Group 2, described in OSHA Method 5001. Version 1.1 of this appendix represents an update to the format of version 1.0, with no new sampling or analytical data added.
1.3 Validation Parameters
The procedures used to develop the method validation data are described in Validation Guidelines for Air Sampling Methods Utilizing Chromatographic Analysis.1F
2 Air concentrations listed in ppm are referenced to 25 °C and 760 Torr.
1 Hendricks, W. Methyl Alcohol (OSHA Method 91), 1991. United States Department of Labor, Occupational Safety & Health
Administration Web site. https://www.osha.gov/dts/sltc/methods/archive/org091/org091.pdf (accessed February 2021). 2 Eide, M.; Simmons, M.; Hendricks, W. Validation Guidelines for Air Sampling Methods Utilizing Chromatographic Analysis, 2010.
United States Department of Labor, Occupational Safety & Health Administration Web site. http://www.osha.gov/dts/sltc/methods/chromguide/chromguide.pdf (accessed December 2018).

OSHA Method 5001, Appendix A, Methyl Alcohol 2 of 7
The target concentration for method evaluation was the OSHA 8-hour time-weighted average (TWA) permissible exposure limit (PEL) for methyl alcohol.
2 Detection and Quantification
2.1 Detection Limit of the Analytical Procedure (DLAP)
The DLAP is the analyte mass introduced onto the chromatographic column that produces a response greater than 3× the standard error of estimate (DLAP Sy/x) divided by the slope of the line produced from analyses of ten analytical standards prepared with equally spaced increments of analyte mass. The standards were prepared in such a way that the highest standard concentration would produce a peak approximately 10 times the response of a reagent blank at or near the chromatographic retention time of the analyte. The standards and a reagent blank were analyzed with the recommended analytical parameters described in OSHA Method 5001. The resulting data provided the DLAP Sy/x and slope values for DLAP determination. Results obtained for these analyses are listed in Table A-1, and plotted in Figure A-1. Table A-1. DLAP data for methyl alcohol.
concentration (µg/mL)
mass on column (pg)
area counts (µV∙s)
0.00 0.515 1.03 1.54 2.06 2.57 3.08 3.60 4.12 4.63 5.15
0.00 3.43 6.87 10.3 13.7 17.1 20.6 24.0 27.4 30.9 34.3
0.00 0.0210 0.0290 0.0920 0.0800 0.120 0.153 0.164 0.194 0.211 0.232
Figure A-1. Plot of data used to determine the DLAP for methyl alcohol (y = 0.00698x - 0.00180, DLAP Sy/x = 0.0114, DLAP = 4.90 pg).
2.2 Detection Limit of the Overall Procedure and Reliable Quantitation Limit (RQL)
The DLOP is the analyte mass introduced onto the chromatographic column that produces a response greater than 3× the standard error of estimate (DLOP Sy/x) divided by the slope of the line produced from analyses of ten samples prepared from sorbent tubes spiked with equally spaced increments of analyte mass. Sorbent tubes were spiked in such a way that the highest mass loading produced a peak approximately 10 times greater than that of a sample blank at or near the chromatographic retention time of the analyte. The RQL is expressed as an air concentration that will provide sufficient analyte mass per sample that produces a response greater than 10× DLOP Sy/x divided by the slope of the line described above. The spiked samplers and a sample blank were analyzed with the recommended analytical parameters described in OSHA Method 5001. The resulting data provided the DLOP Sy/x and the slope values for DLOP and RQL determinations. Results obtained from these analyses are listed in Table A-2, and plotted in Figure A-2.
0
0.05
0.10
0.15
0.20
0.25
0 5 10 15 20 25 30 35DLAP
Mass (pg) Injected Onto Column
Area
Cou
nts
(µV•
s)

OSHA Method 5001, Appendix A, Methyl Alcohol 3 of 7
Table A-2. DLOP and RQL data for methyl alcohol.
mass per sample (µg/sample)
area counts (µV∙s)
0.00 1.03 2.06 3.09 4.11 5.14 6.17 7.20 8.23 9.26 10.3
0.00 0.00
0.0540 0.0880 0.145 0.141 0.172 0.180 0.216 0.220 0.266
Figure A-2. Plot of data used to determine the DLOP and RQL for methyl alcohol (y = 0.0257x + 0.00264, DLOP Sy/x = 0.0179, DLOP = 2.09 µg/sample, RQL = 6.96 µg/sample or 1.06 ppm).
3 Analytical Precision Across the Calibration Range
Fifteen analytical standards over a range of 0.1 to 2 times the analyte concentration in solvent that would be obtained from sampling for the recommended time at the target concentration were analyzed with the recommended analytical parameters described in OSHA Method 5001. An ordinary least-squares linear regression curve was created by plotting the analyte mass per sample versus the corresponding ratio of analyte peak area to internal standard (ISTD) peak area. The resulting data provided the standard error of estimate (Calibration Sy/x) value across the calibration range, which provides an indication of the imprecision attributable to the instrumental analysis of the target analyte. Results from these analyses are listed in Table A-3, and plotted in Figure A-3. Table A-3. Analytical precision data for methyl alcohol.
× target concn
(µg/sample)
0.1× 0.5× 1.0× 1.5× 2.0×
134.5 672.5 1345 2018 2690
area ratio 0.01440 0.01510 0.01490
0.07910 0.08100 0.08300
0.1672 0.1642 0.1652
0.2445 0.2463 0.2494
0.3306 0.3266 0.3333
Figure A-3. Plot of data used to determine the precision of the analytical method for methyl alcohol (y = 0.000123x - 0.00158, Calibration Sy/x = 0.00203).
4 Sampler Storage Stability
Pre-existing data from OSHA Method 911 are presented in this section.
0
0.1
0.2
0.3
0 1 2 3 4 5 6 7 8 9 10 11
RQLDLOP
Mass (µg) per Sample
Area
Cou
nts
(µV•
s)
0
0.1
0.2
0.3
0 1000 2000
Mass (µg) per Sample
Area
Rat
io

OSHA Method 5001, Appendix A, Methyl Alcohol 4 of 7
Storage stability test samples for methyl alcohol were prepared by sampling a dynamically generated controlled test atmosphere, using the system described in Section 13. Sampling from this system followed the recommended sampling parameters published in OSHA Method 91 except the sampling time was reduced to 50 min. The nominal concentration of methyl alcohol for both ambient and refrigerated storage testing was twice the target concentration (calculated to be 405 ppm). The relative humidity and temperature of the air sampled were 60% and 27 °C for both tests. For each test, twenty-one samples were prepared, and six of these were analyzed on the day that samples were created. The remaining fifteen refrigerated storage test samples were stored at reduced temperature (-2 °C), while the remaining fifteen ambient storage test samples were kept in a closed drawer at ambient temperature (24 °C). For each storage condition, three samples were selected and analyzed from those remaining at 3-4 day intervals. The results of these analyses (uncorrected for extraction efficiency) are provided in Table A-4, and plotted in Figures A-4 through A-5. The recovery of methyl alcohol calculated from the regression line generated for the 18-day ambient storage test was 88.6%. Table A-4. Sampler storage stability data for methyl alcohol.
time (days)
ambient storage recovery (%)
refrigerated storage recovery (%)
0 94.7 91.2 94.6 94.8 91.9 95.4 0 94.8 91.9 95.4 94.7 91.2 94.6 4 91.3 89.2 90.5 93.3 93.8 93.8 8 89.5 91.3 90.6 93.4 91.3 93.1
11 93.1 90.3 91.2 96.7 94.4 96.3 14 90.5 88.7 91.0 94.4 93.1 92.9 18 88.7 89.0 87.0 81.0 90.8 91.4
Figure A-4. Plot of ambient storage stability data for methyl alcohol.
Figure A-5. Plot of refrigerated storage stability data for methyl alcohol.
5 Precision of the Overall Procedure
Pre-existing data from OSHA Method 911 are presented in this section. The overall standard error of estimate obtained from the ambient storage test analyses described in Section 4 and sampling pump variability were used to determine the precision of the overall procedure, where all aspects of sampling and analysis (sampling, sorbent tube handling and solvent extraction, and instrumental analysis) are considered. This value was obtained by taking the square root of the squared ambient storage stability standard error of estimate (Storage 𝑆𝑆𝑦𝑦/𝑥𝑥
2 ) added to the squared sampling pump variability value (𝑉𝑉𝑆𝑆𝑆𝑆2 ). The resulting precision of the overall procedure at the 95% confidence level for the ambient 18-day storage test (at the target concentration) for methyl
0
20
40
60
80
100
120
0 2 4 6 8 10 12 14 16 18
y = -0.253x + 93.2Overall Std Error of Estimate = 5.2%95% Confidence Limits = ±(1.96)(5.2%) = ±10.2%
Storage Time (Days)
Reco
very
(%)
0
20
40
60
80
100
120
0 2 4 6 8 10 12 14 16 18
y = -0.195x + 94.5Overall Std Error of Estimate = 5.8%95% Confidence Limits = ±(1.96)(5.8%) = ±11.4%
Storage Time (Days)
Reco
very
(%)

OSHA Method 5001, Appendix A, Methyl Alcohol 5 of 7
alcohol was determined to be ±10.2% based on the observed ambient Storage Sy/x value of 5.2% and 𝑉𝑉𝑆𝑆𝑆𝑆 value of 5.0%.
6 Recovery and Stability of Prepared Samples
Quantitative extraction is affected by the extraction solvent, the ISTD, the sampling medium, and the technique used to extract samples. The data presented demonstrate validity for the extraction solvent, ISTD, sampling medium, and extraction technique described in OSHA Method 5001. If other combinations of these are to be used, testing must be completed to satisfy the requirements found in current OSHA sampling and analysis method validation guidelines. Acceptable testing results must be documented. A value for extraction efficiency (EE) was determined by liquid-spiking four replicate sorbent tubes across a range of analyte mass values that would be obtained from sampling at 0.1 to 2 times the target concentration value for 240 min. Four sorbent tubes were also spiked in this fashion at the target concentration after drawing humid air (80% relative humidity at 21 °C) through these tubes at 50 mL/min for 6 hours. All of the samples described above were analyzed the following day after being kept overnight at ambient temperature. The EE value at the RQL was 96.2%, while that of the working range samples (excluding the samples through which humid air had been drawn) was 98.8%. The data are shown in Table A-5. Pre-loading sorbent tubes with moisture (“wet” designation in the table) did not have an unacceptable effect on EE. Table A-5. Extraction efficiency data for methyl alcohol.
level sample number × target concn
µg per sample 1 2 3 4 mean
0.1 134.5 100.6 98.2 97.2 98.5 98.6 0.25 322.8 100.6 98.9 100.1 98.0 99.4 0.5 672.5 97.8 98.6 98.7 98.9 98.5 1.0 1345 100.0 98.5 98.8 98.7 99.0 1.5 2018 98.7 97.6 97.6 98.7 98.2 2.0 2690 98.9 98.2 98.8 99.7 98.9
RQL 6.96 91.8 97.2 95.4 100.5 96.2
1.0 (wet) 1345 99.4 99.0 100.2 99.4 99.5 The stability of sample extracts prepared according to OSHA Method 5001 was examined by retaining the sample solvent extracts for the target concentration samples described immediately above. Two of the four vials were immediately recapped with new septa following the initial analyses, and again following each re-analysis event. The other two vials retained the original punctured septa throughout. All four vials were re-analyzed at 24, 48, and 72 hours after the initial analyses, with all vials remaining in the autosampler tray kept at 22 °C. Freshly prepared standards were used for each analysis event, and each septum (whether new or previously used) was punctured four times for each injection. The resulting data are shown in Table A-6. Table A-6. Extracted sample stability data for methyl alcohol.
punctured septa replaced recovery (%)
punctured septa retained recovery (%)
time (days) 1 2 1 2
0 100.0 98.5 98.8 98.7 1 99.2 98.4 97.5 97.7 2 99.0 98.3 97.1 96.2 3 98.6 98.3 94.5 94.1

OSHA Method 5001, Appendix A, Methyl Alcohol 6 of 7
7 Sampler Capacity
Pre-existing data from OSHA Method 911 are presented in this section. The sampling capacity of a single 400 mg sorbent tube was tested by sampling a dynamically generated controlled test atmosphere, using the system described in Section 13, containing methyl alcohol nominally at two times the target concentration (calculated to be 420 ppm). The relative humidities and temperatures of the air sampled were 79% and 22 °C, 41% and 25 °C, and 13% and 22 °C, and the sampling flow rate was 50 mL/min. A sorbent tube testing system was made by placing two sampling tubes in series. The rear 400 mg tube was changed at the times corresponding to the various air volumes listed in Table A-7. Data from three sorbent tube testing systems, shown in Table A-7, were used to determine a recommended sampling volume of 5 liters for methyl alcohol when sampling at a relative humidity of 50% or greater, and 3 liters when sampling at a relative humidity less than 50%, as 80% of the respective volumes needed to produce 5% breakthrough. These results correspond to recommended sampling times of 100 and 60 min respectively as described in OSHA Method 5001. Results are plotted in Figure A-6. Table A-7. Sampler capacity data for methyl alcohol.a
79% RH, 22 °C 41% RH, 25 °C 13% RH, 22 °C air vol
(L) BT (%)
air vol (L)
BT (%)
air vol (L)
BT (%)
4.05 0.0 4.49 0.1 2.97 0.0 4.30 0.2 4.74 2.6 3.51 1.0 4.82 0.3 5.25 5.8 4.05 7.7 5.32 0.4 5.75 10.9 4.59 23.2 5.84 0.4 6.25 17.2 6.34 1.3 6.76 24.9 6.86 2.3 7.36 3.1 7.88 5.7 8.38 13.0 8.92 21.7
a RH is relative humidity and BT is breakthrough.
Figure A-6. Plot of data used to determine sampler capacity for methyl alcohol. The 5% breakthrough volumes shown are based on the curves in the figure, which are fit to the data provided in Table A-7.
8 Low Humidity
A low humidity recovery test was not performed; however, low humidity capacity tests were performed in Section 7.
9 Chemical Interference
Pre-existing data from OSHA Method 911 are presented in this section. The effect of potential chemical sampling interference was tested by sampling a dynamically generated controlled test atmosphere, using the system described in Section 13, containing methyl alcohol nominally at one and a half times the target concentration (calculated to be 314 ppm). The relative humidities and temperatures were 76% and 26 °C, and 23% and 24 °C. Toluene and butyl cellosolve were present as potential interferents, at known concentrations (calculated to be 41.1 ppm, and 6.17 ppm respectively). Samples were collected on sorbent tubes with air volumes of 4, 5, and 6 liters for the humid atmosphere testing, and 2, 3, and 4 liters for the dry atmosphere testing. After analysis, results for methyl alcohol as a mean percentage of expected recovery for both humidities was 94%.
10 Analytical Method Reproducibility
Pre-existing data from OSHA Method 911 are presented in this section.
0
5
10
15
20
25
2 3 4 5 6 7 8 9
79% RH41% RH13% RH
Air Volume (L)
Brea
kthr
ough
(%)

OSHA Method 5001, Appendix A, Methyl Alcohol 7 of 7
Samples were prepared by sampling a dynamically generated controlled test atmosphere, using the system described in Section 13, containing methyl alcohol nominally at the target concentration (calculated to be 206 ppm). The relative humidity and temperature of the air sampled were 59% and 26 °C, and the sampling flow rate was 50 mL/min. Samples were collected on six sorbent tubes for 100 min. The resulting samples were submitted to the OSHA Salt Lake Technical Center for analysis using the procedures described in OSHA Method 911 after storage for 14 days at -2 °C. The analytical results corrected for EE are provided in Table A-8. No sample result for methyl alcohol fell outside the permissible bounds set by the precision of the overall procedure determined in Section 5 of this appendix. Table A-8. Reproducibility data for methyl alcohol.
sampled (μg/sample)
recovered (μg/sample)
recovery (%)
deviation (%)
1135 1211 1149 1487 1484
1136 1191 1117 1430 1389
100.1 98.3 97.2 96.2 93.6
+0.1 -1.7 -2.8 -3.8 -6.4
11 Effect of Sampling a Low Concentration
A study has not been undertaken to verify the effect of sampling a low concentration of methyl alcohol vapor.
12 Estimation of Uncertainty
While systematic biases such as analyte storage loss are examined, and limits are placed on these, an estimation of uncertainty that encompasses both potential random and systematic error was not completed. Instead, the overall standard error of estimate was calculated from the random error inherent to the points about the regression line produced by the ambient storage test described in Section 5, as prescribed by the OSHA validation guidelines in use at the time OSHA Method 911 was originally validated. See Section 5 of this appendix for details.
13 Controlled Test Atmosphere Procedure
Dynamically generated controlled test atmospheres were created in a walk-in hood. House air was regulated using a flow-temperature-humidity control system. A measured flow of liquid methyl alcohol was introduced with a syringe pump through a short length of uncoated fused silica capillary into a heated zone near the air flow entrance of the test atmosphere generator, where it was evaporated into a measured flow of dilution air from the flow-temperature-humidity control system. The resulting methyl alcohol vapor and dilution air flowed into a mixing chamber, and then into a sampling chamber. Sampling was completed using sampling ports on the sampling chamber. Temperature and humidity measurements were obtained near the exit of the sampling chamber.

OSHA Method 5001, Appendix B, Ethyl Alcohol (Ethanol) 1 of 7
OSHA 5001, Appendix B Ethyl Alcohol (Ethanol)
Version: 1.1 OSHA PEL: ACGIH TLV:
1000 ppm (1900 mg/m3) 8-Hour TWA, General Industry, Construction, Shipyard 1000 ppm (1880 mg/m3) 15-Minute STEL
Recommended sampling time and sampling rate:
240 min at 50 mL/min (12 L)
Reliable quantitation limit: 0.26 ppm (0.49 mg/m3) Standard error of estimate: 5.2% Status: Fully validated. Method 5001 has been subjected to the established validation
procedures of the Method Development Team for sampling and analysis of ethyl alcohol (ethanol).
April 1993 (OSHA 100) Warren Hendricks March 2019 (OSHA 5001, Version 1.0) Michael Simmons February 2021 (OSHA 5001, Version 1.1)
1 Introduction
1.1 Previous Methods used by OSHA for Sampling and Analysis of Ethyl Alcohol (Ethanol)
The specific analyte described in this appendix is ethyl alcohol (ethanol), CAS No. 64-17-5. The methodologies described in this appendix for ethyl alcohol (ethanol) are based on OSHA Method 100.2F
1 That method requires the collection of samples using two Anasorb 747 sorbent tubes, extraction using 60/40 (v/v) N,N-dimethylformamide/carbon disulfide, and analysis by gas chromatography using a flame ionization detector.
1.2 Changes to the Previously Used-Method
This appendix represents an update of OSHA Method 1001, which was fully validated at the time it was published based on the validation guidelines in effect at that time. Compared to the previous method used this method includes new analytical parameters, internal standard (ISTD), and extraction solvent volume. Data presented from the previously used method are identified by the statement “Pre-existing data from OSHA Method 1001 are presented in this section”. The changes were made to allow the standardized collection and analysis of ethyl alcohol (ethanol) with other analytes found in Organic Vapor Sampling Group 2, described in OSHA Method 5001. Version 1.1 of this appendix represents an update to the format of version 1.0, with no new sampling or analytical data added.
1.3 Validation Parameters
The procedures used to develop the method validation data are described in Validation Guidelines for Air Sampling Methods Utilizing Chromatographic Analysis.3F
2 Air concentrations listed in ppm are referenced to 25 °C and 760 Torr.
1 Hendricks, W. Ethyl Alcohol (OSHA Method 100), 1993. United States Department of Labor, Occupational Safety & Health Administration Web site. https://www.osha.gov/dts/sltc/methods/archive/org100/org100.pdf (accessed February 2021). 2 Eide, M.; Simmons, M.; Hendricks, W. Validation Guidelines for Air Sampling Methods Utilizing Chromatographic Analysis, 2010.
United States Department of Labor, Occupational Safety & Health Administration Web site. http://www.osha.gov/dts/sltc/methods/chromguide/chromguide.pdf (accessed December 2018).

OSHA Method 5001, Appendix B, Ethyl Alcohol (Ethanol) 2 of 7
The target concentration for method evaluation was the OSHA 8-hour time-weighted average (TWA) permissible exposure limit (PEL) for ethyl alcohol (ethanol).
2 Detection and Quantification
2.1 Detection Limit of the Analytical Procedure (DLAP)
The DLAP is the analyte mass introduced onto the chromatographic column that produces a response greater than 3× the standard error of estimate (DLAP Sy/x) divided by the slope of the line produced from analyses of ten analytical standards prepared with equally spaced increments of analyte mass. The standards were prepared in such a way that the highest standard concentration would produce a peak approximately 10 times the response of a reagent blank at or near the chromatographic retention time of the analyte. The standards and a reagent blank were analyzed with the recommended analytical parameters described in OSHA Method 5001. The resulting data provided the DLAP Sy/x and slope values for DLAP determination. Results obtained for these analyses are listed in Table B-1, and plotted in Figure B-1.
2.2 Detection Limit of the Overall Procedure and Reliable Quantitation Limit (RQL)
The DLOP is the analyte mass introduced onto the chromatographic column that produces a response greater than 3× the standard error of estimate (DLOP Sy/x) divided by the slope of the line produced from analyses of ten samples prepared from sorbent tubes spiked with equally spaced increments of analyte mass. Sorbent tubes were spiked in such a way that the highest mass loading produced a peak approximately 10 times greater than that of a sample blank at or near the chromatographic retention time of the analyte. The RQL is expressed as an air concentration that will provide sufficient analyte mass per sample that produces a response greater than 10× DLOP Sy/x divided by the slope of the line described above. The spiked samplers and a sample blank were analyzed with the recommended analytical parameters described in OSHA Method 5001. The resulting data provided the DLOP Sy/x and the slope values for DLOP and RQL determinations. Results obtained from these analyses are listed in Table B-2, and plotted in Figure B-2.
Table B-1. DLAP data for ethyl alcohol (ethanol).
concentration (µg/mL)
mass on column (pg)
area counts (µV∙s)
0.00 0.510 1.02 1.53 2.04 2.55 3.06 3.58 4.08 4.60 5.10
0.00 3.40 6.80 10.2 13.6 17.0 20.4 23.9 27.2 30.7 34.0
0.000 0.0320 0.0600 0.0940 0.167 0.168 0.191 0.214 0.265 0.364 0.367
Figure B-1. Plot of data used to determine the DLAP for ethyl alcohol (ethanol) (y = 0.0108x - 0.00891, DLAP Sy/x = 0.0234, DLAP = 6.50 pg).
0
0.1
0.2
0.3
0.4
0 5 10 15 20 25 30 35DLAP
Mass (pg) Injected Onto Column
Area
Cou
nts
(µV•
s)

OSHA Method 5001, Appendix B, Ethyl Alcohol (Ethanol) 3 of 7
Table B-2. DLOP and RQL data for ethyl alcohol (ethanol).
mass per sample (µg/sample)
area counts (µV∙s)
0.00 1.02 2.04 3.06 4.08 5.10 6.13 7.15 8.17 9.19 10.2
0.00 0.0330 0.1000 0.0800 0.141 0.175 0.190 0.265 0.265 0.282 0.317
Figure B-2. Plot of data used to determine the DLOP and RQL for ethyl alcohol (ethanol) (y = 0.0311x + 0.00916, DLOP Sy/x = 0.0184, DLOP = 1.77 µg/sample, RQL = 5.92 µg/sample or 262 ppb).
3 Analytical Precision Across the Calibration Range
Fifteen analytical standards over a range of 0.1 to 2 times the analyte concentration in solvent that would be obtained from sampling for the recommended time at the target concentration were analyzed with the recommended analytical parameters described in OSHA Method 5001. An ordinary least-squares linear regression curve was created by plotting the analyte mass per sample versus the corresponding ratio of analyte peak area to internal standard (ISTD) peak area. The resulting data provided the standard error of estimate (Calibration Sy/x) value across the calibration range, which provides an indication of the imprecision attributable to the instrumental analysis of the target analyte. Results from these analyses are listed in Table B-3, and plotted in Figure B-3. Table B-3. Analytical precision data for ethyl alcohol (ethanol).
× target concn
(µg/sample)
0.1× 0.5× 1.0× 1.5× 2.0×
2356 11,780 22,775 35,340 47,121
area ratio 0.3763 0.3730 0.3708
1.920 1.934 1.956
3.786 3.754 3.740
5.724 5.801 5.824
7.700 7.616 7.792
Figure B-3. Plot of data used to determine the precision of the analytical method for ethyl alcohol (ethanol) (y = 0.000164x + 0.00572, Calibration Sy/x = 0.0453).
4 Sampler Storage Stability
Pre-existing data from OSHA Method 1001 are presented in this section. Storage stability test samples for ethyl alcohol (ethanol) were prepared by sampling a dynamically generated controlled test atmosphere, using the system described in Section 13. Sampling from this system followed the recommended
0
0.1
0.2
0.3
0 1 2 3 4 5 6 7 8 9 10 11
RQLDLOP
Mass (µg) per Sample
Area
Cou
nts
(µV•
s)
0
2
4
6
8
0 10000 20000 30000 40000 50000
Mass (µg) per Sample
Area
Rat
io

OSHA Method 5001, Appendix B, Ethyl Alcohol (Ethanol) 4 of 7
sampling parameters published in OSHA Method 100 except the time was reduced to 120 min. The nominal concentration of ethyl alcohol (ethanol) for both ambient and refrigerated storage testing was twice the target concentration (calculated to be 1979 ppm). The relative humidity and temperature of the air sampled were 75% and 26 °C for both tests. For each test, eighteen samples were prepared and three of these were analyzed on the same day that samples were created. The remaining fifteen refrigerated storage test samples were stored at reduced temperature (5 °C), while the remaining fifteen ambient storage test samples were kept in a closed drawer at ambient temperature (23 °C). For each storage condition, three samples were selected and analyzed from those remaining at 2-4 day intervals. The results of these analyses (uncorrected for extraction efficiency) are provided in Table B-4, and plotted in Figures B-4 through B-5. The recovery of ethyl alcohol (ethanol) calculated from the regression line generated for the 16-day ambient storage test was 102.2%. Table B-4. Sampler storage stability data for ethyl alcohol (ethanol).
time (days)
ambient storage recovery (%)
time (days)
refrigerated storage recovery (%)
0 105.0 105.4 102.4 0 102.6 104.4 100.3 3 104.2 105.4 103.3 2 104.3 105.7 102.9 7 103.4 101.6 100.7 6 102.5 105.5 102.5
10 104.2 102.9 103.4 9 104.8 103.3 100.4 14 101.3 102.7 101.6 13 106.0 104.9 103.6 16 104.6 102.3 101.7 15 103.4 106.9 102.9
Figure B-4. Plot of ambient storage stability data for ethyl alcohol (ethanol).
Figure B-5. Plot of refrigerated storage stability data for ethyl alcohol (ethanol).
5 Precision of the Overall Procedure
Pre-existing data from OSHA Method 1001 are presented in this section. The overall standard error of estimate obtained from the ambient storage test analyses described in Section 4 and sampling pump variability were used to determine the precision of the overall procedure, where all aspects of sampling and analysis (sampling, sorbent tube handling and solvent extraction, and instrumental analysis) are considered. This value was obtained by taking the square root of the squared ambient storage stability standard error of estimate (Storage 𝑆𝑆𝑦𝑦/𝑥𝑥
2 ) added to the squared sampling pump variability value (𝑉𝑉𝑆𝑆𝑆𝑆2 ). The resulting precision of the overall procedure at the 95% confidence level for the ambient 16-day storage test (at the target concentration) for ethyl alcohol (ethanol) was determined to be ±10.2% based on the observed ambient Storage Sy/x value of 5.2% and 𝑉𝑉𝑆𝑆𝑆𝑆 value of 5.0%.
0
20
40
60
80
100
120
0 2 4 6 8 10 12 14 16
y = -0.117x + 104.1Overall Std Error of Estimate = 5.2%95% Confidence Limits = ±(1.96)(5.2%) = ±10.2%
Storage Time (Days)
Reco
very
(%)
0
20
40
60
80
100
120
0 2 4 6 8 10 12 14 16
y = 0.0929x + 102.9Overall Std Error of Estimate = 5.395% Confidence Limits = ±(1.96)(5.3%) = ±10.4%
Storage Time (Days)
Reco
very
(%)

OSHA Method 5001, Appendix B, Ethyl Alcohol (Ethanol) 5 of 7
6 Recovery and Stability of Prepared Samples
Quantitative extraction is affected by the extraction solvent, the ISTD, the sampling medium, and the technique used to extract samples. The data presented demonstrate validity for the extraction solvent, ISTD, sampling medium, and extraction technique described in OSHA Method 5001. If other combinations of these are to be used, testing must be completed to satisfy the requirements found in current OSHA sampling and analysis method validation guidelines. Acceptable testing results must be documented. A value for extraction efficiency (EE) was determined by liquid-spiking four replicate sorbent tubes across a range of analyte mass values that would be obtained from sampling at 0.1 to 2 times the target concentration value for 240 min. Four sorbent tubes were also spiked in this fashion at the target concentration after drawing humid air (80% relative humidity at 21 °C) through these tubes at 50 mL/min for 6 hours. All of the samples described above were analyzed the following day after being kept overnight at ambient temperature. The EE value at the RQL was 100.0%, while that of the working range samples (excluding the samples through which humid air had been drawn) was 100.9%. The data are shown in Table B-5. Pre-loading sorbent tubes with moisture (“wet” designation in the table) did not have an unacceptable effect on EE. Table B-5. Extraction efficiency data for ethyl alcohol (ethanol).
level sample number × target concn
µg per sample 1 2 3 4 mean
0.1 2356 99.8 99.8 98.2 99.1 99.2 0.25 6283 100.4 100.6 100.6 100.5 100.5 0.5 11,780 101.5 101.6 101.4 101.8 101.6 1.0 22,775 102.5 101.8 101.5 101.8 101.9 1.5 35,341 101.6 100.9 100.6 102.1 101.3 2.0 47,121 100.7 101.0 101.1 101.0 101.0
RQL 5.89 98.9 103.2 97.9 99.8 100.0
1.0 (wet) 22,775 102.1 101.6 102.2 102.4 102.1 The stability of sample extracts prepared according to OSHA Method 5001 was examined by retaining the sample solvent extracts for the target concentration samples described immediately above. Two of the four vials were immediately recapped with new septa following the initial analyses, and again following each re-analysis event. The other two vials retained the original punctured septa throughout. All four vials were re-analyzed at 24, 48, and 72 hours after the initial analyses, with all vials remaining in the autosampler tray kept at 22 °C. Freshly prepared standards were used for each analysis event, and each septum (whether new or previously used) was punctured four times for each injection. The resulting data are shown in Table B-6. Table B-6. Extracted sample stability data for ethyl alcohol (ethanol).
punctured septa replaced recovery (%)
punctured septa retained recovery (%)
time (days) 1 2 1 2
0 102.5 101.8 101.5 101.8 1 102.0 101.5 100.4 101.0 2 102.4 101.7 100.4 100.3 3 102.1 101.8 98.0 99.0

OSHA Method 5001, Appendix B, Ethyl Alcohol (Ethanol) 6 of 7
7 Sampler Capacity
Pre-existing data from OSHA Method 1001 are presented in this section. The sampling capacity of the front section of a sampler was tested by sampling a dynamically generated controlled test atmosphere, using the system described in Section 13, containing ethyl alcohol (ethanol) nominally at two times the target concentration (calculated to be 1939 ppm). The relative humidity and temperature of the air sampled were 90% and 25 °C, and the sampling flow rate was 50 mL/min. A gas chromatograph was operated behind a sorbent tube being tested. Data shown in Table B-7 for this test were used to determine a recommended sampling volume of 12 liters for ethyl alcohol (ethanol), as 80% of the volume needed to produce 5% breakthrough. These results correspond to a recommended sampling time of 240 min. Testing using air with different (lower) relative humidity was also completed to rule out adverse capacity effects, and none were observed. The relevant parameters for these additional tests are described in OSHA Method 1001. Results are plotted in Figure B-6. Table B-7. Sampler capacity data for ethyl alcohol (ethanol).a
80% RH, 25 °C 90% RH, 25 °C 5.9% RH, 25 °C 6.1% RH, 26 °C air vol (L) BT, (%) air vol (L) BT, (%) air vol (L) BT, (%) air vol (L) BT, (%)
11.9 0.0 5.9 0.0 13.7 0.0 7.4 0.0 12.3 0.0 8.0 0.0 14.7 0.0 8.5 0.0 12.8 0.0 9.1 0.0 15.7 0.0 9.8 0.0 13.2 0.0 10.5 0.0 16.7 0.0 14.6 0.0 13.5 0.0 12.3 0.0 17.2 0.0 15.5 0.0 13.7 0.0 13.3 0.0 17.4 0.0 16.4 0.0 14.3 0.0 14.0 0.0 17.9 0.0 16.7 0.0 14.7 0.1 14.4 0.7 18.4 1.1 17.7 0.0 15.2 0.8 14.7 2.6 18.9 3.6 17.9 1.3 15.6 3.8 15.2 11.1 19.2 5.9 18.1 1.5 16.1 13.6 15.4 19.1 19.5 8.4 18.6 3.7 16.5 35.1 15.7 29.8 19.7 12.7 18.9 6.5 16.7 44.0 16.2 48.6 19.9 16.0 19.1 8.6 17.4 95.9 17.3 72.3 20.2 21.3 19.6 16.8
a RH is relative humidity and BT is breakthrough.
Figure B-6. Plot of data used to determine sampler capacity for ethyl alcohol (ethanol). The 5% breakthrough volumes shown are based on the curves in the figure, which are fit to the data provided in Table B-7.
8 Low Humidity
A low humidity recovery test was not performed; however, low humidity capacity tests were performed in Section 7.
0
5
10
15
20
10.0 12.5 15.0 17.5 20.0
6.1% RH
5.9% RH
90% RH
80% RH
Air Volume (L)
Brea
kthr
ough
(%)

OSHA Method 5001, Appendix B, Ethyl Alcohol (Ethanol) 7 of 7
9 Chemical Interference
A study has not been undertaken to verify that sampling another common organic vapor at high concentration concurrently with the sampling of ethyl alcohol (ethanol) at the target concentration does not produce anomalous results.
10 Analytical Method Reproducibility
Pre-existing data from OSHA Method 1001 are presented in this section. Samples were prepared by sampling a dynamically generated controlled test atmosphere, using the system described in Section 13, containing ethyl alcohol (ethanol) nominally at two times the target concentration (calculated to be 1919 ppm). The relative humidity and temperature of the air sampled were 82% and 26 °C, and the sampling flow rate was 50 mL/min. Samples were collected on six sorbent tubes for 120 min. The resulting samples were submitted to the OSHA Salt Lake Technical Center for analysis using the procedures described in OSHA Method 1001 after storage for 3 days at 4 °C. The analytical results corrected for EE are provided in Table B-8. No sample result for ethyl alcohol (ethanol) fell outside the permissible bounds set by the precision of the overall procedure determined in Section 5 of this appendix. Table B-8. Reproducibility data for ethyl alcohol (ethanol).
sampled (μg/sample)
recovered (μg/sample)
recovery (%)
deviation (%)
20,636 21,323 22,118 20,708 22,515 20,889
21,492 22,276 23,081 22,106 23,392 21,777
104.1 104.5 104.4 106.8 103.9 104.3
+4.1 +4.5 +4.4 +6.8 +3.9 +4.3
11 Effect of Sampling a Low Concentration
A study has not been undertaken to verify the effect of sampling a low concentration of ethyl alcohol (ethanol) vapor.
12 Estimation of Uncertainty
While systematic biases such as analyte storage loss are examined, and limits are placed on these, an estimation of uncertainty that encompasses both potential random and systematic error was not completed. Instead, the overall standard error of estimate was calculated from the random error inherent to the points about the regression line produced by the ambient storage test described in Section 5, as prescribed by the OSHA validation guidelines in use at the time OSHA Method 1001 was originally validated. See Section 5 of this appendix for details.
13 Controlled Test Atmosphere Procedure
Dynamically generated controlled test atmospheres were created in a walk-in hood. House air was regulated using a flow-temperature-humidity control system. A measured flow of liquid ethyl alcohol (ethanol) was introduced with a syringe pump through a short length of uncoated fused silica capillary into a heated zone near the air flow entrance of the test atmosphere generator, where it was evaporated into a measured flow of dilution air from the flow-temperature-humidity control system. The resulting ethyl alcohol (ethanol) vapor and dilution air flowed into a mixing chamber, and then into a sampling chamber. Sampling was completed using sampling ports on the sampling chamber. Temperature and humidity measurements were obtained near the exit of the sampling chamber.
OSHA Method 5001, Appendix C, Isopropyl Alcohol 1 of 7
OSHA 5001, Appendix C Isopropyl Alcohol
Version: 1.1 OSHA PEL: ACGIH TLV:
400 ppm (980 mg/m3) 8-Hour TWA, General Industry, Construction, Shipyard 200 ppm (491 mg/m3) 8-Hour TWA, 400 ppm (984 mg/m3) 15-Minute STEL
Recommended sampling time and sampling rate:
240 min at 50 mL/min (12 L)
Reliable quantitation limit: 0.17 ppm (0.41 mg/m3) Standard error of estimate: 5.2% Status: Fully validated. Method 5001 has been subjected to the established validation
procedures of the Method Development Team for sampling and analysis of isopropyl alcohol.
October 1997 (OSHA 109) Mary Eide March 2019 (OSHA 5001, Version 1.0) Michael Simmons February 2021 (OSHA 5001, Version 1.1)
1 Introduction
1.1 Previous Methods used by OSHA for Sampling and Analysis of Isopropyl Alcohol
The specific analyte described in this appendix is isopropyl alcohol, CAS No. 67-63-0. The methodologies described in this appendix for isopropyl alcohol are based on OSHA Method 109.4F
1 That method requires the collection of samples using two Anasorb 747 sorbent tubes, extraction using 60/40 (v/v) N,N-dimethylformamide/carbon disulfide, and analysis by gas chromatography using a flame ionization detector.
1.2 Changes to the Previously-Used Method
This appendix represents an update of OSHA Method 1091, which was fully validated at the time it was published based on the validation guidelines in effect at that time. Compared to the previous method used this method includes new analytical parameters, internal standard (ISTD), and extraction solvent volume. Data presented from the previously used method are identified by the statement “Pre-existing data from OSHA Method 10221 are presented in this section”. The changes were made to allow the standardized collection and analysis of isopropyl alcohol with other analytes found in Organic Vapor Sampling Group 2, described in OSHA Method 5001. Version 1.1 of this appendix represents an update to the format of version 1.0, with no new sampling or analytical data added.
1.3 Validation Parameters
The procedures used to develop the method validation data are described in Validation Guidelines for Air Sampling Methods Utilizing Chromatographic Analysis.5F
2 Air concentrations listed in ppm are referenced to 25 °C and 760 Torr.
1 Eide, M. Isopropyl Alcohol (OSHA Method 109), 1997. United States Department of Labor, Occupational Safety and Health
Administration Web site https://www.osha.gov/dts/sltc/methods/archive/org109/org109.pdf (accessed February 2021). 2 Eide, M.; Simmons, M.; Hendricks, W. Validation Guidelines for Air Sampling Methods Utilizing Chromatographic Analysis, 2010.
United States Department of Labor, Occupational Safety & Health Administration Web site. http://www.osha.gov/dts/sltc/methods/chromguide/chromguide.pdf (accessed December 2018).

OSHA Method 5001, Appendix C, Isopropyl Alcohol 2 of 7
The target concentration for method evaluation was the OSHA 8-hour time-weighted average (TWA) permissible exposure limit (PEL) for isopropyl alcohol.
2 Detection and Quantification
2.1 Detection Limit of the Analytical Procedure (DLAP)
The DLAP is the analyte mass introduced onto the chromatographic column that produces a response greater than 3× the standard error of estimate (DLAP Sy/x) divided by the slope of the line produced from analyses of ten analytical standards prepared with equally spaced increments of analyte mass. The standards were prepared in such a way that the highest standard concentration would produce a peak approximately 10 times the response of a reagent blank at or near the chromatographic retention time of the analyte. The standards and a reagent blank were analyzed with the recommended analytical parameters described in OSHA Method 5001. The resulting data provided the DLAP Sy/x and slope values for DLAP determination. Results obtained for these analyses are listed in Table C-1, and plotted in Figure C-1. Table C-1. DLAP data for isopropyl alcohol.
concentration (µg/mL)
mass on column (pg)
area counts (µV∙s)
0.00 0.510 1.02 1.52 2.03 2.54 3.04 3.56 4.06 4.57 5.10
0.00 3.40 6.80 10.1 13.5 16.9 20.3 23.7 27.1 30.5 34.0
0.00 0.0590 0.0960 0.114 0.196 0.189 0.199 0.283 0.295 0.385 0.390
Figure C-1. Plot of data used to determine the DLAP for isopropyl alcohol (y = 0.0112x + 0.0104, DLAP Sy/x = 0.0228, DLAP = 6.11 pg).
2.2 Detection Limit of the Overall Procedure and Reliable Quantitation Limit (RQL)
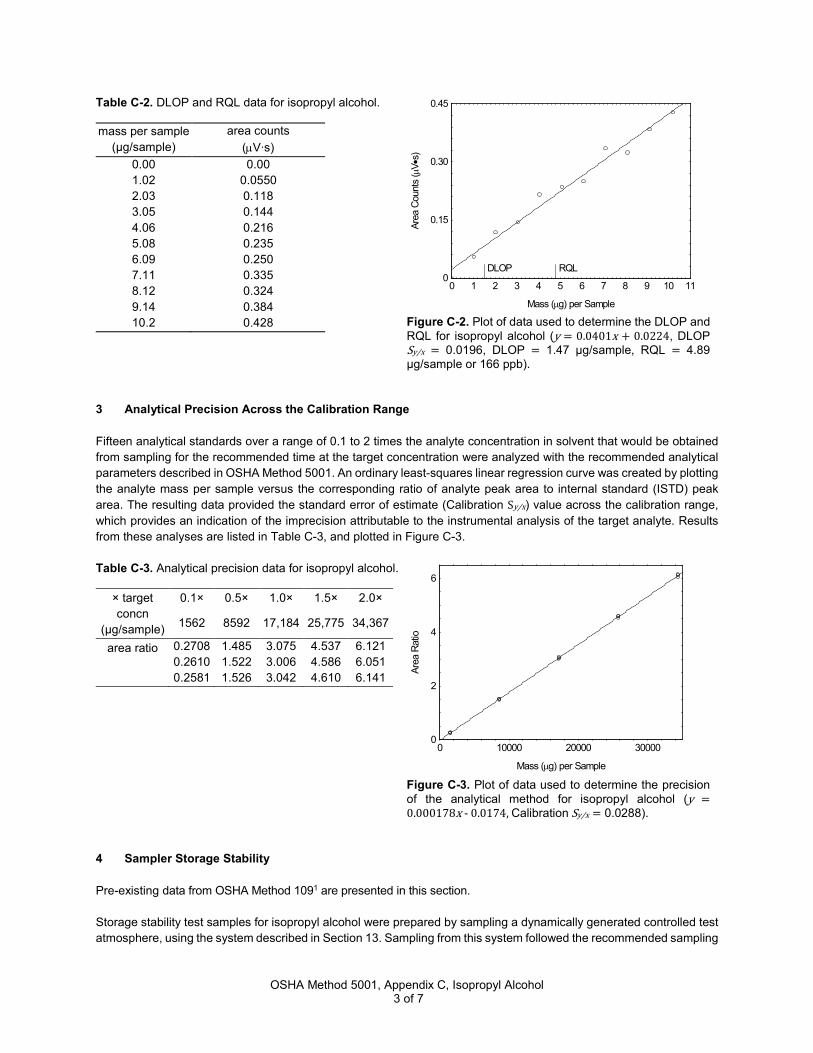
The DLOP is the analyte mass introduced onto the chromatographic column that produces a response greater than 3× the standard error of estimate (DLOP Sy/x) divided by the slope of the line produced from analyses of ten samples prepared from sorbent tubes spiked with equally spaced increments of analyte mass. Sorbent tubes were spiked in such a way that the highest mass loading produced a peak approximately 10 times greater than that of a sample blank at or near the chromatographic retention time of the analyte. The RQL is expressed as an air concentration that will provide sufficient analyte mass per sample that produces a response greater than 10× DLOP Sy/x divided by the slope of the line described above. The spiked samplers and a sample blank were analyzed with the recommended analytical parameters described in OSHA Method 5001. The resulting data provided the DLOP Sy/x and the slope values for DLOP and RQL determinations. Results obtained from these analyses are listed in Table C-2, and plotted in Figure C-2.
0
0.1
0.2
0.3
0.4
0 5 10 15 20 25 30 35
DLAP
Mass (pg) Injected Onto Column
Area
Cou
nts
(µV•
s)
OSHA Method 5001, Appendix C, Isopropyl Alcohol 3 of 7
Table C-2. DLOP and RQL data for isopropyl alcohol.
mass per sample (µg/sample)
area counts (µV∙s)
0.00 1.02 2.03 3.05 4.06 5.08 6.09 7.11 8.12 9.14 10.2
0.00 0.0550 0.118 0.144 0.216 0.235 0.250 0.335 0.324 0.384 0.428
Figure C-2. Plot of data used to determine the DLOP and RQL for isopropyl alcohol (y = 0.0401x + 0.0224, DLOP Sy/x = 0.0196, DLOP = 1.47 µg/sample, RQL = 4.89 µg/sample or 166 ppb).
3 Analytical Precision Across the Calibration Range
Fifteen analytical standards over a range of 0.1 to 2 times the analyte concentration in solvent that would be obtained from sampling for the recommended time at the target concentration were analyzed with the recommended analytical parameters described in OSHA Method 5001. An ordinary least-squares linear regression curve was created by plotting the analyte mass per sample versus the corresponding ratio of analyte peak area to internal standard (ISTD) peak area. The resulting data provided the standard error of estimate (Calibration Sy/x) value across the calibration range, which provides an indication of the imprecision attributable to the instrumental analysis of the target analyte. Results from these analyses are listed in Table C-3, and plotted in Figure C-3. Table C-3. Analytical precision data for isopropyl alcohol.
× target concn
(µg/sample)
0.1× 0.5× 1.0× 1.5× 2.0×
1562 8592 17,184 25,775 34,367
area ratio 0.2708 0.2610 0.2581
1.485 1.522 1.526
3.075 3.006 3.042
4.537 4.586 4.610
6.121 6.051 6.141
Figure C-3. Plot of data used to determine the precision of the analytical method for isopropyl alcohol (y = 0.000178x - 0.0174, Calibration Sy/x = 0.0288).
4 Sampler Storage Stability
Pre-existing data from OSHA Method 1091 are presented in this section. Storage stability test samples for isopropyl alcohol were prepared by sampling a dynamically generated controlled test atmosphere, using the system described in Section 13. Sampling from this system followed the recommended sampling
0
0.15
0.30
0.45
0 1 2 3 4 5 6 7 8 9 10 11
RQLDLOP
Mass (µg) per Sample
Area
Cou
nts
(µV•
s)
0
2
4
6
0 10000 20000 30000
Mass (µg) per Sample
Area
Rat
io

OSHA Method 5001, Appendix C, Isopropyl Alcohol 4 of 7
parameters published in OSHA Method 109 except the sampling rate was increased to 0.2 L/min and the sampling time was reduced to 90 min. The nominal concentration of isopropyl alcohol sampled for both ambient and refrigerated storage testing was the target concentration (calculated to be 405 ppm). The relative humidity and temperature of the air sampled were 80% and 22 °C for both tests. For each test, eighteen samples were prepared and three of these were analyzed on the same day that samples were created. The remaining fifteen refrigerated storage test samples were stored at reduced temperature (4 °C), while the remaining fifteen ambient storage test samples were kept in a closed drawer at ambient temperature (22 °C). For each storage condition, three samples were selected and analyzed from those remaining at 3-5 day intervals. The results of these analyses (uncorrected for extraction efficiency) are provided in Tables C-4, and plotted in Figures C-4 through C-5. The recovery of isopropyl alcohol calculated from the regression line generated for the 19-day ambient storage test was 101.7%. Table C-4. Sampler storage stability data for isopropyl alcohol.
time (days)
ambient storage recovery (%)
refrigerated storage recovery (%)
0 103.6 104.6 105.0 103.6 104.6 105.0 0 103.1 104.3 103.2 103.1 104.3 103.2 3 105.8 105.7 104.9 104.0 104.3 103.8 7 103.0 102.3 102.8 107.8 108.5 106.6
10 104.9 105.2 104.6 103.9 104.2 102.0 14 102.4 102.4 102.3 102.5 102.7 103.5 19 102.1 100.3 100.2 100.9 100.3 101.8
Figure C-4. Plot of ambient storage stability data for isopropyl alcohol.
Figure C-5. Plot of refrigerated storage stability data for isopropyl alcohol.
5 Precision of the Overall Procedure
Pre-existing data from OSHA Method 1091 are presented in this section. The overall standard error of estimate obtained from the ambient storage test analyses described in Section 4 and sampling pump variability were used to determine the precision of the overall procedure, where all aspects of sampling and analysis (sampling, sorbent tube handling and solvent extraction, and instrumental analysis) are considered. This value was obtained by taking the square root of the squared ambient storage stability standard error of estimate (Storage 𝑆𝑆𝑦𝑦/𝑥𝑥
2 ) added to the squared sampling pump variability value (𝑉𝑉𝑆𝑆𝑆𝑆2 ). The resulting precision of the overall procedure at the 95% confidence level for the ambient 19-day storage test (at the target concentration) for isopropyl
0
20
40
60
80
100
120
0 2 4 6 8 10 12 14 16 18 20
y = -0.158x + 104.7Overall Std Error of Estimate = 5.2%95% Confidence Limits = ±(1.96)(5.2%) = ±10.2%
Storage Time (Days)
Reco
very
(%)
0
20
40
60
80
100
120
0 2 4 6 8 10 12 14 16 18
y = -0.142x + 104.7Overall Std Error of Estimate = 5.3%95% Confidence Limits = ±(1.96)(5.3%) = ±10.4%
Storage Time (Days)
Reco
very
(%)

OSHA Method 5001, Appendix C, Isopropyl Alcohol 5 of 7
alcohol was determined to be ±10.2% based on the observed ambient Storage Sy/x value of 5.2% and 𝑉𝑉𝑆𝑆𝑆𝑆 value of 5.0%.
6 Recovery and Stability of Prepared Samples
Quantitative extraction is affected by the extraction solvent, the ISTD, the sampling medium, and the technique used to extract samples. The data presented demonstrate validity for the extraction solvent, ISTD, sampling medium, and extraction technique described in OSHA Method 5001. If other combinations of these are to be used, testing must be completed to satisfy the requirements found in current OSHA sampling and analysis method validation guidelines. Acceptable testing results must be documented. A value for extraction efficiency (EE) was determined by liquid-spiking four replicate sorbent tubes across a range of analyte mass values that would be obtained from sampling at 0.1 to 2 times the target concentration value for 240 min. Four sorbent tubes were also spiked in this fashion at the target concentration after drawing humid air (80% relative humidity at 21 °C) through these tubes at 50 mL/min for 6 hours. All of the samples described above were analyzed the following day after being kept overnight at ambient temperature. The EE value at the RQL was 98.1%, while that of the working range samples (excluding the samples through which humid air had been drawn) was 102.4%. The data are shown in Table C-5. Pre-loading sorbent tubes with moisture (“wet” designation in the table) did not have an unacceptable effect on EE. Table C-5. Extraction efficiency data for isopropyl alcohol.
level sample number × target concn
µg per sample 1 2 3 4 mean
0.1 1562 101.0 101.1 101.0 100.9 101.0 0.25 4686 103.2 101.6 104.7 104.0 103.4 0.5 8592 102.7 102.6 102.1 102.9 102.6 1.0 17,183 103.2 103.0 102.8 102.6 102.9 1.5 25,775 102.7 102.0 101.8 102.8 102.3 2.0 34,367 102.2 102.0 102.4 102.4 102.2
RQL 4.84 96.2 100.0 98.2 98.0 98.1
1.0 (wet) 17,183 102.9 102.0 102.8 103.2 102.7 The stability of sample extracts prepared according to OSHA Method 5001 was examined by retaining the sample solvent extracts for the target concentration samples described immediately above. Two of the four vials were immediately recapped with new septa following the initial analyses, and again following each re-analysis event. The other two vials retained the original punctured septa throughout. All four vials were re-analyzed at 24, 48, and 72 hours after the initial analyses, with all vials remaining in the autosampler tray kept at 22 °C. Freshly prepared standards were used for each analysis event, and each septum (whether new or previously used) was punctured four times for each injection. The resulting data are shown in Table C-6. Table C-6. Extracted sample stability data for isopropyl alcohol.
punctured septa replaced recovery (%)
punctured septa retained recovery (%)
time (days) 1 2 1 2
0 103.2 103.0 102.8 102.6 1 102.8 102.7 101.9 101.8 2 103.1 102.9 102.0 101.4 3 102.9 103.0 100.0 100.6

OSHA Method 5001, Appendix C, Isopropyl Alcohol 6 of 7
7 Sampler Capacity
Pre-existing data from OSHA Method 1091 are presented in this section. The sampling capacity of a single 400 mg sorbent tube was tested by sampling a dynamically generated controlled test atmosphere, using the system described in Section 13, containing isopropyl alcohol nominally at two times the target concentration (calculated to be 808 ppm). The relative humidity and temperature of the air sampled were 77% and 22 °C, and the sampling flow rate was 50 mL/min. A gas chromatograph was operated behind a sorbent tube being tested. Data shown in Table C-8 for this test were used to determine a recommended sampling volume of 12 liters for isopropyl alcohol. This volume corresponds to a 240 min sampling period which is the maximum recommended sampling time regardless of breakthrough. Breakthrough was not observed until sampling more than two times this volume (corresponding to 29.0 liters). Testing using faster flow rate and air with different (including lower) relative humidity was also completed to rule out adverse capacity effects, and none were observed when sampling at the recommended flow rate of 50 mL/min. The relevant parameters for these additional tests are described in OSHA Method 1091. Results are plotted in Figure C-6. Table C-8. Sampler capacity data for isopropyl alcohol.a
13% RH at 0.05 L/min 12% RH at 0.20 L/min 84% RH at 0.20 L/min 77% RH at 0.05 L/min air vol (L) BT, (%) air vol (L) BT, (%) air vol (L) BT, (%) air vol (L) BT, (%)
32.11 0.00 29.01 0.00 19.78 0.0 27.39 0.00 34.32 0.44 29.37 2.15 22.08 2.85 28.83 4.23 36.57 1.23 29.76 2.98 22.13 0.58 28.94 4.70 37.18 5.24 29.78 4.13 24.61 19.51 29.53 11.31 38.80 5.44 30.20 6.21 24.74 6.63 30.07 10.40 39.38 14.83 30.55 8.03 26.47 19.84 30.29 21.82 41.26 18.29 30.65 13.47
31.01 10.60 31.14 22.08
a RH is relative humidity and BT is breakthrough.
Figure C-6. Plot of data used to determine sampler capacity for isopropyl alcohol. The 5% breakthrough volumes shown are based on the curves in the figure, which are fit to the data provided in Table C-8.
8 Low Humidity
A low humidity recovery test was not performed; however, low humidity capacity tests were performed in Section 7.
0
5
10
15
20
25
0 10 20 30 40
0.05 L/min at 77%RH0.2 L/min at 84%RH0.2 L/min at 12% RH0.05 L/min at 13% RH
Air Volume (5%)
Brea
kthr
ough
(5%
)

OSHA Method 5001, Appendix C, Isopropyl Alcohol 7 of 7
9 Chemical Interference
A study has not been undertaken to verify that sampling another common organic vapor at high concentration concurrently with the sampling of isopropyl alcohol at the target concentration does not produce anomalous results.
10 Analytical Method Reproducibility
Pre-existing data from OSHA Method 1091 are presented in this section. Samples were prepared by sampling a dynamically generated controlled test atmosphere, using the system described in Section 13, containing isopropyl alcohol nominally at the target concentration (calculated to be 405 ppm3). The relative humidity and temperature of the air sampled were 80% and 22 °C, and the sampling flow rate was 200 mL/min. Samples were collected on six sorbent tubes for 90 min. The resulting samples were submitted to the OSHA Salt Lake Technical Center for analysis using the procedures described in OSHA Method 1091 after storage for 3 days at 4 °C. The analytical results corrected for EE are provided in Table C-9. No sample result for isopropyl alcohol fell outside the permissible bounds set by the precision of the overall procedure determined in Section 5 of this appendix. Table C-9. Reproducibility data for isopropyl alcohol.
sampled (mg/sample)
recovered (mg/sample)
recovery (%)
deviation (%)
19.5 19.8 19.8 19.8 19.5 19.8
19.7 20.4 20.2 20.2 20.2 19.8
101.0 103.0 102.0 102.0 103.6 100.0
+1.0 +3.0 +2.0 +2.0 +3.6 +0.0
11 Effect of Sampling a Low Concentration
A study has not been undertaken to verify the effect of sampling a low concentration of isopropyl alcohol vapor.
12 Estimation of Uncertainty
While systematic biases such as analyte storage loss are examined, and limits are placed on these, an estimation of uncertainty that encompasses both potential random and systematic error was not completed. Instead, the overall standard error of estimate was calculated from the random error inherent to the points about the regression line produced by the ambient storage test described in Section 5, as prescribed by the OSHA validation guidelines in use at the time OSHA Method 1091 was originally validated. See Section 5 of this appendix for details.
13 Controlled Test Atmosphere Procedure
Dynamically generated controlled test atmospheres were created in a walk-in hood. House air was regulated using a flow-temperature-humidity control system. A measured flow of liquid isopropyl alcohol was introduced with a syringe pump through a short length of uncoated fused silica capillary into a heated zone near the air flow entrance of the test atmosphere generator, where it was evaporated into a measured flow of dilution air from the flow-temperature-humidity control system. The resulting isopropyl alcohol vapor and dilution air flowed into a mixing chamber, and then into a sampling chamber. Sampling was completed using sampling ports on the sampling chamber. Temperature and humidity measurements were obtained near the exit of the sampling chamber.

OSHA Method 5001, Appendix D, n-Butyl Alcohol 1 of 7
OSHA 5001, Appendix D n-Butyl Alcohol
Version: 1.1 OSHA PEL: ACGIH TLV:
100 ppm (300 mg/m3) 8-Hour TWA, General Industry, Construction, Shipyard 20 ppm (61 mg/m3) 8-Hour TWA
Recommended sampling time and sampling rate:
240 min at 50 mL/min (12 L)
Reliable quantitation limit: 0.079 ppm (0.24 mg/m3) Standard error of estimate: 5.2% Status: Fully validated. Method 5001 has been subjected to the established validation
procedures of the Method Development Team for sampling and analysis of n-butyl alcohol.
March 2019 (OSHA 5001, Version 1.0) Michael Simmons February 2021 (OSHA 5001, Version 1.1)
1 Introduction
1.1 Previous Methods used by OSHA for Sampling and Analysis of n-Butyl Alcohol
The specific analyte described in this appendix is n-butyl alcohol, CAS No. 71-36-3. The methodologies described in this appendix for n-butyl alcohol replace OSHA’s use of NIOSH Method 1401.6F
1 That method requires the collection of samples using charcoal sorbent tubes, extraction using 99/1 (v/v) carbon disulfide/2-propanol, and analysis by gas chromatography using a flame ionization detector.
1.2 Changes to the Previously-Used Method
This appendix represents a new method to replace OSHA’s use of NIOSH Method 14011 for sampling and analysis of n-butyl alcohol. Compared to the previous method used this method includes new sampling medium, extraction solvent, analytical parameters, internal standard (ISTD), and sample collection flow rate and collection time. The data found in all subsequent sections of this appendix are new. The changes were made to allow the standardized collection and analysis of n-butyl alcohol with other analytes found in Organic Vapor Sampling Group 2, described in OSHA Method 5001. Version 1.1 of this appendix represents an update to the format of version 1.0, with no new sampling or analytical data added.
1.3 Validation Parameters
The procedures used to develop the method validation data are described in Validation Guidelines for Air Sampling Methods Utilizing Chromatographic Analysis.7F
2 Air concentrations listed in ppm are referenced to 25 °C and 760 Torr. The target concentration for method evaluation was the OSHA 8-hour time-weighted average (TWA) permissible exposure limit (PEL) for n-butyl alcohol.
1 Williamson, G. Alcohols II (NIOSH Method 1401), 1994. Centers for Disease Control and Prevention, National Institute for
Occupational Safety and Health web site. https://www.cdc.gov/niosh/docs/2003-154/pdfs/1401.pdf (accessed December 2018). 2 Eide, M.; Simmons, M.; Hendricks, W. Validation Guidelines for Air Sampling Methods Utilizing Chromatographic Analysis, 2010.
United States Department of Labor, Occupational Safety & Health Administration Web site. http://www.osha.gov/dts/sltc/methods/chromguide/chromguide.pdf (accessed December 2018).

OSHA Method 5001, Appendix D, n-Butyl Alcohol 2 of 7
2 Detection and Quantification
2.1 Detection Limit of the Analytical Procedure (DLAP)
The DLAP is the analyte mass introduced onto the chromatographic column that produces a response greater than 3× the standard error of estimate (DLAP Sy/x) divided by the slope of the line produced from analyses of ten analytical standards prepared with equally spaced increments of analyte mass. The standards were prepared in such a way that the highest standard concentration would produce a peak approximately 10 times the response of a reagent blank at or near the chromatographic retention time of the analyte. The standards and a reagent blank were analyzed with the recommended analytical parameters described in OSHA Method 5001. The resulting data provided the DLAP Sy/x and slope values for DLAP determination. Results obtained for these analyses are listed in Table D-1, and plotted in Figure D-1. Table D-1. DLAP data for n-butyl alcohol.
concentration (µg/mL)
mass on column (pg)
area counts (µV∙s)
0.00 0.520 1.05 1.58 2.10 2.62 3.15 3.68 4.20 4.72 5.25
0.00 3.47 7.00 10.5 14.0 17.5 21.0 24.5 28.0 31.5 35.0
0.00 0.0600 0.0920 0.172 0.166 0.247 0.277 0.346 0.382 0.489 0.448
Figure D-1. Plot of data used to determine the DLAP for n-butyl alcohol (y = 0.0137x + 0.00343, DLAP Sy/x = 0.0259, DLAP = 5.67 pg).
2.2 Detection Limit of the Overall Procedure (DLOP) and Reliable Quantitation Limit (RQL)
The DLOP is the analyte mass introduced onto the chromatographic column that produces a response greater than 3× the standard error of estimate (DLOP Sy/x) divided by the slope of the line produced from analyses of ten samples prepared from sorbent tubes spiked with equally spaced increments of analyte mass. Sorbent tubes were spiked in such a way that the highest mass loading produced a peak approximately 10 times greater than that of a sample blank at or near the chromatographic retention time of the analyte. The RQL is expressed as an air concentration that will provide sufficient analyte mass per sample that produces a response greater than 10× DLOP Sy/x divided by the slope of the line described above. The spiked samplers and a sample blank were analyzed with the recommended analytical parameters described in OSHA Method 5001. The resulting data provided the DLOP Sy/x and the slope values for DLOP and RQL determinations. Results obtained from these analyses are listed in Table D-2, and plotted in Figure D-2.
0
0.1
0.2
0.3
0.4
0.5
0 5 10 15 20 25 30 35
DLAP
Mass (pg) Injected Onto Column
Area
Cou
nts
(µV•
s)

OSHA Method 5001, Appendix D, n-Butyl Alcohol 3 of 7
Table D-2. DLOP and RQL data for n-butyl alcohol.
mass per sample (µg/sample)
area counts (µV∙s)
0.00 1.05 2.10 3.15 4.20 5.25 6.30 7.35 8.40 9.45 10.5
0.00 0.0380 0.0700 0.128 0.193 0.219 0.287 0.340 0.399 0.433 0.520
Figure D-2. Plot of data used to determine the DLOP and RQL for n-butyl alcohol (y = 0.0492x - 0.0196, DLOP Sy/x = 0.0142, DLOP = 0.866 µg/sample, RQL = 2.89 µg/sample or 79 ppb).
3 Analytical Precision Across the Calibration Range
Fifteen analytical standards over a range of 0.1 to 2 times the analyte concentration in solvent that would be obtained from sampling for the recommended time at the target concentration were analyzed with the recommended analytical parameters described in OSHA Method 5001. An ordinary least-squares linear regression curve was created by plotting the analyte mass per sample versus the corresponding ratio of analyte peak area to internal standard (ISTD) peak area. The resulting data provided the standard error of estimate (Calibration Sy/x) value across the calibration range, which provides an indication of the imprecision attributable to the instrumental analysis of the target analyte. Results from these analyses are listed in Table D-3, and plotted in Figure D-3. Table D-3. Analytical precision data for n-butyl alcohol.
× target concn
(µg/sample)
0.1× 0.5× 1.0× 1.5× 2.0×
368.2 1841 3682 5524 7365
area ratio 0.08280 0.08270 0.08170
0.4177 0.4062 0.4128
0.8307 0.8548 0.8259
1.240 1.251 1.259
1.690 1.685 1.703
Figure D-3. Plot of data used to determine the precision of the analytical method for n-butyl alcohol (y = 0.000230x - 0.00753, Calibration Sy/x = 0.0101).
4 Sampler Storage Stability
Storage stability test samples for n-butyl alcohol were prepared by sampling a dynamically generated controlled test atmosphere, using the system described in Section 13. Sampling from this system followed the recommended sampling parameters published in OSHA Method 5001. The nominal concentration of n-butyl alcohol for ambient storage testing was the target concentration (calculated to be 92.0 ppm). The relative humidity and temperature of the air sampled
0
0.2
0.4
0 1 2 3 4 5 6 7 8 9 10 11RQLDLOP
Mass (µg) per Sample
Area
Cou
nts
(µV•
s)
0
0.5
1.0
1.5
0 2000 4000 6000
Mass (µg) per Sample
Area
Rat
io

OSHA Method 5001, Appendix D, n-Butyl Alcohol 4 of 7
were 81% and 21 °C for this test. Eighteen samples were prepared and three of these were analyzed on the day that samples were created. The remaining fifteen samples were stored in a closed drawer at ambient temperature (about 22°C). Three samples were selected and analyzed from those remaining at 2-4 day intervals. The results of these analyses (uncorrected for extraction efficiency) are provided in Table D-4. Results are plotted in Figure D-4. The recovery of n-butyl alcohol calculated from the regression line generated for the 15-day ambient storage test was 98.5%. Table D-4. Sampler storage stability data for n-butyl alcohol.
time (days)
ambient storage recovery (%)
0 98.9 99.9 101.4 3 95.7 97.1 98.1 7 99.1 97.8 99.3
10 98.2 100.3 99.2 13 98.6 100.8 97.1 15 97.4 97.3 99.6
Figure D-4. Plot of ambient storage stability data for n-butyl alcohol.
5 Precision of the Overall Procedure
The overall standard error of estimate obtained from the ambient storage test analyses described in Section 4 and sampling pump variability were used to determine the precision of the overall procedure, where all aspects of sampling and analysis (sampling, sorbent tube handling and solvent extraction, and instrumental analysis) are considered. This value was obtained by taking the square root of the squared ambient storage stability standard error of estimate (Storage 𝑆𝑆𝑦𝑦/𝑥𝑥
2 ) added to the squared sampling pump variability value (𝑉𝑉𝑆𝑆𝑆𝑆2 ). The resulting precision of the overall procedure at the 95% confidence level for the ambient 15-day storage test (at the target concentration) for n-butyl alcohol was determined to be ±10.2% based on the observed ambient Storage Sy/x value of 5.2% and 𝑉𝑉𝑆𝑆𝑆𝑆 value of 5.0%.
6 Recovery and Stability of Prepared Samples
Quantitative extraction is affected by the extraction solvent, the ISTD, the sampling medium, and the technique used to extract samples. The data presented demonstrate validity for the extraction solvent, ISTD, sampling medium, and extraction technique described in OSHA Method 5001. If other combinations of these are to be used, testing must be completed to satisfy the requirements found in current OSHA sampling and analysis method validation guidelines. Acceptable testing results must be documented. A value for extraction efficiency (EE) was determined by liquid-spiking four replicate sorbent tubes across a range of analyte mass values that would be obtained from sampling at 0.1 to 2 times the target concentration value for 240 min. Four sorbent tubes were also spiked in this fashion at the target concentration after drawing humid air (80% relative humidity at 21 °C) through these tubes at 50 mL/min for 6 hours. All of the samples described above were analyzed the following day after being kept overnight at ambient temperature. The EE value at the RQL was 98.4%, while that of the working range samples (excluding the samples through which humid air had been drawn) was 101.5%. The data are shown in Table D-5. Pre-loading sorbent tubes with moisture (“wet” designation in the table) did not have an unacceptable effect on EE.
0
20
40
60
80
100
120
0 2 4 6 8 10 12 14 16
y = -0.0278x + 98.9Overall Std Error of Estimate = 5.2%95% Confidence Limits = ±(1.96)(5.2%) = ±10.2%
Storage Time (Days)Re
cove
ry (%
)

OSHA Method 5001, Appendix D, n-Butyl Alcohol 5 of 7
Table D-5. Extraction efficiency data for n-butyl alcohol.
level sample number × target concn
µg per sample 1 2 3 4 mean
0.1 368.3 100.7 99.45 101.7 100.7 100.6 0.25 920.6 101.5 101.9 101.8 101.2 101.6 0.5 1841 99.94 100.2 101.3 100.6 100.5 1.0 3683 101.8 101.8 102.9 101.9 102.1 1.5 5523 102.3 102.1 102.0 101.8 102.1 2.0 7365 102.6 102.2 102.1 101.6 102.1
RQL 2.83 120.7 94.0 96.7 82.0 98.4
1.0 (wet) 3683 101.5 101.2 101.5 101.9 101.5 The stability of sample extracts prepared according to OSHA Method 5001 was examined by retaining the sample solvent extracts for the target concentration samples described immediately above. Two of the four vials were immediately recapped with new septa following the initial analyses, and again following each re-analysis event. The other two vials retained the original punctured septa throughout. All four vials were re-analyzed at 24, 48, and 72 hours after the initial analyses, with all vials remaining in the autosampler tray kept at 22 °C. Freshly prepared standards were used for each analysis event, and each septum (whether new or previously used) was punctured four times for each injection. The resulting data are shown in Table D-6. Table D-6. Extracted sample stability data for n-butyl alcohol.
punctured septa replaced recovery (%)
punctured septa retained recovery (%)
time (days) 1 2 1 2
0 101.8 101.8 102.9 101.9 1 101.4 101.3 102.5 102.1 2 101.5 101.5 102.2 102.1 3 101.5 101.5 102.2 102.2
7 Sampler Capacity
The sampling capacity of a single sorbent tube was tested by sampling a dynamically generated controlled test atmosphere, using the system described in Section 13, containing n-butyl alcohol nominally at two times the target concentration (calculated to be 179 ppm, and 209 ppm). The relative humidities and temperatures of the air sampled were respectively 79% and 21 °C, and 20% and 21 °C, and the sampling flow rate was 50 mL/min. A sorbent tube testing system was made by placing two sampling tubes in series. The rear 400-mg sorbent tube was removed and analyzed at 480 min. No breakthrough in any of three replicate samples was observed for either humidity/temperature condition after sampling for 8 hours (corresponding to 24 liters). Data from six sorbent tube testing systems were used to determine a recommended sampling volume of 12 liters for n-butyl alcohol as described in OSHA Method 5001. This volume corresponds to a 240 min sampling period which is the maximum recommended sampling time regardless of breakthrough.
8 Low Humidity
The effect of low humidity was tested by sampling a dynamically generated controlled test atmosphere, using the system described in Section 13, containing n-butyl alcohol nominally at two times the target concentration (calculated to be 206 ppm). The relative humidity and temperature of the air sampled were 20% and 21 °C, and the sampling flow rate was 50 mL/min. Samples were collected on three sorbent tubes for 240 min. After immediate analysis, results as a percentage of expected recovery were 93.2%, 93.2%, and 94.8%.

OSHA Method 5001, Appendix D, n-Butyl Alcohol 6 of 7
9 Chemical Interference
The effect of potential chemical sampling interference was tested by sampling a dynamically generated controlled test atmosphere, using the system described in Section 13, containing n-butyl alcohol nominally at the target concentration (calculated to be 92.0 ppm). The relative humidity and temperature of the air sampled were 81% and 21 °C, and the sampling flow rate was 50 mL/min. sec-Butyl alcohol, isobutyl alcohol, and n-propyl alcohol were present as potential interferents, (calculated to be at respective concentrations of 137 ppm, 91.4 ppm, and 169 ppm). Samples were collected on three sorbent tubes for 240 min. After immediate analysis, results for n-butyl alcohol as a percentage of expected recovery were 98.9%, 99.9%, and 101.4%.
10 Analytical Method Reproducibility
Samples were prepared by sampling a dynamically generated controlled test atmosphere, using the system described in Section 13, containing n-butyl alcohol nominally at the target concentration (calculated to be 101 ppm). The relative humidity and temperature of the air sampled were 79% and 21 °C, and the sampling flow rate was 50 mL/min. Samples were collected on six sorbent tubes for 240 min. The resulting samples were submitted to the OSHA Salt Lake Technical Center for analysis using the procedures described in OSHA Method 5001 after storage for 11 days at 4 °C. The analytical results corrected for EE are provided in Table D-7. No sample result for n-butyl alcohol fell outside the permissible bounds set by the precision of the overall procedure determined in Section 5 of this appendix. Table D-7. Reproducibility data for n-butyl alcohol.
sampled (µg/sample)
recovered (µg/sample)
recovery (%)
deviation (%)
3672 3692 3605 3609 3786 3552
3419 3360 3326 3298 3549 3273
93.1 91.0 92.3 91.4 93.7 92.1
-6.9 -9.0 -7.7 -8.6 -6.3 -7.9
11 Effect of Sampling a Low Concentration
The effect of sampling a low concentration of n-butyl alcohol vapor was tested by sampling a dynamically generated controlled test atmosphere, using the system described in Section 13, containing n-butyl alcohol nominally at one-tenth the target concentration (calculated to be 9.30 ppm). The relative humidity and temperature of the air sampled were 78% and 21 °C, and the sampling flow rate was 50 mL/min. Samples were collected on three sorbent tubes for 240 min. After immediate analysis, results for n-butyl alcohol as a percentage of expected recovery were 98.2%, 100.2%, and 97.5%.
12 Estimation of Uncertainty
While systematic biases such as analyte storage loss are examined, and limits are placed on these, an estimation of uncertainty that encompasses both potential random and systematic error was not completed. Instead, the overall standard error of estimate was calculated from the random error inherent to the points about the regression line produced by the ambient storage test described in Section 5, as prescribed by the OSHA validation guidelines in use at the time OSHA Method 5001 was originally validated. See Section 5 of this appendix for details.
13 Controlled Test Atmosphere Procedure
Dynamically generated controlled test atmospheres were created in a walk-in hood. House air was regulated using a Miller Nelson Model 401 flow-temperature-humidity control system. A measured flow of liquid n-butyl alcohol, sec-butyl alcohol, isobutyl alcohol, and n-propyl alcohol was introduced with a KD Scientific Legato 100 syringe pump through a

OSHA Method 5001, Appendix D, n-Butyl Alcohol 7 of 7
short length of 0.53 mm internal diameter uncoated fused silica capillary into a heated zone near the air flow entrance of the test atmosphere generator, where it was evaporated into a measured flow of dilution air from the flow-temperature-humidity control system. The resulting n-butyl alcohol, sec-butyl alcohol, isobutyl alcohol, and n-propyl alcohol vapor and dilution air flowed into a mixing chamber (30 cm length x 10 cm diameter), and then into a sampling chamber (68 cm length x 10 cm diameter). Sampling was completed from sampling ports present on the sampling chamber. Temperature and humidity measurements were obtained near the exit of the sampling chamber using a Vaisala HUMICAP Model HM70 hand-held humidity and temperature meter.
OSHA Method 5001, Appendix E, sec-Butyl Alcohol 1 of 7
OSHA 5001, Appendix E sec-Butyl Alcohol
Version: 1.1 OSHA PEL: ACGIH TLV:
150 ppm (450 mg/m3) 8-Hour TWA, General Industry, Construction, Shipyard 100 ppm (303 mg/m3) 8-Hour TWA
Recommended sampling time and sampling rate:
240 min at 50 mL/min (12 L)
Reliable quantitation limit: 0.10 ppm (0.32 mg/m3) Standard error of estimate: 5.2% Status: Fully validated. Method 5001 has been subjected to the established validation
procedures of the Method Development Team for sampling and analysis of sec-butyl alcohol.
March 2019 (OSHA 5001, Version 1.0) Michael Simmons February 2021 (OSHA 5001, Version 1.1)
1 Introduction
1.1 Previous Methods used by OSHA for Sampling and Analysis of sec-Butyl Alcohol
The specific analyte described in this appendix is sec-butyl alcohol, CAS No. 78-92-2. The methodologies described in this appendix for sec-butyl alcohol replace OSHA’s use of NIOSH Method 1401.8F
1 That method requires the collection of samples using charcoal sorbent tubes, extraction using 99/1 (v/v) carbon disulfide/2-propanol, and analysis by gas chromatography using a flame ionization detector.
1.2 Changes to the Previously-Used Method
This appendix represents a new method to replace OSHA’s use of NIOSH Method 14011 for sampling and analysis of sec-butyl alcohol. Compared to the previous method used this method includes new sampling medium, extraction solvent, analytical parameters, internal standard (ISTD), and sample collection flow rate and collection time. The data found in all subsequent sections of this appendix are new. The changes were made to allow the standardized collection and analysis of sec-butyl alcohol with other analytes found in Organic Vapor Sampling Group 2, described in OSHA Method 5001. Version 1.1 of this appendix represents an update to the format of version 1.0, with no new sampling or analytical data added.
1.3 Validation Parameters
The procedures used to develop the method validation data are described in Validation Guidelines for Air Sampling Methods Utilizing Chromatographic Analysis.9F
2 Air concentrations listed in ppm are referenced to 25 °C and 760 Torr. The target concentration for method evaluation was the OSHA 8-hour time-weighted average (TWA) permissible exposure limit (PEL) for sec-butyl alcohol.
1 Williamson, G. Alcohols II (NIOSH Method 1401), 1994. Centers for Disease Control and Prevention, National Institute for
Occupational Safety and Health web site. https://www.cdc.gov/niosh/docs/2003-154/pdfs/1401.pdf (accessed December 2018). 2 Eide, M.; Simmons, M.; Hendricks, W. Validation Guidelines for Air Sampling Methods Utilizing Chromatographic Analysis, 2010.
United States Department of Labor, Occupational Safety & Health Administration Web site. http://www.osha.gov/dts/sltc/methods/chromguide/chromguide.pdf (accessed December 2018).

OSHA Method 5001, Appendix E, sec-Butyl Alcohol 2 of 7
2 Detection and Quantification
2.1 Detection Limit of the Analytical Procedure (DLAP)
The DLAP is the analyte mass introduced onto the chromatographic column that produces a response greater than 3× the standard error of estimate (DLAP Sy/x) divided by the slope of the line produced from analyses of ten analytical standards prepared with equally spaced increments of analyte mass. The standards were prepared in such a way that the highest standard concentration would produce a peak approximately 10 times the response of a reagent blank at or near the chromatographic retention time of the analyte. The standards and a reagent blank were analyzed with the recommended analytical parameters described in OSHA Method 5001. The resulting data provided the DLAP Sy/x and slope values for DLAP determination. Results obtained for these analyses are listed in Table E-1, and plotted in Figure E-1. Table E-1. DLAP data for sec-butyl alcohol.
concentration (µg/mL)
mass on column (pg)
area counts (µV∙s)
0.00 0.520 1.04 1.57 2.09 2.62 3.14 3.66 4.18 4.70 5.25
0.00 3.47 6.93 10.5 13.9 17.5 20.9 24.4 27.9 31.3 35.0
0.00 0.0340 0.0760 0.156 0.183 0.202 0.278 0.314 0.352 0.390 0.392
Figure E-1. Plot of data used to determine the DLAP for sec-butyl alcohol (y = 0.0120x + 0.00626, DLAP Sy/x = 0.0191, DLAP = 4.78 pg).
2.2 Detection Limit of the Overall Procedure (DLOP) and Reliable Quantitation Limit (RQL)
The DLOP is the analyte mass introduced onto the chromatographic column that produces a response greater than 3× the standard error of estimate (DLOP Sy/x) divided by the slope of the line produced from analyses of ten samples prepared from sorbent tubes spiked with equally spaced increments of analyte mass. Sorbent tubes were spiked in such a way that the highest mass loading produced a peak approximately 10 times greater than that of a sample blank at or near the chromatographic retention time of the analyte. The RQL is expressed as an air concentration that will provide sufficient analyte mass per sample that produces a response greater than 10× DLOP Sy/x divided by the slope of the line described above. The spiked samplers and a sample blank were analyzed with the recommended analytical parameters described in OSHA Method 5001. The resulting data provided the DLOP Sy/x and the slope values for DLOP and RQL determinations. Results obtained from these analyses are listed in Table E-2, and plotted in Figure E-2.
0
0.1
0.2
0.3
0.4
0 5 10 15 20 25 30 35
DLAP
Mass (pg) Injected Onto Column
Area
Cou
nts
(µV•
s)

OSHA Method 5001, Appendix E, sec-Butyl Alcohol 3 of 7
Table E-2. DLOP and RQL data for sec-butyl alcohol.
mass per sample (µg/sample)
area counts (µV∙s)
0.00 1.05 2.09 3.14 4.18 5.23 6.27 7.32 8.36 9.41 10.5
0.00 0.0680 0.0650 0.140 0.161 0.220 0.238 0.294 0.347 0.386 0.453
Figure E-2. Plot of data used to determine the DLOP and RQL for sec-butyl alcohol (y = 0.0414x - 0.000951, DLOP Sy/x = 0.0157, DLOP = 1.14 µg/sample, RQL = 3.79 µg/sample or 104 ppb).
3 Analytical Precision Across the Calibration Range
Fifteen analytical standards over a range of 0.1 to 2 times the analyte concentration in solvent that would be obtained from sampling for the recommended time at the target concentration were analyzed with the recommended analytical parameters described in OSHA Method 5001. An ordinary least-squares linear regression curve was created by plotting the analyte mass per sample versus the corresponding ratio of analyte peak area to internal standard (ISTD) peak area. The resulting data provided the standard error of estimate (Calibration Sy/x) value across the calibration range, which provides an indication of the imprecision attributable to the instrumental analysis of the target analyte. Results from these analyses are listed in Table E-3, and plotted in Figure E-3. Table E-3. Analytical precision data for sec-butyl alcohol.
× target concn
(µg/sample)
0.1× 0.5× 1.0× 1.5× 2.0×
540.3 2701 5403 8104 10,805
area ratio 0.1091 0.1093 0.1077
0.5500 0.5340 0.5461
1.092 1.128 1.090
1.638 1.650 1.660
2.231 2.228 2.246
Figure E-3. Plot of data used to determine the precision of the analytical method for sec-butyl alcohol (y = 0.000207x - 0.0111, Calibration Sy/x = 0.0149).
4 Sampler Storage Stability
Storage stability test samples for sec-butyl alcohol were prepared by sampling a dynamically generated controlled test atmosphere, using the system described in Section 13. Sampling from this system followed the recommended sampling parameters published in OSHA Method 5001. The nominal concentration of sec-butyl alcohol for ambient storage was
0
0.1
0.2
0.3
0.4
0.5
0 1 2 3 4 5 6 7 8 9 10 11
RQLDLOP
Mass (µg) per Sample
Area
Cou
nts
(µV•
s)
0
0.5
1.0
1.5
2.0
2.5
0 2500 5000 7500 10000
Mass (µg) per Sample
Area
Rat
io
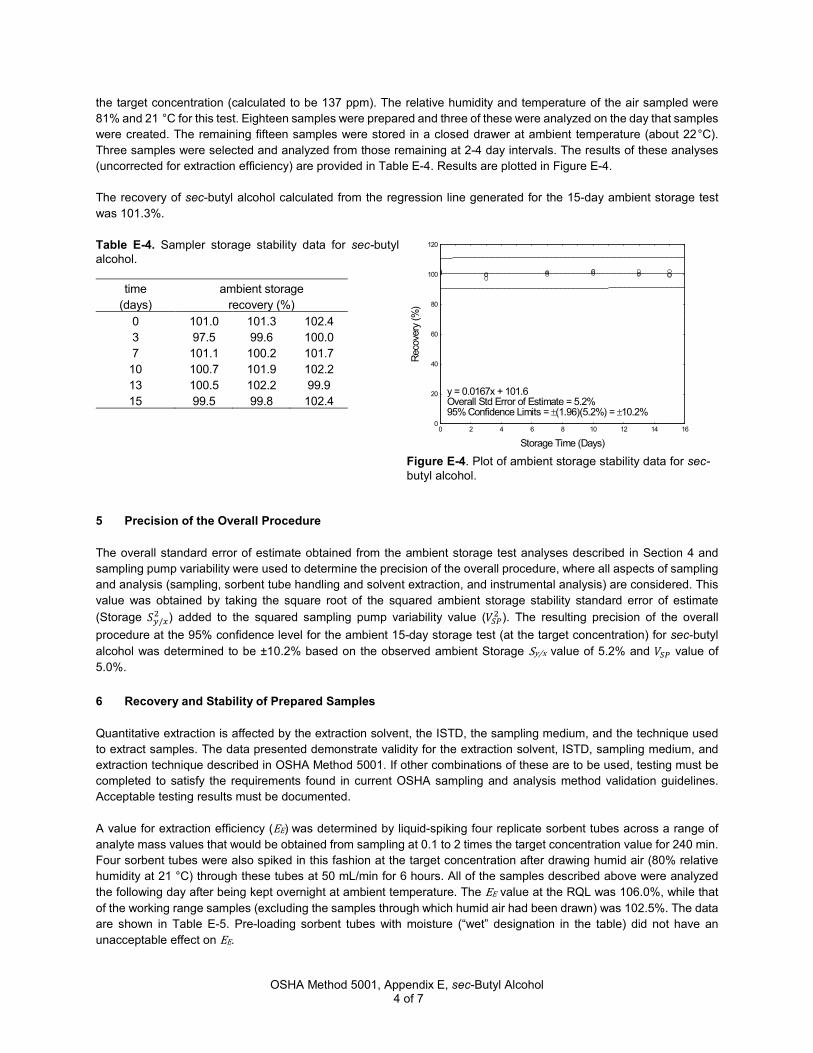
OSHA Method 5001, Appendix E, sec-Butyl Alcohol 4 of 7
the target concentration (calculated to be 137 ppm). The relative humidity and temperature of the air sampled were 81% and 21 °C for this test. Eighteen samples were prepared and three of these were analyzed on the day that samples were created. The remaining fifteen samples were stored in a closed drawer at ambient temperature (about 22°C). Three samples were selected and analyzed from those remaining at 2-4 day intervals. The results of these analyses (uncorrected for extraction efficiency) are provided in Table E-4. Results are plotted in Figure E-4. The recovery of sec-butyl alcohol calculated from the regression line generated for the 15-day ambient storage test was 101.3%. Table E-4. Sampler storage stability data for sec-butyl alcohol.
time (days)
ambient storage recovery (%)
0 101.0 101.3 102.4 3 97.5 99.6 100.0 7 101.1 100.2 101.7
10 100.7 101.9 102.2 13 100.5 102.2 99.9 15 99.5 99.8 102.4
Figure E-4. Plot of ambient storage stability data for sec-butyl alcohol.
5 Precision of the Overall Procedure
The overall standard error of estimate obtained from the ambient storage test analyses described in Section 4 and sampling pump variability were used to determine the precision of the overall procedure, where all aspects of sampling and analysis (sampling, sorbent tube handling and solvent extraction, and instrumental analysis) are considered. This value was obtained by taking the square root of the squared ambient storage stability standard error of estimate (Storage 𝑆𝑆𝑦𝑦/𝑥𝑥
2 ) added to the squared sampling pump variability value (𝑉𝑉𝑆𝑆𝑆𝑆2 ). The resulting precision of the overall procedure at the 95% confidence level for the ambient 15-day storage test (at the target concentration) for sec-butyl alcohol was determined to be ±10.2% based on the observed ambient Storage Sy/x value of 5.2% and 𝑉𝑉𝑆𝑆𝑆𝑆 value of 5.0%.
6 Recovery and Stability of Prepared Samples
Quantitative extraction is affected by the extraction solvent, the ISTD, the sampling medium, and the technique used to extract samples. The data presented demonstrate validity for the extraction solvent, ISTD, sampling medium, and extraction technique described in OSHA Method 5001. If other combinations of these are to be used, testing must be completed to satisfy the requirements found in current OSHA sampling and analysis method validation guidelines. Acceptable testing results must be documented. A value for extraction efficiency (EE) was determined by liquid-spiking four replicate sorbent tubes across a range of analyte mass values that would be obtained from sampling at 0.1 to 2 times the target concentration value for 240 min. Four sorbent tubes were also spiked in this fashion at the target concentration after drawing humid air (80% relative humidity at 21 °C) through these tubes at 50 mL/min for 6 hours. All of the samples described above were analyzed the following day after being kept overnight at ambient temperature. The EE value at the RQL was 106.0%, while that of the working range samples (excluding the samples through which humid air had been drawn) was 102.5%. The data are shown in Table E-5. Pre-loading sorbent tubes with moisture (“wet” designation in the table) did not have an unacceptable effect on EE.
0
20
40
60
80
100
120
0 2 4 6 8 10 12 14 16
y = 0.0167x + 101.6Overall Std Error of Estimate = 5.2%95% Confidence Limits = ±(1.96)(5.2%) = ±10.2%
Storage Time (Days)
Reco
very
(%)

OSHA Method 5001, Appendix E, sec-Butyl Alcohol 5 of 7
Table E-5. Extraction efficiency data for sec-butyl alcohol.
level sample number × target concn
µg per sample 1 2 3 4 mean
0.1 540.3 101.9 100.7 102.5 101.6 101.7 0.25 1351 102.5 102.6 102.6 102.4 102.5 0.5 2701 100.8 101.2 102.4 101.5 101.5 1.0 5402 103.0 103.0 104.2 103.1 103.3 1.5 8104 103.2 103.0 103.0 102.7 103.0 2.0 10,805 103.6 103.1 103.0 102.4 103.0
RQL 3.7 95.6 109.6 109.3 109.3 106.0
1.0 (wet) 5402 102.4 102.0 102.0 102.6 102.3 The stability of sample extracts prepared according to OSHA Method 5001 was examined by retaining the sample solvent extracts for the target concentration samples described immediately above. Two of the four vials were immediately recapped with new septa following the initial analyses, and again following each re-analysis event. The other two vials retained the original punctured septa throughout. All four vials were re-analyzed at 24, 48, and 72 hours after the initial analyses, with all vials remaining in the autosampler tray kept at 22 °C. Freshly prepared standards were used for each analysis event, and each septum (whether new or previously used) was punctured four times for each injection. The resulting data are shown in Table E-6. Table E-6. Extracted sample stability data for sec-butyl alcohol.
punctured septa replaced recovery (%)
punctured septa retained recovery (%)
time (days) 1 2 1 2
0 103.0 103.0 104.2 103.1 1 102.4 102.3 103.7 103.4 2 102.6 102.8 103.4 103.4 3 102.6 102.8 103.3 103.3
7 Sampler Capacity
The sampling capacity of a single 400 mg sorbent tube was tested by sampling a dynamically generated controlled test atmosphere, using the system described in Section 13, containing sec-butyl alcohol nominally at two times the target concentration (calculated to be 268 ppm, and 312 ppm). The relative humidities and temperatures of the air sampled were respectively 79% and 21 °C, and 20% and 21 °C, and the sampling flow rate was 50 mL/min. A sorbent tube testing system was made by placing two sampling tubes in series. The rear 400-mg sorbent tube was removed and analyzed at 480 min. No breakthrough in any of three replicate samples was observed for either humidity/temperature condition after sampling for 8 hours (corresponding to 24 liters). Data from six sorbent tube testing systems were used to determine a recommended sampling volume of 12 liters for sec-butyl alcohol as described in OSHA Method 5001. This volume corresponds to a 240 min sampling period which is the maximum recommended sampling time regardless of breakthrough.
8 Low Humidity
The effect of low humidity was tested by sampling a dynamically generated controlled test atmosphere, using the system described in Section 13, containing sec-butyl alcohol nominally at two times the target concentration (calculated to be 307 ppm). The relative humidity and temperature of the air sampled were 20% and 21 °C, and the sampling flow

OSHA Method 5001, Appendix E, sec-Butyl Alcohol 6 of 7
rate was 50 mL/min. Samples were collected on three sorbent tubes for 240 min. After immediate analysis, results as a percentage of expected recovery were 93.6%, 94.5%, and 95.6%.
9 Chemical Interference
The effect of potential chemical sampling interference was tested by sampling a dynamically generated controlled test atmosphere, using the system described in Section 13, containing sec-butyl alcohol nominally at the target concentration (calculated to be 137 ppm). The relative humidity and temperature of the air sampled were 81% and 21 °C, and the sampling flow rate was 50 mL/min. Isobutyl alcohol, n-butyl alcohol, and n-propyl alcohol were present as potential interferents, (calculated to be at respective concentrations of 91.4 ppm, 92.0 ppm, and 169 ppm). Samples were collected on three sorbent tubes for 240 min. After immediate analysis, results for sec-butyl alcohol as a percentage of expected recovery were 101.0%, 101.3%, and 102.4%.
10 Analytical Method Reproducibility
Samples were prepared by sampling a dynamically generated controlled test atmosphere, using the system described in Section 13, containing sec-butyl alcohol nominally at the target concentration (calculated to be 150 ppm). The relative humidity and temperature of the air sampled were 79% and 21 °C, and the sampling flow rate was 50 mL/min. Samples were collected on six sorbent tubes for 240 min. The resulting samples were submitted to the OSHA Salt Lake Technical Center for analysis using the procedures described in OSHA Method 5001 after storage for 11 days at 4 °C. The analytical results corrected for EE are provided in Table E-7. No sample result for sec-butyl alcohol fell outside the permissible bounds set by the precision of the overall procedure determined in Section 5 of this appendix. Table E-7. Reproducibility data for sec-butyl alcohol.
sampled (µg/sample)
recovered (µg/sample)
recovery (%)
deviation (%)
5484 5513 5384 5389 5654 5304
5421 5350 5290 5277 5659 5214
98.9 97.0 98.3 97.9
100.1 98.3
-1.1 -3.0 -1.7 -2.1 +0.1 -1.7
11 Effect of Sampling a Low Concentration
The effect of sampling a low concentration of sec-butyl alcohol vapor was tested by sampling a dynamically generated controlled test atmosphere, using the system described in Section 13, containing sec-butyl alcohol nominally at one-tenth the target concentration (calculated to be 13.5 ppm). The relative humidity and temperature of the air sampled were 78% and 21 °C, and the sampling flow rate was 50 mL/min. Samples were collected on three sorbent tubes for 240 min. After immediate analysis, results for sec-butyl alcohol as a percentage of expected recovery were 100.9%, 102.6%, and 100.9%.
12 Estimation of Uncertainty
While systematic biases such as analyte storage loss are examined, and limits are placed on these, an estimation of uncertainty that encompasses both potential random and systematic error was not completed. Instead, the overall standard error of estimate was calculated from the random error inherent to the points about the regression line produced by the ambient storage test described in Section 5, as prescribed by the OSHA validation guidelines in use at the time OSHA Method 5001 was originally validated. See Section 5 of this appendix for details.
OSHA Method 5001, Appendix E, sec-Butyl Alcohol 7 of 7
13 Controlled Test Atmosphere Procedure
Dynamically generated controlled test atmospheres were created in a walk-in hood. House air was regulated using a Miller Nelson Model 401 flow-temperature-humidity control system. A measured flow of liquid n-butyl alcohol, sec-butyl alcohol, isobutyl alcohol, and n-propyl alcohol was introduced with a KD Scientific Legato 100 syringe pump through a short length of 0.53 mm internal diameter uncoated fused silica capillary into a heated zone near the air flow entrance of the test atmosphere generator, where it was evaporated into a measured flow of dilution air from the flow-temperature-humidity control system. The resulting n-butyl alcohol, sec-butyl alcohol, isobutyl alcohol, and n-propyl alcohol vapor and dilution air flowed into a mixing chamber (30 cm length x 10 cm diameter), and then into a sampling chamber (68 cm length x 10 cm diameter). Sampling was completed from sampling ports present on the sampling chamber. Temperature and humidity measurements were obtained near the exit of the sampling chamber using a Vaisala HUMICAP Model HM70 hand-held humidity and temperature meter.

OSHA Method 5001, Appendix F, Isobutyl Alcohol 1 of 7
OSHA 5001, Appendix F Isobutyl Alcohol
Version: 1.1 OSHA PEL: ACGIH TLV:
100 ppm (300 mg/m3) 8-Hour TWA, General Industry, Construction, Shipyard 50 ppm (152 mg/m3) 8-Hour TWA
Recommended sampling time and sampling rate:
240 min at 50 mL/min (12 L)
Reliable quantitation limit: 0.077 ppb (0.23 mg/m3) Standard error of estimate: 5.2% Status: Fully validated. Method 5001 has been subjected to the established validation
procedures of the Method Development Team for sampling and analysis of isobutyl alcohol.
March 2019 (OSHA 5001, Version 1.0) Michael Simmons February 2021 (OSHA 5001, Version 1.1)
1 Introduction
1.1 Previous Methods used by OSHA for Sampling and Analysis of Isobutyl Alcohol
The specific analyte described in this appendix is isobutyl alcohol, CAS No. 78-83-1. The methodologies described in this appendix for isobutyl alcohol replace OSHA’s use of NIOSH Method 1401.10F
1 That method requires the collection of samples using charcoal sorbent tubes, extraction using 99/1 (v/v) carbon disulfide/2-propanol, and analysis by gas chromatography using a flame ionization detector.
1.2 Changes to the Previously-Used Method
This appendix represents a new method to replace OSHA’s use of NIOSH Method 14011 for sampling and analysis of isobutyl alcohol. Compared to the previous method used this method includes new sampling medium, extraction solvent, analytical parameters, internal standard (ISTD), and sample collection flow rate and collection time. The data found in all subsequent sections of this appendix are new. The changes were made to allow the standardized collection and analysis of isobutyl alcohol with other analytes found in Organic Vapor Sampling Group 2, described in OSHA Method 5001. Version 1.1 of this appendix represents an update to the format of version 1.0, with no new sampling or analytical data added.
1.3 Validation Parameters
The procedures used to develop the method validation data are described in Validation Guidelines for Air Sampling Methods Utilizing Chromatographic Analysis.11F
2 Air concentrations listed in ppm are referenced to 25 °C and 760 Torr. The target concentration for method evaluation was the OSHA 8-hour time-weighted average (TWA) permissible exposure limit (PEL) for isobutyl alcohol.
1 Williamson, G. Alcohols II (NIOSH Method 1401), 1994. Centers for Disease Control and Prevention, National Institute for
Occupational Safety and Health web site. https://www.cdc.gov/niosh/docs/2003-154/pdfs/1401.pdf (accessed December 2018). 2 Eide, M.; Simmons, M.; Hendricks, W. Validation Guidelines for Air Sampling Methods Utilizing Chromatographic Analysis, 2010.
United States Department of Labor, Occupational Safety & Health Administration Web site. http://www.osha.gov/dts/sltc/methods/chromguide/chromguide.pdf (accessed December 2018).
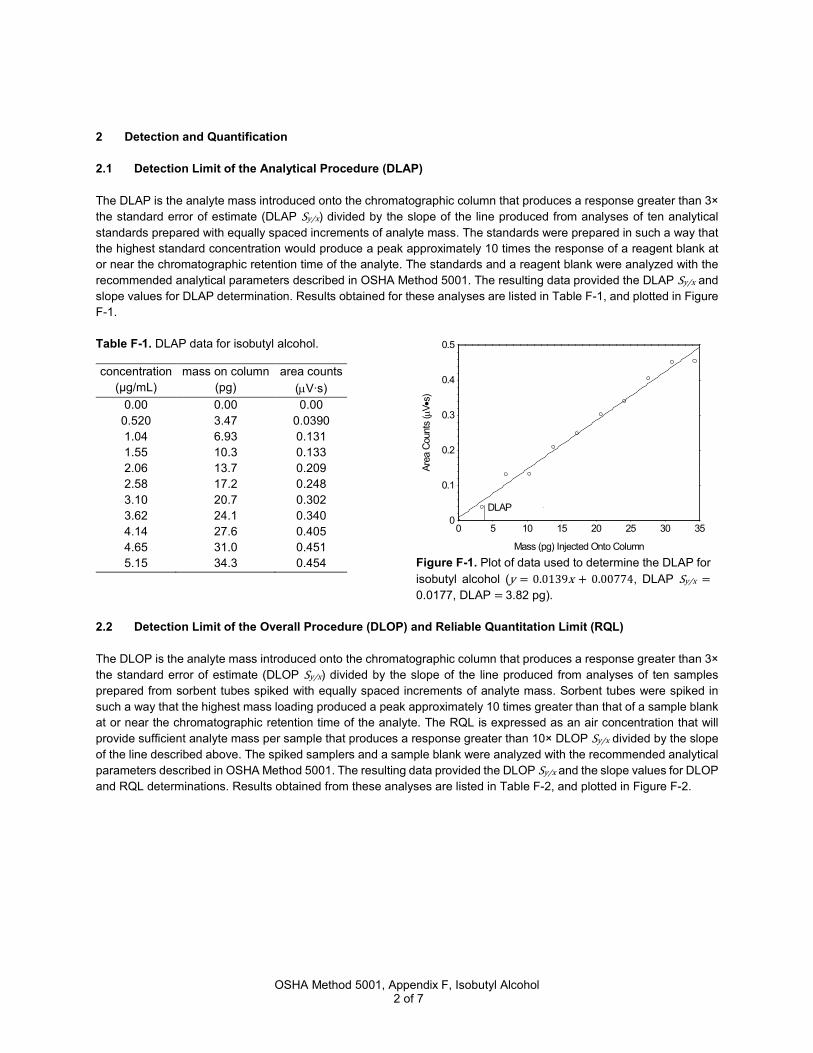
OSHA Method 5001, Appendix F, Isobutyl Alcohol 2 of 7
2 Detection and Quantification
2.1 Detection Limit of the Analytical Procedure (DLAP)
The DLAP is the analyte mass introduced onto the chromatographic column that produces a response greater than 3× the standard error of estimate (DLAP Sy/x) divided by the slope of the line produced from analyses of ten analytical standards prepared with equally spaced increments of analyte mass. The standards were prepared in such a way that the highest standard concentration would produce a peak approximately 10 times the response of a reagent blank at or near the chromatographic retention time of the analyte. The standards and a reagent blank were analyzed with the recommended analytical parameters described in OSHA Method 5001. The resulting data provided the DLAP Sy/x and slope values for DLAP determination. Results obtained for these analyses are listed in Table F-1, and plotted in Figure F-1. Table F-1. DLAP data for isobutyl alcohol.
concentration (µg/mL)
mass on column (pg)
area counts (µV∙s)
0.00 0.520 1.04 1.55 2.06 2.58 3.10 3.62 4.14 4.65 5.15
0.00 3.47 6.93 10.3 13.7 17.2 20.7 24.1 27.6 31.0 34.3
0.00 0.0390 0.131 0.133 0.209 0.248 0.302 0.340 0.405 0.451 0.454
Figure F-1. Plot of data used to determine the DLAP for isobutyl alcohol (y = 0.0139x + 0.00774, DLAP Sy/x = 0.0177, DLAP = 3.82 pg).
2.2 Detection Limit of the Overall Procedure (DLOP) and Reliable Quantitation Limit (RQL)
The DLOP is the analyte mass introduced onto the chromatographic column that produces a response greater than 3× the standard error of estimate (DLOP Sy/x) divided by the slope of the line produced from analyses of ten samples prepared from sorbent tubes spiked with equally spaced increments of analyte mass. Sorbent tubes were spiked in such a way that the highest mass loading produced a peak approximately 10 times greater than that of a sample blank at or near the chromatographic retention time of the analyte. The RQL is expressed as an air concentration that will provide sufficient analyte mass per sample that produces a response greater than 10× DLOP Sy/x divided by the slope of the line described above. The spiked samplers and a sample blank were analyzed with the recommended analytical parameters described in OSHA Method 5001. The resulting data provided the DLOP Sy/x and the slope values for DLOP and RQL determinations. Results obtained from these analyses are listed in Table F-2, and plotted in Figure F-2.
0
0.1
0.2
0.3
0.4
0.5
0 5 10 15 20 25 30 35
DLAP
Mass (pg) Injected Onto Column
Area
Cou
nts
(µV•
s)

OSHA Method 5001, Appendix F, Isobutyl Alcohol 3 of 7
Table F-2. DLOP and RQL data for isobutyl alcohol.
mass per sample (µg/sample)
area counts (µV∙s)
0.00 1.03 2.07 3.10 4.13 5.17 6.20 7.23 8.27 9.30 10.3
0.00 0.0330 0.138 0.168 0.213 0.249 0.316 0.372 0.434 0.489 0.533
Figure F-2. Plot of data used to determine the DLOP and RQL for isobutyl alcohol (y = 0.0519x - 0.000129, DLOP Sy/x = 0.0145, DLOP = 0.838 µg/sample, RQL = 2.79 µg/sample or 76.7 ppb).
3 Analytical Precision Across the Calibration Range
Fifteen analytical standards over a range of 0.1 to 2 times the analyte concentration in solvent that would be obtained from sampling for the recommended time at the target concentration were analyzed with the recommended analytical parameters described in OSHA Method 5001. An ordinary least-squares linear regression curve was created by plotting the analyte mass per sample versus the corresponding ratio of analyte peak area to internal standard (ISTD) peak area. The resulting data provided the standard error of estimate (Calibration Sy/x) value across the calibration range, which provides an indication of the imprecision attributable to the instrumental analysis of the target analyte. Results from these analyses are listed in Table F-3, and plotted in Figure F-3. Table F-3. Analytical precision data for isobutyl alcohol.
× target concn
(µg/sample)
0.1× 0.5× 1.0× 1.5× 2.0×
362.5 1812 3625 5438 7250
area ratio 0.08500 0.08520 0.08380
0.4284 0.4165 0.4250
0.8519 0.8777 0.8480
1.274 1.285 1.292
1.736 1.732 1.750
Figure F-3. Plot of data used to determine the precision of the analytical method for isobutyl alcohol (y = 0.000240x - 0.00823, Calibration Sy/x = 0.0117).
4 Sampler Storage Stability
Storage stability test samples for isobutyl alcohol were prepared by sampling a dynamically generated controlled test atmosphere, using the system described in Section 13. Sampling from this system followed the recommended sampling parameters published in OSHA Method 5001. The nominal concentration of isobutyl alcohol for ambient storage testing was the target concentration (calculated to be 91.4 ppm). The relative humidity and temperature of the air sampled
0
0.2
0.4
0 1 2 3 4 5 6 7 8 9 10 11
RQLDLOP
Mass (µg) per Sample
Area
Cou
nts
(µV•
s)
0
0.5
1.0
1.5
0 2000 4000 6000
Mass (µg) per Sample
Area
Rat
io

OSHA Method 5001, Appendix F, Isobutyl Alcohol 4 of 7
were 81% and 21 °C for this test. Eighteen storage samples were prepared and three of these were analyzed on the day that samples were created. The remaining fifteen samples were stored in a closed drawer at ambient temperature (about 22°C). Three samples were selected and analyzed from those remaining at 2-4 day intervals. The results of these analyses (uncorrected for extraction efficiency) are provided in Table F-4. Results are plotted in Figure F-4. The recovery of isobutyl alcohol calculated from the regression line generated for the 15-day ambient storage test was 100.8%. This result was not corrected for extraction efficiency. Table F-4. Sampler storage stability data for isobutyl alcohol.
time (days)
ambient storage recovery (%)
0 101.5 102.0 103.1 3 97.8 99.7 100.3 7 101.1 100.2 101.7
10 100.7 101.9 102.0 13 100.5 102.4 99.8 15 99.4 99.8 102.4
Figure F-4. Plot of ambient storage stability data for isobutyl alcohol.
5 Precision of the Overall Procedure
The overall standard error of estimate obtained from the ambient storage test analyses described in Section 4 and sampling pump variability were used to determine the precision of the overall procedure, where all aspects of sampling and analysis (sampling, sorbent tube handling and solvent extraction, and instrumental analysis) are considered. This value was obtained by taking the square root of the squared ambient storage stability standard error of estimate (Storage 𝑆𝑆𝑦𝑦/𝑥𝑥
2 ) added to the squared sampling pump variability value (𝑉𝑉𝑆𝑆𝑆𝑆2 ). The resulting precision of the overall procedure at the 95% confidence level for the ambient 15-day storage test (at the target concentration) for isobutyl alcohol was determined to be ±10.2% based on the observed ambient Storage Sy/x value of 5.2% and 𝑉𝑉𝑆𝑆𝑆𝑆 value of 5.0%.
6 Recovery and Stability of Prepared Samples
Quantitative extraction is affected by the extraction solvent, the ISTD, the sampling medium, and the technique used to extract samples. The data presented demonstrate validity for the extraction solvent, ISTD, sampling medium, and extraction technique described in OSHA Method 5001. If other combinations of these are to be used, testing must be completed to satisfy the requirements found in current OSHA sampling and analysis method validation guidelines. Acceptable testing results must be documented. A value for extraction efficiency (EE) was determined by liquid-spiking four replicate sorbent tubes across a range of analyte mass values that would be obtained from sampling at 0.1 to 2 times the target concentration value for 240 min. Four sorbent tubes were also spiked in this fashion at the target concentration after drawing humid air (80% relative humidity at 21 °C) through these tubes at 50 mL/min for 6 hours. All of the samples described above were analyzed the following day after being kept overnight at ambient temperature. The EE value at the RQL was 99.6%, while that of the working range samples (excluding the samples through which humid air had been drawn) was 102.2%. The data are shown in Table F-5. Pre-loading sorbent tubes with moisture (“wet” designation in the table) did not have an unacceptable effect on EE.
0
20
40
60
80
100
120
0 2 4 6 8 10 12 14 16
y = -0.0216x + 101.1Overall Std Error of Estimate = 5.2%95% Confidence Limits = ±(1.96)(5.2%) = ±10.2%
Storage Time (Days)Re
cove
ry (%
)

OSHA Method 5001, Appendix F, Isobutyl Alcohol 5 of 7
Table F-5. Extraction efficiency data for isobutyl alcohol.
level sample number × target concn
µg per sample 1 2 3 4 mean
0.1 362.5 101.5 100.2 102.2 100.9 101.2 0.25 906.3 102.2 102.4 102.4 101.8 102.2 0.5 1813 100.7 101.0 102.1 101.4 101.3 1.0 3625 102.8 102.7 103.9 102.8 103.0 1.5 5438 103.0 102.7 102.7 102.5 102.7 2.0 7250 103.3 102.9 102.8 102.2 102.8
RQL 2.78 107.9 96.6 97.8 96.0 99.6
1.0 (wet) 3625 102.4 102.0 102.0 102.6 102.2
The stability of sample extracts prepared according to OSHA Method 5001 was examined by retaining the sample solvent extracts for the target concentration samples described immediately above. Two of the four vials were immediately recapped with new septa following the initial analyses, and again following each re-analysis event. The other two vials retained the original punctured septa throughout. All four vials were re-analyzed at 24, 48, and 72 hours after the initial analyses, with all vials remaining in the autosampler tray kept at 22 °C. Freshly prepared standards were used for each analysis event, and each septum (whether new or previously used) was punctured four times for each injection. The resulting data are shown in Table F-6. Table F-6. Extracted sample stability data for isobutyl alcohol.
punctured septa replaced recovery (%)
punctured septa retained recovery (%)
time (days) 1 2 1 2
0 102.8 102.7 103.9 103.4 1 102.2 102.2 103.5 103.3 2 102.4 102.5 103.1 103.1 3 102.5 102.5 103.1 103.1
7 Sampler Capacity
The sampling capacity of a single 400 mg sorbent tube was tested by sampling a dynamically generated controlled test atmosphere, using the system described in Section 13, containing isobutyl alcohol nominally at two times the target concentration (calculated to be 176 ppm, and 206 ppm). The relative humidities and temperatures of the air sampled were respectively 79% and 21 °C, and 20% and 21 °C, and the sampling flow rate was 50 mL/min. A sorbent tube testing system was made by placing two sampling tubes in series. The rear 400-mg sorbent tube was removed and analyzed at 480 min. No breakthrough in any of three replicate samples was observed for either humidity/temperature condition after sampling for 8 hours (corresponding to 24 liters). Data from six sorbent tube testing systems were used to determine a recommended sampling volume of 12 liters for isobutyl alcohol as described in OSHA Method 5001. This volume corresponds to a 240 min sampling period which is the maximum recommended sampling time regardless of breakthrough.
8 Low Humidity
The effect of low humidity was tested by sampling a dynamically generated controlled test atmosphere, using the system described in Section 13, containing isobutyl alcohol nominally at two times the target concentration (calculated to be 202 ppm). The relative humidity and temperature of the air sampled were 20% and 21 °C, and the sampling flow rate was 50 mL/min. Samples were collected on three sorbent tubes for 240 min. After immediate analysis, results as a percentage of expected recovery were 94.5%, 95.3%, and 96.5%.

OSHA Method 5001, Appendix F, Isobutyl Alcohol 6 of 7
9 Chemical Interference
The effect of potential chemical sampling interference was tested by sampling a dynamically generated controlled test atmosphere, using the system described in Section 13, containing isobutyl alcohol nominally at the target concentration (calculated to be 91.4 ppm). The relative humidity and temperature of the air sampled were 81% and 21 °C, and the sampling flow rate was 50 mL/min. sec-Butyl alcohol, n-butyl alcohol, and n-propyl alcohol were present as potential interferents, (calculated to be at respective concentrations of 137 ppm, 92.0 ppm, and 169 ppm). Samples were collected on three sorbent tubes for 240 min. After immediate analysis, results for isobutyl alcohol as a percentage of expected recovery were 101.5%, 102.0%, and 103.1%.
10 Analytical Method Reproducibility
Samples were prepared by sampling a dynamically generated controlled test atmosphere, using the system described in Section 13, containing isobutyl alcohol nominally at the target concentration (calculated to be 99.0 ppm). The relative humidity and temperature of the air sampled were 79% and 21 °C, and sampling flow rate was 50 mL/min. Samples were collected on six sorbent tubes for 240 min. The resulting samples were submitted to the OSHA Salt Lake Technical Center for analysis using the procedures described in OSHA Method 5001 after storage for 11 days at 4 °C. The analytical results corrected for EE are provided in Table F-7. No sample result for isobutyl alcohol fell outside the permissible bounds set by the precision of the overall procedure determined in Section 5 of this appendix. Table F-7. Reproducibility data for isobutyl alcohol.
sampled (µg/sample)
recovered (µg/sample)
recovery (%)
deviation (%)
3615 3634 3549 3553 3727 3496
3435 3395 3360 3345 3593 3310
95.0 93.4 94.7 94.1 96.4 94.7
-5.0 -6.6 -5.3 -5.9 -3.6 -5.3
11 Effect of Sampling a Low Concentration
The effect of sampling a low concentration of isobutyl alcohol vapor was tested by sampling a dynamically generated controlled test atmosphere, using the system described in Section 13, containing isobutyl alcohol nominally at one-tenth the target concentration (calculated to be 9.2 ppm). The relative humidity and temperature of the air sampled were 78% and 21 °C, and the sampling flow rate was 50 mL/min. Samples were collected on three sorbent tubes for 240 min. After immediate analysis, results for isobutyl alcohol as a percentage of expected recovery were 99.1%, 101.0%, and 99.6%.
12 Estimation of Uncertainty
While systematic biases such as analyte storage loss are examined, and limits are placed on these, an estimation of uncertainty that encompasses both potential random and systematic error was not completed. Instead, the overall standard error of estimate was calculated from the random error inherent to the points about the regression line produced by the ambient storage test described in Section 5, as prescribed by the OSHA validation guidelines in use at the time OSHA Method 5001 was originally validated. See Section 5 of this appendix for details.
13 Controlled Test Atmosphere Procedure
Dynamically generated controlled test atmospheres were created in a walk-in hood. House air was regulated using a Miller Nelson Model 401 flow-temperature-humidity control system. A measured flow of liquid n-butyl alcohol, sec-butyl alcohol, isobutyl alcohol, and n-propyl alcohol was introduced with a KD Scientific Legato 100 syringe pump through a

OSHA Method 5001, Appendix F, Isobutyl Alcohol 7 of 7
short length of 0.53 mm internal diameter uncoated fused silica capillary into a heated zone near the air flow entrance of the test atmosphere generator, where it was evaporated into a measured flow of dilution air from the flow-temperature-humidity control system. The resulting n-butyl alcohol, sec-butyl alcohol, isobutyl alcohol, and n-propyl alcohol vapor and dilution air flowed into a mixing chamber (30 cm length x 10 cm diameter), and then into a sampling chamber (68 cm length x 10 cm diameter). Sampling was completed from sampling ports present on the sampling chamber. Temperature and humidity measurements were obtained near the exit of the sampling chamber using a Vaisala HUMICAP Model HM70 hand-held humidity and temperature meter.

OSHA Method 5001, Appendix G, n-Propyl Alcohol 1 of 7
OSHA 5001, Appendix G n-Propyl Alcohol
Version: 1.1 OSHA PEL: ACGIH TLV:
200 ppm (500 mg/m3) 8-Hour TWA, General Industry, Construction, Shipyard 100 ppm (246 mg/m3) 8-Hour TWA
Recommended sampling time and sampling rate:
240 min at 50 mL/min (12 L)
Reliable quantitation limit: 0.14 ppm (0.34 mg/m3) Standard error of estimate: 5.2% Status: Fully validated. Method 5001 has been subjected to the established validation
procedures of the Method Development Team for sampling and analysis of n-propyl alcohol.
March 2019 (OSHA 5001, Version 1.0) Michael Simmons February 2021 (OSHA 5001, Version 1.1)
1 Introduction
1.1 Previous Methods used by OSHA for Sampling and Analysis of n-Propyl Alcohol
The specific analyte described in this appendix is n-propyl alcohol, CAS No. 71-23-8. The methodologies described in this appendix for n-propyl alcohol replace OSHA’s use of NIOSH Method 1401.12F
1 That method requires the collection of samples using charcoal sorbent tubes, extraction using 99/1 (v/v) carbon disulfide/2-propanol, and analysis by gas chromatography using a flame ionization detector.
1.2 Changes to the Previously-Used Method
This appendix represents a new method to replace OSHA’s use of NIOSH Method 14011 for sampling and analysis of n-propyl alcohol. Compared to the previous method used this method includes new sampling medium, extraction solvent, analytical parameters, internal standard (ISTD), and sample collection flow rate and collection time. The data found in all subsequent sections of this appendix are new. The changes were made to allow the standardized collection and analysis of n-propyl alcohol with other analytes found in Organic Vapor Sampling Group 2, described in OSHA Method 5001. Version 1.1 of this appendix represents an update to the format of version 1.0, with no new sampling or analytical data added.
1.3 Validation Parameters
The procedures used to develop the method validation data are described in Validation Guidelines for Air Sampling Methods Utilizing Chromatographic Analysis.13F
2 Air concentrations listed in ppm are referenced to 25 °C and 760 Torr. The target concentration for method evaluation was the OSHA 8-hour time-weighted average (TWA) permissible exposure limit (PEL) for n-propyl alcohol.
1 Williamson, G. Alcohols II (NIOSH Method 1401), 1994. Centers for Disease Control and Prevention, National Institute for
Occupational Safety and Health web site. https://www.cdc.gov/niosh/docs/2003-154/pdfs/1401.pdf (accessed December 2018). 2 Eide, M.; Simmons, M.; Hendricks, W. Validation Guidelines for Air Sampling Methods Utilizing Chromatographic Analysis, 2010.
United States Department of Labor, Occupational Safety & Health Administration Web site. http://www.osha.gov/dts/sltc/methods/chromguide/chromguide.pdf (accessed December 2018).

OSHA Method 5001, Appendix G, n-Propyl Alcohol 2 of 7
2 Detection and Quantification
2.1 Detection Limit of the Analytical Procedure (DLAP)
The DLAP is the analyte mass introduced onto the chromatographic column that produces a response greater than 3× the standard error of estimate (DLAP Sy/x) divided by the slope of the line produced from analyses of ten analytical standards prepared with equally spaced increments of analyte mass. The standards were prepared in such a way that the highest standard concentration would produce a peak approximately 10 times the response of a reagent blank at or near the chromatographic retention time of the analyte. The standards and a reagent blank were analyzed with the recommended analytical parameters described in OSHA Method 5001. The resulting data provided the DLAP Sy/x and slope values for DLAP determination. Results obtained for these analyses are listed in Table G-1, and plotted in Figure G-1. Table G-1. DLAP data for n-propyl alcohol.
concentration (µg/mL)
mass on column (pg)
area counts (µV∙s)
0.00 0.520 1.04 1.56 2.09 2.61 3.13 3.65 4.18 4.70 5.20
0.00 3.47 6.93 10.4 13.9 17.4 20.9 24.3 27.9 31.3 34.7
0.00 0.0820 0.103 0.129 0.173 0.199 0.256 0.337 0.312 0.395 0.432
Figure G-1. Plot of data used to determine the DLAP for n-propyl alcohol (y = 0.0119x + 0.0137, DLAP Sy/x = 0.0210, DLAP = 5.29 pg).
2.2 Detection Limit of the Overall Procedure (DLOP) and Reliable Quantitation Limit (RQL)
The DLOP is the analyte mass introduced onto the chromatographic column that produces a response greater than 3× the standard error of estimate (DLOP Sy/x) divided by the slope of the line produced from analyses of ten samples prepared from sorbent tubes spiked with equally spaced increments of analyte mass. Sorbent tubes were spiked in such a way that the highest mass loading produced a peak approximately 10 times greater than that of a sample blank at or near the chromatographic retention time of the analyte. The RQL is expressed as an air concentration that will provide sufficient analyte mass per sample that produces a response greater than 10× DLOP Sy/x divided by the slope of the line described above. The spiked samplers and a sample blank were analyzed with the recommended analytical parameters described in OSHA Method 5001. The resulting data provided the DLOP Sy/x and the slope values for DLOP and RQL determinations. Results obtained from these analyses are listed in Table G-2, and plotted in Figure G-2.
0
0.15
0.30
0.45
0 5 10 15 20 25 30 35
DLAP
Mass (pg) Injected Onto Column
Area
Cou
nts
(µV•
s)

OSHA Method 5001, Appendix G, n-Propyl Alcohol 3 of 7
Table G-2. DLOP and RQL data for n-propyl alcohol.
mass per sample (µg/sample)
area counts (µV∙s)
0.00 1.04 2.09 3.13 4.18 5.22 6.26 7.31 8.35 9.40 10.4
0.00 0.0270 0.0740 0.120 0.163 0.232 0.237 0.287 0.389 0.408 0.435
Figure G-2. Plot of data used to determine the DLOP and RQL for n-propyl alcohol (y = 0.0441x - 0.0142, DLOP Sy/x = 0.0182, DLOP = 1.24 µg/sample, RQL = 4.13 µg/sample or 141 ppb).
3 Analytical Precision Across the Calibration Range
Fifteen analytical standards over a range of 0.1 to 2 times the analyte concentration in solvent that would be obtained from sampling for the recommended time at the target concentration were analyzed with the recommended analytical parameters described in OSHA Method 5001. An ordinary least-squares linear regression curve was created by plotting the analyte mass per sample versus the corresponding ratio of analyte peak area to internal standard (ISTD) peak area. The resulting data provided the standard error of estimate (Calibration Sy/x) value across the calibration range, which provides an indication of the imprecision attributable to the instrumental analysis of the target analyte. Results from these analyses are listed in Table G-3, and plotted in Figure G-3. Table G-3. Analytical precision data for n-propyl alcohol.
× target concn
(µg/sample)
0.1× 0.5× 1.0× 1.5× 2.0×
587.9 2940 5879 8819 11,759
area ratio 0.1160 0.1157 0.1142
0.5829 0.5660 0.5788
1.157 1.197 1.155
1.736 1.750 1.760
2.365 2.362 2.385
Figure G-3. Plot of data used to determine the precision of the analytical method for n-propyl alcohol (y = 0.000202x - 0.0121, Calibration Sy/x = 0.0165).
4 Sampler Storage Stability
Storage stability test samples for n-propyl alcohol were prepared by sampling a dynamically generated controlled test atmosphere, using the system described in Section 13. Sampling from this system followed the recommended sampling parameters published in OSHA Method 5001. The nominal concentration of n-propyl alcohol for ambient storage testing
0
0.15
0.30
0.45
0 1 2 3 4 5 6 7 8 9 10
RQLDLOP
Mass (µg) per Sample
Area
Cou
nts
(µV•
s)
0
0.5
1.0
1.5
2.0
0 4000 8000 12000
Mass (µg) per Sample
Area
Rat
io

OSHA Method 5001, Appendix G, n-Propyl Alcohol 4 of 7
was the target concentration (calculated to be 169 ppm). The relative humidity and temperature of the air sampled were 81% and 21 °C for this test. Eighteen samples were prepared and three of these were analyzed on the day that samples were created. The remaining fifteen samples were stored in a closed drawer at ambient temperature (about 22°C). Three samples were selected and analyzed from those remaining at 2-4 day intervals. The results of these analyses (uncorrected for extraction efficiency) are provided in Table G-4. Results are plotted in Figure G-4. The recovery of n-propyl alcohol calculated from the regression line generated for the 15-day ambient storage test was 99.6%. Table G-4. Sampler storage stability data for n-propyl alcohol.
time (days)
ambient storage recovery (%)
0 100.8 101.2 102.1 3 96.8 99.0 99.4 7 99.9 99.2 100.9
10 99.6 100.6 101.2 13 99.2 100.9 99.1 15 98.3 98.7 101.4
Figure G-4. Plot of ambient storage stability data for n-propyl alcohol.
5 Precision of the Overall Procedure
The overall standard error of estimate obtained from the ambient storage test analyses described in Section 4 and sampling pump variability were used to determine the precision of the overall procedure, where all aspects of sampling and analysis (sampling, sorbent tube handling and solvent extraction, and instrumental analysis) are considered. This value was obtained by taking the square root of the squared ambient storage stability standard error of estimate (Storage 𝑆𝑆𝑦𝑦/𝑥𝑥
2 ) added to the squared sampling pump variability value (𝑉𝑉𝑆𝑆𝑆𝑆2 ). The resulting precision of the overall procedure at the 95% confidence level for the ambient 15-day storage test (at the target concentration) for n-propyl alcohol was determined to be ±10.2% based on the observed ambient Storage Sy/x value of 5.2% and 𝑉𝑉𝑆𝑆𝑆𝑆 value of 5.0%.
6 Recovery and Stability of Prepared Samples
Quantitative extraction is affected by the extraction solvent, the ISTD, the sampling medium, and the technique used to extract samples. The data presented demonstrate validity for the extraction solvent, ISTD, sampling medium, and extraction technique described in OSHA Method 5001. If other combinations of these are to be used, testing must be completed to satisfy the requirements found in current OSHA sampling and analysis method validation guidelines. Acceptable testing results must be documented. A value for extraction efficiency (EE) was determined by liquid-spiking four replicate sorbent tubes across a range of analyte mass values that would be obtained from sampling at 0.1 to 2 times the target concentration value for 240 min. Four sorbent tubes were also spiked in this fashion at the target concentration after drawing humid air (80% relative humidity at 21 °C) through these tubes at 50 mL/min for 6 hours. All of the samples described above were analyzed the following day after being kept overnight at ambient temperature. The EE value at the RQL was 101.0%, while that of the working range samples (excluding the samples through which humid air had been drawn) was 101.7%. The data are shown in Table G-5. Pre-loading sorbent tubes with moisture (“wet” designation in the table) did not have an unacceptable effect on EE.
0
20
40
60
80
100
120
0 2 4 6 8 10 12 14 16
y = -0.0411x + 100.2Overall Std Error of Estimate = 5.2%95% Confidence Limits = ±(1.96)(5.2%) = ±10.2%
Storage Time (Days)
Reco
very
(%)

OSHA Method 5001, Appendix G, n-Propyl Alcohol 5 of 7
Table G-5. Extraction efficiency data for n-propyl alcohol.
level sample number × target concn
µg per sample 1 2 3 4 Mean
0.1 587.9 101.1 99.6 101.8 100.7 100.8 0.25 1470 101.7 101.8 101.8 101.5 101.7 0.5 2940 99.9 100.4 101.5 100.7 100.6 1.0 5879 102.2 102.2 103.4 102.3 102.5 1.5 8819 102.3 102.2 102.2 102.0 102.2 2.0 11,759 102.8 102.3 102.2 101.7 102.2
RQL 4.18 100.0 95.0 104.8 104.4 101.0
1.0 (wet) 5879 101.5 101.2 101.3 101.9 101.5 The stability of sample extracts prepared according to OSHA Method 5001 was examined by retaining the sample solvent extracts for the target concentration samples described immediately above. Two of the four vials were immediately recapped with new septa following the initial analyses, and again following each re-analysis event. The other two vials retained the original punctured septa throughout. All four vials were re-analyzed at 24, 48, and 72 hours after the initial analyses, with all vials remaining in the autosampler tray kept at 22 °C. Freshly prepared standards were used for each analysis event, and each septum (whether new or previously used) was punctured four times for each injection. The resulting data are shown in Table G-6. Table G-6. Extracted sample stability data for n-propyl alcohol.
punctured septa replaced recovery (%)
punctured septa retained recovery (%)
time (days) 1 2 1 2
0 102.2 102.2 103.4 102.9 1 101.6 101.4 102.9 102.8 2 101.8 101.8 102.6 102.6 3 101.8 102.0 102.5 102.5
7 Sampler Capacity
The sampling capacity of a single 400 mg sorbent tube was tested by sampling a dynamically generated controlled test atmosphere, using the system described in Section 13, containing n-propyl alcohol nominally at two times the target concentration (calculated to be 330 ppm, and 384 ppm). The relative humidities and temperatures of the air sampled were respectively 79% and 21 °C, and 20% and 21 °C, and the sampling flow rate was 50 mL/min. A sorbent tube testing system was made by placing two sampling tubes in series. The rear 400-mg sorbent tube was removed and analyzed at 480 min. No breakthrough in any of three replicate samples was observed for either humidity/temperature condition after sampling for 8 hours (corresponding to 24 liters). Data from six sorbent tube testing systems were used to determine a recommended sampling volume of 12 liters for n-propyl alcohol as described in OSHA Method 5001. This volume corresponds to a 240 min sampling period which is the maximum recommended sampling time regardless of breakthrough.
8 Low Humidity
The effect of low humidity was tested by sampling a dynamically generated controlled test atmosphere, using the system described in Section 13, containing n-propyl alcohol nominally at two times the target concentration (calculated to be 378 ppm). The relative humidity and temperature of the air sampled were 20% and 21 °C, and the sampling flow rate was 50 mL/min. Samples were collected on three sorbent tubes for 240 min. After immediate analysis, results as a percentage of expected recovery were 94.2%, 95.3%, and 96.2%.

OSHA Method 5001, Appendix G, n-Propyl Alcohol 6 of 7
9 Chemical Interference
The effect of potential chemical sampling interference was tested by sampling a dynamically generated controlled test atmosphere, using the system described in Section 13, containing n-propyl alcohol nominally at the target concentration (calculated to be 169 ppm). The relative humidity and temperature of the air sampled were 81% and 21 °C, and the sampling flow rate was 50 mL/min. sec-Butyl alcohol, isobutyl alcohol, and n-butyl alcohol were present as potential interferents (calculated to be at respective concentrations of 137 ppm, 91.4 ppm, and 92.0 ppm). Samples were collected on three sorbent tubes for 240 min. After immediate analysis, results for n-propyl alcohol as a percentage of expected recovery were 98.9%, 99.9%, and 101.4%.
10 Analytical Method Reproducibility
Samples were prepared by sampling a dynamically generated controlled test atmosphere, using the system described in Section 13, containing n-propyl alcohol nominally at the target concentration (calculated to be 185 ppm). The relative humidity and temperature of the air sampled were 79% and 21 °C, and the sampling flow rate was 50 mL/min. Samples were collected on six sorbent tubes for 240 min. The resulting samples were submitted to the OSHA Salt Lake Technical Center for analysis using the procedures described in OSHA Method 5001 after storage for 11 days at 4 °C. The analytical results corrected for EE are provided in Table G-7. No sample result for n-propyl alcohol fell outside the permissible bounds set by the precision of the overall procedure determined in Section 5 of this appendix. Table G-7. Reproducibility data for n-propyl alcohol.
sampled (µg/sample)
recovered (µg/sample)
recovery (%)
deviation (%)
5479 5508 5379 5384 5649 5299
5254 5205 5158 5143 5516 5082
95.9 94.5 95.9 95.5 97.6 95.9
-4.1 -5.5 -4.1 -4.5 -2.4 -4.1
11 Effect of Sampling a Low Concentration
The effect of sampling a low concentration of n-propyl alcohol vapor was tested by sampling a dynamically generated controlled test atmosphere, using the system described in Section 13, containing n-propyl alcohol nominally at one-tenth the target concentration (calculated to be 17.2 ppm). The relative humidity and temperature of the air sampled were 78% and 21 °C, and the sampling flow rate was 50 mL/min. Samples were collected on three sorbent tubes for 240 min. After immediate analysis, results for n-propyl alcohol as a percentage of expected recovery were 101.0%, 102.7%, and 102.2%.
12 Estimation of Uncertainty
While systematic biases such as analyte storage loss are examined, and limits are placed on these, an estimation of uncertainty that encompasses both potential random and systematic error was not completed. Instead, the overall standard error of estimate was calculated from the random error inherent to the points about the regression line produced by the ambient storage test described in Section 5, as prescribed by the OSHA validation guidelines in use at the time OSHA Method 5001 was originally validated. See Section 5 of this appendix for details.
13 Controlled Test Atmosphere Procedure
Dynamically generated controlled test atmospheres were created in a walk-in hood. House air was regulated using a Miller Nelson Model 401 flow-temperature-humidity control system. A measured flow of liquid n-butyl alcohol, sec-butyl alcohol, isobutyl alcohol, and n-propyl alcohol was introduced with a KD Scientific Legato 100 syringe pump through a

OSHA Method 5001, Appendix G, n-Propyl Alcohol 7 of 7
short length of 0.53 mm internal diameter uncoated fused silica capillary into a heated zone near the air flow entrance of the test atmosphere generator, where it was evaporated into a measured flow of dilution air from the flow-temperature-humidity control system. The resulting n-butyl alcohol, sec-butyl alcohol, isobutyl alcohol, and n-propyl alcohol vapor and dilution air flowed into a mixing chamber (30 cm length x 10 cm diameter), and then into a sampling chamber (68 cm length x 10 cm diameter). Sampling was completed from sampling ports present on the sampling chamber. Temperature and humidity measurements were obtained near the exit of the sampling chamber using a Vaisala HUMICAP Model HM70 hand-held humidity and temperature meter.

OSHA Method 5001, Appendix H, 2-Butoxyethanol 1 of 7
OSHA 5001, Appendix H 2-Butoxyethanol
Version: 1.0 OSHA PEL: ACGIH TLV:
50 ppm (240 mg/m3) 8-Hour TWA, General Industry, Construction, Shipyard 20 ppm (97 mg/m3) 8-Hour TWA
Recommended sampling time and sampling rate:
240 min at 50 mL/min (12 L)
Reliable quantitation limit: 0.12 ppm (0.58 mg/m3) Standard error of estimate: 5.5% Status: Fully validated. Method 5001 has been subjected to the established validation
procedures of the Method Development Team for sampling and analysis of 2-butoxyethanol.
June 2021 (OSHA 5001, Version 1.2) Michael Simmons
1 Introduction
1.1 Previous Methods used by OSHA for Sampling and Analysis of 2-Butoxyethanol
The specific analyte described in this appendix is 2-butoxyethanol, CAS No. 111-76-2. The methodologies described in this appendix for 2-butoxyethanol replace OSHA’s use of OSHA Method 83.14F
1 That method requires the collection of samples using coconut shell sorbent tubes, extraction using 95/5 (v/v) methylene chloride/methanol, and analysis by gas chromatography using a flame ionization detector.
1.2 Changes to the Previously-Used Method
This appendix represents a new method to replace OSHA’s use of OSHA Method 831 for sampling and analysis of 2-butoxyethanol. Compared to the previous method used this method includes new sampling medium, extraction solvent, analytical parameters, internal standard (ISTD), and sample collection flow rate and collection time. The data found in all subsequent sections of this appendix are new. The changes were made to allow the standardized collection and analysis of 2-butoxyethanol with other analytes found in Organic Vapor Sampling Group 2, described in OSHA Method 5001.
1.3 Validation Parameters
The procedures used to develop the method validation data are described in Validation Guidelines for Air Sampling Methods Utilizing Chromatographic Analysis.15F
2 Air concentrations listed in ppm are referenced to 25 °C and 760 Torr. The target concentration for method evaluation was the OSHA 8-hour time-weighted average (TWA) permissible exposure limit (PEL) for 2-butoxyethanol.
1 Elskamp, C. J. 2-Butoxyethanol (Butyl Cellosolve), 2-Butoxyethyl Acetate (Butyl Cellosolve Acetate) (OSHA Method 83), 1990.
United States Department of Labor, Occupational Safety & Health Administration Web site. https://www.osha.gov/dts/sltc/methods/organic/org083/org083.html (accessed February 2021).
2 Eide, M.; Simmons, M.; Hendricks, W. Validation Guidelines for Air Sampling Methods Utilizing Chromatographic Analysis, 2010. United States Department of Labor, Occupational Safety & Health Administration Web site. http://www.osha.gov/dts/sltc/methods/chromguide/chromguide.pdf (accessed December 2018).
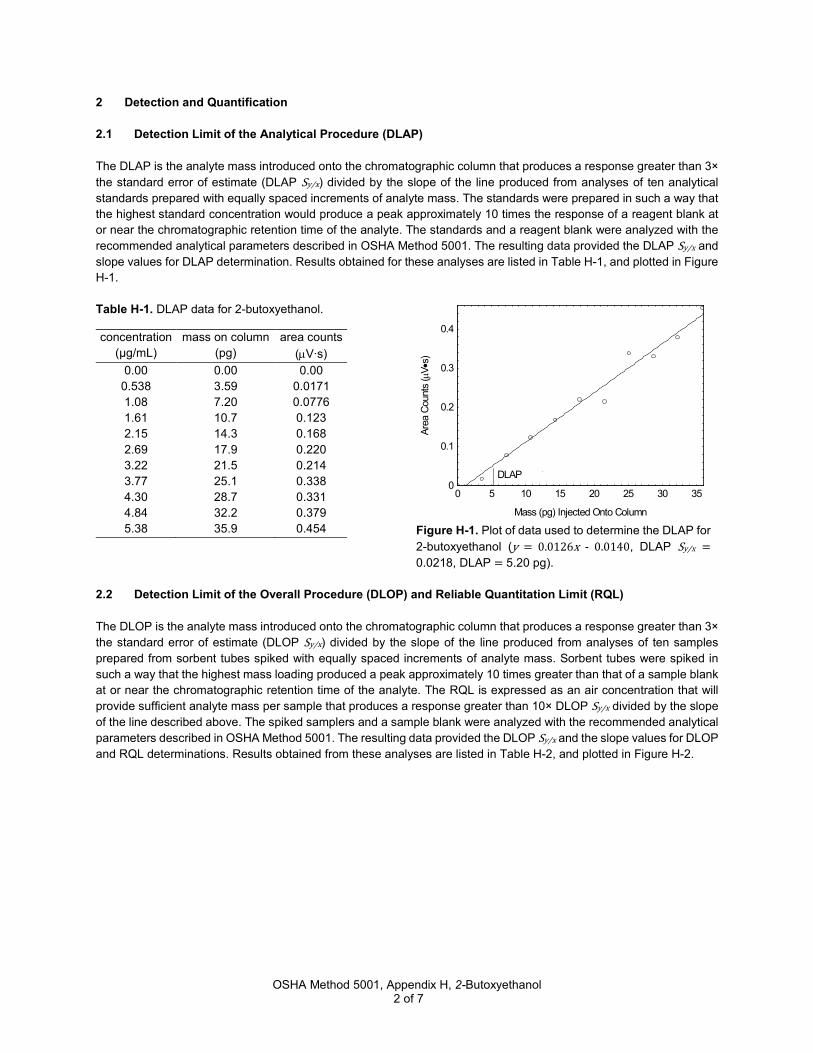
OSHA Method 5001, Appendix H, 2-Butoxyethanol 2 of 7
2 Detection and Quantification
2.1 Detection Limit of the Analytical Procedure (DLAP)
The DLAP is the analyte mass introduced onto the chromatographic column that produces a response greater than 3× the standard error of estimate (DLAP Sy/x) divided by the slope of the line produced from analyses of ten analytical standards prepared with equally spaced increments of analyte mass. The standards were prepared in such a way that the highest standard concentration would produce a peak approximately 10 times the response of a reagent blank at or near the chromatographic retention time of the analyte. The standards and a reagent blank were analyzed with the recommended analytical parameters described in OSHA Method 5001. The resulting data provided the DLAP Sy/x and slope values for DLAP determination. Results obtained for these analyses are listed in Table H-1, and plotted in Figure H-1. Table H-1. DLAP data for 2-butoxyethanol.
concentration (µg/mL)
mass on column (pg)
area counts (µV∙s)
0.00 0.538 1.08 1.61 2.15 2.69 3.22 3.77 4.30 4.84 5.38
0.00 3.59 7.20 10.7 14.3 17.9 21.5 25.1 28.7 32.2 35.9
0.00 0.0171 0.0776 0.123 0.168 0.220 0.214 0.338 0.331 0.379 0.454
Figure H-1. Plot of data used to determine the DLAP for 2-butoxyethanol (y = 0.0126x - 0.0140, DLAP Sy/x = 0.0218, DLAP = 5.20 pg).
2.2 Detection Limit of the Overall Procedure (DLOP) and Reliable Quantitation Limit (RQL)
The DLOP is the analyte mass introduced onto the chromatographic column that produces a response greater than 3× the standard error of estimate (DLOP Sy/x) divided by the slope of the line produced from analyses of ten samples prepared from sorbent tubes spiked with equally spaced increments of analyte mass. Sorbent tubes were spiked in such a way that the highest mass loading produced a peak approximately 10 times greater than that of a sample blank at or near the chromatographic retention time of the analyte. The RQL is expressed as an air concentration that will provide sufficient analyte mass per sample that produces a response greater than 10× DLOP Sy/x divided by the slope of the line described above. The spiked samplers and a sample blank were analyzed with the recommended analytical parameters described in OSHA Method 5001. The resulting data provided the DLOP Sy/x and the slope values for DLOP and RQL determinations. Results obtained from these analyses are listed in Table H-2, and plotted in Figure H-2.
0
0.1
0.2
0.3
0.4
0 5 10 15 20 25 30 35
DLAP
Mass (pg) Injected Onto Column
Area
Cou
nts
(µV•
s)

OSHA Method 5001, Appendix H, 2-Butoxyethanol 3 of 7
Table H-2. DLOP and RQL data for 2-butoxyethanol.
mass per sample (µg/sample)
area counts (µV∙s)
0.00 1.08 2.15 3.23 4.30 5.38 6.46 7.53 8.61 9.68 10.8
0.0043 0.0480 0.0652 0.114 0.161 0.175 0.320 0.296 0.326 0.370 0.461
Figure H-2. Plot of data used to determine the DLOP and RQL for 2-butoxyethanol (y = 0.0412x - 0.00878, DLOP Sy/x = 0.0289, DLOP = 2.10 µg/sample, RQL = 7.01 µg/sample or 121 ppb).
3 Analytical Precision Across the Calibration Range
Fifteen analytical standards over a range of 0.1 to 2 times the analyte concentration in solvent that would be obtained from sampling for the recommended time at the target concentration were analyzed with the recommended analytical parameters described in OSHA Method 5001. An ordinary least-squares linear regression curve was created by plotting the analyte mass per sample versus the corresponding ratio of analyte peak area to internal standard (ISTD) peak area. The resulting data provided the standard error of estimate (Calibration Sy/x) value across the calibration range, which provides an indication of the imprecision attributable to the instrumental analysis of the target analyte. Results from these analyses are listed in Table H-3, and plotted in Figure H-3. Table H-3. Analytical precision data for 2-butoxyethanol.
× target concn
(µg/sample)
0.1× 0.5× 1.0× 1.5× 2.0×
269.0 1457 2914 4483 5828
area ratio 0.05767 0.05734 0.05821
0.3224 0.3214 0.3204
0.6470 0.6388 0.6264
0.9836 0.9778 0.9773
1.286 1.276 1.290
Figure H-3. Plot of data used to determine the precision of the analytical method for 2-butoxyethanol (y = 0.000220x - 0.00154, Calibration Sy/x = 0.00614).
4 Sampler Storage Stability
Storage stability test samples for 2-butoxyethanol were prepared by sampling a dynamically generated controlled test atmosphere, using the system described in Section 13. Sampling from this system followed the recommended sampling parameters published in OSHA Method 5001. The nominal concentration of 2-butoxyethanol for ambient storage testing
0
0.1
0.2
0.3
0.4
0 1 2 3 4 5 6 7 8 9 10 11RQLDLOP
Mass (µg) per Sample
Area
Cou
nts
(µV•
s)
0
0.5
1.0
1.5
0 2000 4000 6000
Mass (µg) per Sample
Area
Rat
io
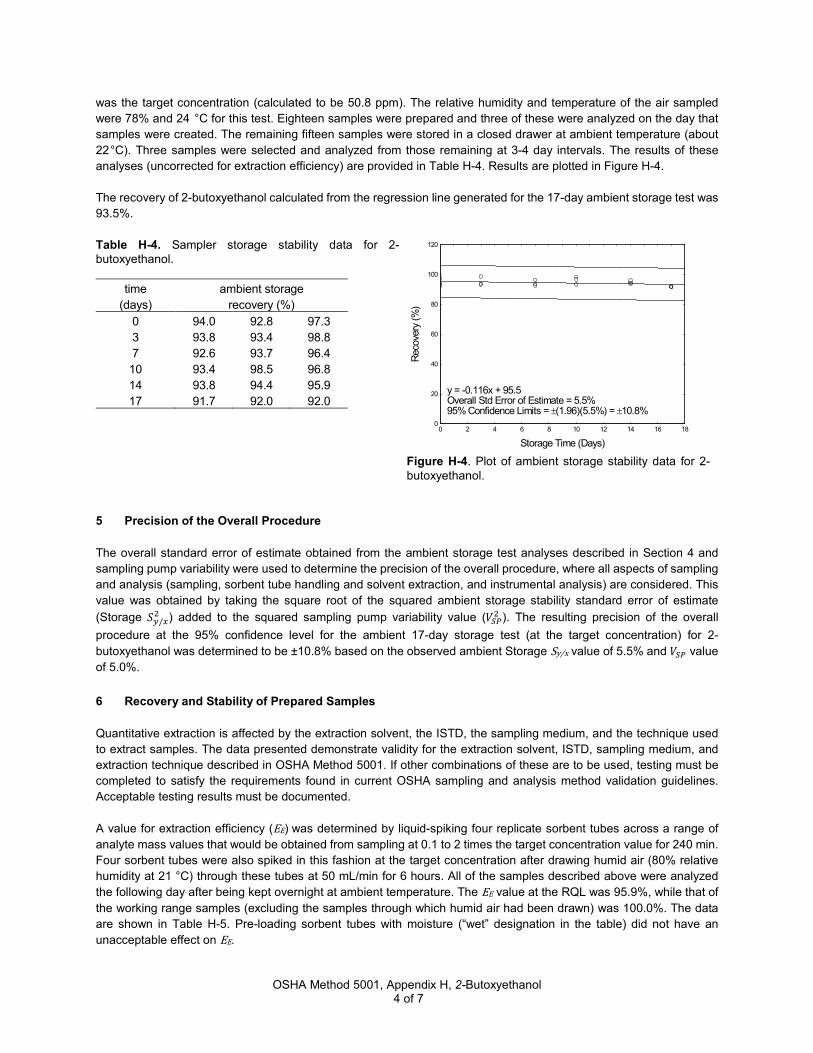
OSHA Method 5001, Appendix H, 2-Butoxyethanol 4 of 7
was the target concentration (calculated to be 50.8 ppm). The relative humidity and temperature of the air sampled were 78% and 24 °C for this test. Eighteen samples were prepared and three of these were analyzed on the day that samples were created. The remaining fifteen samples were stored in a closed drawer at ambient temperature (about 22°C). Three samples were selected and analyzed from those remaining at 3-4 day intervals. The results of these analyses (uncorrected for extraction efficiency) are provided in Table H-4. Results are plotted in Figure H-4. The recovery of 2-butoxyethanol calculated from the regression line generated for the 17-day ambient storage test was 93.5%. Table H-4. Sampler storage stability data for 2-butoxyethanol.
time (days)
ambient storage recovery (%)
0 94.0 92.8 97.3 3 93.8 93.4 98.8 7 92.6 93.7 96.4
10 93.4 98.5 96.8 14 93.8 94.4 95.9 17 91.7 92.0 92.0
Figure H-4. Plot of ambient storage stability data for 2-butoxyethanol.
5 Precision of the Overall Procedure
The overall standard error of estimate obtained from the ambient storage test analyses described in Section 4 and sampling pump variability were used to determine the precision of the overall procedure, where all aspects of sampling and analysis (sampling, sorbent tube handling and solvent extraction, and instrumental analysis) are considered. This value was obtained by taking the square root of the squared ambient storage stability standard error of estimate (Storage 𝑆𝑆𝑦𝑦/𝑥𝑥
2 ) added to the squared sampling pump variability value (𝑉𝑉𝑆𝑆𝑆𝑆2 ). The resulting precision of the overall procedure at the 95% confidence level for the ambient 17-day storage test (at the target concentration) for 2-butoxyethanol was determined to be ±10.8% based on the observed ambient Storage Sy/x value of 5.5% and 𝑉𝑉𝑆𝑆𝑆𝑆 value of 5.0%.
6 Recovery and Stability of Prepared Samples
Quantitative extraction is affected by the extraction solvent, the ISTD, the sampling medium, and the technique used to extract samples. The data presented demonstrate validity for the extraction solvent, ISTD, sampling medium, and extraction technique described in OSHA Method 5001. If other combinations of these are to be used, testing must be completed to satisfy the requirements found in current OSHA sampling and analysis method validation guidelines. Acceptable testing results must be documented. A value for extraction efficiency (EE) was determined by liquid-spiking four replicate sorbent tubes across a range of analyte mass values that would be obtained from sampling at 0.1 to 2 times the target concentration value for 240 min. Four sorbent tubes were also spiked in this fashion at the target concentration after drawing humid air (80% relative humidity at 21 °C) through these tubes at 50 mL/min for 6 hours. All of the samples described above were analyzed the following day after being kept overnight at ambient temperature. The EE value at the RQL was 95.9%, while that of the working range samples (excluding the samples through which humid air had been drawn) was 100.0%. The data are shown in Table H-5. Pre-loading sorbent tubes with moisture (“wet” designation in the table) did not have an unacceptable effect on EE.
0
20
40
60
80
100
120
0 2 4 6 8 10 12 14 16 18
y = -0.116x + 95.5Overall Std Error of Estimate = 5.5%95% Confidence Limits = ±(1.96)(5.5%) = ±10.8%
Storage Time (Days)
Reco
very
(%)
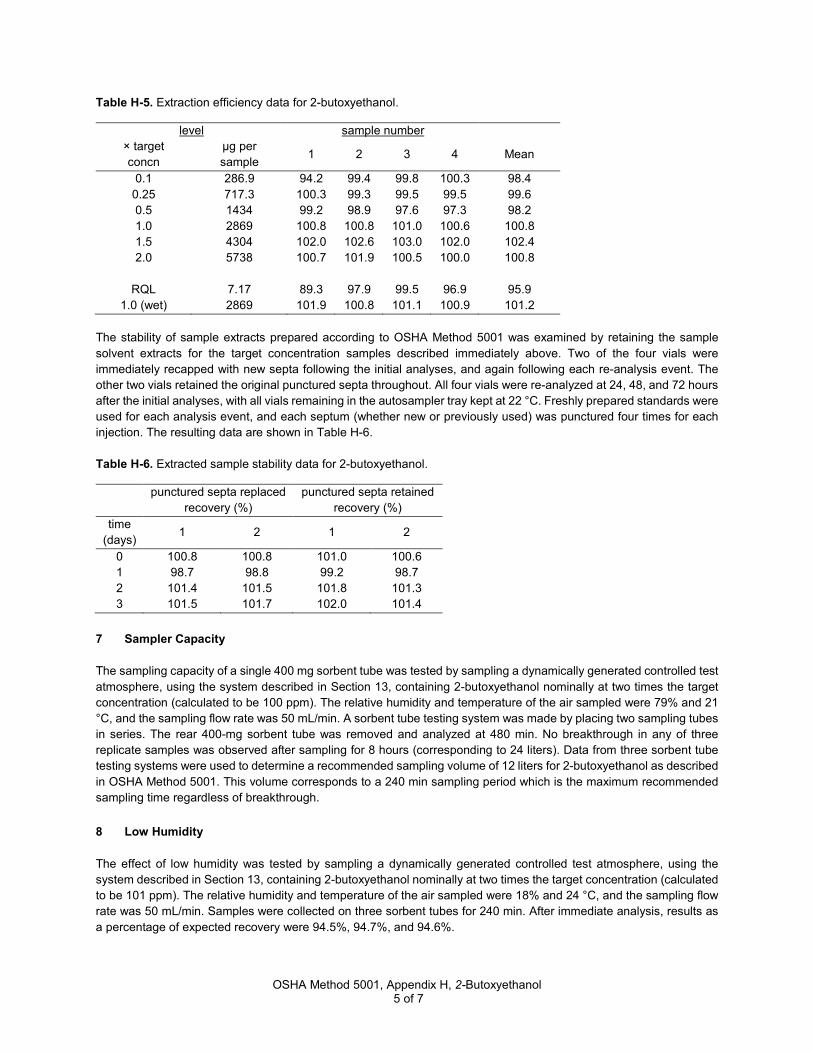
OSHA Method 5001, Appendix H, 2-Butoxyethanol 5 of 7
Table H-5. Extraction efficiency data for 2-butoxyethanol.
level sample number × target concn
µg per sample 1 2 3 4 Mean
0.1 286.9 94.2 99.4 99.8 100.3 98.4 0.25 717.3 100.3 99.3 99.5 99.5 99.6 0.5 1434 99.2 98.9 97.6 97.3 98.2 1.0 2869 100.8 100.8 101.0 100.6 100.8 1.5 4304 102.0 102.6 103.0 102.0 102.4 2.0 5738 100.7 101.9 100.5 100.0 100.8
RQL 7.17 89.3 97.9 99.5 96.9 95.9
1.0 (wet) 2869 101.9 100.8 101.1 100.9 101.2 The stability of sample extracts prepared according to OSHA Method 5001 was examined by retaining the sample solvent extracts for the target concentration samples described immediately above. Two of the four vials were immediately recapped with new septa following the initial analyses, and again following each re-analysis event. The other two vials retained the original punctured septa throughout. All four vials were re-analyzed at 24, 48, and 72 hours after the initial analyses, with all vials remaining in the autosampler tray kept at 22 °C. Freshly prepared standards were used for each analysis event, and each septum (whether new or previously used) was punctured four times for each injection. The resulting data are shown in Table H-6. Table H-6. Extracted sample stability data for 2-butoxyethanol.
punctured septa replaced recovery (%)
punctured septa retained recovery (%)
time (days) 1 2 1 2
0 100.8 100.8 101.0 100.6 1 98.7 98.8 99.2 98.7 2 101.4 101.5 101.8 101.3 3 101.5 101.7 102.0 101.4
7 Sampler Capacity
The sampling capacity of a single 400 mg sorbent tube was tested by sampling a dynamically generated controlled test atmosphere, using the system described in Section 13, containing 2-butoxyethanol nominally at two times the target concentration (calculated to be 100 ppm). The relative humidity and temperature of the air sampled were 79% and 21 °C, and the sampling flow rate was 50 mL/min. A sorbent tube testing system was made by placing two sampling tubes in series. The rear 400-mg sorbent tube was removed and analyzed at 480 min. No breakthrough in any of three replicate samples was observed after sampling for 8 hours (corresponding to 24 liters). Data from three sorbent tube testing systems were used to determine a recommended sampling volume of 12 liters for 2-butoxyethanol as described in OSHA Method 5001. This volume corresponds to a 240 min sampling period which is the maximum recommended sampling time regardless of breakthrough.
8 Low Humidity
The effect of low humidity was tested by sampling a dynamically generated controlled test atmosphere, using the system described in Section 13, containing 2-butoxyethanol nominally at two times the target concentration (calculated to be 101 ppm). The relative humidity and temperature of the air sampled were 18% and 24 °C, and the sampling flow rate was 50 mL/min. Samples were collected on three sorbent tubes for 240 min. After immediate analysis, results as a percentage of expected recovery were 94.5%, 94.7%, and 94.6%.
OSHA Method 5001, Appendix H, 2-Butoxyethanol 6 of 7
9 Chemical Interference
The effect of potential chemical sampling interference was tested by sampling a dynamically generated controlled test atmosphere, using the system described in Section 13, containing 2-butoxyethanol nominally at the target concentration (calculated to be 50.6 ppm). The relative humidity and temperature of the air sampled were 74% and 25 °C, and the sampling flow rate was 50 mL/min. Isopropyl alcohol was present as a potential interferent, nominally at its permissible exposure limit (calculated to be 397 ppm). Samples were collected on three sorbent tubes for 240 min. After immediate analysis, results for 2-butoxyethanol as a percentage of expected recovery were 92.0%, 93.0%, and 94.6%.
10 Analytical Method Reproducibility
Samples were prepared by sampling a dynamically generated controlled test atmosphere, using the system described in Section 13, containing 2-butoxyethanol nominally at the target concentration (calculated to be 49.5 ppm). The relative humidity and temperature of the air sampled were 79% and 24 °C, and the sampling flow rate was 50 mL/min. Samples were collected on six sorbent tubes for 240 min. The resulting samples were submitted to the OSHA Salt Lake Technical Center for analysis using the procedures described in OSHA Method 5001 after storage for 7 days at 4 °C. The analytical results corrected for EE are provided in Table H-7. No sample result for 2-butoxyethanol fell outside the permissible bounds set by the precision of the overall procedure determined in Section 5 of this appendix. Table H-7. Reproducibility data for 2-butoxyethanol.
sampled (µg/sample)
recovered (µg/sample)
recovery (%)
deviation (%)
2844 2837 2910 2818 2973 2860
2508 2691 2783 2773 3110 2877
88.2 94.9 95.6 98.4
104.6 100.6
-11.8 -5.1 -4.4 -1.6 +4.6 +0.6
11 Effect of Sampling a Low Concentration
The effect of sampling a low concentration of 2-butoxyethanol vapor was tested by sampling a dynamically generated controlled test atmosphere, using the system described in Section 13, containing 2-butoxyethanol nominally at one-tenth the target concentration (calculated to be 4.97 ppm). The relative humidity and temperature of the air sampled were 77% and 21 °C, and the sampling flow rate was 50 mL/min. Samples were collected on three sorbent tubes for 240 min. After immediate analysis, results for 2-butoxyethanol as a percentage of expected recovery were 98.7%, 104.1%, and 103.9%.
12 Estimation of Uncertainty
While systematic biases such as analyte storage loss are examined, and limits are placed on these, an estimation of uncertainty that encompasses both potential random and systematic error was not completed. Instead, the overall standard error of estimate was calculated from the random error inherent to the points about the regression line produced by the ambient storage test described in Section 5, as prescribed by the OSHA validation guidelines in use at the time OSHA Method 5001 was originally validated. See Section 5 of this appendix for details.
13 Controlled Test Atmosphere Procedure
Dynamically generated controlled test atmospheres were created in a walk-in hood. House air was regulated using a Miller Nelson Model 401 flow-temperature-humidity control system. A measured flow of liquid 2-butoxyethanol was introduced with a KD Scientific Legato 100 syringe pump through a short length of 0.53 mm internal diameter uncoated fused silica capillary into a heated zone near the air flow entrance of the test atmosphere generator, where it was

OSHA Method 5001, Appendix H, 2-Butoxyethanol 7 of 7
evaporated into a measured flow of dilution air from the flow-temperature-humidity control system. The resulting 2-butoxyethanol vapor and dilution air flowed into a mixing chamber (30 cm length x 10 cm diameter), and then into a sampling chamber (68 cm length x 10 cm diameter). Sampling was completed from sampling ports present on the sampling chamber. Temperature and humidity measurements were obtained near the exit of the sampling chamber using a Vaisala HUMICAP Model HM70 hand-held humidity and temperature meter.