albr3 impact on the thermal degradation of p(s-co-mma): a study performed by contemporary techniques
TRANSCRIPT
ORIGINAL PAPER
AlBr3 impact on the thermal degradation of P(S-co-MMA):a study performed by contemporary techniques
Muhammad Arshad • Khalid Masud •
Aamer Saeed
Received: 17 August 2011 / Accepted: 26 December 2011 / Published online: 22 February 2012
� Iran Polymer and Petrochemical Institute 2012
Abstract Pyrolysis of copolymer, [P(S-co-MMA)], in the
presence of AlBr3 was inspected in an inert atmosphere.
Five different proportions (copolymer/additive) were cho-
sen. Films were cast from common solvent. It was noticed
that copolymer showed more stability on the basis of T0,
however, regions of stability were also observed for the
blends. Copolymer showed T0 at 260 �C, whereas blends
started degrading around 70 �C. Tmax was the same for the
copolymer and the blends. Low-temperature decomposi-
tions of blends were attributed to the generation of free
radicals (Br•) and the zones of stabilizations were assigned
to the formation of a ‘‘complex type’’ structure between Al
and the carbonyl oxygens of MMA units. Degradation
products were collected and identified employing Py-GC–
MS technique. Intermediates (solid) at different tempera-
tures (300, 350 and 400 �C) were examined through FTIR
spectroscopy. In the light of gathered data, a degradation
mechanism was proposed. New products were encoun-
tered, viz., bromobenzene, ‘brominated’ anhydride ring,
etc., which established the chemical interactions between
the constituents of the blends, i.e., copolymer and additive.
Anhydride rings were absent when poly (methyl methac-
rylate) was pyrolyzed in the presence of AlBr3. Oligomers
of styrene were not found hinting at the involvement of
additive in ‘‘targeting’’ the degrading styrene units. The
blends indicate 2–7% residue of original mass; the additive
exhibits 9% while the copolymer does not leave residue at
the completion of the TG run. The presence of char in the
residues of blends suggests that the additive imparts sta-
bility to the copolymer. Horizontal burning rate was lowest
(6 times less than that of neat copolymer) for [P(S-co-
MMA):AlBr3, 87.5:12.5%], thereby revealing the effi-
ciency of the additive as thermal stabilizer. The highest
activation energy was calculated for the copolymer
(169.46 kJ/mol) and the range of this parameter for the
blends was found from 52.72 to 27.14 kJ/mol.
Keywords P(S-co-MMA) copolymer � AlBr3 �TG–DTG–DTA sifting � IR analysis � GC–MS scrutiny �Activation energy
Introduction
Polymers/copolymers are the backbone of modern indus-
tries. These find use in almost every conceivable field.
Their cost-effectiveness and desirable properties make
them indispensable stuff for present day requirements for
assorted applications. However, flammability and toxicity
of products arising from flammability have attracted the
attention of a large number of researchers [1–5] to render
the use of these important materials safe.
Many compounds, organic as well as inorganic [6–9],
have been tried, either at the molecular level or as mixtures
to enhance the stability and to change the mode of degra-
dation of polymers/copolymers during fire (high tempera-
tures). Polymer mixtures have also been studied [1, 10].
One of the studies [10] maintains that the mixture [poly(-
methyl methacrylate) (PMMA) and polystyrene (PS) in the
M. Arshad (&)
Chemistry Division, Directorate of Science, PINSTECH, Nilore,
Islamabad, Pakistan
e-mail: [email protected]
K. Masud
New Labs PINSTECH, Nilore, Islamabad, Pakistan
A. Saeed
Department of Chemistry, Quaid-i-Azam University,
Islamabad, Pakistan
Iran Polymer andPetrochemical Institute
123
Iran Polym J (2012) 21:143–155
DOI 10.1007/s13726-012-0017-2
form of thin film] may not exhibit any detectable interac-
tion between the polymers, while the presence of styrene
exerts disproportionate stabilizing effect on the methyl
methacrylate polymer chain keeping in view the behavior
of the copolymer as being between that of the individual
homopolymers. The introduction of different functional
groups in polymers is another mode, which proved valu-
able [11]. It revealed through limiting oxygen indices that
phosphorated polymers have potential fire retardant prop-
erties. The search for other avenues in this direction has
been flourishing for many years.
Our interest on this aspect has produced several publica-
tions ranging from thermal degradation of polymers and
copolymer, to the pyrolysis of mixtures of polymers/
copolymers with organometallic substances and blends
(molecular-level mixing film cast from common solvent) of
polymer with purely inorganic salt. The blending of phenyl
methacrylate/styrene (PMA/ST) with aluminum isopropox-
ide [12] imparted stabilization (up to 50 �C) to the system as
the pyrolysis progressed. For copolymers, it was noticed that
even the presence of 10 mol% of styrene in the system, PMA/
ST pushed the T0 (temperature corresponding to the start of
degradation) to 285 �C when compared with the T0 of PPMA,
which was recorded as 190 �C [13]. The destabilizing effect
of 10 mol% methyl methacrylate (MMA) in allyl methac-
rylate/methyl methacrylate (AMA/MMA) is apparent as T0
goes down from 210 �C [poly(allyl methacrylate) (PAMA)]
to 200 �C for the copolymer [14]. AMA/MMA (blended with
aluminum ethoxide-physical mixing of powder) started to
degrade at lower temperature than either of the monomers;
however, stabilization was also observed in different zones of
degradation [15]. Additive appeared stabilized in the initial
stage of thermal decomposition. A similar thermal behavior
was noted when the PMA/ST system was heated in the
presence of aluminum ethoxide [16]. The stabilization went
up to 60 �C at different points during pyrolysis. When the
copolymers, i.e., AMA/MMA, was mixed with aluminum
isopropoxide [17], stabilization up to 45 �C was noticeable at
different stages of thermogravimetric analysis after initial
destabilization. New products were encountered and chemi-
cal interaction was proposed. When PMMA was blended
with AlBr3, PBr3 and SnCl4 [19–21]—films were cast from
common solvent—interesting results were obtained. PBr3
and SnCl4 showed stabilization in the presence of the poly-
mer, whereas AlBr3 seemed destabilized. In all these cases,
halogen-free radicals were generated in the early part of
thermal degradation, which initiated the decomposition of the
polymer. Their interaction produced those compounds which
were absent when PMMA was degraded alone. Both parts of
the additive, viz., metallic and non-metallic such as Al and Br,
played important roles in imparting stability to the system.
The present communication pertains to the thermal
degradative examination of copolymer [P(S-co-MMA)]
mixed with AlBr3 (in selected proportions) as a continua-
tion of our previous studies. This system has not been
studied so far by any worker. The aim was to check the
nature of disintegration products comprehensively, i.e., at
different temperatures and to propose a mechanism based
on these evaluations. TG–DTG–DTA, FTIR and Py-GC–
MS were employed to ascertain the interactions exhibited
by the constituents of the current system. Activation
energies and order of reaction (overall) were calculated
using Horowitz–Metzger method [22].
Experimental
Reagents
All reagents and solvents obtained from standard source
suppliers (E. Merck) were of analytical grade. The mono-
mer, methyl methacrylate, was processed for copolymeri-
zation as reported earlier [23]. Styrene (Aldrich) was
treated as had already been described [24]. 2,20-Azobisi-
sobutyronitrile (AIBN) was selected as free radical initiator
and purified by the known procedure [25]. All solvents
were distilled before use.
Preparation of poly (styrene-co-methyl methacrylate)
Styrene (Aldrich) and methyl methacrylate (E. Merck) were
purified by the standard methods. The compositions of
monomer mixtures necessary to produce copolymers of
given proportions were calculated from copolymer com-
position equation using literature values of the reactivity
ratios for this polymer pair (r1 = 0.52, r2 = 0.46;
M1 = styrene, M2 = methyl methacrylate) [26–29]. After
addition of initiator, 2,20-azobisisobutyronitrile, the appro-
priate amounts of the two monomers were distilled into
dilatometer under vacuum with mild warming. After dis-
tilling and freezing the contents of the dilatometer to liquid
nitrogen temperature, the dilatometer was sealed under high
vacuum. Upon sealing, polymerization was carried out in a
water bath at 60 �C to a maximum conversion of 5% (2 h).
The copolymer was precipitated and reprecipitated from
chloroform solution by methanol and dried under vacuum at
room temperature for several days and kept in a desiccator.
The molecular weight was found to be 120,000.
Formulation of blend for analysis and preparation
of strip for flammability test
The same steps were followed for the preparation of blends
with varying compositions of P(S-co-MMA) and AlBr3 as
were employed for PMMA–AlBr3 blendings [19]. Pyrex
glassware was employed for dissolving copolymer,
144 Iran Polym J (2012) 21:143–155
Iran Polymer andPetrochemical Institute
123
additive and copolymer/additive blends. The additive was
handled with extreme care. The mode outlined for the
preparation of PMMA–AlBr3 strips for flammability test
was maintained for the present system.
Physiochemical methods
Thermoanalytical (TG–DTA–DTG) curves were obtained
using Netzsch Simultaneous Thermal Analyzer STA 429.
All the measurements were carried out with samples hav-
ing 30–60 mg initial mass. These were heated over the
temperature range from ambient to 800 �C in an inert
atmosphere (nitrogen), using kaolin as reference material.
The heating rate was 10 �C.min-1. Activation energy (Eo)
and order of reaction (n) of copolymer and its blends were
computed by a known method [22]. A plot of ln Wo/Wt
(where Wo = initial mass of material and Wt = mass of
material at temperature T) against h (h = T–Ts) resulted in
a straight line. The activation energy was determined from
its slope, which was equal to Eo/RTs2 (where R = gas
constant and Ts = temperature (from DTG peak) at which
maximum mass loss occurs). The order of reaction was
calculated by using the relation between reaction order and
concentration at maximum slope.
Infrared (IR) spectra of copolymer, additive and those of
residues, produced after heating the blends at various
temperatures, were recorded with Nicolet 6700 FTIR
spectrometer in the range of 4,000–400 cm-1 by directly
placing a little quantity on the slit.
The liquid chromatograph, Hitachi 655-A-11 with GPC
software and integrator (D-2200 GPC) along with column
GLA-100 m (Gelko), was employed for molecular weight
determination of copolymer at room temperature. The
detector system consisted of Hitachi 655-A UV variable
wavelength monitor (254 nm) and SE-51 (Shodex)
refractive index detector. Polystyrene standards were used
for calibration curves and HPLC grade tetrahydrofuran
(Aldrich) was used as solvent.
The samples were subjected to an Agilent 6890N type
GC–MS coupled with 5,973 inert MSD, by Agilent Ana-
lytical Instruments, Agilent Technologies, USA. Analysis
of the products in acetone was performed with a DB-5MS
column. The injection volume was 1 lL. The temperature
program entailed an initial increase of temperature from
120 to 150 �C at 10 �C.min-1 and from 150 to 280 �C at
15 �C.min-1. The mass spectrometer was operated in the
electron-impact (EI) mode at 70 eV. The horizontal burn-
ing test (HBT) of copolymer and its blends was conducted
in accordance with the ASTM standards [30, 31]. The
blends’ compositions given in Table 1 were prepared by
mixing the copolymer with additive in an aluminum mold
with the specified dimensions. The specimen was held
Table 1 Comparative thermoanalytical results for copolymer (D) and its blends, D1–D5
Blends’ composition (%)
P(S-co-MMA)–AlBr3
Temperature
range (oC)
Stage Mass
loss
(%)
TG (oC) DTA (oC)
T0 T25 T50 Tmax I II Thermal effect
100–00 (D) 260–440 I 100 260 380 396 440a 355 406 356 (Endo), 418 (Exo)
97.5–2.5 (D1) 70–170 I 4 70 370 390 440 150 394 141 (Endo), 240 (Exo), 287 (Exo), 329
(Endo), 401 (Exo)170–440 II 94
[440 Resi. 2
95–5 (D2) 70–170 I 5 70 380 394 440 170 394 139 (Endo), 231 (Endo), 280 (Exo), 317
(Endo), 409 (Exo)290–440 II 92
[440 Resi. 3
92.5–7.5 (D3) 70–190 I 5 70 375 390 440 170 396 125 (Exo), 165 (Endo), 207 (Exo), 236
(Endo), 280 (Exo), 310 (Exo), 396 (Exo)250–440 II 90
[440 Resi. 5
90–10 (D4) 70–190 I 8 70 380 395 440 170 408 123 (Endo), 165 (Endo), 210 (Exo), 238
(Endo), 280 (Exo), 320 (Exo), 408 (Exo)240–440 II 87
[440 Resi. 5
87.5–12.5 (D5) 70–180 I 8 70 375 394 440 170 396 125 (Endo), 165 (Endo), 209 (Exo), 236
(Endo), 285 (Exo), 320 (Exo), 400 (Exo)220–440 II 85
[440 Resi. 7
00–100 70–223 I 82 70 174 200 800 215 – 95 (Exo), 375 (Endo), 588 (Endo)
223–800 II 9
[800 Resi. 9
Max maximum mass loss, Endo endothermic, Exo exothermic, Resi residuea = 100% mass loss
Iran Polym J (2012) 21:143–155 145
Iran Polymer andPetrochemical Institute
123
horizontally and a flame fueled by natural gas was supplied
to light its one end. The time for the flame to reach from
the first reference mark (25 mm from the end) to the sec-
ond reference mark at 100 mm from the end was measured.
Results and discussion
TG–DTG–DTA investigations
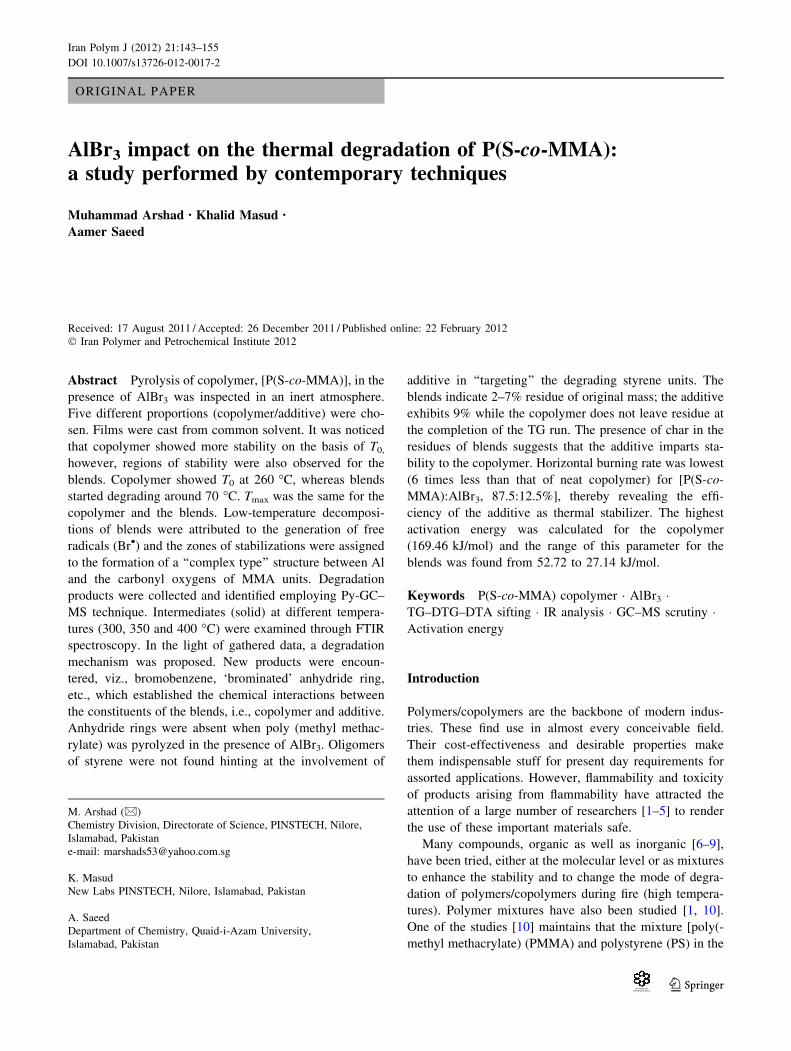
The thermal decomposition of neat copolymer (D) (Fig. 1,
curve I) in nitrogen atmosphere shows a single-step mass
loss starting to degrade around 260 �C and ceasing to
disintegrate at 440 �C (Table 1). Two DTG depressions at
355 and 406 �C (Fig. 2, curve I) and two DTA peaks at 356
and 418 �C (Fig. 3, curve I) corresponding to the single-
step TG curve are noticeable. The copolymer furnishes
mostly monomers styrene and methyl methacrylate, which
is in agreement with the findings of other contributors [32–
36]. There is no residue at the termination of single stage
thermal decomposition process.
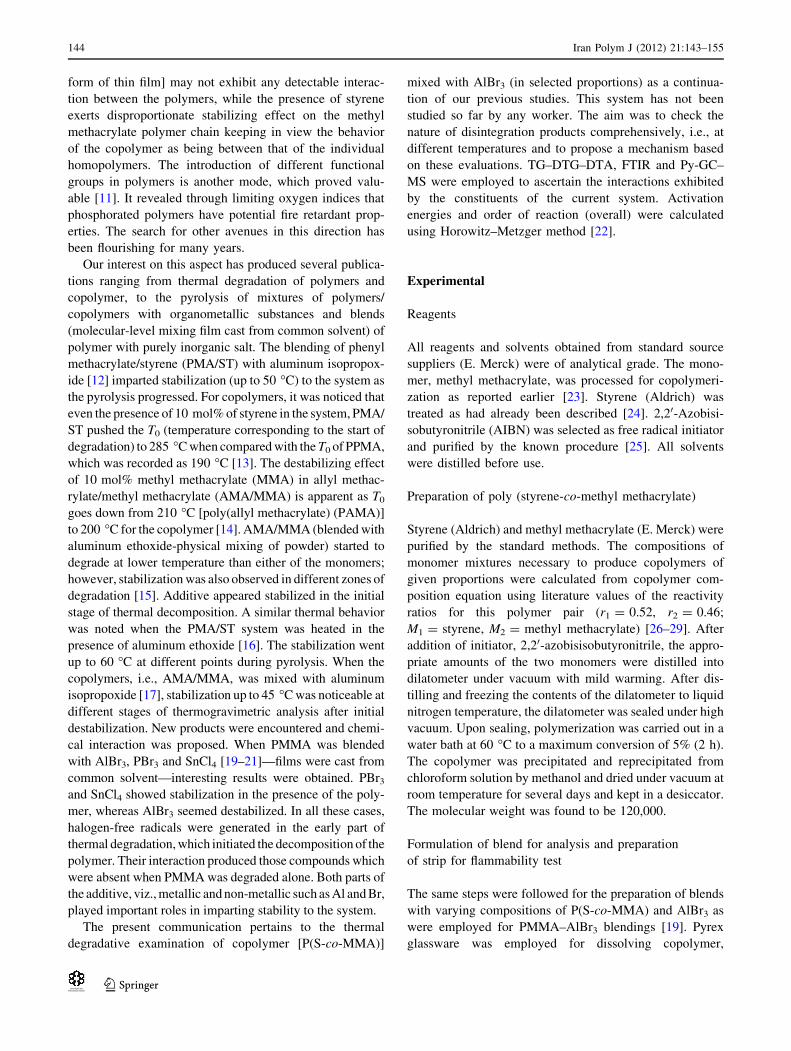
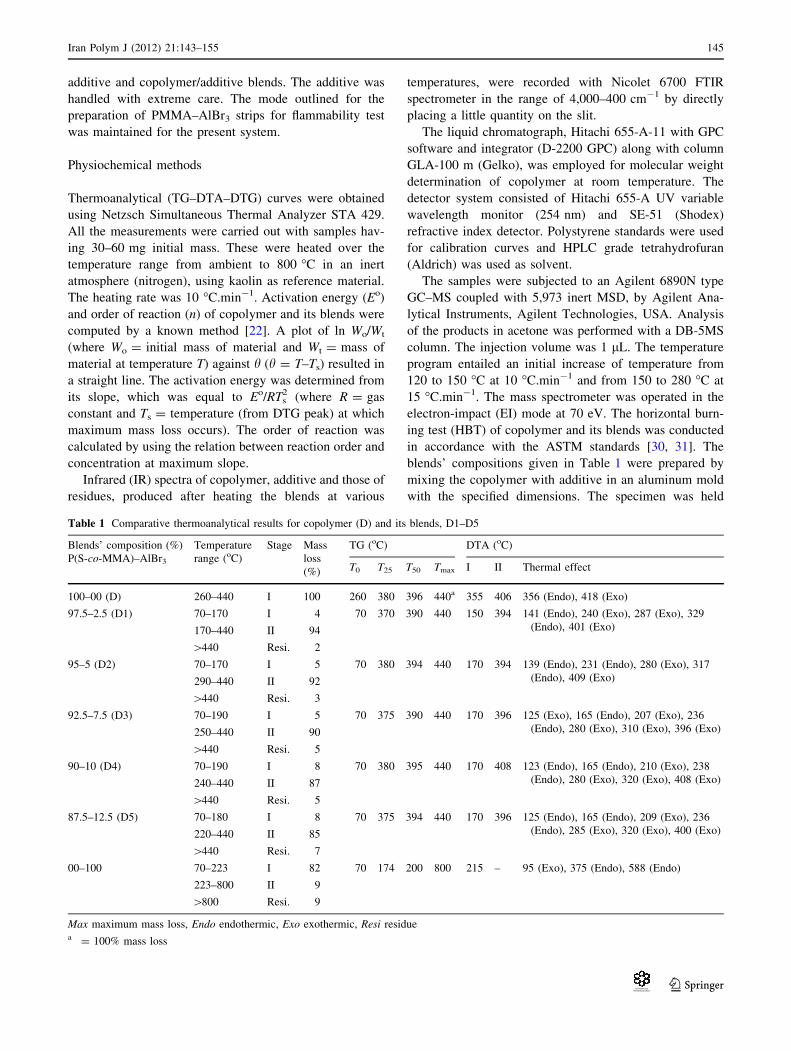
The thermal curves of blends, D1–D5, are presented in
Figs. 1, 2 and 3 and thermoanalytical data are entered in
Table 1. The blend (D1) begins to degrade around 70 �C
and the first stage comes to an end at 170 �C (Fig. 1, curve
II). A 4% mass loss is observed. One DTG peak at 150 �C
(Fig. 2, curve II) and one DTA peak at 141 �C (Fig. 3,
curve II) are noted for the first stage. The products evolved
at this stage clearly indicate the interaction between the
two components of the system (FTIR and GC–MS results).
The neat copolymer (D) exhibits T0 (temperature corre-
sponding to detection of first mass loss) at 260 �C, whereas
the additive starts degrading around 70 �C when heated
alone in nitrogen atmosphere. This is another clue for
interaction. At the end of the first stage (170 �C), the
intermediate is not stable and starts degrading. The second
stage which terminates at 440 �C accounts for 94% mass
loss. Two per cent residue is noticeable at the completion
of the degradation process. One DTG peak at 394 �C and
four DTA peaks at 240, 287, 329 and 401 �C are indicated
for the final (second) stage. The sharp fall in TG traces for
the second stage manifests the rupture of all types of bonds
as the rising energy content cannot be resisted.
Fig. 1 TG curves (dynamic nitrogen, heating rate: 10 �C/min) for
P(S-co-MMA)–AlBr3 blends: D(I), D1(II), D2(III), D3(IV),
D4(V) and D5(VI)
Fig. 2 DTG Curves (dynamic nitrogen, heating rate: 10 �C/min) for
P(S-co-MMA)–AlBr3 blends: D(I), D1(II), D2(III), D3(IV),
D4(V) and D5(VI)
Fig. 3 DTA curves (dynamic nitrogen, heating rate: 10 �C/min) for
P(S-co-MMA)–AlBr3 blends: D(I), D1(II), D2(III), D3(IV),
D4(V) and D5(VI)
146 Iran Polym J (2012) 21:143–155
Iran Polymer andPetrochemical Institute
123
The second blend of this series, D2, starts losing mass
around 70 �C and, by the end of the first stage (170 �C),
accounts for 5% mass loss (Fig. 1, curve III). It can be
observed that by increasing the concentration of additive
(AlBr3), the T0 remains unchanged (moving from D1 to
D2); however, the percent mass loss registers an increase.
The same type of interaction is believed to have occurred
for this blend as observed for D1. The intermediate formed
at the completion of the first stage is very stable and
withstands an additional temperature of 120 �C (after
170 �C) before initiation of the next stage. The last stage
(290–440 �C) shows a mass loss of 92%. From 290 to
360 �C, the mass loss is only 7% which is regarded as
resistance offered by the bonds/interactions developed in
the earlier part of the degradation between the components
of the system. For the first stage, one DTG peak (170 �C)
and three DTA peaks (139, 231 and 280 �C) appear (Fig. 2,
curve III and Fig. 3, curve III, respectively). For the second
step, one DTG and two DTA peaks are noticed at 394, 317
and 409 �C, respectively. Three per cent residue is found at
the termination of the degradation process.
The blend, D3, begins to degrade around 70 �C and
loses 5% of original mass for the first stage which termi-
nates at 190 �C. The intermediate formed at this stage is
stable in the temperature range, 190–250 �C, after which
the pyrolysis again starts and the second step shows a mass
loss of 90% with 5% residue at the completion of the
decomposition process (440 �C) (Fig. 1, curve IV). The
range of temperature for stable intermediate (190–250 �C),
in this case, exhibits a reduction when compared with the
same range for the second member of this series (D2). It
may be due to the less number of bonds/links formed
between the constituents of the system despite the presence
of relatively higher concentration of additive. From 250 to
360 �C, only 9% mass loss is observed, which requires
heating to 110 �C. This is clearly indicative of the strength
of bonds developed during the early part of pyrolysis and
retained by the intermediate. One DTG (Fig. 2, curve IV)
and four DTA peaks (Fig. 3, curve IV) emerge for the first
stage (170, 125, 165, 207 and 236 �C, respectively);
however, for the second stage, one DTG and three DTA
peaks at 396, 280, 310 and 396 �C, respectively, arise.
The blend (D4) experiences a mass loss of 8% for the
first stage (Fig. 1, curve V). It starts decomposing around
70 �C and stops losing mass around 190 �C. One DTG
(Fig. 2, curve V) and four DTA peaks (Fig. 3, curve V) are
found at 170, 123, 165, 210 and 238 �C, respectively. The
intermediate resists 50 �C extra heating (190–240 �C)
before the inception of the second stage of degradation.
The second step comes to an end at 440 �C marking a mass
loss of 87%. The first 6% mass loss of the second stage
(240–440 �C) requires 130 �C heating temperature, which
is attributed to the resistance offered by strong bonds/links
produced during the early part of the pyrolysis. One DTG
and three DTA peaks are observed at 408, 280, 320 and
408 �C, respectively. TG analysis shows that the residue is
5% of the original mass of the blend after 440 �C.
The blend, D5, commences its mass loss around 70 �C
for the first stage which comes to an end at 180 �C (Fig. 1,
curve VI). One DTG and two DTA peaks appear for this
step at 170, 125 and 165 �C, respectively (Fig. 2, curve VI
and Fig. 3, curve VI); 8% mass loss is evident from TG
traces. The intermediate that is stable up to 220 �C (stable
in the temperature range, 180–220 �C) starts decomposing
subsequently as the energy content increases. The second
stage terminates at 440 �C. One DTG and five DTA peaks
are found at 396, 209, 236, 285, 320 and 400 �C, respec-
tively. The first 8% mass loss for the second step (out of
85%) requires heating temperature of 140 �C (from 220 to
360 �C), whereas the remaining larger portion (77%)
leaves the crucible on heating to 80 �C (360–440 �C). This
is attributed to the strength of the bonds present in the
intermediate. The residue formed after the completion of
the decomposition process is 7% of the blend’s original
mass.
The interaction is clear between the components of the
system throughout the series, i.e., D1–D5. The nature of
interaction is same for all members. The percentage of
degradation for the first stage is higher than the total per-
centage of additive in the blends D1–D4. The molecular-
level mixing of the constituents allows complete homoge-
nization which, in turn, gives way to early degradation of
both parts. The evolution of new products in the early part
of pyrolysis (Py-GC–MS studies) confirms the chemical
interaction and mutual influence of the ingredients on each
other’s decomposition.
Effect of blends’ composition on thermal degradation
Figure 4 gives the plots of T0, T25, T50 and Tmax of
copolymer and its blends. Considering T0, a very clear
trend of destabilization is seen. As the percentage of
additive in the blends is increased, no stabilization is noted
and almost similar trend of destabilization is observed,
which may be attributed to the decomposition of the
additive [generation of free radicals (Br•)]. However, for
T25 (temperature at which 25% mass loss results), the trend
of destabilization is almost the same when mass percentage
of additive changes from 2.5 to 12.5. This seems to be due
to the production of free radicals (Br•) by the degradation
of the additive, which causes accelerated degradation of the
copolymer. At T50 (temperature corresponding to 50%
mass loss), a very inappreciable stabilization is observed as
energy content is too great to be resisted by the different
types of interactions or bonds between additive and
copolymer irrespective of the mass percentage of additive.
Iran Polym J (2012) 21:143–155 147
Iran Polymer andPetrochemical Institute
123

Tmax (the temperature at which maximum mass loss occurs)
is same for copolymer and blends, which is attributed to the
production of those bonds which are liable to break at this
temperature and are not alike for the two systems (FTIR
and Py-GC–MS studies). This plot, however, does not
furnish the information as to how much residue is left at the
end of the disintegration process.
Infrared spectroscopy
The IR spectrum of the copolymer (Fig. 5, curve I) gives
typical stretching of MMA ester groups around 1,725 cm-1.
The slight displacement is assigned to the presence of styrene
units. C–H stretchings are noticeable for saturated and aro-
matic segments around 3,000–2,940 cm-1 and 3,040–
3,010 cm-1, respectively. Characteristic overtones are
observed in the region 2,000–1,660 cm-1. For aromatic un-
saturation (C = C), bands are observed at 1,606, 1,495 and
1,460 cm-1. No peaks are found around 1,640–1,630 cm-1
which means that polymerization is complete [37–40].
The IR of AlBr3 has already been discussed [18].
Briefly, moisture was found and a broad band to this effect
was noticed in the region 3,600–3,000 cm-1. The peaks at
1,603, 1,089, 676, 580 and 478 cm-1 were linked with Al–
Br bond (Fig. 5, curve II).
The blend (Fig. 5, curve III) shows a broad band around
3,600–3,200 cm-1, which may be attributed to water. This
also points toward the presence of some ‘free’ AlBr3. It
may be interesting to note that when blended with pure
PMMA, the homogenization of AlBr3 (‘‘complex forma-
tion’’) and polymer occurs in such a way that absorbance of
moisture by this additive virtually becomes impossible
[18]. This is an indication of less number of ester linkages
present per unit volume of the copolymer and per unit
chain length, and hence more chances of AlBr3 to remain
‘free’. The C–H stretching, both aliphatic and aromatic, are
found in the region as have already been described for the
IR spectrum of pure copolymer. The C = O stretching has
shifted to lower frequency, i.e., 1,716 cm-1, thereby
showing a sort of ‘‘co-ordination’’ between the metal (Al)
of additive and carbonyl group (it is not like the real co-
ordination observed for transition elements). Al–Br bonds
also exhibit some shifting as these appear now at 699, 550
and 470 cm-1. This may be attributed to the surroundings
of this additive, i.e., styrene and MMA units. It is clear that
all MMA units will not be available for ‘co-ordination’.
The other bands (related to benzene ring) are found at their
normal positions with slight displacements (this seems to
be due to AlBr3, as it also affects the phenyl part of the
styrene units, particularly Br).
IR spectra of blend at different temperatures
The blend was heated at three different temperatures (300,
350 and 400 �C for a minute, cooled to room temperature
and then IR of residues was run to check the changes
occurring during the course of degradation). These tem-
peratures were selected for the regions showing some sta-
bility, middle of the total decomposition process and close
to the completion of pyrolysis of the system, respectively.
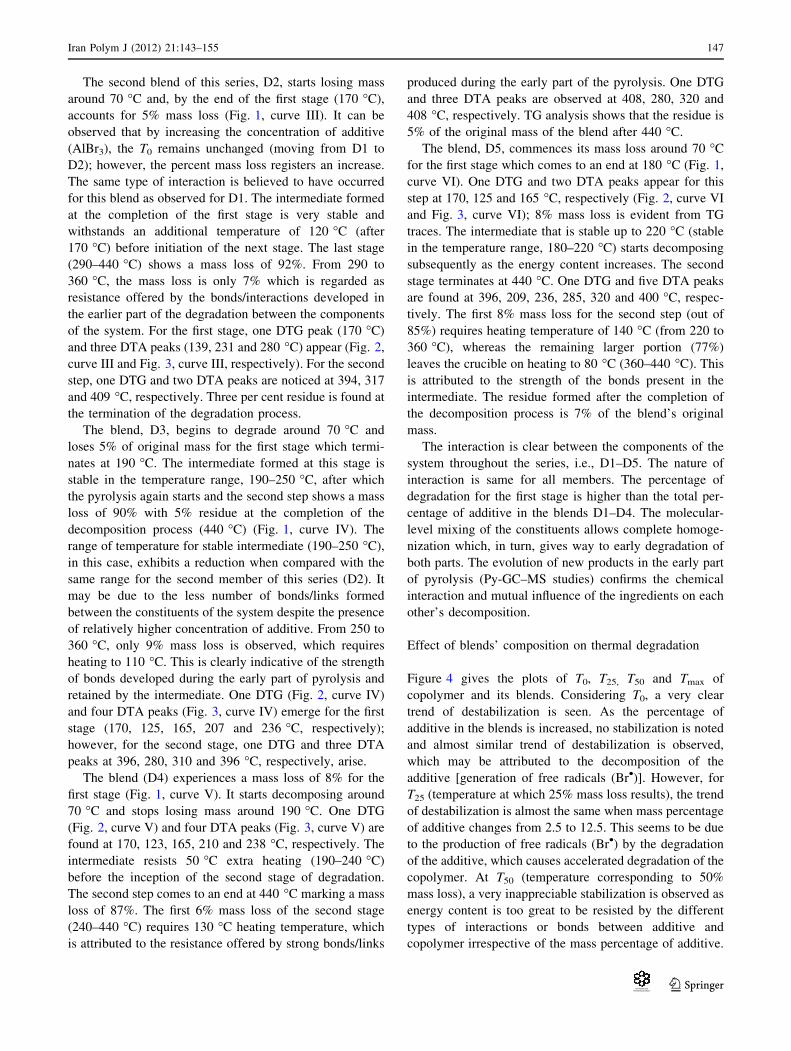
When heated to 300 �C, the IR (Fig. 6, curve I) shows
some developments which are different from the IR of the
undegraded blend (Fig. 5, curve III). Moisture is com-
pletely absent (no peaks in the region 3,600–3,200 cm-1),
which may be attributed to the absence of ‘free’ AlBr3. A
slight displacement for C = O stretching (1,719 cm-1) is
observed and it clearly reveals that ‘coordination’ Al has
developed with the carbonyls of MMA units. Peaks around
680–515 cm-1 indicate the formation of C–Br bonds. A
band at 1,191 cm-1 may be assigned to Al–C bond, though
no such bond could be detected in GC–MS studies. A slight
Fig. 4 Effect of blends’ composition on T0, T25, T50 and Tmax values
of D (copolymer) and D1–D5 blends
Fig. 5 IR Spectra of neat copolymer, D(I), additive, X(II) and blend,
D4(III)
148 Iran Polym J (2012) 21:143–155
Iran Polymer andPetrochemical Institute
123
indication for the presence of anhydride rings (1,800, 1,760
and 1,030 cm-1) can be noticed. As the styrene units form
the overall structure along with MMA, the framework for
the production of anhydride rings may not be an obvious
choice. Some Al–Br bonds still exist as peaks at 698, while
571 and 484 cm-1 appear with diminished intensities. C–H
stretchings are present as such, i.e., 3,040–2,940 (aliphatic
and aromatic).
On heating the blend to 350 �C, the IR (Fig. 6, curve II)
of the residue assumes drastically different appearance
from the IR obtained at 300 �C. The intensities of almost
all stretching bands are reduced showing the evaporation of
many products at this stage. There are no signs (peaks) of
anhydride rings (no bands at 1,800, 1,760 and 1,030 cm-1).
Some peaks around 1,200–900 cm-1 give indication of C–
O–Al bonds along with shifting of peak around 1,715 cm-1
(reduced intensity) and appearance of a new peak at
1,698 cm-1. The number of Al–Br bonds also appears to
have decreased owing to the intensity of relevant peaks
(695, 573 and 479 cm-1) and the participation of Br in the
formation of other compounds. C = C unsaturation (aro-
matic) is, however, present at its normal position.
The IR of the remnant recorded after heating the blend
to 400 �C (Fig. 6, curve III), produces those peaks, which
may be expected close to the completion of degradation
process as bonds are breaking quickly and the products are
leaving the scene. Only those compounds which can resist
such a high temperature are found at this stage. A few
peaks for C–H vibrations (much reduced in size) are
observable at 3,000–2,940 cm-1. Some undegraded por-
tion of copolymer with limited chain lengths gives indi-
cations at 1,465, 1,380 and 720 cm-1. The peaks for the
‘co-ordination’ have decreased in size, which is clear evi-
dence of the change this arrangement undergoes. This is
attributed to the fact that a number of MMA units have
been consumed for the formation of different products. The
remaining units (carbonyl oxygens) are in the process of
forming true bonds with Al. Peaks at 1,080, 1,100 and
1,142 cm-1 may be taken as a clue to the presence of
preceding structure.
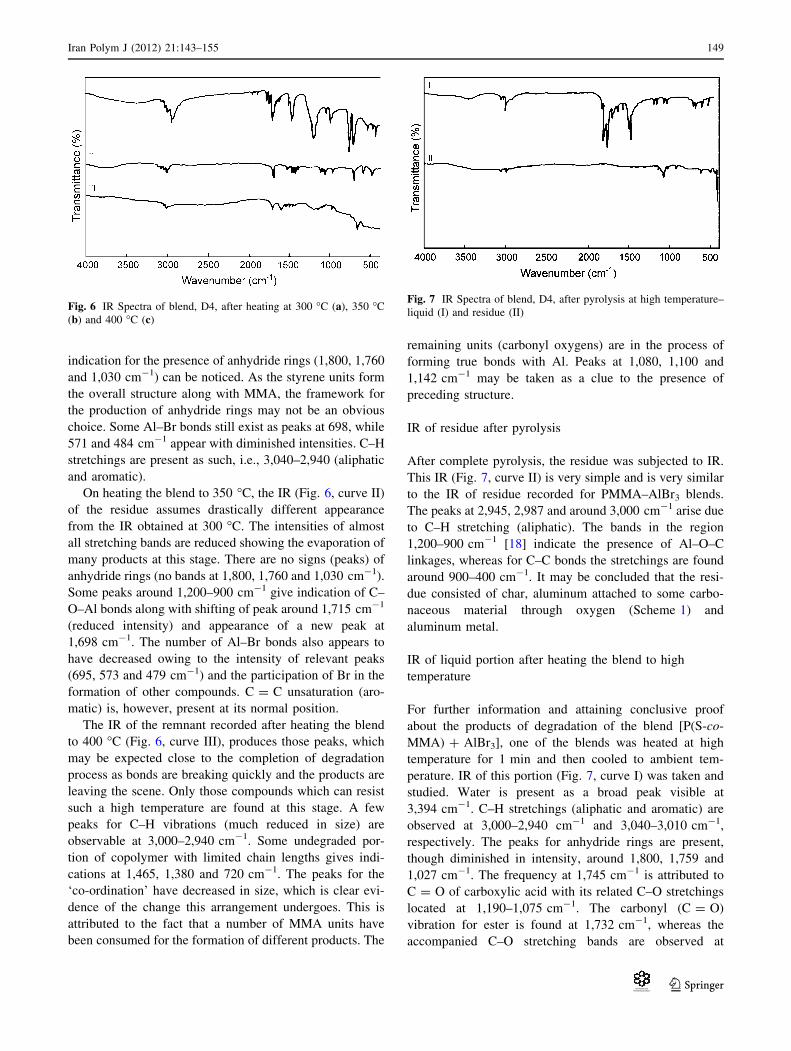
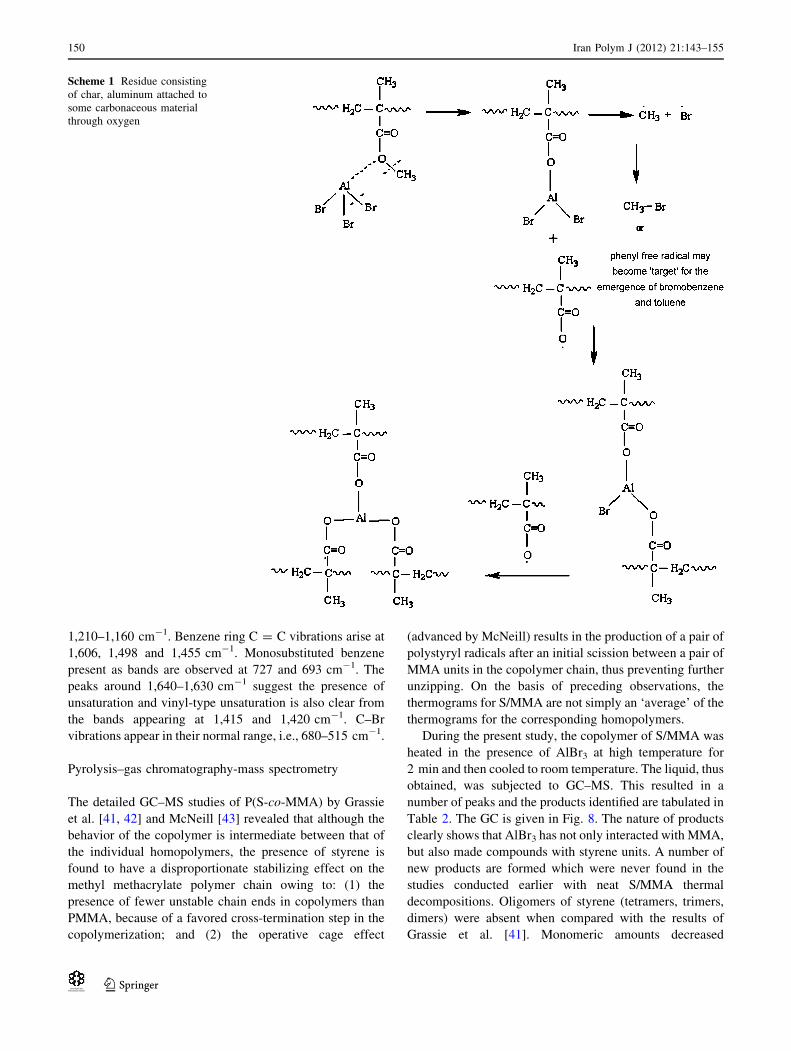
IR of residue after pyrolysis
After complete pyrolysis, the residue was subjected to IR.
This IR (Fig. 7, curve II) is very simple and is very similar
to the IR of residue recorded for PMMA–AlBr3 blends.
The peaks at 2,945, 2,987 and around 3,000 cm-1 arise due
to C–H stretching (aliphatic). The bands in the region
1,200–900 cm-1 [18] indicate the presence of Al–O–C
linkages, whereas for C–C bonds the stretchings are found
around 900–400 cm-1. It may be concluded that the resi-
due consisted of char, aluminum attached to some carbo-
naceous material through oxygen (Scheme 1) and
aluminum metal.
IR of liquid portion after heating the blend to high
temperature
For further information and attaining conclusive proof
about the products of degradation of the blend [P(S-co-
MMA) ? AlBr3], one of the blends was heated at high
temperature for 1 min and then cooled to ambient tem-
perature. IR of this portion (Fig. 7, curve I) was taken and
studied. Water is present as a broad peak visible at
3,394 cm-1. C–H stretchings (aliphatic and aromatic) are
observed at 3,000–2,940 cm-1 and 3,040–3,010 cm-1,
respectively. The peaks for anhydride rings are present,
though diminished in intensity, around 1,800, 1,759 and
1,027 cm-1. The frequency at 1,745 cm-1 is attributed to
C = O of carboxylic acid with its related C–O stretchings
located at 1,190–1,075 cm-1. The carbonyl (C = O)
vibration for ester is found at 1,732 cm-1, whereas the
accompanied C–O stretching bands are observed at
Fig. 6 IR Spectra of blend, D4, after heating at 300 �C (a), 350 �C
(b) and 400 �C (c)
Fig. 7 IR Spectra of blend, D4, after pyrolysis at high temperature–
liquid (I) and residue (II)
Iran Polym J (2012) 21:143–155 149
Iran Polymer andPetrochemical Institute
123
1,210–1,160 cm-1. Benzene ring C = C vibrations arise at
1,606, 1,498 and 1,455 cm-1. Monosubstituted benzene
present as bands are observed at 727 and 693 cm-1. The
peaks around 1,640–1,630 cm-1 suggest the presence of
unsaturation and vinyl-type unsaturation is also clear from
the bands appearing at 1,415 and 1,420 cm-1. C–Br
vibrations appear in their normal range, i.e., 680–515 cm-1.
Pyrolysis–gas chromatography-mass spectrometry
The detailed GC–MS studies of P(S-co-MMA) by Grassie
et al. [41, 42] and McNeill [43] revealed that although the
behavior of the copolymer is intermediate between that of
the individual homopolymers, the presence of styrene is
found to have a disproportionate stabilizing effect on the
methyl methacrylate polymer chain owing to: (1) the
presence of fewer unstable chain ends in copolymers than
PMMA, because of a favored cross-termination step in the
copolymerization; and (2) the operative cage effect
(advanced by McNeill) results in the production of a pair of
polystyryl radicals after an initial scission between a pair of
MMA units in the copolymer chain, thus preventing further
unzipping. On the basis of preceding observations, the
thermograms for S/MMA are not simply an ‘average’ of the
thermograms for the corresponding homopolymers.
During the present study, the copolymer of S/MMA was
heated in the presence of AlBr3 at high temperature for
2 min and then cooled to room temperature. The liquid, thus
obtained, was subjected to GC–MS. This resulted in a
number of peaks and the products identified are tabulated in
Table 2. The GC is given in Fig. 8. The nature of products
clearly shows that AlBr3 has not only interacted with MMA,
but also made compounds with styrene units. A number of
new products are formed which were never found in the
studies conducted earlier with neat S/MMA thermal
decompositions. Oligomers of styrene (tetramers, trimers,
dimers) were absent when compared with the results of
Grassie et al. [41]. Monomeric amounts decreased
Scheme 1 Residue consisting
of char, aluminum attached to
some carbonaceous material
through oxygen
150 Iran Polym J (2012) 21:143–155
Iran Polymer andPetrochemical Institute
123
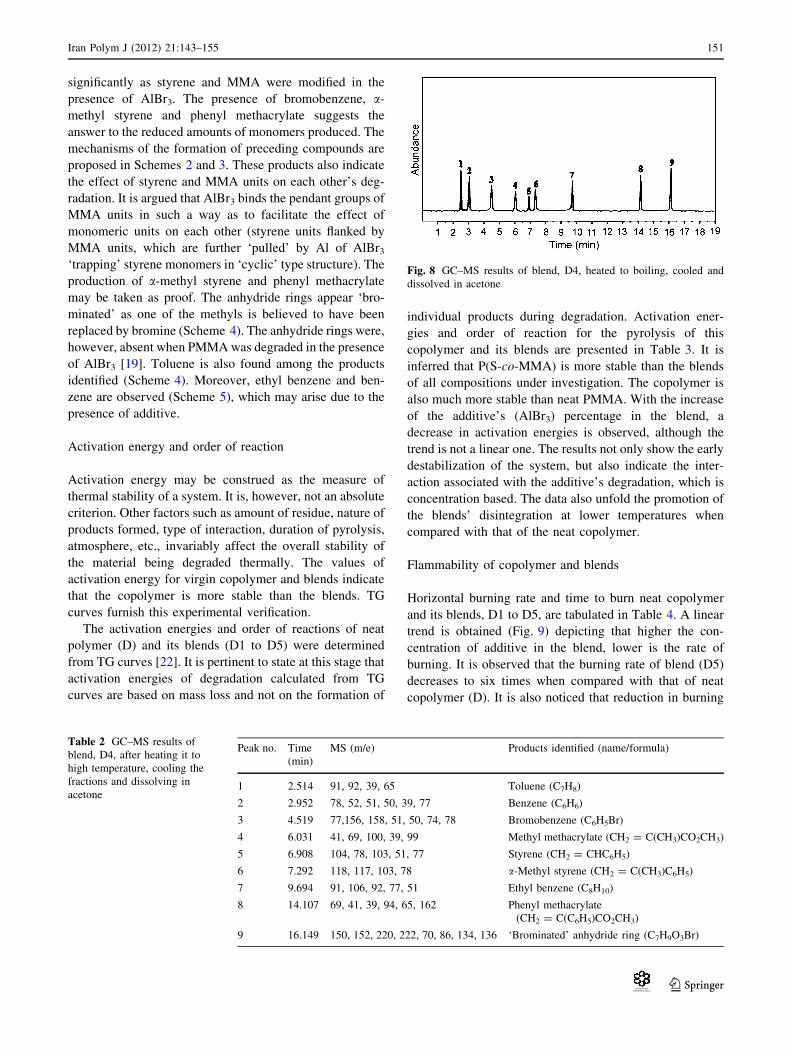
significantly as styrene and MMA were modified in the
presence of AlBr3. The presence of bromobenzene, a-
methyl styrene and phenyl methacrylate suggests the
answer to the reduced amounts of monomers produced. The
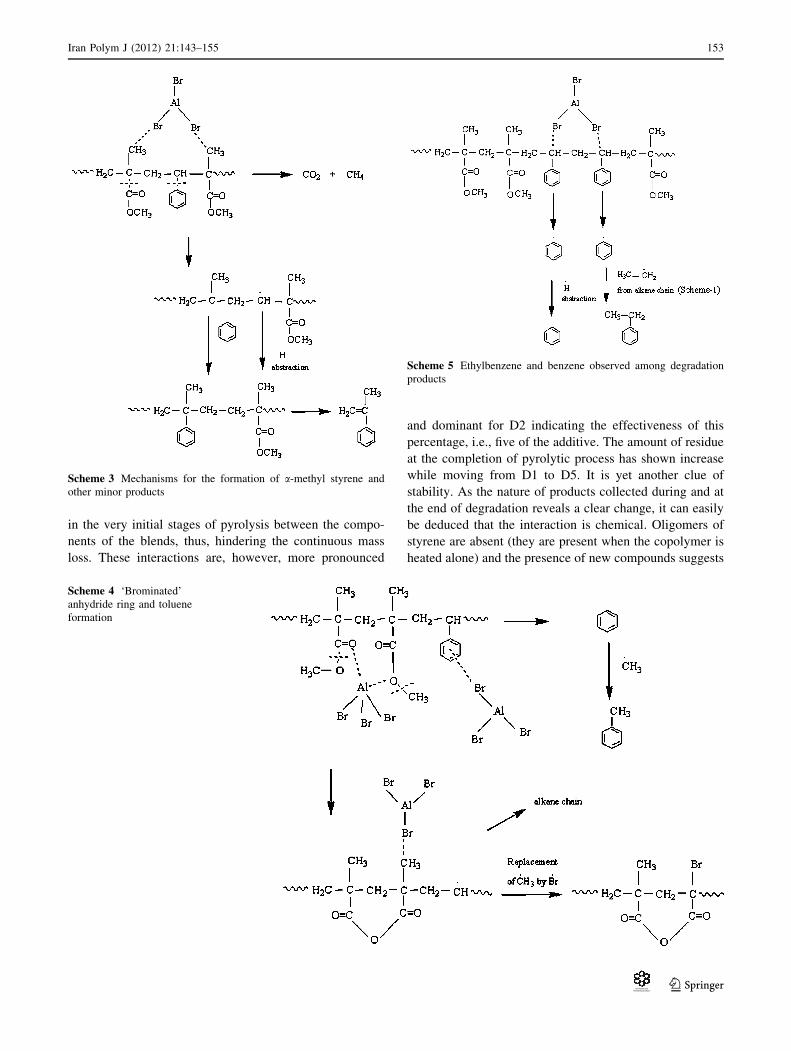
mechanisms of the formation of preceding compounds are
proposed in Schemes 2 and 3. These products also indicate
the effect of styrene and MMA units on each other’s deg-
radation. It is argued that AlBr3 binds the pendant groups of
MMA units in such a way as to facilitate the effect of
monomeric units on each other (styrene units flanked by
MMA units, which are further ‘pulled’ by Al of AlBr3
‘trapping’ styrene monomers in ‘cyclic’ type structure). The
production of a-methyl styrene and phenyl methacrylate
may be taken as proof. The anhydride rings appear ‘bro-
minated’ as one of the methyls is believed to have been
replaced by bromine (Scheme 4). The anhydride rings were,
however, absent when PMMA was degraded in the presence
of AlBr3 [19]. Toluene is also found among the products
identified (Scheme 4). Moreover, ethyl benzene and ben-
zene are observed (Scheme 5), which may arise due to the
presence of additive.
Activation energy and order of reaction
Activation energy may be construed as the measure of
thermal stability of a system. It is, however, not an absolute
criterion. Other factors such as amount of residue, nature of
products formed, type of interaction, duration of pyrolysis,
atmosphere, etc., invariably affect the overall stability of
the material being degraded thermally. The values of
activation energy for virgin copolymer and blends indicate
that the copolymer is more stable than the blends. TG
curves furnish this experimental verification.
The activation energies and order of reactions of neat
polymer (D) and its blends (D1 to D5) were determined
from TG curves [22]. It is pertinent to state at this stage that
activation energies of degradation calculated from TG
curves are based on mass loss and not on the formation of
individual products during degradation. Activation ener-
gies and order of reaction for the pyrolysis of this
copolymer and its blends are presented in Table 3. It is
inferred that P(S-co-MMA) is more stable than the blends
of all compositions under investigation. The copolymer is
also much more stable than neat PMMA. With the increase
of the additive’s (AlBr3) percentage in the blend, a
decrease in activation energies is observed, although the
trend is not a linear one. The results not only show the early
destabilization of the system, but also indicate the inter-
action associated with the additive’s degradation, which is
concentration based. The data also unfold the promotion of
the blends’ disintegration at lower temperatures when
compared with that of the neat copolymer.
Flammability of copolymer and blends
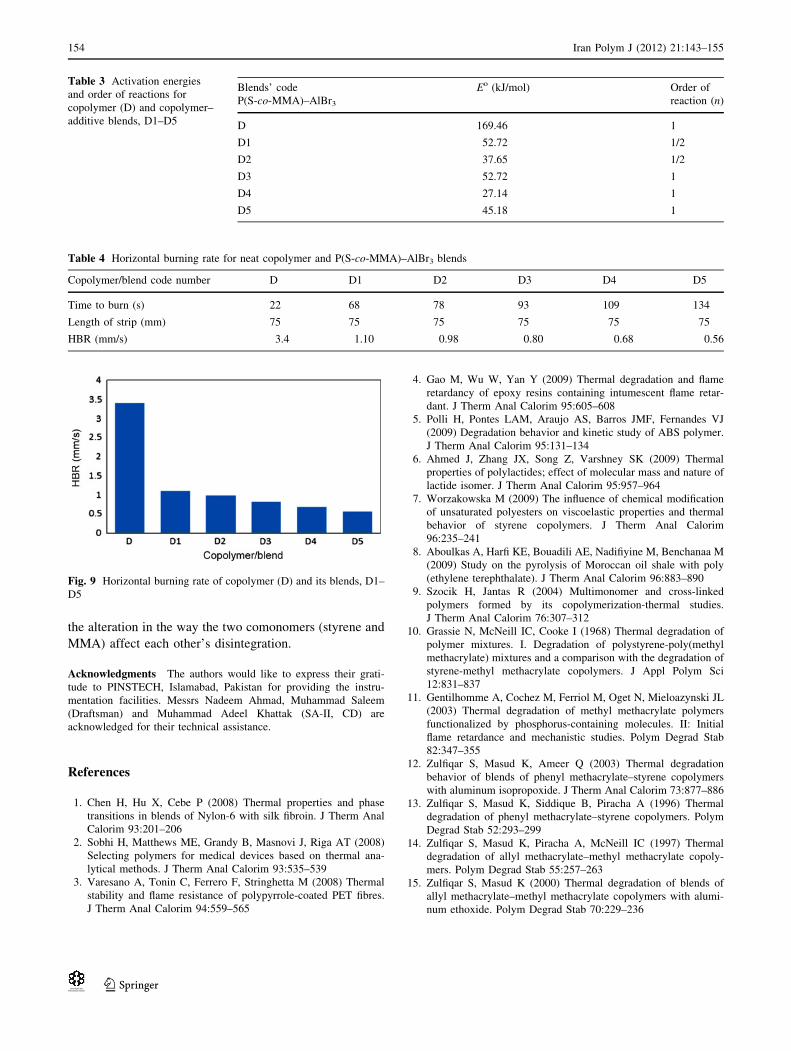
Horizontal burning rate and time to burn neat copolymer
and its blends, D1 to D5, are tabulated in Table 4. A linear
trend is obtained (Fig. 9) depicting that higher the con-
centration of additive in the blend, lower is the rate of
burning. It is observed that the burning rate of blend (D5)
decreases to six times when compared with that of neat
copolymer (D). It is also noticed that reduction in burning
Table 2 GC–MS results of
blend, D4, after heating it to
high temperature, cooling the
fractions and dissolving in
acetone
Peak no. Time
(min)
MS (m/e) Products identified (name/formula)
1 2.514 91, 92, 39, 65 Toluene (C7H8)
2 2.952 78, 52, 51, 50, 39, 77 Benzene (C6H6)
3 4.519 77,156, 158, 51, 50, 74, 78 Bromobenzene (C6H5Br)
4 6.031 41, 69, 100, 39, 99 Methyl methacrylate (CH2 = C(CH3)CO2CH3)
5 6.908 104, 78, 103, 51, 77 Styrene (CH2 = CHC6H5)
6 7.292 118, 117, 103, 78 a-Methyl styrene (CH2 = C(CH3)C6H5)
7 9.694 91, 106, 92, 77, 51 Ethyl benzene (C8H10)
8 14.107 69, 41, 39, 94, 65, 162 Phenyl methacrylate
(CH2 = C(C6H5)CO2CH3)
9 16.149 150, 152, 220, 222, 70, 86, 134, 136 ‘Brominated’ anhydride ring (C7H9O3Br)
Fig. 8 GC–MS results of blend, D4, heated to boiling, cooled and
dissolved in acetone
Iran Polym J (2012) 21:143–155 151
Iran Polymer andPetrochemical Institute
123

rate is much more pronounced even with the lowest pro-
portion of additive (D1) and this is easily explained by the
entangling of the constituents (positioning) and interaction
of ‘complexation’ type, which are believed to hinder the
burning of copolymer. The uniform distribution of all
concentrations of additive throughout the copolymer is also
established.
Conclusions
The copolymer is more stable than its blends when their T0
(temperature at which first mass loss is detected) are
compared. The low-temperature pyrolysis of blends is
attributed to decomposition of the additive, which gener-
ates free radicals (Br•). These radicals then initiate the
early decomposition of copolymer or block the degradation
at some later stage. In the later part of the degradation
process, these radicals also attack the disintegration prod-
ucts of constituting monomers along with the monomers
themselves. Increasing concentration of additive from 2.5
to 12.5% does not affect T0 and Tmax (temperature corre-
sponding to that mass loss after which no further change in
mass is noticeable) of the blends. Thermal stability at the
completion of the first stage of degradation is evident for
D2–D5. It is believed that the interactions/bindings develop
Scheme 2 Route for the
formation of a few compounds
due to the effect of AlBr3 on
P(S-co-MMA)
152 Iran Polym J (2012) 21:143–155
Iran Polymer andPetrochemical Institute
123
in the very initial stages of pyrolysis between the compo-
nents of the blends, thus, hindering the continuous mass
loss. These interactions are, however, more pronounced
and dominant for D2 indicating the effectiveness of this
percentage, i.e., five of the additive. The amount of residue
at the completion of pyrolytic process has shown increase
while moving from D1 to D5. It is yet another clue of
stability. As the nature of products collected during and at
the end of degradation reveals a clear change, it can easily
be deduced that the interaction is chemical. Oligomers of
styrene are absent (they are present when the copolymer is
heated alone) and the presence of new compounds suggests
Scheme 3 Mechanisms for the formation of a-methyl styrene and
other minor products
Scheme 4 ‘Brominated’
anhydride ring and toluene
formation
Scheme 5 Ethylbenzene and benzene observed among degradation
products
Iran Polym J (2012) 21:143–155 153
Iran Polymer andPetrochemical Institute
123
the alteration in the way the two comonomers (styrene and
MMA) affect each other’s disintegration.
Acknowledgments The authors would like to express their grati-
tude to PINSTECH, Islamabad, Pakistan for providing the instru-
mentation facilities. Messrs Nadeem Ahmad, Muhammad Saleem
(Draftsman) and Muhammad Adeel Khattak (SA-II, CD) are
acknowledged for their technical assistance.
References
1. Chen H, Hu X, Cebe P (2008) Thermal properties and phase
transitions in blends of Nylon-6 with silk fibroin. J Therm Anal
Calorim 93:201–206
2. Sobhi H, Matthews ME, Grandy B, Masnovi J, Riga AT (2008)
Selecting polymers for medical devices based on thermal ana-
lytical methods. J Therm Anal Calorim 93:535–539
3. Varesano A, Tonin C, Ferrero F, Stringhetta M (2008) Thermal
stability and flame resistance of polypyrrole-coated PET fibres.
J Therm Anal Calorim 94:559–565
4. Gao M, Wu W, Yan Y (2009) Thermal degradation and flame
retardancy of epoxy resins containing intumescent flame retar-
dant. J Therm Anal Calorim 95:605–608
5. Polli H, Pontes LAM, Araujo AS, Barros JMF, Fernandes VJ
(2009) Degradation behavior and kinetic study of ABS polymer.
J Therm Anal Calorim 95:131–134
6. Ahmed J, Zhang JX, Song Z, Varshney SK (2009) Thermal
properties of polylactides; effect of molecular mass and nature of
lactide isomer. J Therm Anal Calorim 95:957–964
7. Worzakowska M (2009) The influence of chemical modification
of unsaturated polyesters on viscoelastic properties and thermal
behavior of styrene copolymers. J Therm Anal Calorim
96:235–241
8. Aboulkas A, Harfi KE, Bouadili AE, Nadifiyine M, Benchanaa M
(2009) Study on the pyrolysis of Moroccan oil shale with poly
(ethylene terephthalate). J Therm Anal Calorim 96:883–890
9. Szocik H, Jantas R (2004) Multimonomer and cross-linked
polymers formed by its copolymerization-thermal studies.
J Therm Anal Calorim 76:307–312
10. Grassie N, McNeill IC, Cooke I (1968) Thermal degradation of
polymer mixtures. I. Degradation of polystyrene-poly(methyl
methacrylate) mixtures and a comparison with the degradation of
styrene-methyl methacrylate copolymers. J Appl Polym Sci
12:831–837
11. Gentilhomme A, Cochez M, Ferriol M, Oget N, Mieloazynski JL
(2003) Thermal degradation of methyl methacrylate polymers
functionalized by phosphorus-containing molecules. II: Initial
flame retardance and mechanistic studies. Polym Degrad Stab
82:347–355
12. Zulfiqar S, Masud K, Ameer Q (2003) Thermal degradation
behavior of blends of phenyl methacrylate–styrene copolymers
with aluminum isopropoxide. J Therm Anal Calorim 73:877–886
13. Zulfiqar S, Masud K, Siddique B, Piracha A (1996) Thermal
degradation of phenyl methacrylate–styrene copolymers. Polym
Degrad Stab 52:293–299
14. Zulfiqar S, Masud K, Piracha A, McNeill IC (1997) Thermal
degradation of allyl methacrylate–methyl methacrylate copoly-
mers. Polym Degrad Stab 55:257–263
15. Zulfiqar S, Masud K (2000) Thermal degradation of blends of
allyl methacrylate–methyl methacrylate copolymers with alumi-
num ethoxide. Polym Degrad Stab 70:229–236
Table 3 Activation energies
and order of reactions for
copolymer (D) and copolymer–
additive blends, D1–D5
Blends’ code
P(S-co-MMA)–AlBr3
Eo (kJ/mol) Order of
reaction (n)
D 169.46 1
D1 52.72 1/2
D2 37.65 1/2
D3 52.72 1
D4 27.14 1
D5 45.18 1
Table 4 Horizontal burning rate for neat copolymer and P(S-co-MMA)–AlBr3 blends
Copolymer/blend code number D D1 D2 D3 D4 D5
Time to burn (s) 22 68 78 93 109 134
Length of strip (mm) 75 75 75 75 75 75
HBR (mm/s) 3.4 1.10 0.98 0.80 0.68 0.56
Fig. 9 Horizontal burning rate of copolymer (D) and its blends, D1–
D5
154 Iran Polym J (2012) 21:143–155
Iran Polymer andPetrochemical Institute
123
16. Zulfiqar S, Masud K, Ameer Q (2002) Thermal degradation of
blends of phenyl methacrylate–styrene copolymers with alumi-
num ethoxide. Polym Degrad Stab 77:457–464
17. Zulfiqar S, Masud K (2002) Thermal degradation of blends of
allyl methacrylate–methyl methacrylate copolymers with alumi-
num isopropoxide. Polym Degrad Stab 78:305–313
18. Arshad M, Masud K, Arif M, Rehman S, Chohan ZH, Arif M,
Qureshi AH, Saeed A, Salma U, Awan MS (2008) A comparative
study of roles played by aluminum tribromide and aluminum
acetylacetonate on the thermal degradation of PMMA by simul-
taneous thermoanalytical techniques. The Nucleus 45:63–72
19. Arshad M, Masud K, Arif M, Rehman S, Arif M, Zaidi JH,
Chohan ZH, Saeed A, Qureshi AH (2009) The effect of AlBr3
additive on the thermal degradation of PMMA: a study using TG–
DTA–DTG, IR and Py-GC–MS techniques. J Therm Anal Cal-
orim 96:873–881
20. Arshad M, Masud K, Arif M, Rehman S, Zaidi JH, Arif M, Saeed
A, Yasin T (2010) The thermoanalytical, infrared and pyrolysis-
gas chromatography–mass spectrometric sifting of poly (methyl
methacrylate) in the presence of phosphorus tribromide. Nat Sci
2:307–319
21. Arshad M, Masud K, Arif M, Rehman S, Saeed A, Zaidi JH
(2011) Characterization of poly(methyl methacrylate)–tin (IV)
chloride blend by TG–DTG–DTA, IR and pyrolysis-GC–MS
techniques. Bull Korean Chem Soc 32:3295–3305
22. Horowitz HH, Metzger G (1963) A new analysis of thermo-
gravimetric traces. Anal Chem 35:1464–1468
23. Riddick JA, Bunger WB, Sakano TK (1986) Organic solvents-
physical properties and methods of purification. Wiley, New
York
24. Priddy DB, Pirc M (1990) Purification of styrene for anionic
polymerization. J Appl Polym Sci 40:41–45
25. Seymour RB, Carraher CM Jr (1988) Polymer chemistry, an
introduction, 2nd edn. Marcel & Dekker, New York
26. Meyer VE (1967) Reactivity ratios of styrene and methyl meth-
acrylate at 90 �C. J Polym Sci Part A1. Polym Chem
5:1289–1296
27. Cabaness WR, Lin TYC, Parkanyi C (1971) Effect of pH on the
reactivity ratios in the copolymerization of acrylic acid and
acrylamide. J Polym Sci, Part A-1. Polym Chem 9:2155–2170
28. Lewis FM, Walling C, Cummings W, Briggs ER, Mayo FR
(1948) Copolymerization. IV. Effects of temperature and solvents
on monomer reactivity ratios. J Am Chem Soc 70:1519–1523
29. Nozaki N (1946) Reactivity of monomers in copolymerization.
J Polym Sci 1:455–465
30. Flammability Test, UL94, ASTM D 635.
31. Sain M, Park SH, Suhara F, Law S (2004) Flame retardant and
mechanical properties of natural fibre-PP composites containing
magnesium hydroxide. Polym Degrad Stab 83:363–367
32. Hurduc N, Cascaval CN, Schneider IA, Reiss O (1975) Etude de
la degradation thermique de copolymers: comparaison de ne-
langes de polymers, decopolymers sequences, statistiques et al-
ternes a bas de styrene et al. de methacrylate de methyl. Eur
Polym J 11:429–435
33. Gronowski A, Wojtezak Z (2003) Thermal stabilities of copoly-
mers of styrene with lithium, sodium and potassium acrylates and
methacrylates. Acta Polymerica 40:265–268
34. Cascaval CN, Schneider IA, Poinescu IGC, Butnaru M (1979)
Pyrolysis-gas chromatography of some copolymers of styrene.
Eur Polym J 15:661–666
35. Beldie C, Onu A, Bourceanu G, Poinescu IGC (1985) Glass
transition temperatures of some copolymers of styrene with
methyl methacrylate using DTA and chromatographic data. Eur
Polym J 2:321–323
36. Hamoudi A, McNeill IC (1978) Preparation and degradation of
copolymers of methyl methacrylate with alkali metal methacry-
lates-III, Quantitative studies of products of degradation to
500 �C. Eur Polym J 14:779–784
37. Smith AL (1979) Applied infrared spectroscopy fundamentals,
techniques and analytical problem-solving, John Wiley and Sons,
A Wiley-Interscience Publication, New York, pp 297–308
38. The Sadtler Standard Spectra, Sadtler Research Laboratories
(1974), Philadelphia, PA 5
39. Robinson JW (ed) (1974) CRC handbook of spectroscopy, vol II.
CRC Press, Inc, USA
40. Szymanski HA, Erikson RE (eds) (1970) Infrared Band Hand-
book, vol., 1 and 2, 2nd edn. IFI/Plenum, New York
41. Grassie N, Farish E (1967) The thermal degradation of copoly-
mers of styrene and methyl methacrylate. Eur Polym J 3:305–315
42. Grassie N, Grant EM (1966) The thermal degradation of
copolymer of a-chloroacrylonitrile with styrene and methyl
methacrylate. Eur Polym J 2:255–268
43. McNeill IC (1968) A study of the degradation of methyl meth-
acrylate polymers and copolymers by thermal volatilization
analysis. Eur Polym J 4:21–30
Iran Polym J (2012) 21:143–155 155
Iran Polymer andPetrochemical Institute
123