alberta’s oil sands and us refineries · pdf fileintroduction the increasing development...
TRANSCRIPT


Alberta’s Oil Sands and US Refineries
Robert Huston

Table of Contents Table of Contents................................................................................................................. i Table of Figures .................................................................................................................. ii Introduction......................................................................................................................... 1 Alberta................................................................................................................................. 2
Scale of Deposits............................................................................................................. 3 Export Levels to the US.................................................................................................. 5 Local refineries and upgraders........................................................................................ 9
The United States.............................................................................................................. 10 US PADs....................................................................................................................... 15 Base oils, sources, and refineries .................................................................................. 18 Potential switchover costs............................................................................................. 22
Transportation ................................................................................................................... 29 Other alternatives .............................................................................................................. 31
Alternative markets for Canadian exports .................................................................... 31 Alternative sources for American imports.................................................................... 33
Conclusions....................................................................................................................... 36 References......................................................................................................................... 37
i

Table of Figures Figure 1 Hydrocarbon Resources in Alberta ...................................................................... 2 Figure 2 Proven World Reserves of Crude Oil................................................................... 4 Figure 3 Canadian Oil Production and Consumption ......................................................... 5 Figure 4 Canada’s Oil Exports to the US............................................................................ 6 Figure 5 Canadian Bitumen Production.............................................................................. 7 Figure 6 Western Canadian Oil Production by Source....................................................... 8 Figure 7 Western Canadian Oil Production by Commodity............................................... 8 Figure 8 Global Oil Consumption..................................................................................... 12 Figure 9 US Petroleum Consumption by Region ............................................................. 13 Figure 10 Gross US Oil Imports ....................................................................................... 14 Figure 11 PADDs.............................................................................................................. 15 Figure 12 Canadian Crude Disposition (2002) ................................................................. 17 Figure 13 Current and Potential Crude Oil Markets in the US......................................... 18 Figure 14 US Refining Capacity by PADD...................................................................... 20 Figure 14 US Oil Imports by Region................................................................................ 21 Figure 16 Refinery Demand by Market ............................................................................ 22 Figure 17 Gulf Coast Refinery Demand ........................................................................... 24 Figure 18 An Acceptable Mix?......................................................................................... 25 Figure 19 Venezuelan oil production and exports to the US............................................ 25 Figure 20 A Problem with the US Refining Industy?....................................................... 27 Figure 21 Existing Major Pipeline Capacity..................................................................... 29 Figure 22 Expected Netbacks of Pipeline Alternatives .................................................... 30 Figure 23 Estimated Costs of Pipeline Options ................................................................ 30 Figure 24 Trend of Chinese Oil Demand.......................................................................... 31 Figure 25 Demand Statistics for China’s Oil Consumption ............................................. 32 Figure 26 World Oil Flows ............................................................................................... 35
ii
Introduction
The increasing development of the oil sands in Northern Alberta represents a
large potential influence in Canada, the United States, and potentially in a number of
other countries/regions. Alberta is a province which has been blessed with a wide variety
of hydrocarbon resources. Due to the continuing depletion of conventional resources
around the world, there has been a steady increase in interest regarding the development
of unconventional sources. These unconventional sources were often not developed in
the past due to higher associated costs, lower world oil prices, and the abundance of
conventional reserves. But due to the decreasing conventional reserves, and political and
security considerations, the development of the oil sands is now a topic of intense interest
among different groups.
Due to the scale of the reserves, and the expected production life of many
projects, there is the potential for production from the oil sands to have an impact on the
refining industry in Canada, the US, and elsewhere. These impacts may take a number of
forms, and there is still uncertainty regarding many issues in which would have to be
considered before there were any significant changes to the status quo.
But this topic is still of interest based on the potential impacts which exist. For
this reason, an examination of a number of the facets of the situation would appear to be
in order, both in background, and in alternate scenarios.
1

Figure 1 Hydrocarbon Resources in Alberta1
Alberta
Oil and gas is a critically important resource in Alberta for a variety of reasons.
Alberta is the most significant province in the Canadian oil and gas industry. The
province produces roughly 70% of the oil in Canada, and around 80% of the natural gas.2
75% of total industry spending is done in the province as well.3 Revenue from oil and
gas generates roughly one third of the Alberta government’s total revenues.4 Oil and gas
are also the most significant exports from the province. Exports of these commodities 1 www.energy.gov.ab.ca/docs/oilsands/pdfs/osgenbrf.pdf, April 9, 2005. 2 www.capp.ca/default.asp?V_DOC_ID=675, April 10, 2005. 3 www.capp.ca/default.asp?V_DOC_ID=675, April 10, 2005. 4 www.capp.ca/default.asp?V_DOC_ID=675, April 10, 2005.
2

account for 60% of Alberta’s total exports (intra-Canadian, and extra-Canadian).5 The
revenue of the Alberta oil and gas industry (with by-products) was estimated at $57
billion in 2003.6
In 2003 over $20 billion in capital expenditures were made in Alberta’s oil and
gas industry.7 This number is bound to increase due to the increased investment in the oil
sands. Billions of dollars in projects are planned in this vast resource, and this will
greatly influence the provincial economy, as well as local economies. Direct and indirect
employment linked to the oil and gas industry was stated as 275,000 jobs in 2003.8 This
is a significant portion of the total workforce of the province linked to this industry.
So questions regarding the development of these resources, and impacts which
may occur due to changes within the operating structure will be highly important to the
province and people of Alberta. The expected increase in production from the oil sands
is, therefore, an issue which will be of great interest to the province. And the potential
markets for this production will also be of concern for them.
Scale of Deposits
There is an estimated 1.6 trillion barrels of oil in place in the Alberta oil sands.
According to estimates from the Alberta Energy and Utilities Board, roughly 174 billion
barrels are currently economically recoverable.9 Many of the figures associated with the
oil sands are subject to debate and reinterpretation. The EUB has also estimated that
5 www.capp.ca/default.asp?V_DOC_ID=675, April 10, 2005. 6 www.capp.ca/default.asp?V_DOC_ID=675, April 10, 2005. 7 www.capp.ca/default.asp?V_DOC_ID=675, April 10, 2005. 8www.capp.ca/default.asp?V_DOC_ID=675, April 10, 2005. 9 www.eub.gov.ab.ca/bbs/new/newsrel/2003/pdf/nr2003-26.pdf, April 9, 2005.
3

there is as much as 2.5 trillion barrels of bitumen in place, and that the total ultimate
recoverable volume will be in the region of 315 billion barrels of bitumen.10
Such a scale of reserves pushes the Canadian totals into second place behind
Saudi Arabia in terms of overall crude reserves. With improvements in recovery
technologies, it is possible that Canada will at some point have the largest recognized
crude oil reserves in the world. The current number of recoverable barrels is only slightly
over 10% of the original oil in place. If new technologies changed so that roughly 20%
of the original oil in place was thought to be recoverable, this would give Canada
reserves on the order of 350 billion barrels. It should also be noted that the Faja del
Orinoco deposits in Venezuela could also benefit from improved recovery techniques
developed in the Alberta oil sands. This would increase the recoverable oil from those
deposits (estimated at around 2 trillion barrels of heavy oil in place11).
Figure 2 Proven World Reserves of Crude Oil12
10 www.capp.ca/default.asp?V_DOC_ID=688, April 11, 2005. 11 http://pubs.usgs.gov/fs/fs70-03/fs070-93.html, May 18, 2004. 12 www.energy.gov.ab.ca/docs/oilsands/pdfs/osgenbrf.pdf, April 9, 2005.
4

Export Levels to the US
Canada and the US are major trading partners, and they have a very
interconnected energy market. Over 99% of all Canadian oil exports head to the US, and
Canada is one of the major sources for American oil imports.13 The total volume of
exports to the US market has been increasing since the 1980’s. Daily exports to the US
now exceed 1 million barrels a day, currently hovering around 1.6 million barrels a day.
Figure 3 Canadian Oil Production and Consumption14
13 www.eia.doe.gov/emeu/cabs/canada.html, April 10, 2005. 14 www.eia.doe.gov/emeu/cabs/canada.html, April 10, 2005.
5

Figure 4 Canada’s Oil Exports to the US15
Of the oil produced in Canada, bitumen production is the area with the highest
potential for growth. The advent of new technologies for in situ recovery, and expanded
mining operations in the Ft. McMurray area will increase the amount of bitumen
produced in Alberta. Current bitumen production already exceeds 1 million barrels a
day.16 And the expectation is that this number will exceed 2 million barrels a day by
2015. This level of production would mean that the oil sands would be contributing two
thirds of the daily oil output in Western Canada, which is expected to have daily output
of around 3 million barrels a day. Over the next 10 years, the level of conventional
production is expected to fall from its current levels, and it will ultimately wind up being
dwarfed by the production from the oil sands. The quality of the production from the oil
sands will be reliant on a number of factors. One factor is the technology of production.
Different technologies produce different products, which is important to consider when
looking at the refining market. Some operations may be able to tailor their output to the
15 www.eia.doe.gov/emeu/cabs/canada.html, April 10, 2005. 16 www.capp.ca/default.asp?V_DOC_ID=688, April 10, 2005.
6

specifications of refineries, but this is an often expensive process. Such processes will
also be reliant upon operation in the traditional fashion. But if some inputs (e.g. natural
gas) become too expensive for the process, then this will limit the ability to tailor
production economically.
Figure 5 Canadian Bitumen Production17
17www.eia.doe.gov/emeu/cabs/canada.html, April 10, 2005.
7

Figure 6 Western Canadian Oil Production by Source18
Figure 7 Western Canadian Oil Production by Commodity19
18 www.capp.ca/raw.asp?x=1&dt=PDF&dn=83040, April 10, 2005. 19 www.capp.ca/raw.asp?x=1&dt=PDF&dn=83040, April 10, 2005.
8

Of the production in Western Canada, the growth is expected to be split between
bitumen and synthetic oil blends. As stated earlier, conventional production (all grades)
is expected to decease. The greatest parity of production between the two is expected to
be around the 2005 production year. Greater increases in oil sands production are
anticipated further out as more large scale projects come on line. The difference in
quality of output has a number of implications for refiners. Most refiners are specialized
to specific blends of crude. They can use other blends for their processes, but it reduces
efficiency. So the type of product which is sold to refineries has important implications
for the products, and may reflect the need for modifications by refiners.
Local refineries and upgraders
Upgrading is the process of converting bitumen from a hydrogen deficient,
sulphur, nitrogen, oxygen, and heavy metal rich fluid to an upgrade or synthetic crude oil.
The two primary methods of upgrading are coking and hydro-conversion. These methods
employ different strategies towards upgrading. Coking reduces the level of carbon in the
bitumen to produce upgrades, while hydro-conversion adds hydrogen. Hydro-conversion
produces more barrels of upgraded product than at the start of the process, while coking
generally leads around a 15% reduction in the volume from the start of the process.
Upgraders exist both as standalone units, as well as components of integrated
operations. Standalone units are often able to process both raw bitumen and conventional
heavy oil. The integrated units are generally bitumen specific, and are usually located in
close proximity to their source of material (e.g. Suncor). The expected gap between
bitumen production and upgrading capacity is 485,000 barrels a day for 2005. This
9
number may shrink by 2010, but is expected to remain above 400,000 barrels a day.20 A
differential such as this implies the need for either more upgrading capacity in province,
or export facilities designed for raw bitumen combined with increased refinery capacity
designed to accommodate the source material.
The goal of the upgrading process is that refineries should then able to process the
former bitumen more easily. The upgrading process also aids in transportation, as
upgrading produces much more pipeline friendly products than the initial bitumen.
Alberta does possess refining capacity, but it is insufficient to accommodate the current
levels of production, let alone increased levels. Different refineries have different base
oils, and different production slates, often varying with company planning. Many of the
refineries in the province are located outside of Edmonton, which is a pipeline hub.
The United States
Global oil demand is still climbing. It was expected to be just below 80 million
barrels a day in 2002, and it is over that number now. The greatest areas of demand
growth are in rapidly expanding economies such as China and India. The level of
demand from these regions is now one of the major factors affecting the price of oil.
China is the most acute case of growing demand, as their economy is fuelled more by
industrial factors than nations like India. The overall demand growth in these regions is
an important consideration when looking at the future supply and demand situation. The
North American market, while still growing, is not growing at anywhere near the pace of
20 www.energy.gov.ab.ca/osd/docs/consult/doemarpre.pdf, June 16, 2004.
10

the developing economies. The interaction between these two demand spheres may spark
intense competition for available resources if little new production is brought on line
globally. This would make the supply scenario less clear as to which producing regions
would be supplying which major demand centers to a degree. This situation could
benefit Canadian oil sands operators in prompting American refiners to modify their ideal
inputs for Canadian bitumen and synthetic blends due to the ease of supply situations.
Alternatively, the growing Asian markets may prove an excellent area for exports in the
future.
As mentioned above, most demand projections predict a continued increase in the
level of consumption in the US in the future. However, many of the estimates made for
these numbers likely do not reflect the current market situation for crude oil based on
price. Many of the forecasting models were basing their demand trends of a range of
crude oil prices between US$24 and US$35 through 2025.21 While the current price
levels may not be maintained, the current market status predictions made with lower price
expectations may not reasonably be considered accurate.
21 www.eia.doe.gov/oiaf/aeo/forecast.html, April 10, 2005.
11

Figure 8 Global Oil Consumption22
Within the US market, there is differing demand by region. The densely
populated East Coast (PADD I) has the highest level of petroleum use in the US. But the
Gulf Coast (PADD III) is far and away the most intensive area in terms of fuel use per
capita. This is most likely a consequence of the Gulf Coast’s early status as a major oil
and gas producing region. The easy access to resources led to a fuel intensive culture
developing in the region. This region is still the largest refining center in the US, and as
such, is an important consideration in any discussion of oil and gas policy.
22 www.eia.doe.gov/pub/oil_gas/petroleum/analysis_publications/oil_market_basics/Dem_image_Consumption.htm#Click%20on%20regional%20area%20to%20see%20detail, April 11, 2005.
12

Figure 9 US Petroleum Consumption by Region23
The level of US imports is another important consideration when examining US
refinery demand. This is because the location of imports will have bearing on the type of
crude oil which is being brought into the country. Over time, there are fluctuations in the
levels of export to the US by different countries. As of 2003, Canada is the largest
exporter of crude oil to the US, followed by Saudi Arabia, Mexico, and Venezuela. The
situation in 1997 was different, with Venezuela being the largest exporter, followed by
Canada, Saudi Arabia, and Mexico. The fluctuations in the level of imports reflect a
variety of factors. In some cases (Venezuela) a significant factor has been the political
stability of the government and the oil industry. Such events obviously influence prices,
23 www.eia.doe.gov/pub/oil_gas/petroleum/analysis_publications/oil_market_basics/Dem_image_US_Regl_Cons.htm, April 11, 2005.
13

as well as confidence in supply sources. This may tempt companies reliant on oil imports
to look at different sources.
Figure 10 Gross US Oil Imports24
Canada represents the nation who has increased exports to the US the most over
the 1997-2003 period. Exports increased by over 500 thousand barrels a day. Saudi
Arabia was second over this period with an increase of over 350 thousand barrels a day.
Mexican exports suffered a slight decrease in 2000, but rebounded to finish 2003 roughly
250 thousand barrels a day over 1997 levels. Venezuela is the only nation to post a
continuous decrease in exports to the US over this period, sliding by around 400 thousand
barrels a day. The gross level of US imports over this period increased by over 20%.
This reflects both increasing demand, as well as declining domestic production.
24 www.eia.doe.gov/emeu/cabs/venez.html, April 14, 2005.
14

US PADs
In the United States, there are five PADDs. The PADD abbreviation is short for
Petroleum Allocation for Defence District.25 These districts were initially drawn up to
delineate oil distribution during World War II.
Figure 11 PADDs26
Canadian oil flows in part to almost every PADD in the US. The exception is
PADD III (Gulf Coast), who have, in the past, produced the majority of their own oil, and
currently import the remainder of the stocks they utilize from other nations. The Gulf
Coast PADD is also a major center for the US refining industry. This PADD currently
has a low percentage of operations which could process Canadian heavy oil to its
maximum potential.
25 www.emis.platts.com/thezone/guides/platts/oil/glossary.html, April 11, 2005. 26 www.eia.doe.gov/pub/oil_gas/petroleum/analysis_publications/oil_market_basics/paddmap.htm, April 11, 2005.
15

Currently, 45% of Canadian oil exports flow to the mid-West, PADD II.27 The
majority of these exports flow through pipelines to Chicago, and are re-routed from there
to later destinations. There is some level of export to PADDs IV and V, but this is not at
the same level as the PADD II exports. There are currently no exports to the refining
centers in PADD III, which would be a significant market to enter for Canadian exports,
due to the overall intensity of activity in the region. There are also no exports to PADD I
at the moment, as it is supplied mostly through links to PADD III.
The most likely areas for market expansion in the US by Canadian oil sands
output are in the areas where there is already some degree of interaction. The most likely
scenarios would see increased imports to PADDs II, IV, and V, while PADDs I and III
would still obtain the majority of their oil from other sources.
27 www.capp.ca/raw.asp?x=1&dt=NTV&e=PDF&dn=62752, April 11, 2005.
16
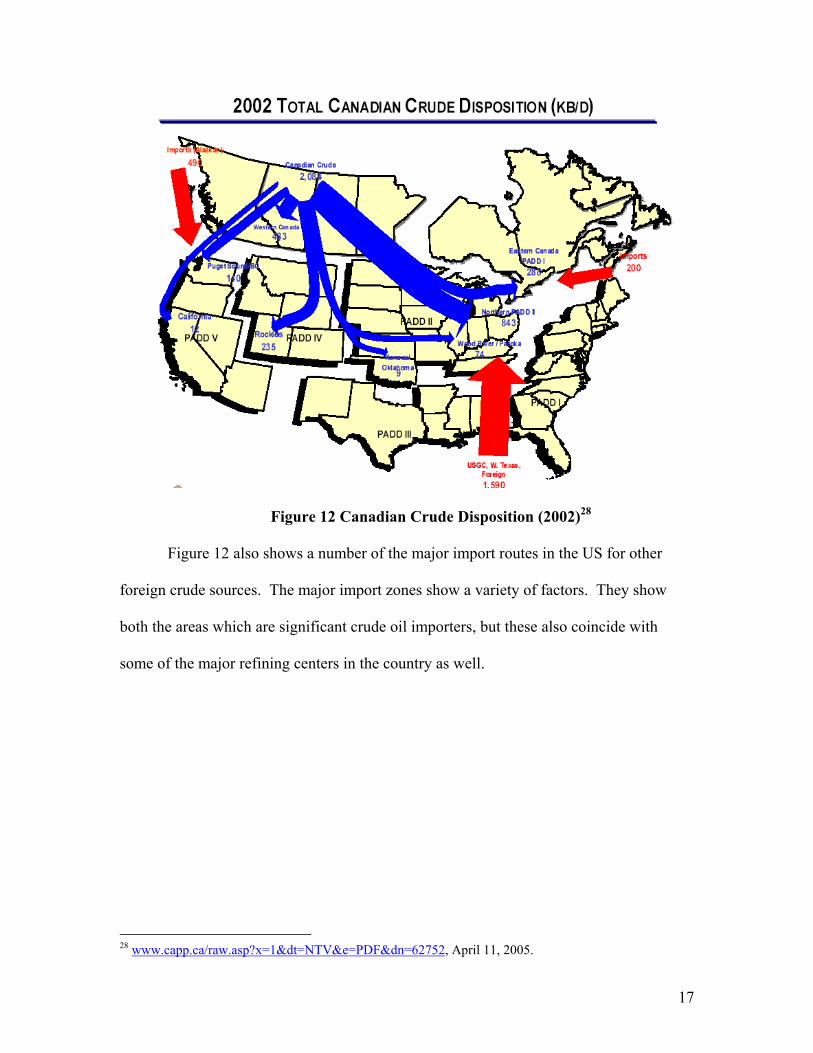
Figure 12 Canadian Crude Disposition (2002)28
Figure 12 also shows a number of the major import routes in the US for other
foreign crude sources. The major import zones show a variety of factors. They show
both the areas which are significant crude oil importers, but these also coincide with
some of the major refining centers in the country as well.
28 www.capp.ca/raw.asp?x=1&dt=NTV&e=PDF&dn=62752, April 11, 2005.
17

Figure 13 Current and Potential Crude Oil Markets in the US29
Base oils, sources, and refineries
The US is still the world leader in refining capacity, with an estimated 16 million
barrels a day of refining capacity.30 PADD III refineries dominate the localities in which
refineries are located. This area concentration also corresponds to the scale of crude oil
29 www.capp.ca/raw.asp?x=1&dt=NTV&e=PDF&dn=62752, April 11, 2005. 30 www.eia.doe.gov/pub/oil_gas/petroleum/analysis_publications/oil_market_basics/Refining_text.htm#U.S.%20Refining%20Capacity, April 11, 2005.
18
imports which occur in each region. Crude oil imports for PADD III are in excess of 5
million barrels a day of crude oil.
For refineries, it is important to note the type of base stock which they utilize in
their processes. There is a marked difference in the range of products which can be
produced from a light sweet crude oil, and a heavy sour oil. The light crudes are able to
be better processed to produce a range of higher value products. Heavier oils produce
less of these high value products, and often have a significant portion of heavy residuum
which is less useful, and must be sold at a discount relative to lighter crude stocks.31
Impurities such as heavy metals (which occur quite frequently in Canadian bitumen) also
affect the suitability of base oils for different purposes.
31 www.eia.doe.gov/pub/oil_gas/petroleum/analysis_publications/oil_market_basics/Refining_text.htm#Crude%20Oil%20Quality, April 11, 2005.
19

Figure 14 US Refining Capacity by PADD32
These kinds of considerations are a significant component of what Canadian
producers need to be cognizant of when formulating their strategies and marketing in
relation to the US refining market. If they fail to do this, they may misjudge the
requirements of demand in these areas, and the consequences of such misjudgements
could be very serious for a company’s goals and objectives.
32 www.eia.doe.gov/pub/oil_gas/petroleum/analysis_publications/oil_market_basics/Ref_image_USregl_cap.htm, April 11, 2005.
20

Figure 14 US Oil Imports by Region33
Thus, for Canadian exporters, knowledge of the current market conditions is
extremely important. In line with this idea is the knowledge of what the refiners in the
areas of expansion have traditionally used as their base oils. Canada’s traditional areas of
export have a greater capacity for heavy oil than those markets they seek to expand into.
The expansion markets have a small amount of heavy oil capacity (likely configured
towards Venezuelan crudes) and a larger proportion of medium sour grade capability.
The core regions do have capacity dedicated to synthetic blends, while there is virtually
none of this in the extended market area. The expansion opportunities in PADDs I and
IV are limited. The combined total refining capacity is around a third less than the
33 www.eia.doe.gov/pub/oil_gas/petroleum/analysis_publications/oil_market_basics/Trade_image_usregl_imp.htm, April 11, 2005.
21

PADD V capacity on its own. PADD V is the lowest volume refiner of the three larger
refining regions. PADD II has roughly 400 thousand barrels a day of capacity over that
of PADD V, while PADD III has more than double the amount of any other PADD, with
roughly 7.7 million barrels a day of refining capacity. This means that PADD III is the
home of roughly half of the current refining capacity in the US.
Figure 16 Refinery Demand by Market (see Fig. 13)34
Potential switchover costs
There are a variety of factors which will influence any decisions to move towards
greater reliance upon the products of the Canadian oil sands in the US refining industry.
As has been mentioned in other sections, the base oil has significant implications for the
production of a refinery. There are also factors not associated with the inputs of
refineries which are likely to have significant impact in the short term. 34 www.capp.ca/raw.asp?x=1&dt=PDF&dn=83040, April 10, 2005.
22

While switchover is more likely among current markets for Canadian exports, a
breakthrough into PADD III would be a significant step for Canadian oil sands producers.
To this end, there are a number of potential strategies that companies could employ to try
to make their product more appealing to the US Gulf Coast market (USGC). One of the
strategies is to create a blend which mimics the current inputs of refineries in this region.
There is also the issue of ease of transportation for the product. Much of the heavy, sour
capacity in the USGC refinery region is dedicated to Venezuelan and Mexican crudes
which is transported via tanker ships. Venezuela has the largest conventional reserves
(78 billion barrels) in the Western Hemisphere, and the export numbers in Figure 18 do
no account for petroleum exports which are refined in the Caribbean, and then taken to
the US.35 Some portions of the Saudi Arabian imports are also heavier blends of crude.
But Saudi Arabia produces a variety of different grades of crude from its fields, so
supplies a number of different base oils to refiners.
35 www.eia.doe.gov/emeu/cabs/venez.html, April 14, 2005.
23

Figure 17 Gulf Coast Refinery Demand36
Given the relationship between Venezuela, Mexico, and the US in refining terms,
it may be difficult to easily penetrate the heavy sour market which would be more in line
with oil sands production. A more likely alternative is to mix synthetic crude production
with Athabasca bitumen to in a 60-40 ratio to produce a medium sour blend. This would
give the oil sands produces access to the next largest portion of the USGC refining
industry that they could reasonably expect to compete in. The light crude segment is
slightly larger than the medium sour, but there is no reasonable expectation of being able
to produce a light crude from the oil sands.
36 www.capp.ca/raw.asp?x=1&dt=NTV&e=PDF&dn=62752, April 11, 2005.
24

Figure 18 An Acceptable Mix?37
Figure 19 Venezuelan oil production and exports to the US38 37 www.capp.ca/raw.asp?x=1&dt=NTV&e=PDF&dn=62752, April 11, 2005.
25

Another point which must be highlighted is the current broad trend in the US
refining industry as regards the physical plants themselves. There has been a consistent
trend towards more complex, larger capacity refineries over the past 55 years. Newer
refineries come online with greater capacity, and a greater array of outputs based on
inputs than have previously been available. But the overall number of refineries is
declining. Most of the refineries which close are those older installations with lower
capacity and a simpler product slate. These closures are not unreasonable due to the
current range of products which are desired from refining, and the closures are justifiable
from an efficiency of production point of view. The danger in the increasing reliance on
larger refineries in decreasing numbers is the risk of supply disruption in the event of
unscheduled downtime for these operations. An example of this was seen in the recent
fire and damage at BP’s refinery outside of Houston. This 450,000 barrel a day refinery
is responsible for 3% of US refining. In the wake of the accident, gasoline prices spiked
due to supply fears since the accident meant that there would be a lower gasoline supply
in the market.39
Answers in how to deal with this trend are difficult, and it is not an issue which is
broadly acknowledged in many circles.
38 www.eia.doe.gov/emeu/cabs/venez.html, April 14, 2005. 39 http://news.bbc.co.uk/1/hi/world/americas/4377519.stm, March 24, 2005.
26

Figure 20 A Problem with the US Refining Industy?40
There are other issues associated with the refining industry in the US which must
be considered as well. Two issues which I will highlight are jointly part of the overall
third component.
The first significant component to recognize is the cost associated with switching
base inputs. To achieve the best results, a refinery should be tailored to a specific
signature of crude oil. If an existing unit is to move to a new base, extensive
modifications must be made in order to achieve the maximum efficiency level which is
possible.
The second component to consider is the current clean air legislation. In 1990,
and amendment to the Clean Air Act was amended to attempt to decrease emissions on a
national level. There are obviously a number of different foci for this legislation. The
refining industry is affected in two ways. There are direct emissions from there plants
which must be addressed. And then there is a significant portion of the legislation which 40 www.capp.ca/raw.asp?x=1&dt=NTV&e=PDF&dn=62752, April 11, 2005.
27

deals with emissions from automobiles. These considerations take a number of forms.
There are attempts to increase the fuel efficiency of vehicles, in order to decrease
emissions through that route. But there are also new regulations in place regarding the
quality of fuel, as this is another significant factor in emissions.41 These combined issues
mean that there will be many refiners who find it necessary to modify their plants in order
to be compliant with these new regulations.
The Clean Air Act and the base fuel switchover are both significant cost
considerations. Each set of modifications on its own would likely run into the tens, if not
hundreds of millions of dollars. Combined, these expenses may be more than many
refiners would be able to bear for reasonable results. Some may be able to afford both,
but the question of their company strategy will also come into play. If they do not wish
to switch base oils as they feel they have a reliable supply of another kind, then it would
not be to their advantage. Refineries that may be wish to switch base oils may not be
able to, or at least not at the same time. They may be able to afford the separate
procedures at different times. Given the two modifications, it is likely that those which
pertained to the Clean Air Act would be given priority due to potential penalties for non-
compliance. This situation is likely currently complicating many decisions regarding
future input base for refiners. Once these considerations are dealt with, I would expect
greater emphasis to be place upon the base oil situation by companies.
41 www.nsc.org/ehc/mobile/acback.htm, April 14, 2005.
28

Transportation
Since the late 1990’s, pipeline capacity out of Western Canada has increased by
550,000 barrels a day. But still greater capacity is needed with continued expanision of
the oil sands. CAPP has estimated that there must be at least a 600,000 barrel per day
increase in capacity within the next decade.42
Figure 21 Existing Major Pipeline Capacity43
There are a number of routes which have been proposed which would lead to
increased pipeline capacity from Western Canada to the US. The two major proposals
identified in a paper for CAPP were a western line, to take production from Hardisty to
the Californian market, and a new line to Chicago with a potential reversal of an existing
line which would take production on to Cushing, Oklahoma.44 Another option which was
highlighted was a potential line to Prince Rupert, from which production could be
transported by tanker to other destinations. This option will be discussed in greater detail
42 www.capp.ca/raw.asp?x=1&dt=PDF&dn=83040, April 10, 2005. 43 www.capp.ca/raw.asp?x=1&dt=PDF&dn=83040, April 10, 2005. 44 www.capp.ca/raw.asp?x=1&dt=NTV&e=PDF&dn=62752, April 11, 2005.
29

in the section on other alternatives (for Canadian producers). The current situation would
favour development of the Prince Rupert line. However this judgment is predicated upon
the American refiners not adding more capacity for heavy oil. If US refiners did follow
such a route, and introduced more dedicated heavy oil capacity that would change the
economic situation for determination of optimal pipeline expansion routes.
Figure 22 Expected Netbacks of Pipeline Alternatives45
Figure 23 Estimated Costs of Pipeline Options46
45 www.capp.ca/raw.asp?x=1&dt=NTV&e=PDF&dn=62752, April 11, 2005. 46 www.capp.ca/raw.asp?x=1&dt=NTV&e=PDF&dn=62752, April 12, 2005.
30
Other alternatives
Alternative markets for Canadian exports
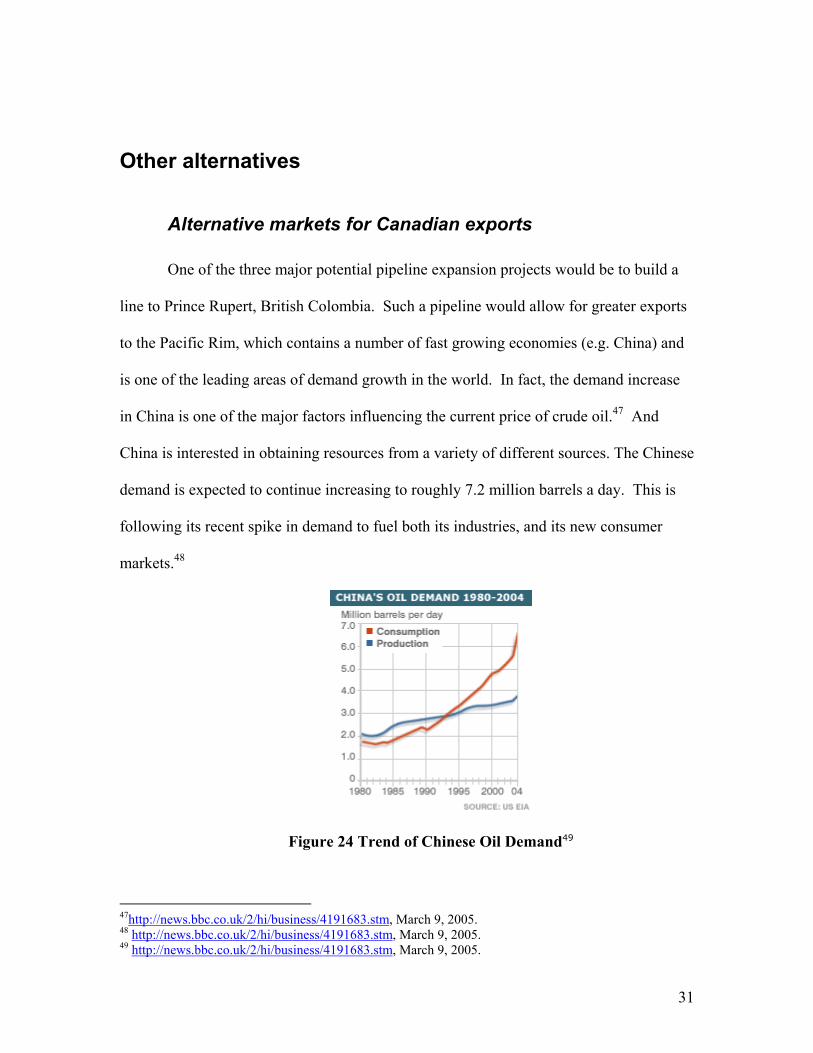
One of the three major potential pipeline expansion projects would be to build a
line to Prince Rupert, British Colombia. Such a pipeline would allow for greater exports
to the Pacific Rim, which contains a number of fast growing economies (e.g. China) and
is one of the leading areas of demand growth in the world. In fact, the demand increase
in China is one of the major factors influencing the current price of crude oil.47 And
China is interested in obtaining resources from a variety of different sources. The Chinese
demand is expected to continue increasing to roughly 7.2 million barrels a day. This is
following its recent spike in demand to fuel both its industries, and its new consumer
markets.48
Figure 24 Trend of Chinese Oil Demand49
47http://news.bbc.co.uk/2/hi/business/4191683.stm, March 9, 2005. 48 http://news.bbc.co.uk/2/hi/business/4191683.stm, March 9, 2005. 49 http://news.bbc.co.uk/2/hi/business/4191683.stm, March 9, 2005.
31

2005 - 7.2 million barrels a day 2004 - 6.6 million barrels a day
2005 demand seen up 9% 2004 demand up 15%
43% of oil used by industry 34% used by cars
Sources: US EIA, IEA
Figure 25 Demand Statistics for China’s Oil Consumption50
An export pipeline to the West Coast would benefit heavy producers’ more than
synthetic light producers. Pipelines in this direction would serve either the California
market, or export facilities targeting to Asian markets.51 At the current time, it is
estimated that there is approximately 100,000 barrels a day demand for the products of
the oil sands in the North Asian market. At the same juncture, there is estimated to be a
market of at least 300,000 barrels a day demand in the Californian market which could be
accessed if a pipeline where built to the West Coast (Prince Rupert).52
But there is significant potential for future demand increase in the Asian market,
and a number of factors could combine to highlight the attractiveness of Canadian oil
sands exports to the region. The majority of US refineries are configured for oils which
produce an array of products, ranging from the light, through the heavy components.
Canadian synthetic blends have little in the way of these light and heavy components, and
are strongly weighted in the middle of the production slate. This petrochemical signature
is more commonly associated with the refineries and base oils of Asian refineries. These
refineries are generally of a simpler set up than current US operations.53 But this match
50 http://news.bbc.co.uk/2/hi/business/4191683.stm, March 9, 2005. 51 www.capp.ca/raw.asp?x=1&dt=NTV&e=PDF&dn=62752, April 11, 2005. 52 www.capp.ca/raw.asp?x=1&dt=NTV&e=PDF&dn=62752, April 11, 2005. 53http://library.iea.org/dbtw-wpd/textbase/work/2004/opec/knapp.pdf, May 20, 2004.
32

between the output of oil sands operators, and the refineries in Asia could prove to be an
interesting dynamic in the future.
Alternative sources for American imports
There are a variety of oil producing regions around the world which could
feasibly supply US demand in the future. Many of these nations already supply the US to
some degree. Among the other areas of supply are the Middle East, which still boasts the
largest conventional crude oil inventories in the world, Venezuela, with its large deposits
of heavy oil, and Africa, principally Nigeria. There are pros and cons associated with
each of these areas as a potential source. In each case, the crude blends marketed by
these areas has a more complete hydrocarbon complement than is offered by Canadian
producers (although not much more complete in the case of Venezuela). This point is
important to the refiners from the production view and the slate of products that they can
produce from these imports. One of the major advantages of the Canadian production is
the security and stability of supply. Canada is a stable, democratic nation, with a free
market economy. This is an appealing combination compared to the instability in areas
like the Middle East and Nigeria. Venezuela has also had a number of differences with
the US during the Chavez presidency, although that has not yet had significant impact on
the physical flow of oil from Venezuela to the US. So the security of supply could be a
major argument in favour of some American refiners moving to Canadian oil sands
production as a base supply. The market access in these regions could also be a
significant factor. Canada and the US share a contiguous border, and already have
significant infrastructure in place between the two nations for the exchange of oil and
natural gas. The US is the nearest major market to Canada, and Canada offers a reliable
33

supply to the US with a level of confidence in the reserves figures and estimates. Other
producing areas are located at further distances from the US, near to other major markets
and developing markets. The Middle East supplies output to the US, Europe, and Asian
markets. With demand increasing in Asia and Europe, it is possible that the production
from this region may move more towards these markets than to the US due to relative
ease of transport, combined with economic factors. African supply may increasingly
come to supply Europe, although this is a more arguable point due to the similar
transportation issues facing both European and American markets depending on the
producing region within Africa. There is also the possibility that production from Nigeria
and Venezuela could move south towards the expanding Brazilian economy. If demand
climbs there, it could prove to be a major market. This scenario would likely take some
time to fully express itself, and the current supply situation is likely to be maintained for
the near future.
34

Figure 26 World Oil Flows54
So the current supply situation for the US is likely to be relatively stable for the
near future. The longer term prospects seem to indicate that there may be a number of
potential shifts in the supply chain. The timing of such shifts, as perceived by different
players in the industry may well be what drives a change in refineries base oils forward.
54 www.eia.doe.gov/emeu/security/oilflow2.gif, April 13, 2005.
35

Conclusions
The potential for significant impacts on the American refining industry from the
continued growth of production from the Alberta oil sands can be seen from the situations
described throughout the paper. The Alberta reserves in the oil sands offer a stable, long
term supply of bitumen and bitumen derivatives which can be utilized by the US refining
industry. The US refining industry, which is the worlds’ largest, is currently facing a
number of different challenges. Some of these challenges relate to the sources of their oil
supply, and strategic decisions they must make about those situations. Other decisions
relate to the status of legislation regarding the operations and products of their business.
There are also a number of regional differences within the industry, with significant
variability in capacity and style of production depending on the PADD of the operation.
There are also separate alternatives available to both American refiners and
Canadian producers. American refiners can continue to rely on imports from other areas
of the globe, due to potential benefits relating to the slate of products which can be
produced from different crudes. Canadian producers have the option of potentially
exploring new markets for their production, such as Asia. There is currently a great deal
of interest in nations such as China in securing supplies for their energy and industrial
future. There are a variety of options which both Canada and the US could proceed in
these matters.
But the nearness of the American market and the reliability of the Canadian
supply will likely be major factors in the determining the shape of events to come. The
demand for oil and petroleum products is still increasing globally, and there will be many
developments which affect those markets in the future.
36

References http://library.iea.org/dbtw-wpd/textbase/work/2004/opec/knapp.pdf http://news.bbc.co.uk/2/hi/business/4191683.stm http://news.bbc.co.uk/1/hi/world/americas/4377519.stm http://pubs.usgs.gov/fs/fs70-03/fs070-93.html www.capp.ca/default.asp?V_DOC_ID=675 www.capp.ca/default.asp?V_DOC_ID=688 www.capp.ca/raw.asp?x=1&dt=NTV&e=PDF&dn=62752 www.capp.ca/raw.asp?x=1&dt=PDF&dn=83040 www.eia.doe.gov/emeu/cabs/canada.html www.eia.doe.gov/emeu/cabs/venez.html www.eia.doe.gov/emeu/security/oilflow2.gif www.eia.doe.gov/oiaf/aeo/forecast.html www.eia.doe.gov/pub/oil_gas/petroleum/analysis_publications/oil_market_basics/Dem_image_US_Regl_Cons.htm www.eia.doe.gov/pub/oil_gas/petroleum/analysis_publications/oil_market_basics/Dem_image_Consumption.htm#Click%20on%20regional%20area%20to%20see%20detail www.eia.doe.gov/pub/oil_gas/petroleum/analysis_publications/oil_market_basics/paddmap.htm www.eia.doe.gov/pub/oil_gas/petroleum/analysis_publications/oil_market_basics/Refining_text.htm#Crude%20Oil%20Quality www.eia.doe.gov/pub/oil_gas/petroleum/analysis_publications/oil_market_basics/Refining_text.htm#U.S.%20Refining%20Capacity www.eia.doe.gov/pub/oil_gas/petroleum/analysis_publications/oil_market_basics/Trade_image_usregl_imp.htm www.emis.platts.com/thezone/guides/platts/oil/glossary.html
37

www.energy.gov.ab.ca/osd/docs/consult/doemarpre.pdf www.energy.gov.ab.ca/docs/oilsands/pdfs/osgenbrf.pdf www.eub.gov.ab.ca/bbs/new/newsrel/2003/pdf/nr2003-26.pdf www.nsc.org/ehc/mobile/acback.htm
38