alastair j alastair waves and extr eme ev ents in …...rogue wa v es and extr eme e v ents in...
TRANSCRIPT
Rogue
wavesand
extreme
eventsin
measured
time-series
Alastair
D.Jenkins 1,A
nneK
arinM
agnusson 2,AndreasN
iedermeier 3,
JaakM
onbaliu4,A
lessandroToffoli 4,and
Karsten
Trulsen
5
1BjerknesC
entreforC
limate
Research,B
ergen,Norw
ay2N
orwegian
MeteorologicalInstitute,B
ergen,Norw
ay3Faculty
ofMathem
atics,T.U.M
unich,Germ
any4K
.U.Leuven,B
elgium5D
epartmentofM
athematics,U
niversityofO
slo,Norw
ay
Alastair.Jenkins@
bjerknes.uib.nohttp://w
ww.gfi.uib.no/˜jenkins
Introduction
MA
XW
AV
Eproject
–F
undedbyC
.E.C
.,2000-2003
–W
orkPackage
2,Extrem
ewave
statisticsfrombuoy
records
–R
eportavailable:
–http://w
3g.gkss.de/projects/maxwave/
Work
packagesW
P2
Extrem
ewave
statisticsfrombuoy
recordsW
P2
report(finalversion)
–http://w
3g.gkss.de/projects/maxwave/w
p2rep138pages1-93.pdf
Locations:
–E
kofiskand
Draupner
fields,North
Sea
–B
elgiancoastalw
aters
Analysis
procedures
Extrem
e-valuestatistics
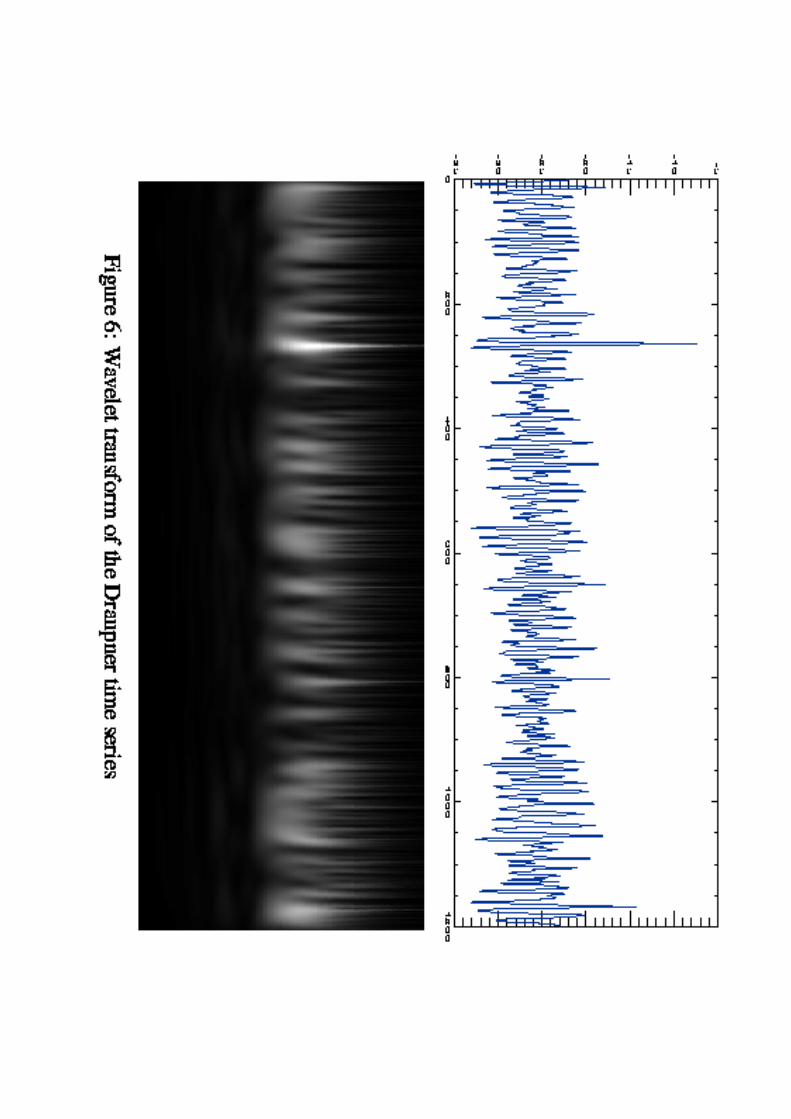
Waveletanalysis
HA
CY
Manalysis
Quasi-Lagrangiancorrection
ofbuoym
otion
Propagation
oftime
seriestootherlocationsusing
linearandnonlineartechniques


Locationofobservations
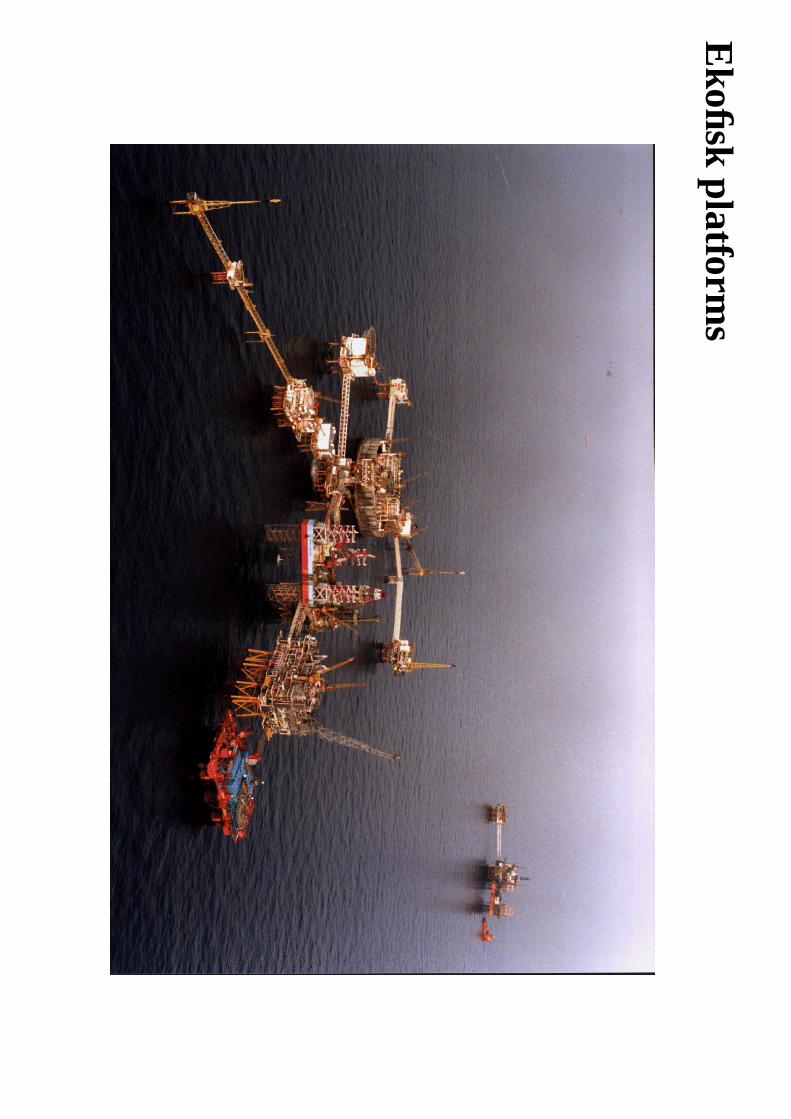
Ekofisk
platforms
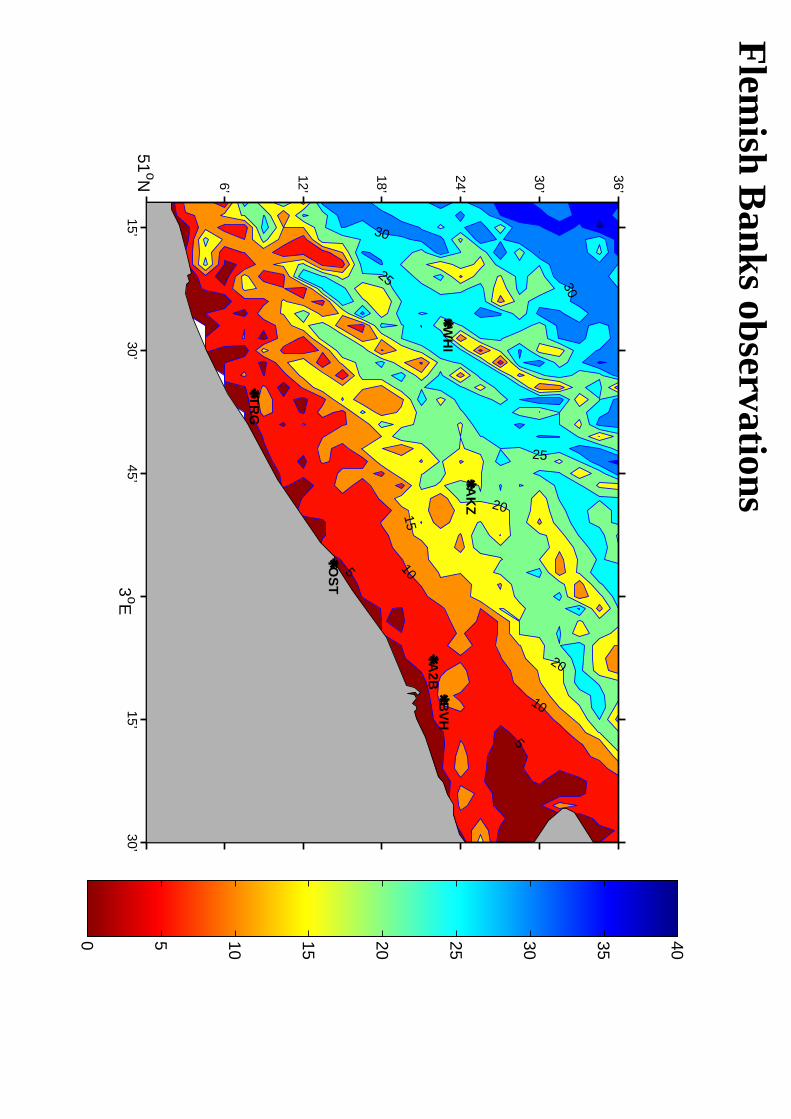
Flem
ishB
anksobservations
0 5 10 15 20 25 30 35 40
10
2015
5
10
5
20
25
3030
25
15’ 30’
45’ 3
oE
15’ 30’
51oN
6’
12’
18’
24’
30’
36’
WH
I
AK
Z
BV
HA
2B
TR
G
OS
T

Draupner
event(1995-01-0115:20U
TC
)��� �
��
0�
20
0
�
40
0
�
60
0
�8
00
�
10
00
12
00
-35
-30
-25
-20
-15
-10 -5
22
02
40
26
02
80
30
0-3
5
-30
-25
-20
-15
-10 -5
������

HA
CY
Manalysis
Firstapplied
tooceanw
avesbyB
uckley(1983
Tech.Rep.D
WT
NS
R&
DC
).
The
heightsofsuccessiveextrem
epoints(w
avecrestsand
valleys)areplotted
againsteachother. aS
mallerw
avesondifferentsealevels
givepoints
nearthebisecting
lineofthe
plottingquadrant.H
ighw
avesyieldpoints
faraway
fromthe
diagonal.The
up-goingw
avesareon
theleftupperside
ofit,thedow
n-goingw
avesonthe
lowerrightside.
The
HA
CY
Mm
ethodshouldprovide
agood
methodofidentifying
typicalshapesofextrem
ewaves,and
itsvalue
would
beenhancedif
thesecanbe
associatedwith
hydrodynamic
phenomena.
aLetx
ii
Ibe
theextrem
aofthesignalf
:RR
.A
sH
AC
YM
analysiswe
considerthepoint
setf
xi
fx
i1
R2;i
i1
Iw
hichis
sometim
esdiscretised
inform
ofatw
odim
ensionalhistogramon
h0 Z
2R
2,whereh
0
issom
ewave-heightquantisation,e.g.h
00
1[m
etres].

HA
CY
Manalysis
plotfrom
theD
raupnerdata
setof
1995-01-0115:20U
TC
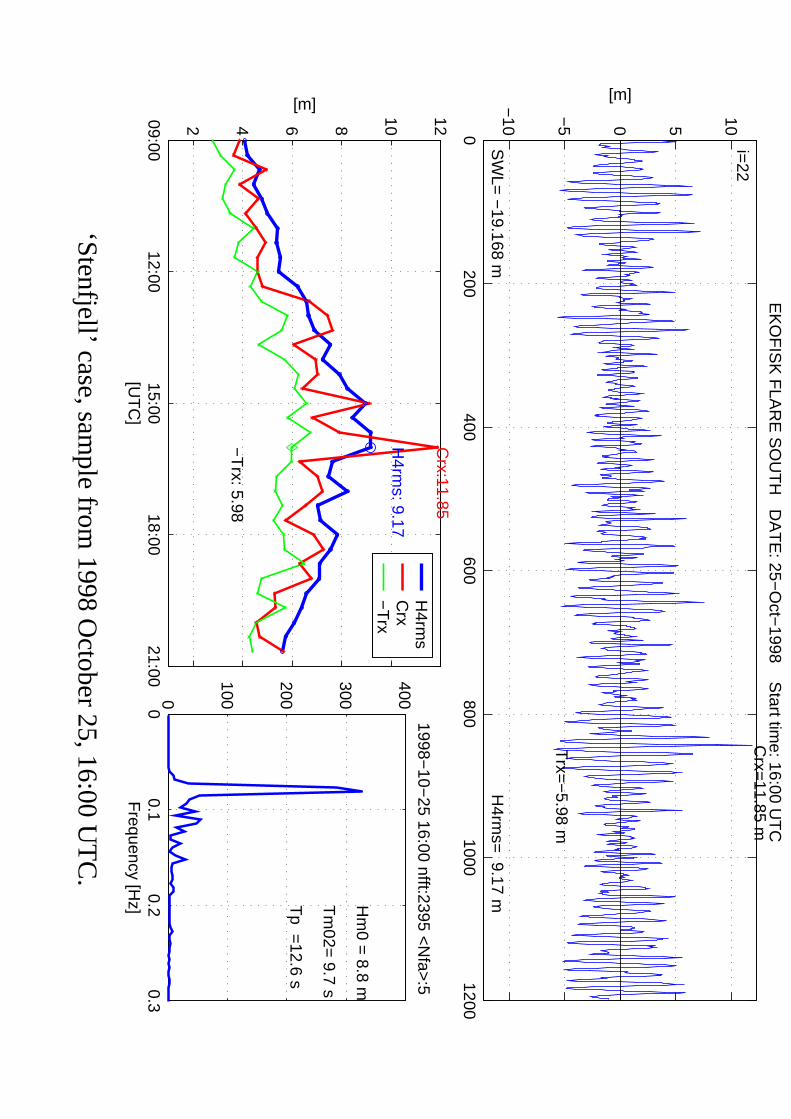
09:0012:00
15:0018:00
21:00
2 4 6 8 10 12
H4rm
s: 9.17
Crx:11.85
−T
rx: 5.98
[UT
C]
[m]
H4rm
sC
rx−
Trx
0200
400600
8001000
1200
−10
−5 0 5 10
i=22
[m]
EK
OF
ISK
FLA
RE
SO
UT
H D
AT
E: 25−
Oct−
1998 Start tim
e: 16:00 UT
C
SW
L= −
19.168 mH
4rms=
9.17 m
Crx=
11.85 m
Trx=
−5.98 m
00.1
0.20.3
0
100
200
300
400
Frequency [H
z]
1998−10−
25 16:00 nfft:2395 <N
fa>:5
Hm
0 = 8.8 m
Tm
02= 9.7 s
Tp =
12.6 s
‘Stenfjell’case,sam
plefrom1998
October
25,16:00U
TC
.

09:0012:00
15:0018:00
21:00
2 4 6 8 10 12
[m]
Tim
e [UT
C]
WA
VE
RID
ER
H
4rms
Crx
−T
rx
09:0012:00
15:0018:00
21:00
2 4 6 8 10 12
[m]
FLA
RE
NO
RT
HH
4rms
Crx
−T
rx
09:0012:00
15:0018:00
21:00
2 4 6 8 10 12
[m]
EK
OF
ISK
: 1998−10−
25
FLA
RE
SO
UT
HH
4rms
Crx
−T
rx
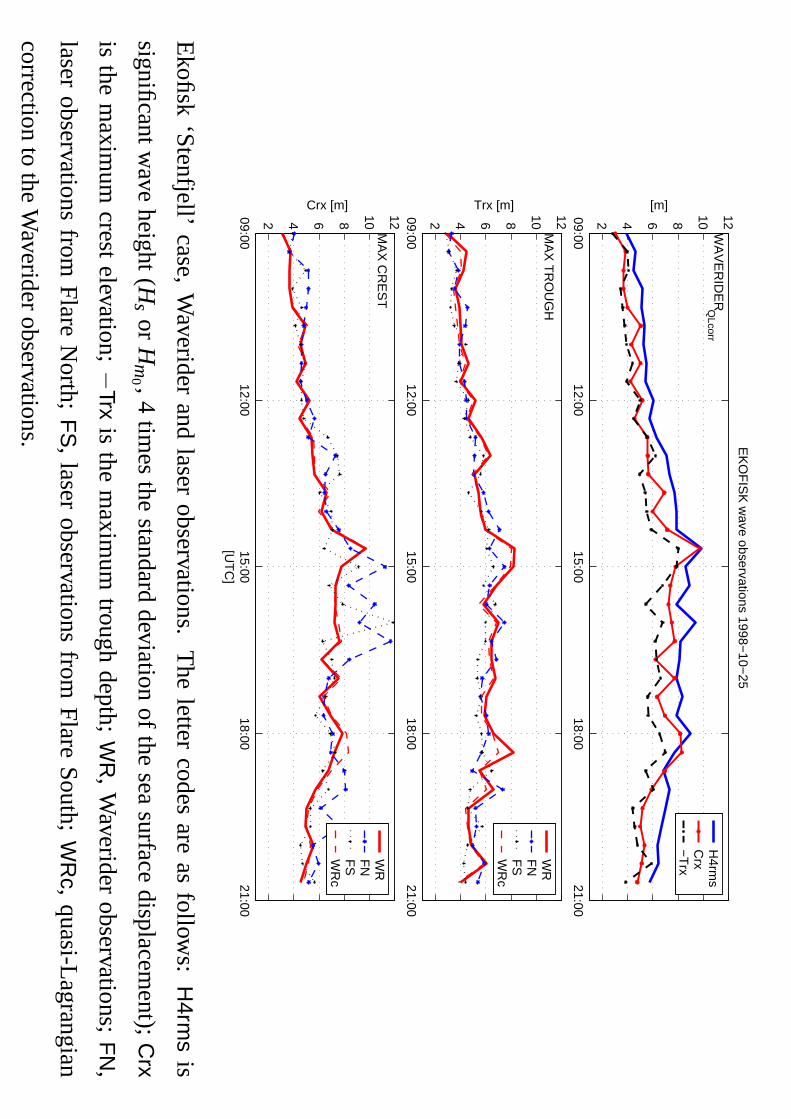
Ekofisk
‘Stenfjell’
case,Waveriderand
laserobservations.T
helettercodesare
asfollo
ws:
H4rm
sis
significantw
aveheight(H
sor
Hm
0 ,4tim
esthe
standarddeviationof
theseasurface
displacement);C
rx
isthe
maxim
umcrestelevation;
Trxis
them
aximum
troughdepth;
WR
,W
averiderobservations;FN
,
laserobservationsfrom
Flare
North;
FS
,laserobservations
fromF
lareS
outh;WR
c,quasi-Lagrangian
correctiontothe
Waveriderobservations.
09:0012:00
15:0018:00
21:00
2 4 6 8 10 12
Crx [m]
[UT
C]
MA
X C
RE
ST
WR
FN
FS
WR
c
09:0012:00
15:0018:00
21:00
2 4 6 8 10 12
Trx [m]
MA
X T
RO
UG
HW
RF
NF
SW
Rc
09:0012:00
15:0018:00
21:00
2 4 6 8 10 12
[m]
EK
OF
ISK
wave observations 1998−
10−25
WA
VE
RID
ER
QLcorr
H4rm
sC
rx−
Trx
Ekofisk
‘Stenfjell’
case,Waveriderand
laserobservations.T
helettercodesare
asfollo
ws:
H4rm
sis
significantw
aveheight(H
sor
Hm
0 ,4tim
esthe
standarddeviationof
theseasurface
displacement);C
rx
isthe
maxim
umcrestelevation;
Trxis
them
aximum
troughdepth;
WR
,W
averiderobservations;FN
,
laserobservationsfrom
Flare
North;
FS
,laserobservations
fromF
lareS
outh;WR
c,quasi-Lagrangian
correctiontothe
Waveriderobservations.
440442
444446
448450
452454
456458
−6
−4
−2 0 2 4 6
EK
OF
ISK
WA
VE
RID
ER
AT
1998−10−
25 14:20
[sec]
[m]
WR
−O
bsW
RQ
L−corr
2piH/(gT
**2)=0.095
H=
12.99m
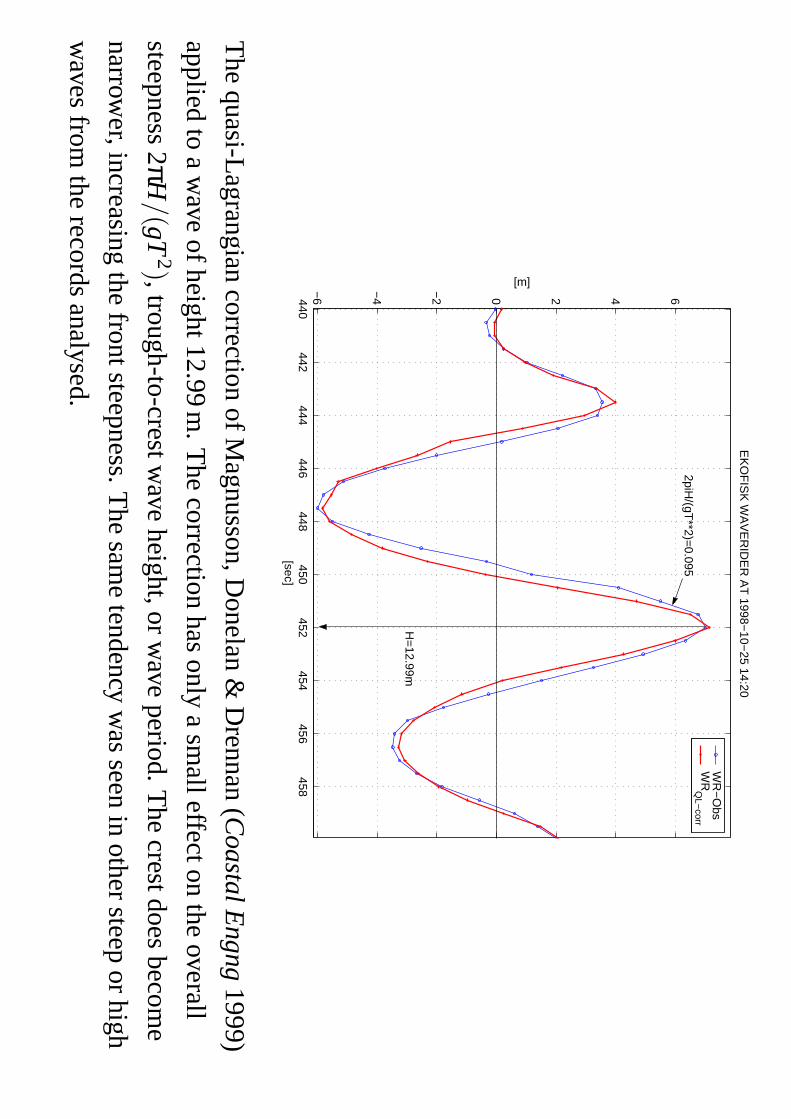
The
quasi-LagrangiancorrectionofM
agnusson,Donelan
&D
rennan(CoastalE
ngng1999)
appliedtoa
wave
ofheight12.99m.T
hecorrection
hasonlya
smalleffecton
theoverall
steepness2πH
gT2
,trough-to-crestwave
height,orwave
period.The
crestdoesbecome
narrower,increasing
thefrontsteepness.T
hesam
etendencyw
asseeninothersteeporhigh
wavesfrom
therecordsanalysed.
34
56
78
910
1112
3 4 5 6 7 8 9 10 11 12
Laser FN
[m]
WR(OBS)2048
[m]
MA
X C
RE
ST
, EK
O−
1998−10−
25
Y =
0.592.X +
1.86
<Y
> =
5.8 m
<X
> =
6.7 m
34
56
78
910
1112
3 4 5 6 7 8 9 10 11 12
MA
X C
RE
ST
, EK
O−
1998−10−
25
WR
−O
bs (2048) [m]
WRQL−corr
[m]
Y =
1.038.X +
−0.11
<Y
> =
5.9 m
<X
> =
5.8 m
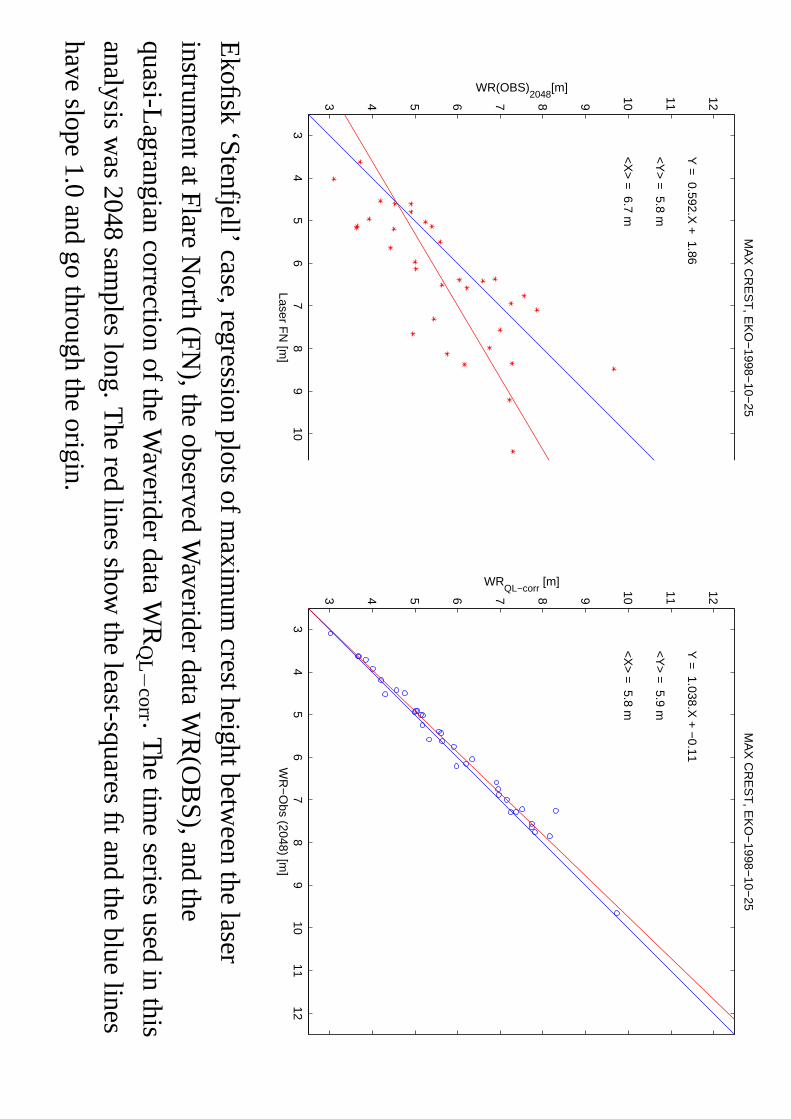
Ekofisk
‘Stenfjell’
case,regressionplotsofm
aximum
crestheightbetweenthe
laser
instrumentatF
lareN
orth(F
N),the
observedW
averiderdataWR
(OB
S),and
the
quasi-Lagrangiancorrectionofthe
WaveriderdataW
RQ
Lcorr .T
hetim
eseriesusedin
this
analysiswas2048
sampleslong.T
hered
linesshow
theleast-squaresfit
andthe
bluelines
haveslope1.0
andgo
throughtheorigin.
21
02
20
23
02
40
25
02
60
27
02
80
29
03
00
31
0
−1
0
−5 0 5
10
15
20
se
co
nd
s
surface elevation[m]D
rau
pn
er tim
ese
ries a
t 01
−Ja
n−
19
95
15
:20
:00
− e
vo
lve
d to
−0
m
Orig
ina
lL
inX
−0
mze
tab
lze
tab
n
26
22
63
26
42
65
26
65
10
15
20
X =
−0
m
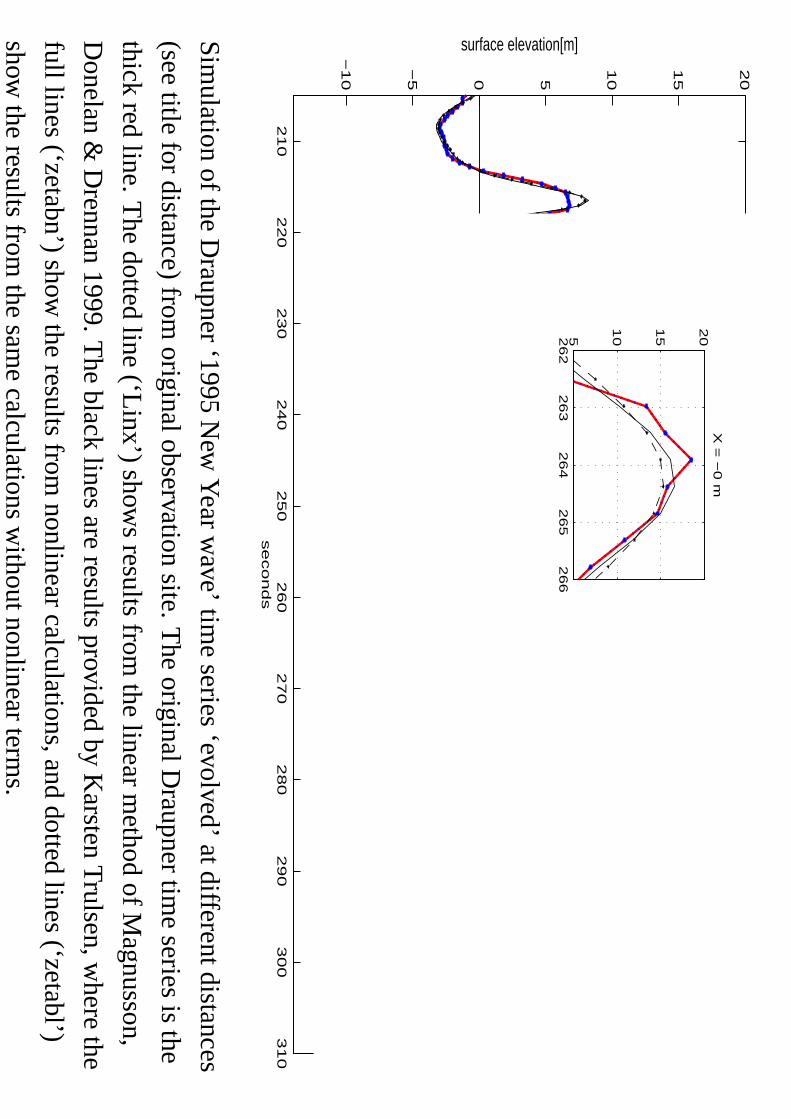
Sim
ulationoftheD
raupner‘1995
New
Yearw
ave’time
series‘evolved’atdifferentdistances
(seetitlefor
distance)fromoriginalobservation
site.The
originalDraupnertim
eseriesis
the
thickred
line.The
dottedline(‘Linx’)
shows
resultsfromthe
linearmethodofM
agnusson,
Donelan&
Drennan
1999.The
blacklines
areresultsprovided
byK
arstenTrulsen,w
herethe
fulllines
(‘zetabn’)showthe
resultsfromnonlinearcalculations,and
dottedlines(‘zetabl’)
showthe
resultsfromthe
samecalculationsw
ithoutnonlinearterms.
21
02
20
23
02
40
25
02
60
27
02
80
29
03
00
31
0
−1
0
−5 0 5
10
15
20
se
co
nd
s
surface elevation[m]D
rau
pn
er tim
ese
ries a
t 01
−Ja
n−
19
95
15
:20
:00
− e
vo
lve
d to
−2
0m
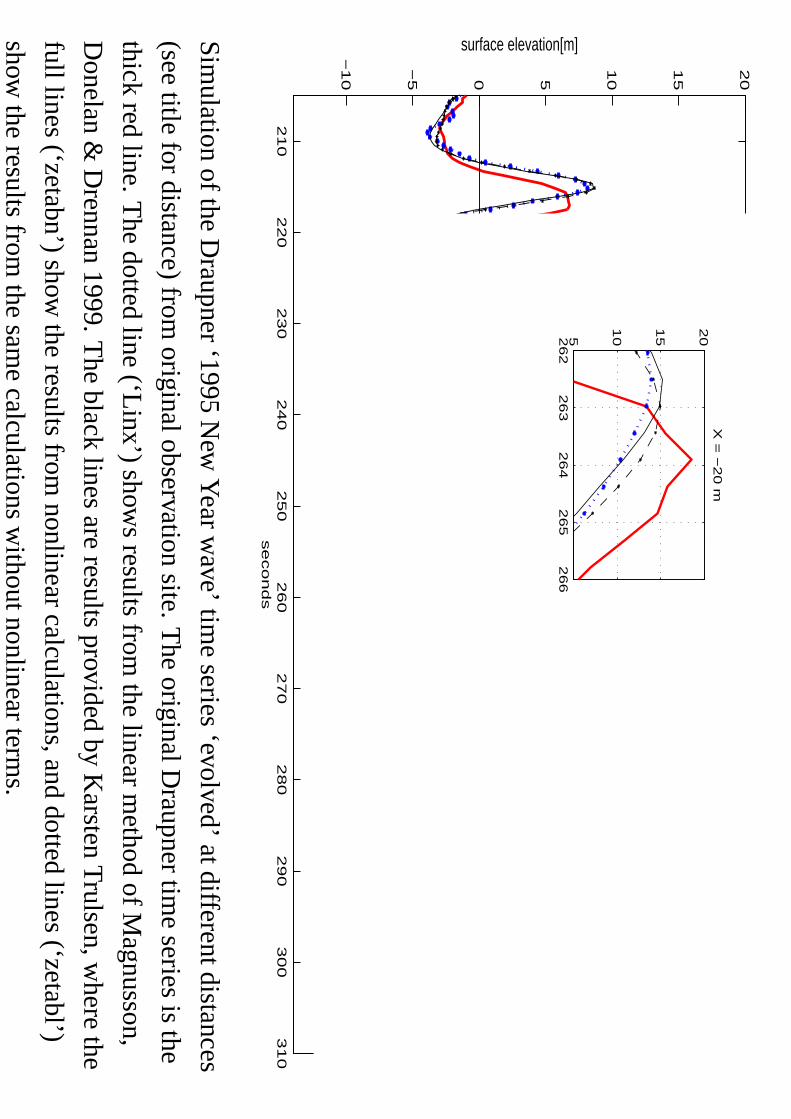
Orig
ina
lL
inX
−2
0m
ze
tab
lze
tab
n
26
22
63
26
42
65
26
65
10
15
20
X =
−2
0 m
Sim
ulationoftheD
raupner‘1995
New
Yearw
ave’time
series‘evolved’atdifferentdistances
(seetitlefor
distance)fromoriginalobservation
site.The
originalDraupnertim
eseriesis
the
thickred
line.The
dottedline(‘Linx’)
shows
resultsfromthe
linearmethodofM
agnusson,
Donelan&
Drennan
1999.The
blacklines
areresultsprovided
byK
arstenTrulsen,w
herethe
fulllines
(‘zetabn’)showthe
resultsfromnonlinearcalculations,and
dottedlines(‘zetabl’)
showthe
resultsfromthe
samecalculationsw
ithoutnonlinearterms.

21
02
20
23
02
40
25
02
60
27
02
80
29
03
00
31
0
−1
0
−5 0 5
10
15
20
se
co
nd
s
surface elevation[m]
Dra
up
ne
r time
se
ries a
t 01
−Ja
n−
19
95
15
:20
:00
− e
vo
lve
d to
−2
00
m
Orig
ina
lL
inX
−2
00
mze
tab
lze
tab
n
Sim
ulationoftheD
raupner‘1995
New
Yearw
ave’time
series‘evolved’atdifferentdistances
(seetitlefor
distance)fromoriginalobservation
site.The
originalDraupnertim
eseriesis
the
thickred
line.The
dottedline(‘Linx’)
shows
resultsfromthe
linearmethodofM
agnusson,
Donelan&
Drennan
1999.The
blacklines
areresultsprovided
byK
arstenTrulsen,w
herethe
fulllines
(‘zetabn’)showthe
resultsfromnonlinearcalculations,and
dottedlines(‘zetabl’)
showthe
resultsfromthe
samecalculationsw
ithoutnonlinearterms.
-8 -6 -4 -2 0 2 4 6 8
01
00
02
00
03
00
04
00
05
00
06
00
07
00
08
00
0
time
se
ries_
hz1
19
98
-10
-25
15
:40
:00
+0
00
0 - 1
99
8-1
0-2
5 1
7:4
0:0
0+
00
00
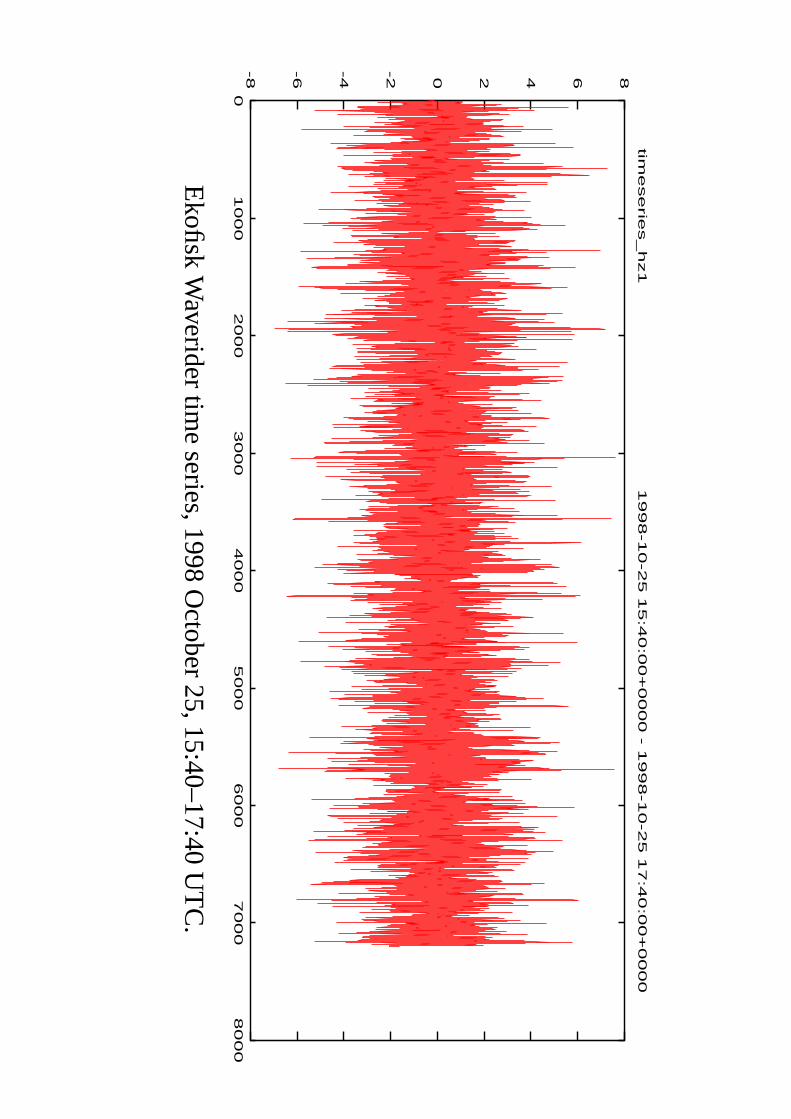
Ekofisk
Waveridertim
eseries,1998
October
25,15:40–17:40UT
C.
-8 -6 -4 -2 0 2 4 6 8
10
12
01
00
02
00
03
00
04
00
05
00
06
00
07
00
08
00
0
time
se
ries_
hz2
19
98
-10
-25
15
:40
:00
+0
00
0 - 1
99
8-1
0-2
5 1
7:4
0:0
0+
00
00
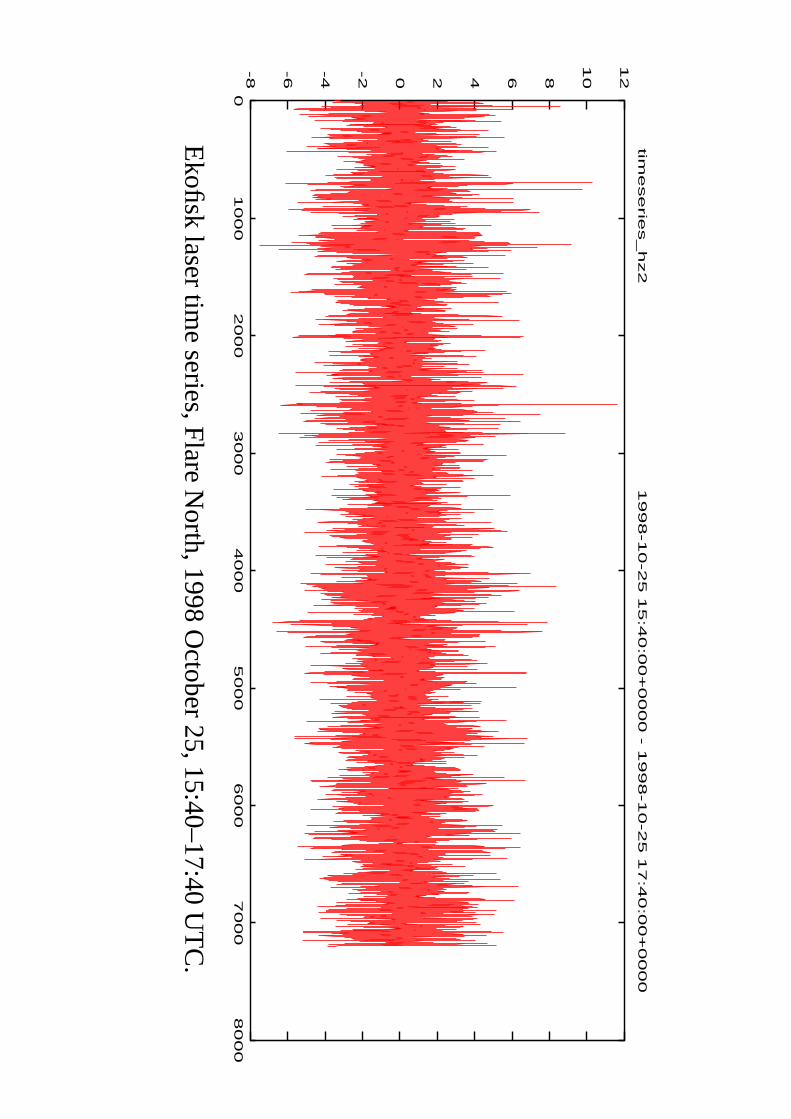
Ekofisk
lasertime
series,Flare
North,1998
October25,15:40–17:40U
TC
.
-8 -6 -4 -2 0 2 4 6 8
10
12
01
00
02
00
03
00
04
00
05
00
06
00
07
00
08
00
0
m
time
/ se
co
nd
s
time
se
ries_
hz3
19
98
-10
-25
15
:40
:00
+0
00
0 - 1
99
8-1
0-2
5 1
7:4
0:0
0+
00
00
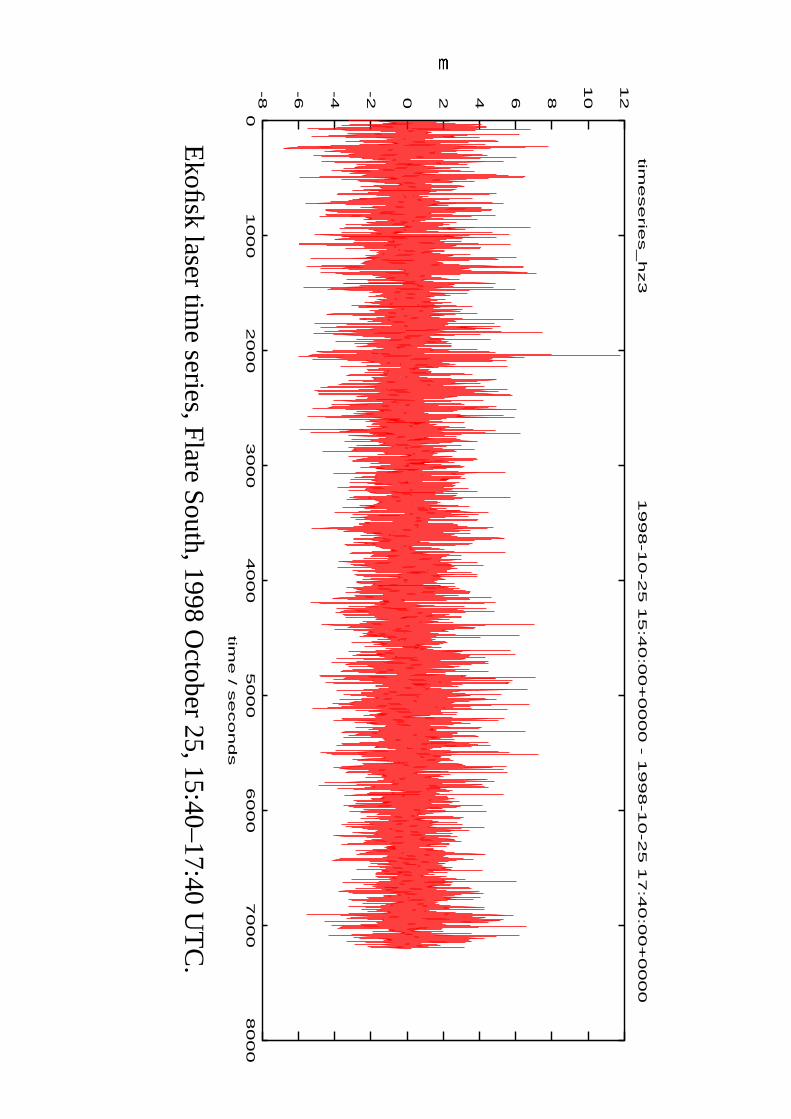
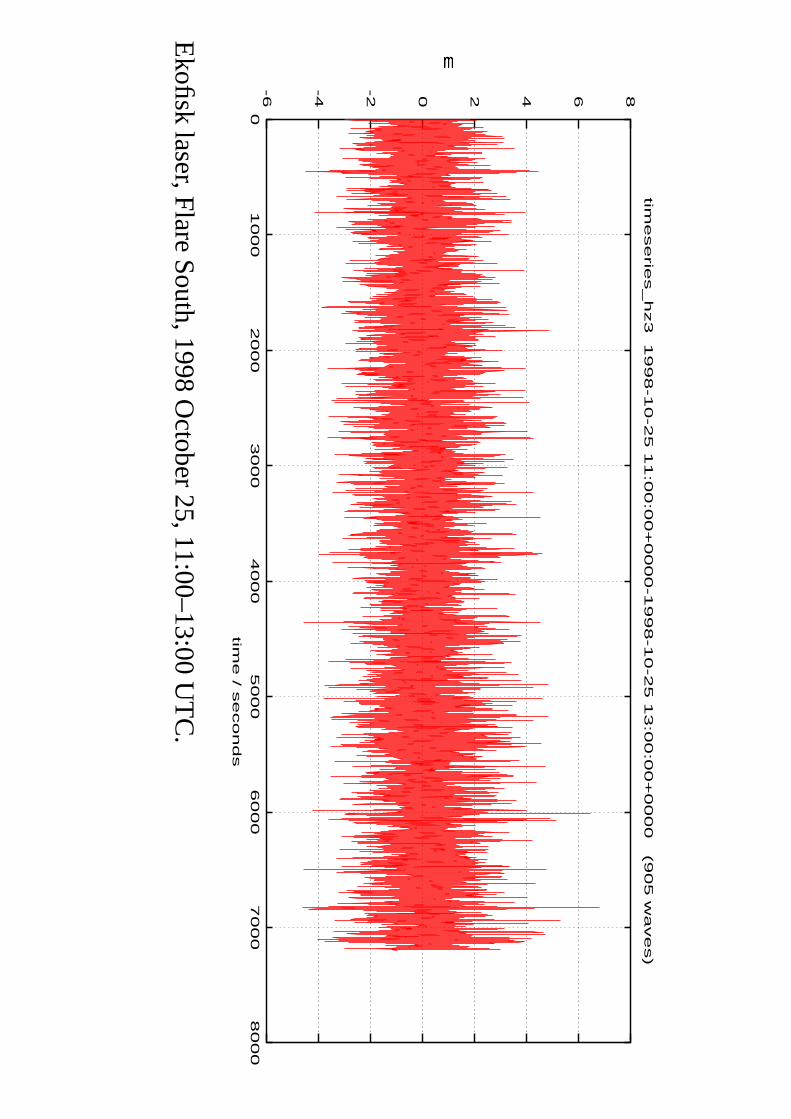
Ekofisk
lasertime
series,Flare
South,1998
October25,15:40–17:40U
TC
.
-8 -6 -4 -2 0 2 4 6 8
10
122
50
02
51
02
52
02
53
02
54
02
55
02
56
02
57
02
58
02
59
02
60
02
61
0
metres�
time
/ s
time
se
ries_
hz2
19
98
-10
-25
15
:40
:00
+0
00
0 - 1
99
8-1
0-2
5 1
7:4
0:0
0+
00
00
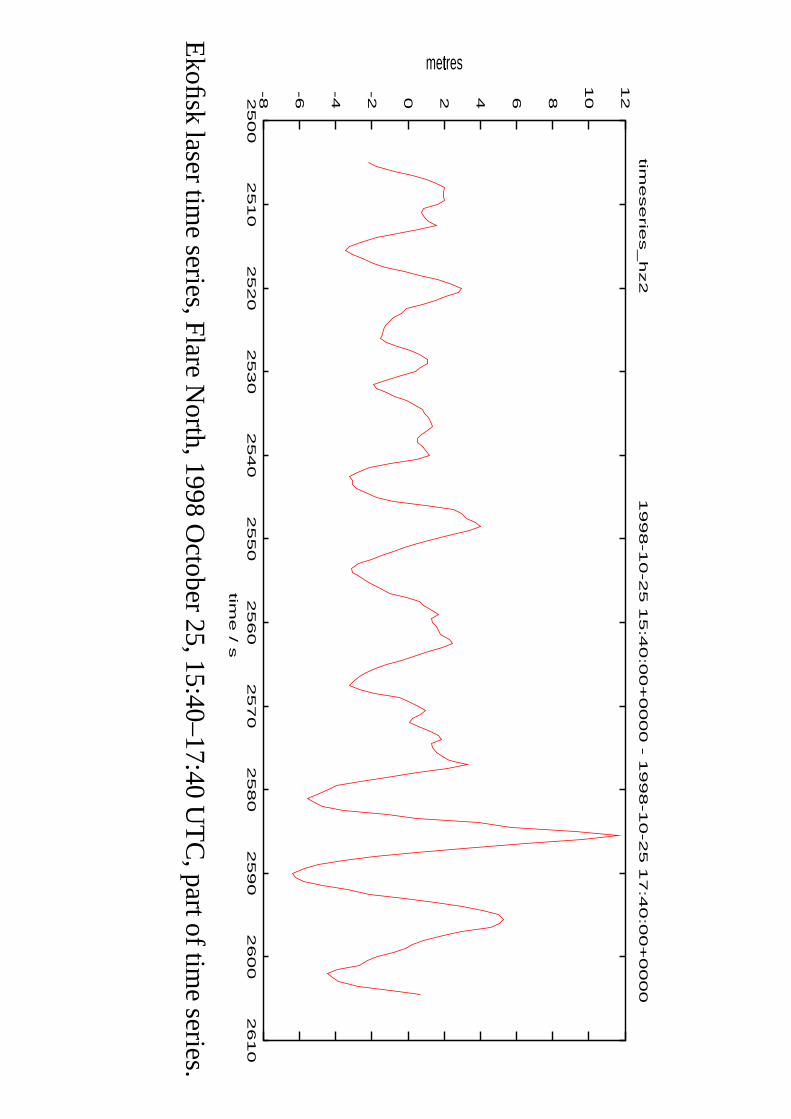
Ekofisk
lasertime
series,Flare
North,1998
October25,15:40–17:40U
TC
,partoftime
series.

-8 -6 -4 -2 0 2 4 6 8
10
122
58
02
58
52
59
02
59
52
60
02
60
5
metres�
time
/ s
time
se
ries_
hz2
19
98
-10
-25
15
:40
:00
+0
00
0 - 1
99
8-1
0-2
5 1
7:4
0:0
0+
00
00
Ekofisk
lasertime
series,Flare
North,1998
October25,15:40–17:40U
TC
,partoftime
series.
-8 -6 -4 -2 0 2 4 6 8
10
121
90
01
92
01
94
01
96
01
98
02
00
02
02
02
04
02
06
02
08
02
10
02
12
0
metres�
time
/ s
time
se
ries_
hz3
19
98
-10
-25
15
:40
:00
+0
00
0 - 1
99
8-1
0-2
5 1
7:4
0:0
0+
00
00
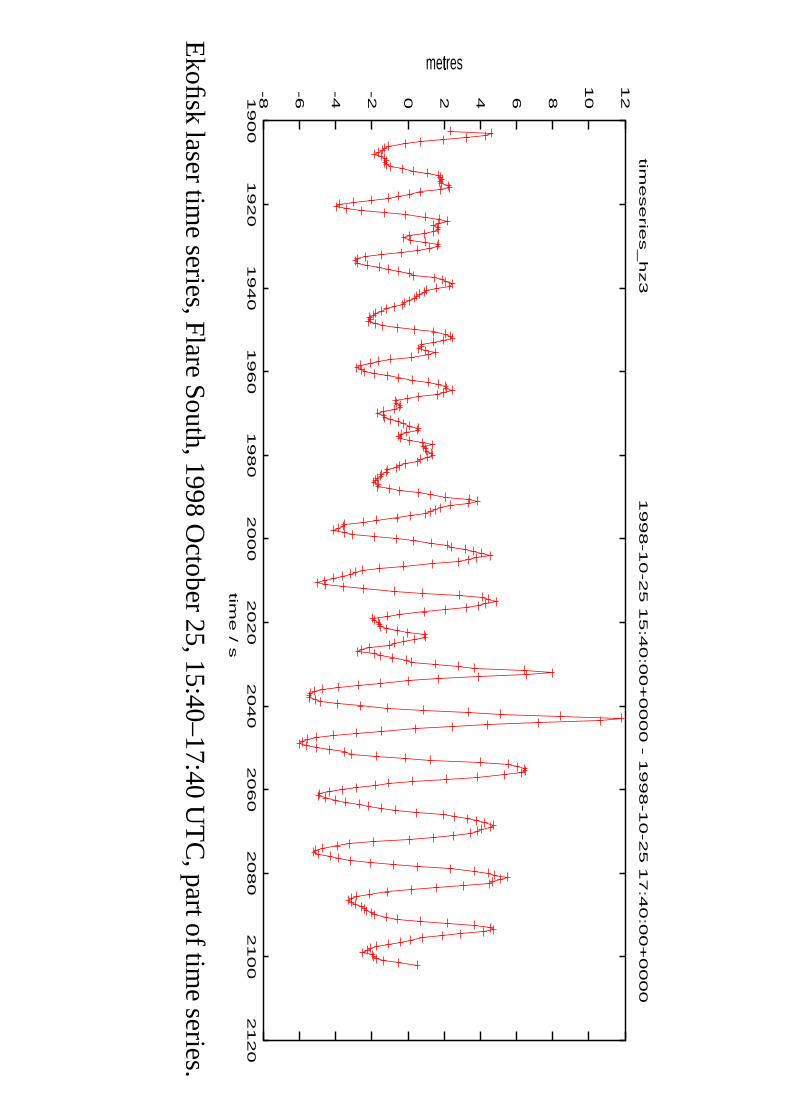
Ekofisk
lasertime
series,Flare
South,1998
October25,15:40–17:40U
TC
,partoftime
series.
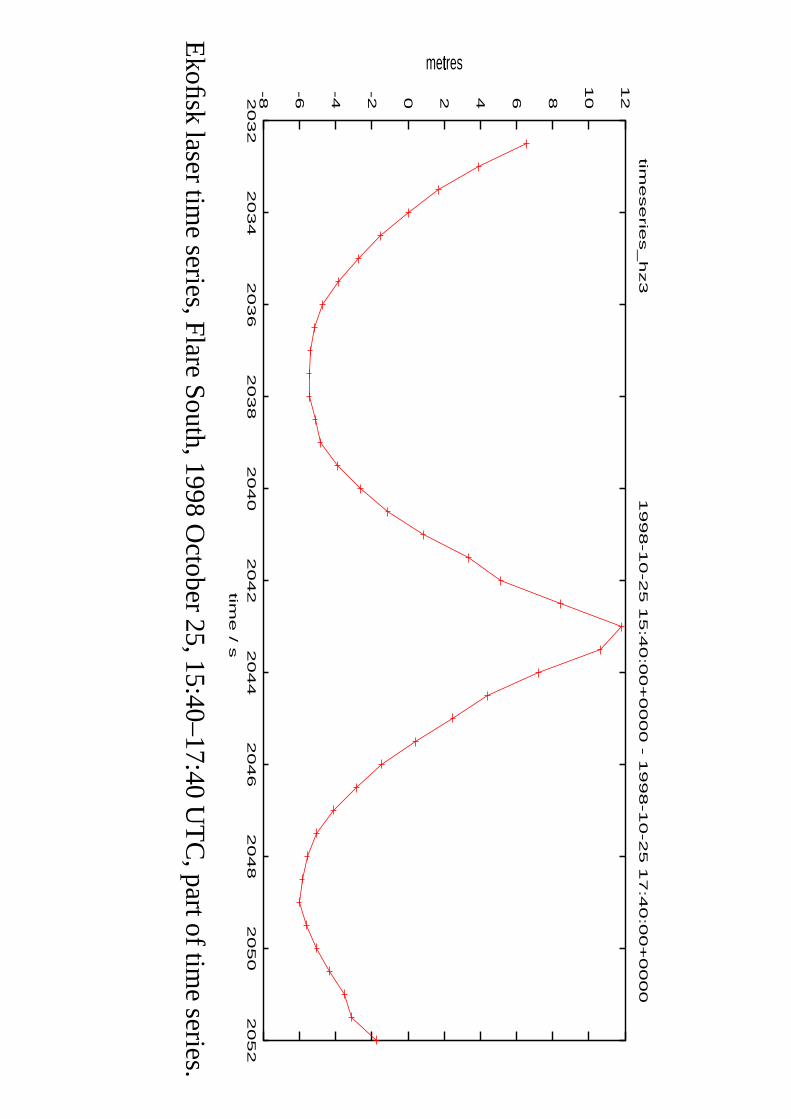
-8 -6 -4 -2 0 2 4 6 8
10
122
03
22
03
42
03
62
03
82
04
02
04
22
04
42
04
62
04
82
05
02
05
2
metres�
time
/ s
time
se
ries_
hz3
19
98
-10
-25
15
:40
:00
+0
00
0 - 1
99
8-1
0-2
5 1
7:4
0:0
0+
00
00
Ekofisk
lasertime
series,Flare
South,1998
October25,15:40–17:40U
TC
,partoftime
series.
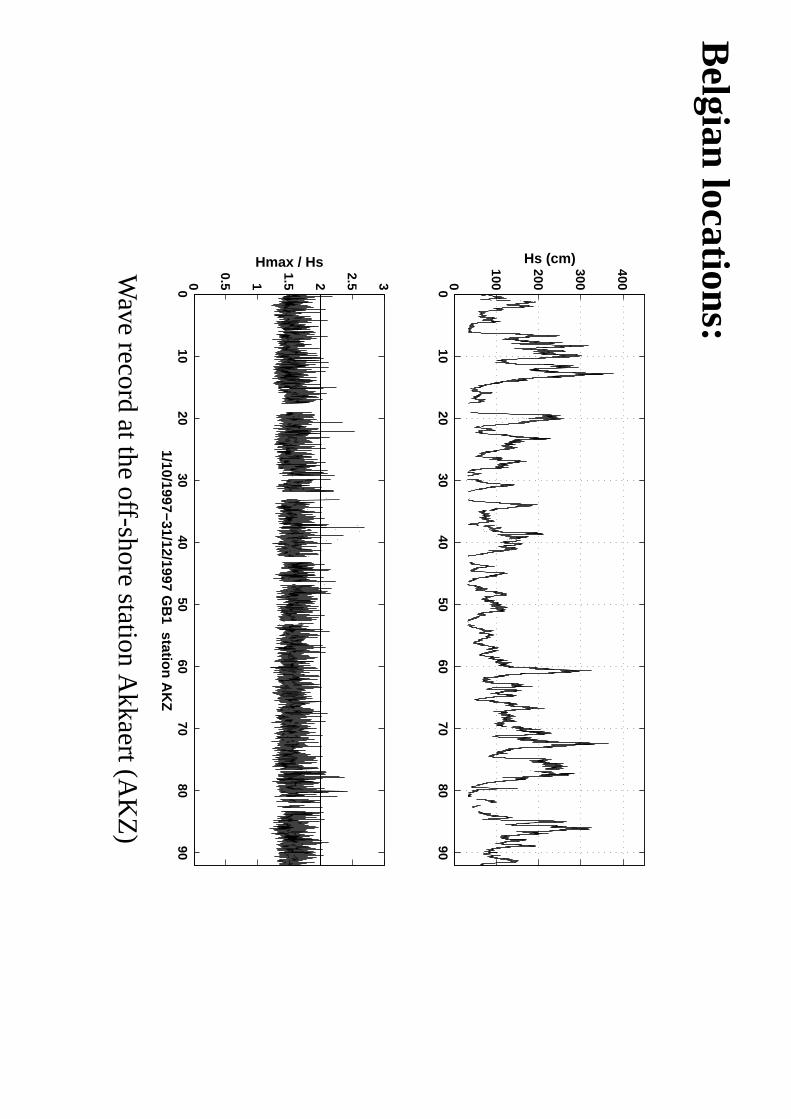
Belgian
locations:
010
2030
4050
6070
8090
0
100
200
300
400
Hs (cm)
010
2030
4050
6070
8090
0
0.5 1
1.5 2
2.5 3
1/10/1997−31/12/1997 GB
1 station AK
Z
Hmax / HsWave
recordatthe
off-shorestationAkkaert(A
KZ
)

010
2030
4050
6070
8090
0 50
100
150
200
250
300
350
Hs (cm)
010
2030
4050
6070
8090
0
0.5 1
1.5 2
2.5 3
1/10/1997−31/12/1997 GB
1 station A2B
Hmax / Hs
Wave
recordatthe
near-shorestationA
2B

0100
200300
400500
600700
800900
−2.5
−2
−1.5
−1
−0.5 0
0.5 1
1.5 2
2.5
time [s]
elevation [m]
Typicalrecord(10
Hz)from
aW
averiderbuoy
closetoZ
eebruggeharbour.
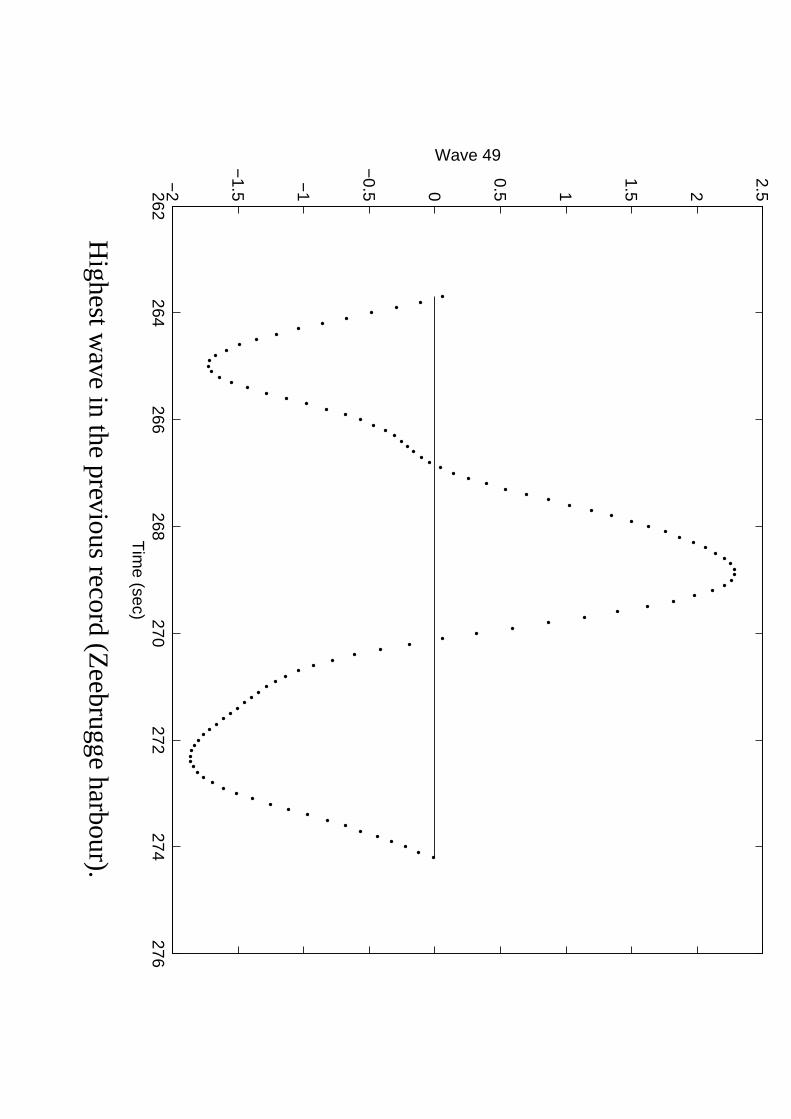
262264
266268
270272
274276
−2
−1.5
−1
−0.5 0
0.5 1
1.5 2
2.5
Wave 49
Tim
e (sec)
Highestw
avein
theprevious
record(Z
eebruggeharbour).
Ekofisk:
cumulative
andextrem
evalue
statistics
Spectralanalysis
andanalysis
ofindividualwaves
Analysedusing
proceduresdescribedby
Rijksw
aterstaat,with
slightmodifications.
Rejectionofpoor-quality
datapoints.
This
couldnotbe
donejustbyrejecting
pointswhich
deviatedby
more
thanfourtim
esthe
standarddeviation
ofthesea-surfacedisplacem
entfromthe
meanw
aterlevel,sincethe
purposeofMA
XW
AV
Eis
toinvestigate
extremew
aves.
Itw
asfoundnecessary
toperform
visualqualitycontrolon
every20-m
inutedatarecord,to
remove
dataerrors.
Sincethe
purposeoftheM
AX
WA
VE
projectisto
investigateextrem
ew
aves,computer
processingfordataquality
controlisregarded
asinadequate,sincetherewould
bea
riskofrem
ovinggenuineextrem
eeventsin
additionto
data‘spikes’.
The
time-consum
ingnatureofthevisualinspectionhasm
eantthatonlyspecifiedstorm
periodshavebeencom
pletelychecked.
Subtractionofthe
meanw
aterlevel

Spectralanalysisinvolving
performingfastFouriertransform
son200-secondsub-series
ofthedata,w
ithcosinetaperingon
theouter10
percentofthesub-series.
Splitting
upthe
dataintoindividualw
avesusingthe
zerodow
n-crossingcriterion.Short
wavesw
itha
periodoflessthan
onesecondare
addedtothe
previousw
aveorto
thenext
wave.
The
dataarestoredin
tablesinan
SQ
Ldatabase
usingfreely
availabledatabasesoftw
are
(PostgreS
QL:http://w
ww.postgresql.org/).
—T
ime
stampin
ISO
format(Y
YY
Y-M
M-D
DH
H:M
M:S
S.S
S+
hhmm
)
—R
ecordinginterval
—N
o.ofsamples(usually2395)
—Table
ofindividualwave
heights
—Table
ofindividualwave
periods
—Totalnum
berofwaves

Hm
axH
eightofthehighestw
ave
H1� 50
Averageheightofthe
highest1/50ofthe
waves
H1� 10
Averageheightofthe
highest1/10ofthe
waves
H1� 3
Significantw
aveheight(I):
averageheightofthehighest1/3
ofthew
aves
Tm
axP
eriodofthelongestw
ave
T1� 3
Averageofthe
periodofthe
longest1/3ofthe
periods
TH
1 3A
verageoftheperiod
ofthehighest1/3
ofthew
aves
HC
MM
aximum
crestheight
HT
DLeveloflow
esttroughdepth
10 Czz
Energy
(variance)densityspectrum
at0.01Hz
intervals
Hm
0S
ignificantwave
height(II)from
spectrum(4
timesthe
standarddeviation)
Tm
02S
pectrallyaveraged
wave
period
fpF
requencyw
here10 C
zzhasits
maxim
um
The
cumulative
distribution(C
DF
)oftheindividualw
aveheights,crestheightsand
troughdepthsfor
specificperiodswere
alsodeterm
inedby
sortingthem
intoincreasing
order
12
3N
.Ifiis
theposition
inthis
ordering,thecorresponding
valueofthe
estimated
CD
Fis
givenby
Fi
N1
.The
CD
Fvaluesare
fittedto
Rayleighdistributions
FR
x1
expx
22β
2(1)
byestim
atingtheparam
eterβto
be∑
i x2i
2N
11� 2.
The
datawere
alsofitted
toto
Weibulldistributions
FW
x1
expx
αγ
(2)
byleast-squaresregressionoflog
log1
Fagainstlog
x,usingthe
upperhalfofthedata
sample(i.e.F
05).
Alternative
methodsinclude
them
aximum
likelihood
methodand
them
ethodofmom
ents,but
theleast-squaresfitting
hastheadvantage
ofsimplicity,and
theupperhalfofthe
distribution
waschosenasw
eare
mainly
lookingfor
theupperextrem
evalues.
Fitting
thew
holesam
plebyleastsquares
regressionisnotso
good,asthesm
allestvaluesof
wave
heightetc.were
foundto
causeanoticeable
adverse(negative)biasin
theparam
eterγ.
0 1 2 3 4 5 6 7
01
23
45
67
8
-log(1-F(x))
Cre
st h
eig
ht / m
time
se
ries_
hz1
19
98
-10
-25
15
:40
:00
+0
00
0 - 1
99
8-1
0-2
5 1
7:4
0:0
0+
00
00
Ra
yle
igh
dis
t.
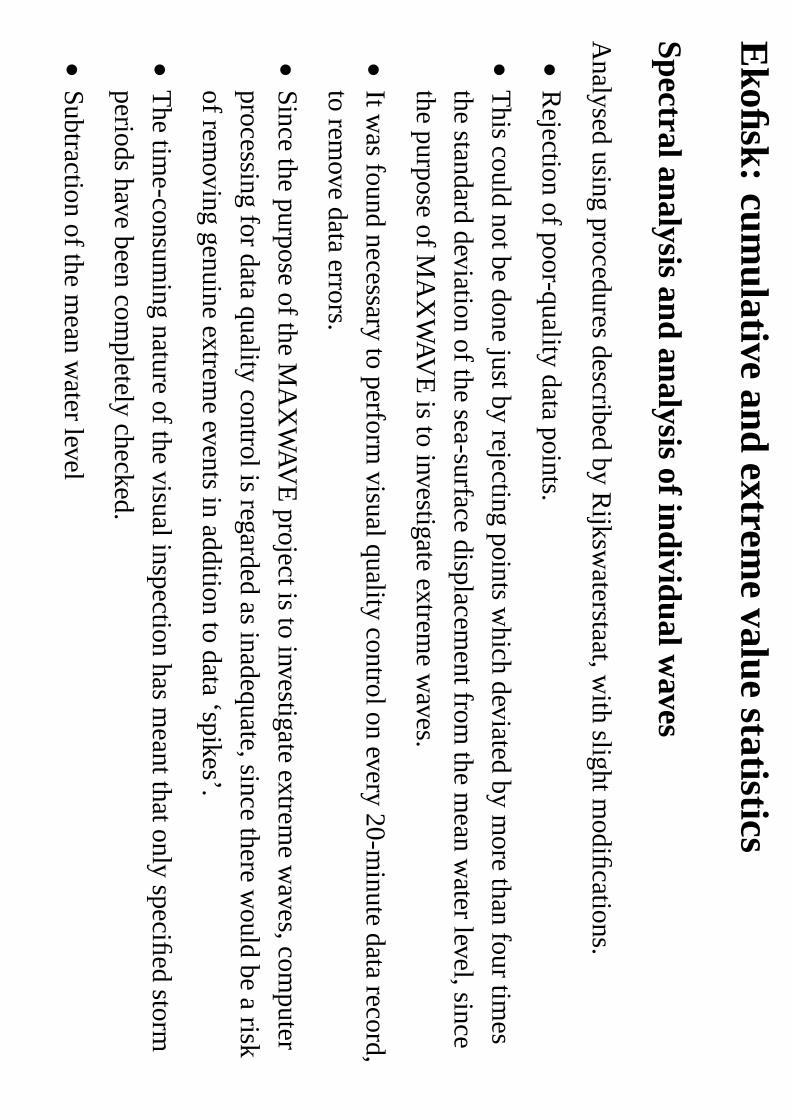
Cum
ulativedistribution,E
kofiskw
averider,1998-10-2515:40–17:40
0 2 4 6 8
10
12
02
46
81
01
2
-log(1-F(x))
Cre
st h
eig
ht / m
time
se
ries_
hz2
19
98
-10
-25
15
:40
:00
+0
00
0 - 1
99
8-1
0-2
5 1
7:4
0:0
0+
00
00
Ra
yle
igh
dis
t.
Cum
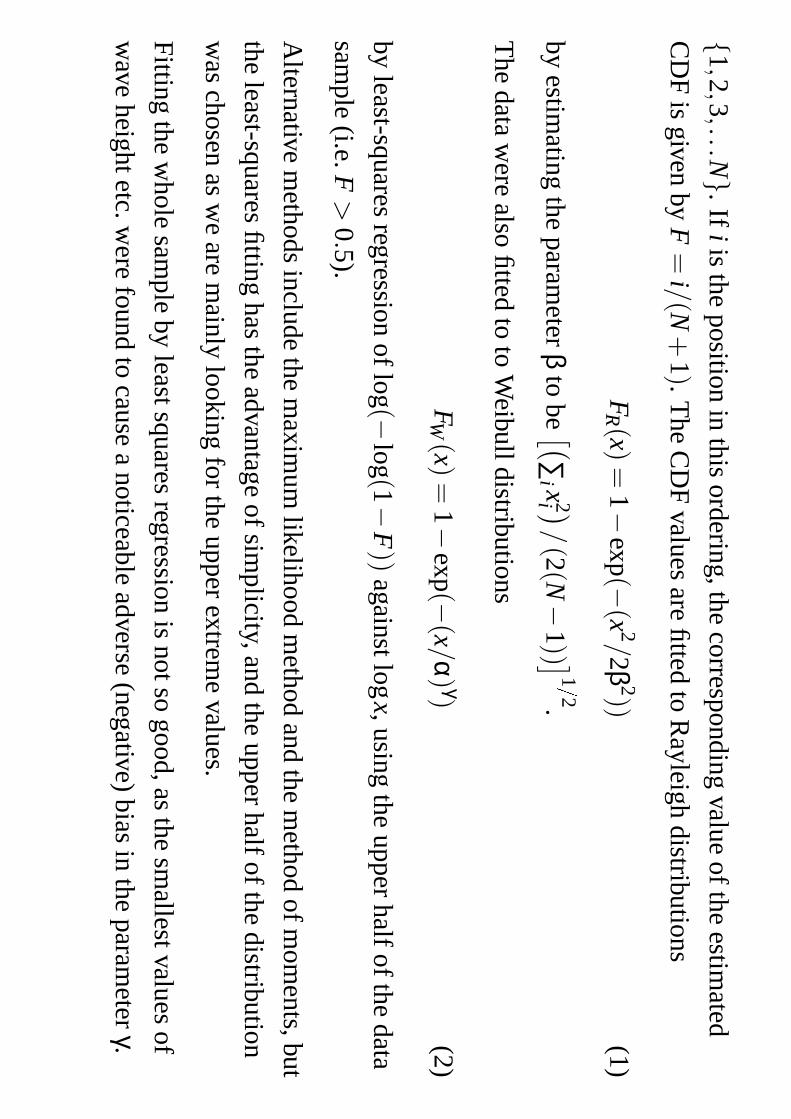
ulativedistribution,E
kofisklaserF
lareN
orth,1998-10-2515:40–17:40

0.1 1
110
-log(1-F(x))
metres
timeseries_hz1 1998-10-25 15:00:00+
0000-1998-10-25 17:00:00+0000 (769 w
aves)
Crests: . . . . . . . observed
Weibull, alpha =
2.961 m, gam
ma =
1.827R
ayleigh, parameter =
2.129T
roughs: . . . . . . . . observedW
eibull, alpha = 2.958 m
, gamm
a = 1.978
Rayleigh, param
eter = 2.081
Wave heights: . . . . . . . observed
Weibull, alpha =
5.835 m, gam
ma =
1.977R
ayleigh, parameter =
4.123
Ekofisk
waverider,1998
October25,15:00–17:00U
TC
,cumulative
distributions.
0.1 1
110
-log(1-F(x))
metres
timeseries_hz2 1998-10-25 15:00:00+
0000-1998-10-25 17:00:00+0000 (754 w
aves)
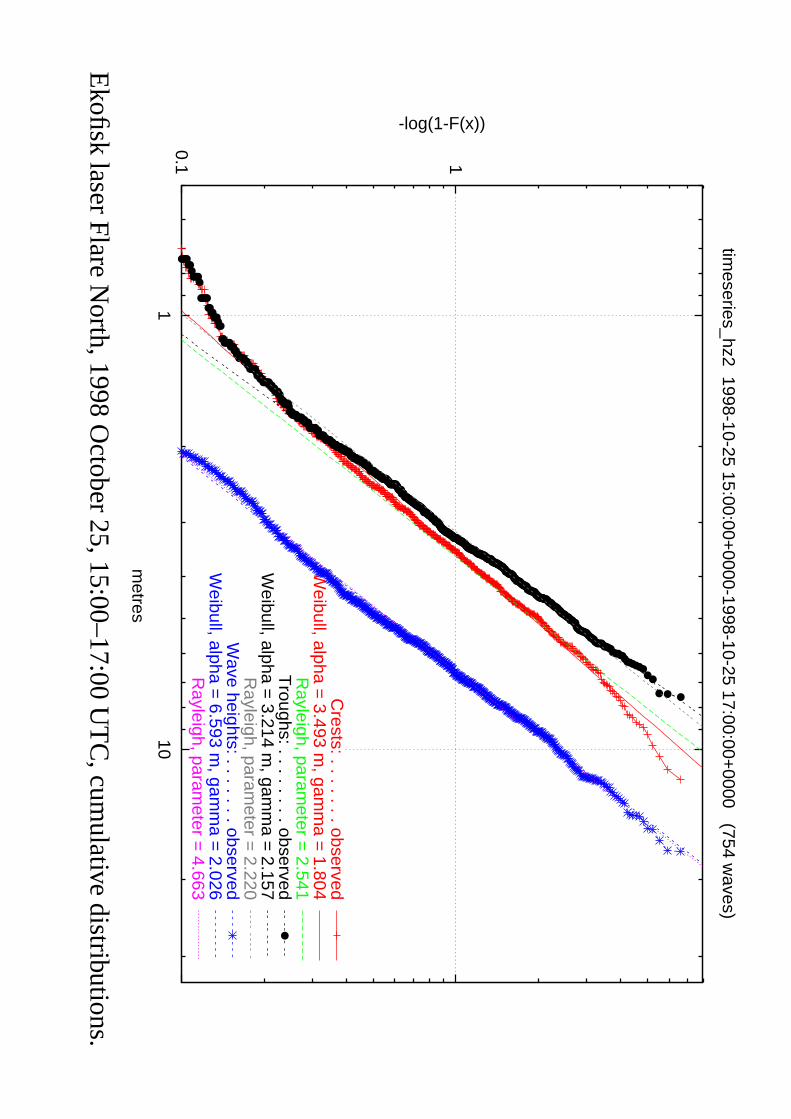
Crests: . . . . . . . observed
Weibull, alpha =
3.493 m, gam
ma =
1.804R
ayleigh, parameter =
2.541T
roughs: . . . . . . . . observedW
eibull, alpha = 3.214 m
, gamm
a = 2.157
Rayleigh, param
eter = 2.220
Wave heights: . . . . . . . observed
Weibull, alpha =
6.593 m, gam
ma =
2.026R
ayleigh, parameter =
4.663
Ekofisk
laserFlare
North,1998
October25,15:00–17:00U
TC
,cumulative
distributions.

0.1 1
110
-log(1-F(x))
metres
timeseries_hz3 1998-10-25 15:00:00+
0000-1998-10-25 17:00:00+0000 (773 w
aves)
Crests: . . . . . . . observed
Weibull, alpha =
3.100 m, gam
ma =
1.759R
ayleigh, parameter =
2.256T
roughs: . . . . . . . . observedW
eibull, alpha = 2.802 m
, gamm
a = 2.003
Rayleigh, param
eter = 1.966
Wave heights: . . . . . . . observed
Weibull, alpha =
5.886 m, gam
ma =
2.035R
ayleigh, parameter =
4.125
Ekofisk
laserFlare
South,1998
October25,15:00–17:00U
TC
,cumulative
distributions.
-6 -4 -2 0 2 4 6 8
01
00
02
00
03
00
04
00
05
00
06
00
07
00
08
00
0
m�
time
/ se
co
nd
s
time
se
ries_
hz3
19
98
-10
-25
11
:00
:00
+0
00
0-1
99
8-1
0-2
5 1
3:0
0:0
0+
00
00
(90
5 w
ave
s)
Ekofisk
laser,Flare
South,1998
October25,11:00–13:00U
TC
.
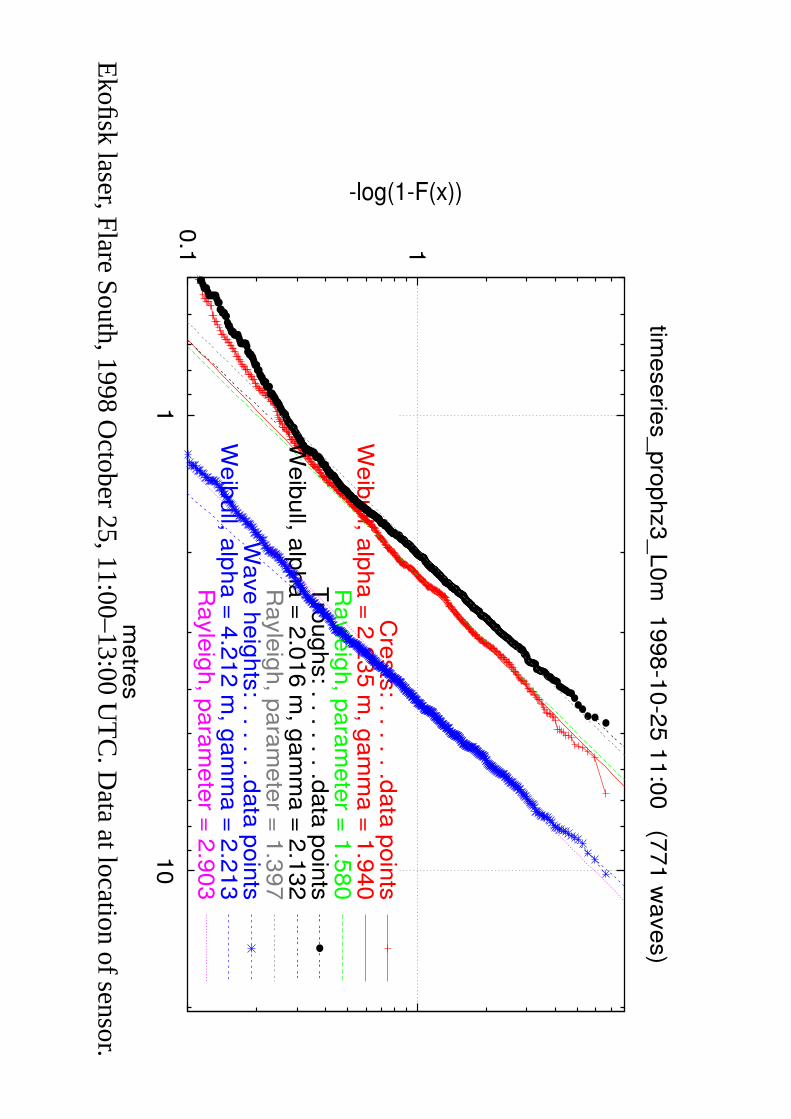
Ekofisk
laser,Flare
South,1998
October25,11:00–13:00U
TC
.Data
atlocationofsensor.

Ekofisk
laser,Flare
South,1998
October
25,11:00–13:00UT
C.Linearpropagation
to
450mat5
mintervals.
0.1 1
11
0
-log(1-F(x))
me
tres
time
se
ries_
dra
up
ne
r 19
95
-01
-01
15
:20
:00
+0
00
0-1
99
5-0
1-0
1 1
5:4
0:0
0+
00
00
(84
wa
ve
s)
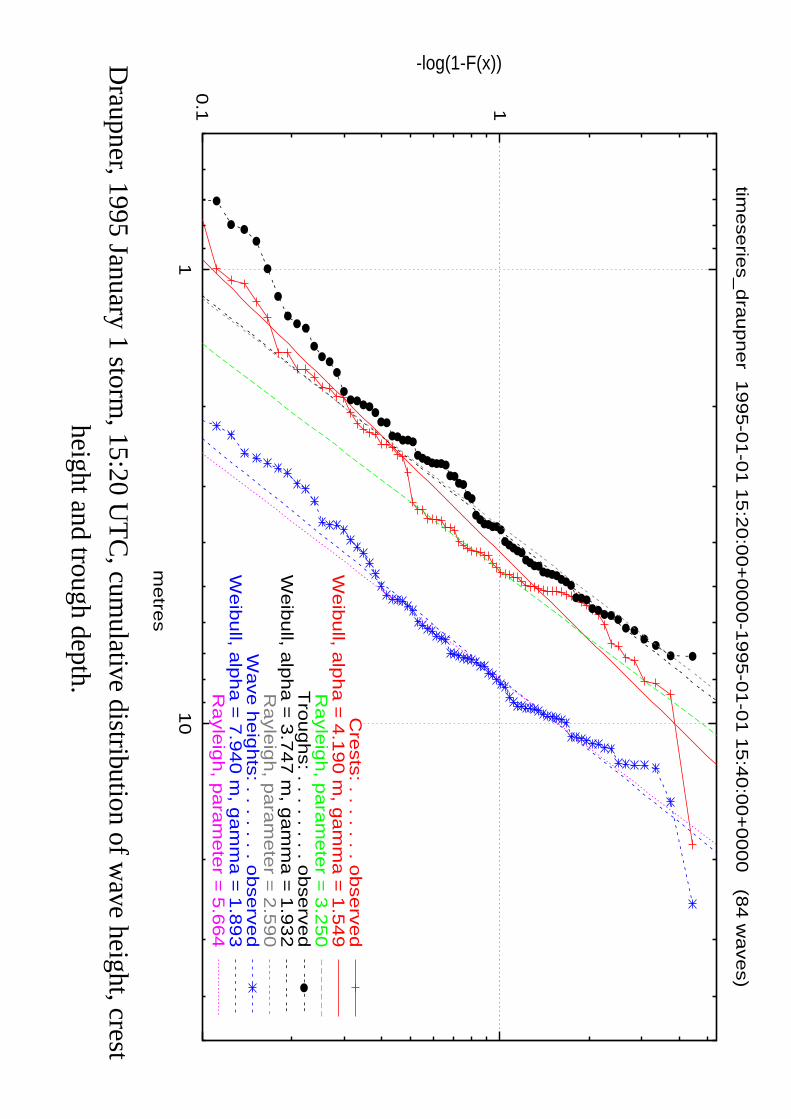
Cre
sts
: . . . . . . . ob
se
rve
dW
eib
ull, a
lph
a =
4.1
90
m, g
am
ma
= 1
.54
9R
ayle
igh
, pa
ram
ete
r = 3
.25
0T
rou
gh
s: . . . . . . . . o
bse
rve
dW
eib
ull, a
lph
a =
3.7
47
m, g
am
ma
= 1
.93
2R
ayle
igh
, pa
ram
ete
r = 2
.59
0W
ave
he
igh
ts: . . . . . . . o
bse
rve
dW
eib
ull, a
lph
a =
7.9
40
m, g
am
ma
= 1
.89
3R
ayle
igh
, pa
ram
ete
r = 5
.66
4
Draupner,1995
January1storm
,15:20U
TC
,cumulative
distributionofw
aveheight,crest
heightandtrough
depth.
Conclusions
1.T
heextrem
ewavesobserved
donothave
anunusualshape:they
tendto
havesharpcrestsand
roundtroughs,w
itha
pronouncedcrest:trough
asymm
etry.
2.T
hestatistics
ofindividualwave
height,crestheight,andtrough
depth,aregenerallyin
agreementw
ithR
ayleighorWeibulldistributions,although
particularlyextremeeventssuchasthe
Draupner1995
New
Yearw
aveare
highlyunusualaccordingto
thenorm
ally-acceptedGaussian
andnon-G
aussianstatisticalm
odels.
3.T
hew
aveletanalysismethodcan
beusefulfor
detecting‘groupiness’andindividuallarge
waves.
4.A
nalysisofthe
useofthequasi-Lagrangiancorrectionm
ethodonW
averidertime
seriesforthe
Stenfjellcaseindicatesthatthis
methodis
insufficienttotransform
observationaldataintotim
eseriesw
hoseextrem
evaluesofcrestheightand
troughdepthare
equivalenttoobservations
usingE
ulerianmeasurem
enttechniques.
5.‘P
ropagation’ofwave
observationsto
hypotheticallocationsdifferent
fromw
herethew
avem
easurementsare
made,in
ordertoevaluatethe
riskofextrem
ewaveslargerthan
thoseactuallyobserved,may
bepossible,but
furtherstudyisrequiredto
determinethe
statisticalreliabilityofthe
linearand
nonlinearmethodsproposed.