alaska department of fish and game · permission from the author (s) and/or the alaska department...
TRANSCRIPT

ALASKA DEPARTMENT OF FISH AND GAME
JUNEAU, ALASKA
STATE OF ALASKA Bill Sheffield, Governor
DEPARTMENT OF FISH AND GAME Don W. Collinsworth, Commissioner
DIVISION OF GAME W. Lewis Pamplin, Jr., Director
Robert A. Hinman, Deputy Director
ANNUAL REPORT OF SURVEY-INVENTORY ACTIVITIES
PART ~. WATERFOWL 'I.. 'Til
By
Bruce H. Campbell and
Thomas C. Rothe
Volume XVI
Federal Aid in Wildlife Restoration
Project W-22-4, Job 11.0
Persons intending to cite this material should obtain prior permission from the author (s) and/or the Alaska Department of Fish and Game. Because most reports deal with preliminary results of continuing studies, conclusions are tentative and should be identified as such. Due credit will be appreciated.
(Printed January 1986)

CONTENTS
1984-85 Alaska Waterfowl Regulations Summary. . ........ ii
Duck Harvest •. . . . . . . . . . . . . '5
Brown Bear Activity and Impacts on Nesting Geese on
Waterfowl Harvest anq Hunter Activity. 1
Introduction . ............................ . . . . . . . . . . . 1
Survey Procedures •. 1
Results ••••••••••• . . . . . . . . . . . . . . . . . . . . . . . . . . . . . . . . . . . . 1
Number of Hunters •• . . . . . 1
Hunting Activity •••••••• .. . . . . . . . . . . . . . . . 5
Goose Harvest •• . . . . . . . . . . . . . . . . . . . . . . . . . . . . . . . . 5
Crane Harvest ......................•............. 13
Snipe Harvest. ........... 13
Discussion ••.•..••• . ..... 13
Dusky Canada Goose Studies •• .. . ~ .... . . . . . . . . ........ 14
Production ••••••••• . ....... 14
Population Status •• . ....... 20
Banding .••.••.••.•• • . • . • • • • . • • . • • • • • • • • • . . . . . . • • • • . • . • 22
the West Copper River Delta •.•••..••••.• •••••••••••.••••. 25
Introduction . .................................. . .•••.. 25
July-Winter 1984 and Spring 1985 Investigation$. .25
May-June 1985 Investigations ••••••••••.•.••••••••••• •.• 30
1986 Work Plan . ............. . .... ........... 30
Spring Goose Migration in Cook Inlet . •••••.•...•.•.. 33
Literature Cited •..••••.••••••••••••• . . . . . . . . . . . . . . . . . . . . . . 35
i

1984-85 ALASitA WATI!RlOWL RmULATIONS SUI!IIARY - SEASONS AliD LIMITS
NOR'fHERN
11-D t 17•26
GULF COAST
5-7, §, Ii-i& & tJ!Wialt Islall4
sotrri!EAST
l-4
ALEUTIANS
a ' 10 texcepttJIUaek Islall4)
Sept. l-Dec. 16 Sept. l-Dec. 16 Sept. l-Dec. 16 Oct. 8-JaD. 22
bUCks
LDII'l' BAG POSS.
lb !b
LIIUT BAG POSS.
8 24
LIMIT BAG POSS.
7 21
LII!l'l' BAG POSS.
7 21
15 30 15 30 1!1 30 15 30
6 12 6 12 6 12 6 12
!!!peror Geese 2 4 2 4 2 4 2 4
BraDt 2 4 2 4 2 4 2 4
Snipe 8 16 8 16 8 16 8 16
2 4 2 4 2 4 2 4
a Ill Unit l (Cl , the ~ of snow geae is probJb1ted. Ill 1JD1U 9(E), 10 (u:cept 1JD111ak) aDd 18, the ta.Jd.nq of CaDada qettM is probJb1ted. Ill Units 5 aDd 6, the takinq of Canada geae is prohibited Sept. l - Sept. 14.
b Sea Duc:U: Eiders, Seaters, Old Sqaay, KarlequiD.
e No 110n thaD 4 daily, 8 1D poaMUioa MY be Callada UJ4/or white-fronted geae, ~t t.bat:
Ill tJD1U 1•9, 14-16, aDd 18, DO IIOA than 2 daily, 4 1D pou•aion llaf be vllitefroated 9HM•
(a) WIW'<la>: liaterfowl IIBf be t.at.1 With a SbotC)Uil (Dot lUVU tba 10 CJUA9'f) or bow aDd Ul'OWr but not rifle or p1atol.
(bl PLIJGS: SllotguDa IIU8t be pl'UQ9'ed to a 3-sbell capacity or leu for waterfowl buDt.inq.
(e) CCJIVEYANCES: RuiiUnq ill not pumtted frc. aD aircraft, motor driven vehicle, airboet, jet boat, or propellor driven boat, which tbe 110tor of sudl hu not been CCJIIPletely sbut off aDd its proqreu therefrc. hu eeued.
(d) POSSESSICih No stat.. t111J91nq Aqllir-ts, s.. Fede~ RequlaUou.
(e) TRANSPOll'l'A'l'ICH: liaterfowl llaf be plucked 1D the field but one fully feetbered w1Dq or the bad aust r..tn attacbed while be1Dq tran.ported.
(fl SIIOO'l'I!G IIOtJRS: Oae b&lf bour before SUDriM to SUDAt.
!ql STMPS: No person 16 or 110re years of age MY take waterfowl unleu be earri• a eurnDt validated Federal lliqratory bird buntinq st.up (Duck St.upl on bis persoa.
(b) Special Restrtetiou: Tbe use of m airboat or aircraft enqine propelled boat for retrieval of waterfowl, transportaioa of waterfowl or parts of waterfowl, waterfowl bunters, or waterfowl buDt1Dq gur witb1D the PU..r Ray Flats State G.. Refu9e (except for the lllltaDuska River) aDd that portion of 1JD1t lU within the north bUlk of II'Dilt River aDd eut aDd south bUlk of the MataDuska River an prohibited.
ii
WATERFOWL HARVEST AND HUNTER ACTIVITY
Introduction
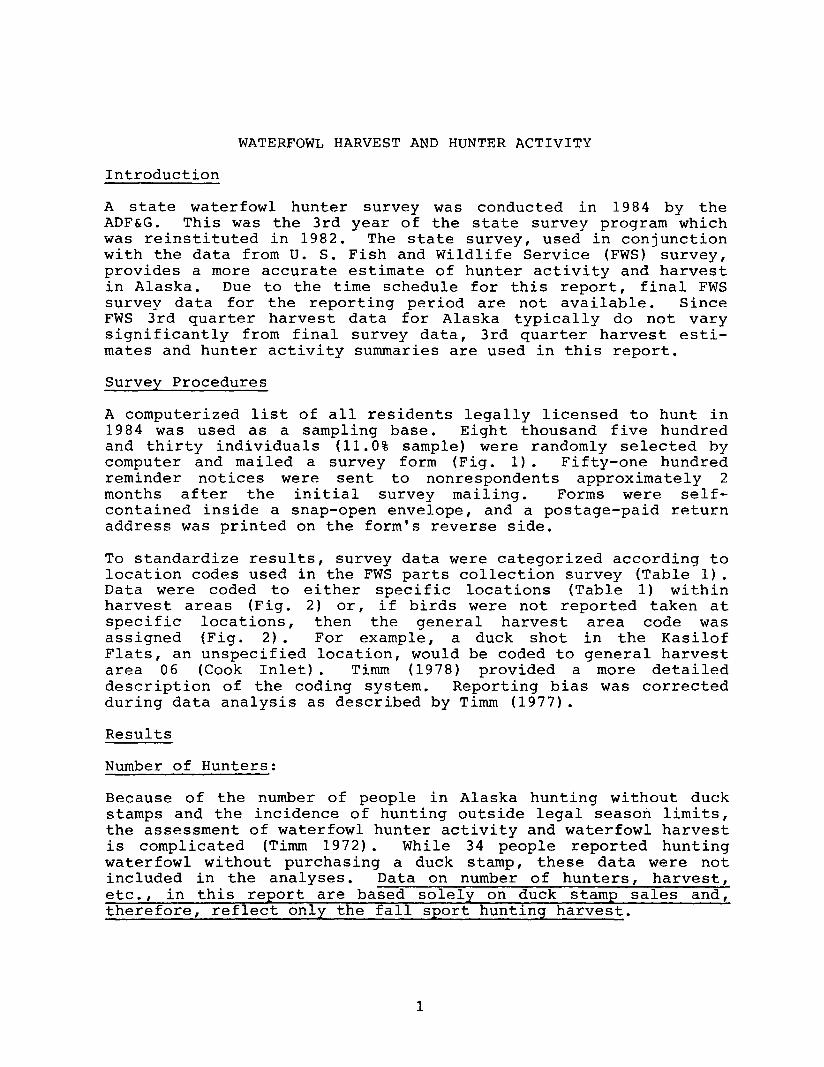
A state waterfowl hunter survey was conducted in 1984 by the ADF&G. This was the 3rd year of the state survey program which was reinstituted in 1982. The state survey, used in conjunction with the data from U. S. Fish and Wildlife Service (FWS) survey, provides a more accurate estimate of hunter activity and harvest in Alaska. Due to the time schedule for this report, final FWS survey data for the reporting period are not available. Since FWS 3rd quarter harvest data for Alaska typically do not vary significantly from final survey data, 3rd quarter harvest esti mates and hunter activity summaries are used in this report.
Survey Procedures
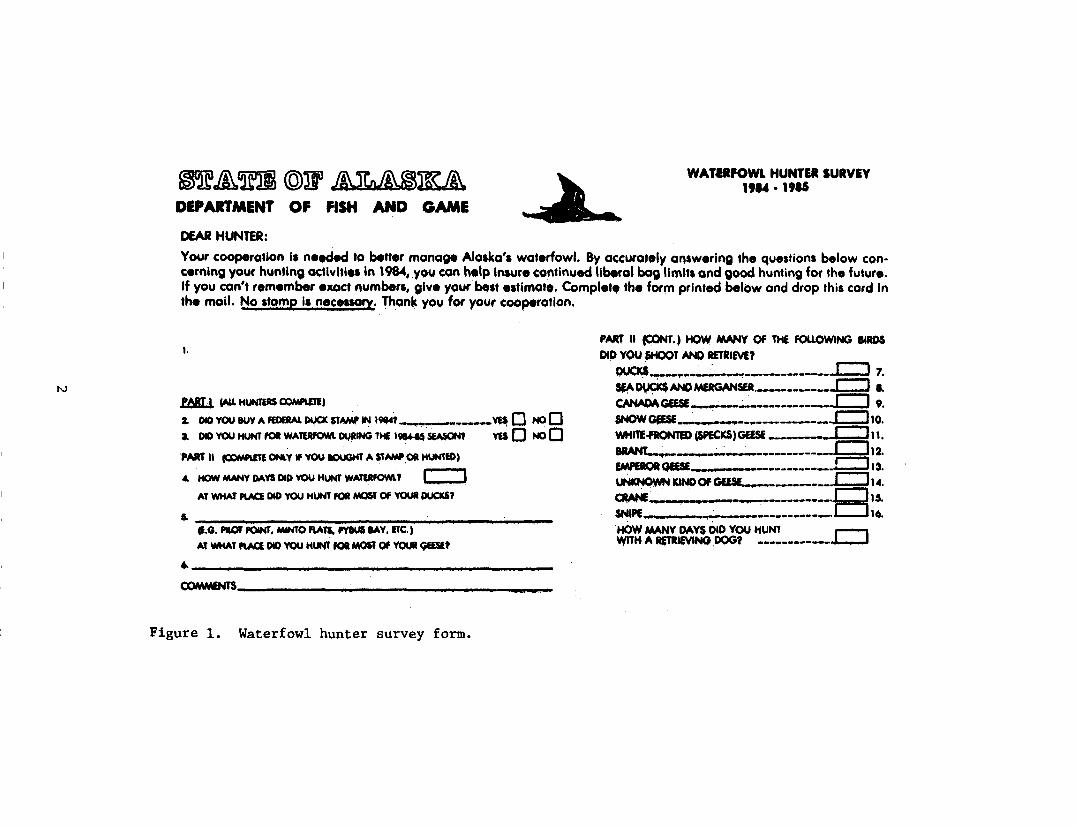
A computerized list of all residents legally licensed to hunt in 1984 was used as a sampling base. Eight thousand five hundred and thirty individuals (11.0% sample) were randomly selected by computer and mailed a survey form (Fig. 1). Fifty-one hundred reminder notices were sent to nonrespondents approximately 2 months after the initial survey mailing. Forms were self contained inside a snap-open envelope, and a postage-paid return address was printed on the form's reverse side.
To standardize results, survey data were categorized according to location codes used in the FWS parts collection survey (Table 1). Data were coded to either specific locations (Table 1) within harvest areas (Fig. 2) or, if birds were not reported taken at specific locations, then the general harvest area code was assigned (Fig. 2) • For example, a duck shot in the Kasilof Flats, an unspecified location, would be coded to general harvest area 06 (Cook Inlet) . Timm (1978) provided a more detailed description of the coding system. Reporting bias was corrected during data analysis as described by Timm (1977).
Results
Number of Hunters:
Because of the number of people in Alaska hunting without duck stamps and the incidence of hunting outside legal season limits, the assessment of waterfowl hunter activity and waterfowl harvest is complicated (Timm 1972). While 34 people reported hunting waterfowl without purchasing a duck stamp, these data were not included in the analyses. Data on number of hunters, harvest, etc., in this report are based solely on duck stamp sales and, therefore, reflect only the fall sport hunting harvest.
1
~.LA\D ©Jr ~IK!&. DEPARTMENT OF FISH AND GAME
DEAR HUNTER:
WAT.ERPOWL HUNTER SURVEY 19... ·1911
Your cooperation Ia ne~ to beHer manage Aloaka'a waterfowl. By accurately answering the questions below concerning your hunting activities In 1984, you con help lnwre continued liberal bag limits and good hunting for the future. If you can't remember exoct numbers, give your best eatimot•· Complet• the form printed below and drop this cord In the mail. No atomp Is necessa!'Y. Thank you for your cooperation.
I.
N
~ WL HUNTERS COMfUTE)
2. 010 YOU IUY A fEDERAL DI,IOC ITA.MP IN l~f-..-.--·-·-'m. 0 NO 0 a. DIO YOU HUNT fOil WA'IVIfOWL ~lNG THE I~~t
'PART II (COMNTI ON.Y If YOU IOUGHT A ITNNI.Oil HUNlEO)
4. HOW ~y DAYS DID YOU HUNl WATPfOWU I I AT WHAT 1\ACi DID YOU HUNT fOil MOST Of YOUR DUCICS?
VIS 0 NO 0
J.G. PlOT I'OINT, MINTO F\ATI, I'YIUIIAY, lTC:.)
AT WHAT IUa DIO YOU HUNT fOil MOll 01 YQUa c;&Slt ~ --------------------------------------~--
~------------------------~----------------~~·-------------------------------------
Figure 1. Waterfowl hunter survey form.
PAAT II (CONT.) HOW ~y Of THE fOlLOWING BIRD$ DID YOU SHOOT AND RETRIM?
~---..-· -~- ~---------- C=J 7. ~ou0c$ANDMERGANSER----··-..c:::J 1. ~GEESE---·· •• -~·-------- .. r==J 9. SI«:1N GPSE ~·---..----------..r::::l1o. WHITE.fRONTED (SPECKS)GEESE ----·-· r=:"J 11.
·. . . ,.__, ~- 4 -·---------------·· 12.EINEIQR q&Sl _________..r::::J13.
uNKNowN KIND Of G&Sf ... • --·-------...c:::J14.
~ . -------------·8'5. ~·"·~ •• ~--~~-~~---------· 16. .HOW MANY DAY$ DID YOU HUNT ,---, WITH A RiTRJlVING .DOG? -·----·----..L..-J

Table 1. Summary of codes used to assign harvest locations in Alaska.
FWS ADF&G ADFG Region (R) Original FWS Harvest code code and area names "county" name zone
0000 00 Unknown Unknown Unknown
0101 01 North Slope (R) Arctic Slope NW
0301 02 Seward Peninsula (R) Seward Peninsula
0502 03 Yukon Valley (R) Upper Yukon-Kuskokwim Central 0512 12 Yukon Flats
0702 04 Central (R) Fairbanks-Minto 0712 13 Minto Flats " 0722 14 Eielson AFB II
0732 15 Salchaket Slough " 0742 16 Healy Lake " 0752 17 Delta Area " 0762 18 Tok-Northway
0901 OS Yukon Delta (R) Yukon-Kuskokwim Delta NW
1103 06 Cook Inlet (R) Anchorage-Kenai sc 1113 19 Susitna Flats 1123 20 Palmer-Hay Flats 1133 21 Goose Bay
22 Eagle River 1143 23 Potter Marsh 1153 24 Chickaloon Flats 1163 25 Portage 1173 26 Trading Bay 1183 27 Redoubt Bay 1193 28 Kachemak Bay
46 Jim-Swan area
1303 07 Gulf Coast (R) Cordova-Copper River II
1313 29 Copper River Delta II " 1323 30 Yakutat Area " " 1333 31 Prince William Sound " II
1503 08 Southeast Coast (R) Juneau-Sitka SE 1513 32 Chilkat River " 1523 33 Blind Slough " 1533 34 Rocky Pass 1543 35 Duncan Canal 1553 36 St. James Bay 1563 37 Mendenhall Wetlands 1573 38 Farragut Bay 1583 39 Stikine River Delta
1704 09 Kodiak (R) Kodiak Island sw 1714 40 Kalsin Bay " II
1904 10 AK Peninsula (R) Cold Bay-AK Peninsula II
1914 41 Cold Bay " " 1924 42 Pilot Point II " 1934 43 Port Moller " " 1944 44 Port Heiden " "
45 Cinder River II " 2104 11 Aleutian Chain (R) Aleutians-Pribilofs "
3

I •;,I;.
;. .,.4
... · fl......_,_,.,·' ,
•
..... --· ~---
\
,. ..
~ --' ••
1 - North Slope 2 - Seward Peninsula 3 - Yukon Valley 4 - Central 5 - Yukon Delta 6 - Cook Inlet 7 - Gulf Coast 8 - Southeast 9 - Kodiak 10- Alaska Peninsula 11- Aleutian Chain
Figure 2. Harvest areas used in data analysis.

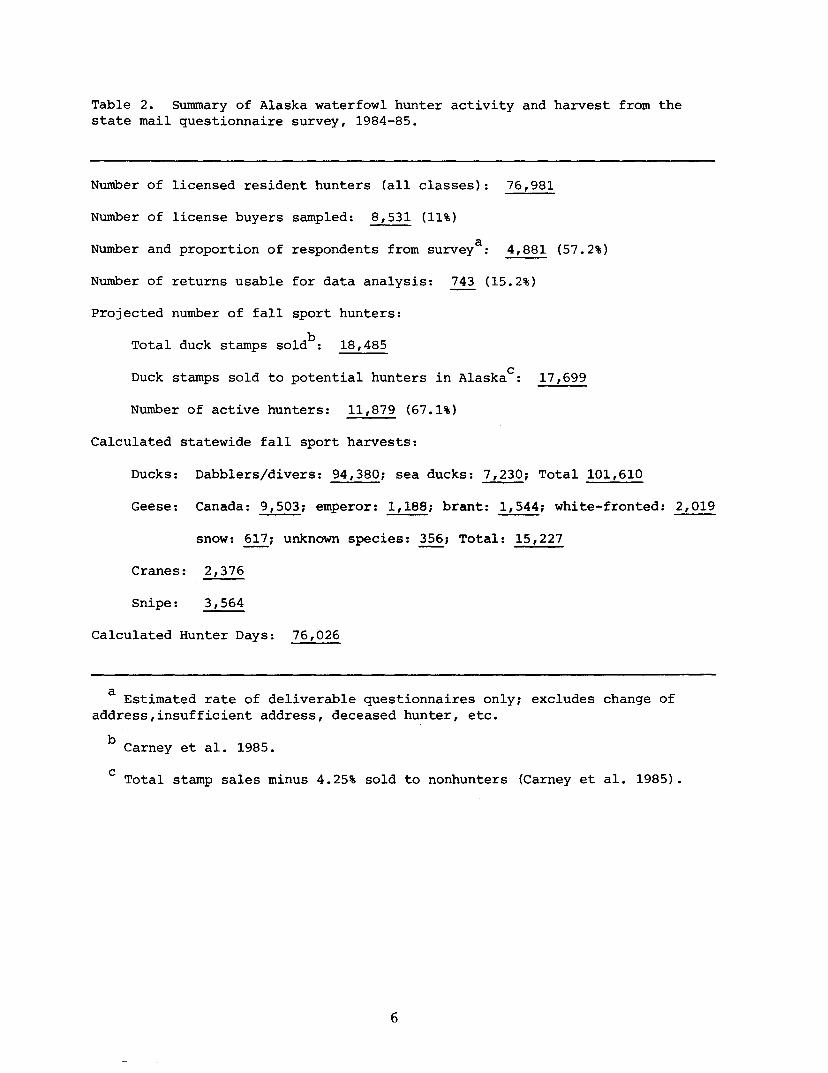
A total of 4,881 people returned the questionnaire for a response rate of 57%. Of the 1,107 individuals indicating that they had purchased a duck stamp, 743 reported hunting 1 or more days (67% active hunters). Based on the sale of 18,485 federal duck stamps in Alaska, adjusted for sales to nonhunters, approximately 11,879 people hunted waterfowl during the 1984-85 season (Table 2) .
Hunting Activity:
Hunters reported hunting an average of 6.4 days during the 1984-85 season. This projects to a total of 76,026 waterfowl hunter-days (Table 2), compared with 75,963 hunter days in 1983. The distribution of hunter days and resulting harvest are summarized by region in Table 3 and by specific hunting area in Table 4.
Duck Harvest:
An average of 7.9 ducks/active hunter was taken in 1984. This compares with 9. 6 ducks/active hunter in 1983 and the 1973-83 average of 6. 5 ducks I active hunter. Calculated average daily hunting success was 1.2 ducks/hunter in 1984 compared with 1.6 in 1983.
The projected statewide duck harvest was 101,610 of which 94,380 (93%) were dabblers and divers and 7,230 (7%) were sea ducks (Table 2). This estimate is comparable to a Fish and Wildlife Service estimated harvest of 89,715, of which 79,218 (88%) were dabblers, 8,792 (10%) were divers and 1,704 (2%) were sea ducks and mergansers (Carney et al. 1985). The 1984 state survey estimated harvest was 18% less than 1983 but 1% above the 1973-83 average harvest of 100,260 ducks.
Based on the FWS parts collection survey, which is believed to provide the best estimate of species composition in the harvest, the mallard (Anas platrhynchos) was the most important game duck in 1984, composing about 31% of the harvest, followed by greenwinged teal (Anas crecca) (19%), pintail (Anas acuta) (18), and American wigea:n- (Anas americana) (15%) (Table 5). Species composition of the statewide duck harvest has remained relatively constant during the past 10 years (1975-84) with 86% (±2.5) of the harvest composed of dabbling ducks, 10% (±2.5) diving ducks and 4% (±2.2) sea ducks and mergansers (Table 6). As calculated from the State Waterfowl Hunter Survey, nearly 33% of the duck harvest occurred in Cook Inlet, with the state's central region contributing an additional 23% (Table 7).
Goose Harvest:
Hunters reported taking an average 1. 3 geese/active waterfowl hunter in 1984. This was slightly higher than the 1.1 geese/ hunter reported in 1983, and the 10-year average of 1.1 geese/ hunter. The calculated 1984 statewide goose harvest was 15,227,
5
c
Table 2. Summary of Alaska waterfowl hunter activity and harvest from the state mail questionnaire survey, 1984-85.
Number of licensed resident hunters (all classes): 76,981
Number of license buyers sampled: 8,531 (11%)
aNumber and proportion of respondents from survey : 4,881 (57.2%)
Number of returns usable for data analysis: 743 (15.2%)
Projected number of fall sport hunters:
bTotal duck stamps sold 18,485
Duck stamps sold to potential hunters in Alaskac: 17,699
Number of active hunters: 11,879 (67.1%)
Calculated statewide fall sport harvests:
Ducks: Dabblers/divers: 94,380~ sea ducks: 7,230~ Total 101,610
Geese: Canada: 9,503; emperor: 1,188~ brant: 1,544~ white-fronted: 2,019
snow: 617~ unknown species: 356; Total: 15,227
Cranes: 2,376
Snipe: 3,564
Calculated Hunter Days: 76,026
a Estimated rate of deliverable questionnaires only~ excludes change of address,insufficient address, deceased hunter, etc.
b Carney et al. 1985.
Total stamp sales minus 4.25% sold to nonhunters (Carney et al. 1985).
6

Table 3. Calculated duck, crane, and snipe fall sport harvests and sport hunter activity by harvest area, 1984-85.
Harvest Hunter days Dabblers/divers Sea ducks Crane Snipe area No. % No. % No. % No. % No. %
North Slope 0 0.0 0 o.o 0 o.o 0 0.0 0 0.0 Seward Peninsula 1,749 2.3 2,643 2.8 275 3.8 40 1.7 0 0.0 Yukon Valley 1,977 2.6 1,888 2.0 0 0.0 52 2.2 0 o.o Central 13,989 18.4 22,651 24.0 398 5.5 1,390 58.5 185 5.2 Yukon Delta 1,977 2.6 4,813 5.1 788 10.9 506 21.3 107 3.0 Cook Inlet 32,615 42.9 32,089 34.0 1,424 19.7 230 9.7 905 25.4 Gulf Coast 5, 778 7.6 6,701 7.1 1,193 16.5 26 1.1 606 17.0 Southeast 13,533 17.8 14,251 15.1 2,082 28.8 0 0.0 1,764 49.5 Kodiak 2,281 3.0 2,548 2.7 759 10.5 0 0.0 0 0.0 Alaska Peninsula 2,129 2.8 7,079 7.5 311 4.3 133 5.6 0 o.o Aleutian Chain 0 0.0 0 o.o 0 o.o 0 0.0 0 0.0
Statewide 76,026 100.0 94,380 100.3 7,230 100.0 2,376 100.1 3,564 100.1

Table 4. Calculated hunting activity and harvest for specific locations in Alaska, 1984-85.
Calculated duck harvest and hunter days Calculated goose harvest Ducks Hunter days
% of % of % of Location N state total N state total Location N state total
Minto Flats 11,685 11.5 5,094 6.7 Delta Area 1,995 13.1 Susitna Flats 8,129 8.0 5,701 7.5 Cold Bay 1,462 9.6 Palmer Hay Flats 7,214 7.1 6,614 8.7 Chickaloon Flats 807 5.3 Chickaloon Flats 5,385 5.3 1,673 2.2 Minto Flats 777 5.1 Copper River Delta 4,674 4.6 2,357 3.1 Copper River Delta 563 3.7 Prince William Sound 2,845 2.8 1,444 1.9 Susitna Flats 487 3.2 Healy Lake 2,032 2.0 608 0.8 Stikine River Delta 320 2.1 Pilot Point 1,931 1.9 532 0.7 Palmer Hay Flats 213 1.4 Mendenhall 1,829 1.8 1,977 2.6 Blind Slough 198 1.3 Tok-Northway 1, 727 1.7 760 1.0 Goose Bay 167 7.1
co Kachemak Bay 1,727 1.7 1,825 2.4 Rocky Pass 152 1.0 Delta Area 1,626 1.6 3,497 4.6 Prince William Sound 122 0.8 Stikine River Delta 1,626 1.6 608 0.8 Port Heiden 107 0.7 Portage 1,423 1.4 2,281 3.0 Trading Bay 76 0.5 Redoubt Bay 915 0.9 532 0.7 Portage 76 0.5 Port Heiden 711 0.7 76 0.1 Pilot Point 61 0.4 Eielson AFB 610 0.6 380 0.5 Duncan Canal 61 0.4 Goose Bay 508 0.5 912 1.2 Mendenhall 61 0.4 Trading Bay 508 0.5 760 1.0 Yakutat 61 0.4 Duncan Canal 508 0.5 532 0.7 Jim-Swan Lakes 508 0.5 380 0.5 Potters Marsh 305 0.3 760 1.0 Yakutat 305 0.3 304 0.4 Cold Bay 305 0.3 608 0.8 Salchaket Slough 102 0.1 228 0.3 Blind Slough 102 0.1 228 0.3 Rocky Pass 102 0.1 76 0.1 Kalsin Bay 102 0.1 304 0.4
Subtotals 59,444 58.5 41,051 54.0 7,766 51.0 Statewide totals 101,610 100.0 76,026 100.0 15,227 100.0

Table 5. Species composition of the 1984-85 duck harvest, by region, based on the 3rd quarter Fish and Wildlife Service parts collection survey report (N = 1,385 wings).
% Total harvest by area North Seward Yukon Yukon Cook Gulf South- Alaska Aleutian % Total
Species Slopea Pen. Valley Central Delta Inlet Coast east Kodiak a Pen. Chain statewide
Mallard 0 0 22.3 21.8 24.7 29.0 73.5 39.7 0 26.4 58.3 30.7 American wigeon 0 0 17.5 24.8 15.5 14.2 7.4 5.6 0 19.5 8.4 14.5
Pintail 0 63.1 24.5 20.5 0 14.4 7.2 14.8 0 30.9 8.4 18.3 Green-winged teal 0 13.3 18.3 11.2 53.3 25.5 11.9 20.6 0 17.6 8.4 18.7
Shoveler 0 5.3 5.2 6.3 6.2 5.9 0 6.8 0 1.3 0 5.3 Gadwall 0 0 0 0 1.1 0 0.4 0 0 0 0.5 Blue-Winged teal 0 0 0 0.5 0 0.2 0 0.4 0 0 0 0.3
Unknown 0 0 0 0 0 0 0 0 0 0 0 0 Total dabblers 0 81.7 87.8 85.0 99.7 90.3 100.0 88.4 0 95.6 83.5 88.3
Lesser scaup 0 5.3 7.0 5.1 0 1.4 0 0.4 0 0.6 0 1.9
Barrow's goldeneye 0 0 0 2.6 0 0.8 0 4.0 0 0 0 1.6
Greater scaup 0 2.6 0 1.0 0 1.1 0 0.4 0 3.8 0 1.2
Bufflehead 0 0 0 4.1 0 1.1 0 1.2 0 0 0 1.4 Common
goldeneye 0 0 1.7 0.8 0 4.1 0 1.2 0 0 0 1.9 Canvasback 0 0 1.7 0 0 1.4 0 0.8 0 0 0 0.7 Redhead 0 0 0 0 0 0.9 0 0 0 0 0 0.3 Ringneck 0 0 0 0.3 0 1.6 0 0 0 0 0 0.6 Total divers 0 7.9 10.4 13.9 0 12.4 0 8.0 0 4.4 0 9.6
White-Winged seater 0 0 0 0 0 0.2 0 0.8 0 0 16.6 0.4
Harlequin 0 2.6 0 0 0 0.5 0 0.4 0 0 0 0.3

Table 5. Continued.
% Total harvest h:y area North Seward Yukon Yukon Cook Gulf South- Alaska Aleutian % Total
Species Slopea Pen. Valley Central Delta Inlet Coast east Kodiaka Pen. Chain statewide
Common merganser 0 0 0 1.0 0 0 0 0.4 0 0 0 0.3
Old squaw 0 5.3 0 0 0 0.5 0 0.4 0 0 0 0.3 Red-breasted
merganser 0 2.6 0 0 0 0 0 0 0 0 0 <0.1 Black scoter 0 0 1.7 0 0 0 0 0 0 0 0 <0.1 Surf scoter 0 0 0 0.3 0 0.2 0 1.6 0 0 0 0.5
Total seaducks/ Mergansers 0 10.5 1.7 1.3 0 1.4 0 3.6 0 0 16.6 1.8
a 0 1-'
No duck harvest reported by FWS parts collection survey.

Table 6. Species composition of the statewide duck harvest in Alaska, based on FWS parts collection surveys, 1975-84.
-Category 1975 1976 1977 1978 1979 1980 1981 1982 1983 1984 X ± SD
Dabblin~ducks %) 88.0 82.6 88.2 82.5 87.5 85.0 87.8 5.4 82.7 88.3 85.8 2.5
Divingducks (%) 5.8 9.5 10.3 11.1 8.2 12.5 9.9 11.0 15.3 9.6 10.3 2.5
Sea duck/ mergansers (%) 6.2 7.9 1.5 6.5 4.2 2.5 2.3 3.6 2.2 1.8 3.9 2.2
....... .......

Table 7. Projected distribution of 1984 duck harvest, by harvest area, compared with the ADF&G mail survey 1972-76 and 1982-83 averages.
1972-76 and Harvest area 1984 1982-83 Average
(%) (%)
North Slope Seward Peninsula Yukon Valley Central Y-K Delta Cook Inlet Gulf Coast Southeast Kodiak Alaska Peninsula Aleutian Chain
0.0 2.8 1.8
22.5 5.5
32.8 7.7
16.0 3.3 7.2 0.0
0.2 ± 0.2 2.0 ± 1.2 2.3 ± 0.7
18.7. ± 3.3 1.9 ± 1.1
41.9 ± 5.4 7.2 ± 1.8
18.6 ± 2.7 3.0 ± 0.7 3.9 ± 2.0 0.4 ± 0.4
12

an increase from 14,678 in 1983 and 6% above the 10-year average of 14,396. The state harvest estimate was 97% greater than the Fish and Wildlife Service estimate of 7,713 (Carney et al. 1985).
As in previous years, the Canada goose (Branta canadensis) was the most common goose harvested by sport hunters in 1984 (Table 2). This species made up 62% of the harvest, followed by white-fronts (Anser albifrons) (13%), brant (Branta bernicle) (10%), emperor (Philacte canagica) (8%), snow (Chen caerulescens) (4%), and unknown species (2%). This compares with a 1983 harvest of 61% Canadas, and 4% snow geese.
11% emperors, 13% brant, 8% white-fronts
Crane Harvest:
Hunters reported taking an average of 0.2 sandhill cranes (Grus canadensis)/active hunter in 1984. This compares with an average of 0.4 in 1983. The calculated statewide crane harvest was 2,376 (Table 2) as compared with 1,805 in 1983 and a 10-year average of 1,040 birds/year. Over 58% of the 1984 crane harvest occurred in the central region of the state (Table 3).
Snipe Harvest:
An average of 0.30 snipe (Capella gallinago) was harvested/active hunter in 1984 for a calculated statewide harvest of 3,564 birds (Table 2). This compares to 0.27 birds/hunter and a calculated harvest of 3,476 snipe in 1983. About half of the 1984 harvest occurred in southeastern Alaska, with Cook Inlet contributing an additional 25% (Table 3).
Discussion
In contrast to national and Pacific Flyway trends over the past decade, the number of waterfowl hunters and the level of hunting effort, as measured by stamp sales and hunter days, continues to hold steady or increase in Alaska. The number of active hunters was down 7.7% from 1983, but was still within 1% of the 1974-83 average; hunting effort was up 8.5% from both the 1983 and 1974-83 averages. This steady-to-increasing trend in the number of hunters and hunting effort reflects human population growth in Alaska.
Distribution of the 1984 waterfowl harvest reflects habitat and regulation changes. While the regional distribution of the duck harvest was not significantly different (X 2 = 13.41, df = 10, P > 0.20) than the 1972-76 and 1982-83 ADF&G survey average, the regional distribution of the goose harvest was significantly different (X 2 = 34.18, df = 10, P < 0.005). Most of this difference is attributed to 52% and 50% reductions in goose harvest in the Alaska Peninsula and Gulf Coast regions, respectively, and a
13

119% increase in harvest in the Central region from the 7-year state survey average. Reduced harvest in the Alaska Peninsula and Gulf Coast regions were the result of regulation changes instituted in 1984.
The Canada goose season was closed on much of the Alaska Peninsula (Subunit 9E) to protect cackling Canada geese. The esti mated 1984 harvest of all goose species at Pilot Point, the principal harvest location in this unit, was only 61 birds (Table 4), a reduction of over 90% from 1983. Bag limit restrictions of 2 daily and 4 in possession, instituted on brant and emperor geese, produced harvest reductions of 20 percent and 29 percent, respectively (Table 8), compared with 1983.
Canada goose season was postponed by 2 weeks in the Gulf Coast region to reduce the harvest of dusky Canada geese. Compared with 1983, Gulf Coast harvests were down 17 percent for Canada geese and 25 percent for all goose species (Table 8).
The dramatic increase in goose harvest in the Central region resulted from habitat change. A major agricultural area has developed in the Delta Junction area on the upper Tanana River 85 miles southwest of Fairbanks. This area is on one of the primary fall migration routes out of interior and northern Alaska and is apparently becoming an important staging area for geese. Road access and increasing numbers of geese available to hunters have resulted in an increase from less than 1% of the statewide harvest in the mid-1970's to the top goose harvest location (13% of statewide harvest) in 1984.
A similar trend is evident in the harvest of sandhill cranes. From 1971 to 1977 about 30% of the crane harvest was from the Pacific Coast population taken on the Alaska Peninsula, Cook Inlet, and the Gulf Coast. Seventy percent were from the mid-continent population taken in the Central, Seward Peninsula and Yukon Delta areas. By 1983 the mid-continental cranes composed 85% of the statewide harvest and by 1984 the harvest numbered 1, 9 8 8 cranes (Table 3) , over twice the average from 1971-77. Although much of the increase in harvest is from the Delta agricultural area in the Central region, a marked increase from 166 to 506 cranes harvested in the Yukon Delta was recorded in 1984.
DUSKY CANADA GOOSE STUDIES
Production
Conditions on the Copper River Delta were poor for nesting in 1985. Spring weather was cold and wet with the last measurable snowfall occurring on 16 May. The coastal Delta, where most nesting occurs, was not free of ice and snow until late May and "green-up" occurred 2-3 weeks later than normal. Weather during nesting was cold and wet.
14

Table 8. Magnitude and distribution of the fall goose sport harvest by species and harvest area, 1984-85.
Canada Emperor Brant Snow Whitefront Unknown Total
Region N % N % N % N % N % N % N %
North SlopeSeward Peninsula
Yukon ValleyCentral Yukon Delta Cook Inlet Gulf Coast Southeast Kodiak Alaska
Peninsula Aleutian
Chain
0
855 399
1,787741
1,920684
1,9770
1,131
0
0.0
9.0 4.2
18.8 7.8
20.2 7.2
20.8 0.0
11.9
0.0
0
0 0
43 587
43 0 0 0
514
0
o.o
0.0 o.oa3.6
49.4 3.6 0.0 0.0 o.o
43.3
0.0
0
386 96 42
523 28 28 96 0
344
0
0.0
25.0 6.2a2.7
33.9 1.8 1.8 6.2 0.0
22.3
0.0
0
14 0
40 510
14 0
40 0
0
0
0.0
2.2 o.o 6.5
82.6 2.2 0.0 6.5 0.0
0.0
0.0
0
188 52
1,030147 133 26 67 0
372
0
0.0
9.3 2.6
51.0 7.3 6.6 1.3 3.3 0.0
18.4
0.0
0
0 0
61 135
12 12
135 0
0
0
0.0
0.0 0.0
17.2 37.9 3.4 3.4
37.9 0.0
0.0
0.0
0
1,431548
3,0152,6492,132
761 2,315
0
2,345
0
0.0
9.4 3.6
19.8 17.4 14.0 5.0
15.2 0.0
15.4
0.0
1-' Statewide 9,503 99.9 1,188 99.9 1,544 99.9 617 100.0 2,019 99.8 356 99.8 15,227 99.8
U1
a Probable reporting error, species rare in these regions.

The 1st dusky geese (Branta canadensis occidentalis) were observed on the Delta on 12 April (K. Giezentanner, USFS, pers. commun.) and a major build-up was reported during the 3rd week of April (J. Reynolds, ADF&G, pers. commun.). Geese fed and roosted in partially snow-free open meadows along the Copper River Highway and on coastal mudflats until mid-May when pairs began establishing nesting territories on still frozen and snow-covered coastal marshes. Peak nest initiation, as determined by back dating the age of floated eggs from 77 nests, was 27 May-1 June. This was the latest nest initiation recorded since 1971.
The late spring was reflected in a low productive effort by the breeding population (Table 9) . Average clutch size on the study plots was 4.4 ± 1.5 (N = 64) eggs per nest. Average nest success was 8.9%. Both averages are the lowest ever recorded. However, in contrast to other very late springs, such as 1971 (Timm 1972) nest density was not lower than in previous years. The 1985 calculated nest density of 97 nests/mi 2 was slightly higher than in 1984 ( which had an early spring); was similar to the 1980-84 average of 99 nests/mi2; but was appreciably below the 1975-84 average of 136 nests/mi 2 .
Predation was the primary cause of nest failure in 1985. About 79% of the 168 nests on the study plots and 81% of the 258 nests visited at various locations on the west Delta (Figure 3) were destroyed (Table 10) . This was the highest nest predation rate on record. Over 76% of the nest destruction was attributed to coyotes and brown bears, with avian predators destroying an additional 19%. However, because of the high predation rate and complete nest destruction by large mammals, avian predation may have been masked and underestimated. While final classification of specific predatory agents is not yet complete, a major portion of the nest predation by mammals is attributed to brown bears.
A production survey was conducted on 17 July 1985. Parallel transects at l:!- to ~-mile intervals were flown in a Cessna 185 between saltwater and shrub-bog habitat. Two observers and a pilot were used, with the pilot and front seat observer searching for flocks and navigating. The 3rd observer, seated behind the front passenger seat, assisted with the search until geese were spotted. At that time, passes or circles were flown so the 2 observers on the right-hand side of the aircraft had an unrestricted view. The front observer counted adults and took photographs, while the rear observer counted young geese and recorded data. Elevation and speed of the aircraft varied according to conditions and group size. Flock searches were conducted at 500-800 foot altitude and at approximately 100 mph. Once flocks or family groups were spotted, airspeed and altitude were reduced to allow adequate counts and classification. All flocks larger than 50 geese were photographed to double check visual estimates and to test the feasibility of photocensusing the molting goose population.
16

Table 9. Dusky Canada goose nest densities, hatching success, and average clutch size on the West Copper River Delta study area, 1959-85.
Nest success Clutch size x nest
Year density/mi 2 N- % N X-
1959-74 NDa ND 82.9 ND 5.0 1975 179 ND 31.6 215 4.8 1976 156 ND ND 168 4.8 1977 175 229 79.0 181 5.4 1978 183 390 56.2 ND ND 1979 133 409 18.8 338 5.7 1980 108 ND ND 152 5.4 1981 ND ND ND 28 4.9 1982 102 151 49.8 135 4.8 1983 91 162 51.9 87 5.5 1984 95 161 75.8 123 5.6 1975-84 X- 136 56.3 5.2 1985 97 168 8.9 64 4.4
a ND No data.
17

..........
1-' oo Egg
Figure 3. Areas on the West Copper River Delta sampled during June-July, 1985 to determine goose nest predation rates. +
"' "' "'
<·-:··:;·.
E R R
D E
.> ' I j :'_! / ,.
'; ~.~;.I ;
(
. ~··
- ·r ( J '/~
.J ,J
5 ~liles"' ~.
'~"·" 0 F
N. ~·"'-.L A s K A'

Table 10. Fate of dusky Canada goose nests on the west Copper River Delta study area, 1959, 74-75 and 1982-85.
% Type destruction No. % % Fate % % % % %
Year nests Successful Abandoned unknown Destroyed Mammal Avian Flooded Unk
1959~ 1,162b 79.6 1.8 2.0d 6.0 0 88.6 0l~.:.~e1974c 81 82.7 2.5 NDd 14.8 NDd 0 NDd 1975 215 31.6 3.7 ND 64.6 NDd ---e 0 NDd 1982 158 49.2 1.8 NDd 49.0 45.0 33.8 0 21.8 1983 162 51.9 3.7 8.0 35.2 64.8 5.6 0 29.6 1984f 161 75.8 3.1 6.2 14.9 62.4 37.6 0 4.0 1985 168 (258)g 8.9 (7.0) 3.6 (1. 9) 6.5 (10. 9) 78.6 (81. 0) 76.6 19.1 0 4.3
a Trainer, 1959.
b Eggs rather than nests.
c Bromley, 1976.
d Not reported.
e Percentages not given, but major losses attributed to avian predators.
f Preliminary, pending further data analysis.
g Numbers in parentheses are for the study area plus additional sample areas on the CRD (Fig. 3).

An estimated total of 13,780 geese were observed during 3.5 hours of flying. The low nest success, and possibly, poor brood survival were reflected in an estimated population composition of only 3. 7% young, the lowest production effort on record. The absence of young geese in the population was confirmed during banding in late July when very few young, or flocks with young, were observed. Banding efforts also confirmed that a large majority of the Canada geese counted on the production survey were duskys, although the broad variation in sizes and plumage shading raises questions about the homogeneity of that subspecies.
For the 4th consecutive year, a segregation of barren flocks and flocks with young geese were observed during the production survey and banding operation. Virtually all of the family groups and flocks with young birds were observed on Egg Island or the western, mainland coast between Mountain Slough and Alaganik Slough. Large flocks comprising 1,000+ adult geese and no young were observed to the east of Alaganik Slough on larger coastal lakes. Major concentrations occurred between Pete Dahl and Story Sloughs.
Although faulty photography equipment prevented completion of the test photocensus, sufficient information was gained to indicate that a photocensus is feasible, at least in years of poor production when nonbreeders or unsuccessful breeders are concentrated along the coast, and would supplement the mid-winter index. The photocensus will be repeated in 1986 to further test reliability and methodology. Spring aerial surveys are also being refined by the USFWS and may eventually provide a 3rd dusky population index.
Population Status
As specified in the Dusky Canada Goose Management Plan (Pacific Flyway Council, 1985), the mid-winter inventory is used to estimate the post-season population size of duskys. The 1984-85 post-season population estimate of 7,500 geese (Cornely and Jarvis 1985) compared with a calculated 1984 fall flight estimate of 11,900, indicates that 4,400 geese were unaccounted for in late winter 1985 (Table 11). Due to a wide disparity between the calculated fall flight, which is based on the calculated breeding grounds population plus estimated production of young, and actual number of geese observed in July, the 1985 fall flight estimate ranges between 7,730-14,000 geese. The disparity between the calculated fall flight and the actual number of geese observed on the Copper River Delta in July sheds some doubt on the usefulness of the mid-winter inventory in estimating the size of the dusky population.
20

Table 11. Summary of population and production data for dusky Canada geese, 1971-85.
Mid-winter population Spring Young Fall Fall - sp5ing
Year index populationa
produced flight losses
1971 19,800 19,060 3,690 22,750 4,850 1972 17,900 17,230 2,045 19,275 3,475 1973 15,800 15,210 8,560 231770 5,170 1974 18,600 17,900 18,935 36,835 10,335 1975 26,500 25,510 5,565 31,075 8,075 1976 23,000 22,140 6,975 29,115 5,015 1977 24,100 23,200 18,460 41,660 17,660 1978 24,000 23,100 7,635 30,735 5,235 1979 25,500 24,545 4,680 29,225 7,225 1980 22,000 21,175 6,575 27,750 4,750 1981 23,000 22,140 4,830 26,970 9,230 1982 17,740 17,075 5,310 22,385 5,385 1983 17,000 16,360 2,890 19,250 9,150 1984 10,100 9, 720 2,180d 11,900 4,400 1985 7,500 7,220c 510
a Mid-winter less 0.0375 mortality (Chapman et al. 1969).
b Fall flight forecast minus mid-winter population estimate.
cAn estimated 13,780 geese were observed on the Copper River Delta in July 1985.
d Based on a sample of 13,780 geese.
21

Banding
As recommended by the Dusky Subcommittee of the Pacific Flyway Technical Committee, duskys were banded and collared for the 2nd consecutive year. A total of 2,151 geese was captured between 20-21 July using portable drive nets and a Bell 206 Jet Ranger helicopter. Fifty-seven of these were geese collared in 1984, 214 were geese banded in 1984 or marked (banded and/or collared) prior to 19 84, 91 were recaptures of birds marked in 19 8 5 and 1,789 were unmarked geese (Table 12).
One thousand nine hundred fifty-eight geese were collared: 212 previously-banded birds (including 1 lesser Canada goose banded in Cook Inlet in 1980), 23 collar replacements (worn or lost collars), and 1,723 unmarked geese. Age and sex of geese marked in 1985 was 1,056 "after hatching year males" (AHYM), 911 "after hatching year females" (AHYF), 14 "after hatching year unknown sex "(AHYU), 8 male goslings (LM), 22 female goslings (LF), and 7 goslings of unknown sex (LU) . Of the 57 geese collared in 1984 and recaptured in 1985, 13 were missing collars for a 1st year collar loss rate of 22.8%. An additional 6 collars placed on geese in 1984 were replaced due to severe cracking and breakage.
All band return data, since banding was initiated in 1951, has been obtained from the USFWS Bird Banding Laboratory and is currently being analyzed. Analysis should be complete by late winter or early spring 1986. A preliminary distribution of band returns is presented in Table 13.
22

Table 12. Summary of dusky Canada geese captured and marked on the Copper River Delta, 1985.
Banding Total No. collar Adults markedb Goslings marked
location captured recapturesa Male Female Unk Male Female Unk Mortalities
Glacier Slough 293 53 134(3) 104 3 ( 1) 0 0 0 1 Mountain Slough 165 31 67 (10) 49 (1) 0 7 18 4 0 Tiedeman Slough 213 6 113 (1) 89 6 0 0 0 0 Egg Island 56 0 28 20 0 1 4 3 0 Walhalla Slough 326 1 167(1) 158 1 0 0 0 0 Pete Dahl Slough 463 7 245 207 3 (1) 0 0 0 1 Stuckagain Slough 134 46 48 40 (1) 1 0 0 0 0 Castle. Island 501 7 254 (4) 244 0 0 0 0 0
a Includes geese collared in 1970's and 1984. N w b
Numbers in parentheses are for replaced collars.

Table 13. Preliminary distribution of band recoveries from dusky Canada geese harvested since 1951, as of 2 September 1985.
Hunting British season N Alaska Columbia Washington Oregon Other
1951 3 0 0 0 100.0 0 1952 35 17.1 2.9 5.7 74.3 0 1953 105 8.6 24.8 8.6 58.1 0 1954 201 10.0 7.0 18.4 64.2 0.5a 1955 92 5.4 4.3 9.8 80.4 0 1956 86 4.7 26.7 9.3 59.3 0 1957 172 4. 1 22. 1 8. 1 64.5 1. 2a 1958 135 4.4 14.1 11.1 70.4 0 1959 140 7.1 22.1 4.3 66.4 0 1960 156 5. 1 19.9 17.3 57.7 0 1961 48 12.5 18.8 12.5 56.3 0 1962 105 13.3 11.4 11.4 63.8 0 1963 123 5.7 15.4 6.5 69.9 2.4a 1964 64 4.7 7.8 18.8 68.8 0 1965 112 7.1 14.3 14.3 63.4 0.9 1966 95 9.5 7.4 3.2 80.0 0 1967 73 8.2 6.8 16.4 68.5 0 1968 96 9.4 17.7 10.4 62.5 0 1969 97 10.3 10.3 11.3 68.0 0 1970b 159 10.7 8.2 8.8 72.3 0 1971 67 11.9 6.0 9.0 73. 1 0 1972 103 9.7 0 8.7 80.6 l.Oa 1973 66 18.2 4.5 10.6 66.7 0 1974 191 13.6 5.2 13.6 67.5 0 1975 194 13.9 5.2 13.9 67.0 0 1976 235 10.2 10.6 14.0 64.7 0.4c 1977 1978
243 236
16.5 24.2
4.9 2. 1
9. 1 13.6
69.1 57.6
0.4a a
2.5 ' d
1979 98 16.3 2.0 12.2 69.4 0 1980 104 2.9 2.9 8.7 84.6 l.Oa 1981 69 4.3 0 10.1 85.5 0 1982 33 24.2 0 9.1 63.6 3.0e 1983 76 6.6 0 5.3 88.2 0 1984 56 19.6 8.9 8.9 62.5 0
X ± SD 10.6±5.7 9.5±7.8 10.7±3.8 68.8±8.3f
a California.b Incomplete recovery listing for this year. A corrected listing is currently being incorporated into the data base and may slightly change distribution in previous years.c Minnesota.d Utah. e Idaho.f Excluding 1951.
24

BROWN BEAR ACTIVITY AND IMPACTS ON NESTING GEESE ON THE WEST COPPER RIVER DELTA
Introduction
A 3-year investigation of the activity of brown bears (Ursus arctos) and their impact on nesting dusky Canada geese, was initiated in 1984 (Campbell and Rothe 1985). A comprehensive progress report for the 1st year of this study was completed in early 1985. Data collection and analysis for the 2nd year of the study are currently underway and will be summarized in a progress report in early 1986. The following is a brief, preliminary summary of activities during the report of survey and inventory 1985).
period covered activities (1
by Sep
this 1984-31
annual Aug
July-Winter 1984 and Spring 1985 Investigations
Bears that were radio-tagged in the spring of 1984 were relocated 9 times during late summer through fall of 1984 to determine fall home ranges, habitat use, denning areas, and denning dates. Unfortunately, due to at least a 50% radio failure rate (Table 14) and inability to locate dens, these objectives were not fully accomplished. Average summer-through-fall home ranges for 7 bears that were relocated through September were 91.2 mi 2
(Table 14). Because the locations of the few dens that were found extended home ranges, it is likely that the actual average home range size for the summer-to-denning period was larger. Male bears maintained an average home range of 127 ± 10.7 mi 2
while the average female home range was 64 ± 28.8 mi 2 • Centers of activity shifted inland appreciably in July when bears moved onto interior Delta salmon streams (Figure 4). This shift was reflected in habitat selection with over 87% of the late summer and fall relocations occurring in inland tall-shrub or forest habitats (Table 15) as compared with 24% in the same habitats during May-June (Campbell, unpubl. data).
Dens of 2 marked bears, an adult male and an adult breeding female, and of 3 unmarked bears, were located during the winter of 1984-85. Elevation of these dens ranged from 600 to 2, 400 feet. Based on the location of dens, late fall bear observations, spring bear observations, and sign, at least 2 areas in the foothills of the Chugach Mountains are important denning areas for brown bears. These are the upper !beck Creek-Scott Glacier area and the Sheridan Glacier-Sherman Glacier-McKinley Peak area. The 2 marked bears entered dens sometime after 11 November 1984. Signs of activity were observed at the adult male's den on 18 April and signs of activity or bears were observed at all 6 den sites by 6 May 1985.
Brown bears moved onto the Delta in mid-May in 1985, about 2 weeks later than in 1984. Eight animals, 4 males and 4 females, were captured and marked between 20-23 May 1985 (Table 16). Two of these were immature bears that had dropped breakaway collars
25

Table 14. Sex, a~e, breeding condition, seasonal home ranges, and status of radio-collared brown bears on the Copper River elta, 1984.
Reproductive May-Jun~ Sunnner-fap Date of last Current Bear Sex Age condition area (mi ) area (mi ) relocation status
013 F 10.5 Breeding 50.3 103.6a 8/15/84 Transmitter failure, observed with 3 cubs-of-the-year on CRD 7/18/85.
017 M 12.5 Breeding 121.6 139.2 11/9/84 Unknown, suspected transmitter failures possible obs. 10/17/8 •
040 F 15+ Breeding 39.2 39.2 9/21/84 Transmitter failure, on CRD 8/29/85.
observed
091 F 2.5 Inactive 84.8 105.6 11/9/84 Unknown, breakawaS collar dropped fall 19 4.
102 F 12.5 With unk ayecub unti Aug, breeding
24.2 58.8 10/23/84 Transmitter failure, observed on CRD 7/25/85 with cub-ofthe-year.
N O't
104 M 6.5 Breeding 53.8 118.5 Relocated all winter, den located.
Shot 5/12/85.
105 F 5.5 Lost yrlg cub,breeding
37.5 53.0 Relocated all winter, den located.
Unknown, sus~ected transmitter failure 9/ 5.
106 M 2.5 Inactive 92.2 124.4 11/9/85 Alive, transmitter functioning.
108 F 3.5 Inactive 57.8 57.8a 8/15/85 Recaptured 1985, functioning.
transmitter
X 62.4±31.1 91. 2±39. 9
a Not used to compute average home ranges, data incomplete due to early disappearance from study area in 1984.

1 0
N ~
.. •• 0
0
E 0 .. ... •• ::a
J)(
I
p • • •
Hat o h
POtJOftdJ et al. 1171) -----------------~
0~~~~--~--~~~~--~--~~~~--~--r-~---r--,---r-~--~--~~~~--~--r-~,.. 20 II 30 1 I to 11 tl 12 IS 11 It • 2 1 '1
M a J June JuiJ Aut leP 0 0 t Nov
D a t e Figure 4. Distribution of tagged and characteristically marked untagged bears in relation to the coast and general habitat types on the west Copper River Delta, 14 ?1ay-ll Nov. 1984 (Campbell 1985).

Table 15. Distribution of brown bear relocations, by habitat type, on the West Copper River Delta,July-November 1984.
Habitat T~Ee Coastal Coastal Inland Lowland Upland Montaine
Aye No. sedge meadow alder/willow alder/willow spruce forest spruce forest meadow Other c ass relocations % % % % % % %
All 54 7.4 1.9 48.1 7.4 31.5 1.9 1.9
Adults 35 5.7 0 57.1 2.9 28.6 2.9 2.9
Immatures 19 10.5 5.3 31.6 15.8 36.8 0 0
N 00

Table 16. Association, sex, age, and current status (as of 1 September 1985) of brown bears captured on the West Copper River Delta during 1985.
Association Bear at
Date no. Sex Age capture Status
20 May 010 F 7.5 2 yearling cubs Adult tagged.
108 F 4.5 none Retagged, original breakaway collar missing.
21 May 011 F 10.5 2 yearling cubs Adult tagged.
020 M 5.5 none Tagged.
106 M 3.5 none Retagged, original breakaway collar missing. N ~
22 May 014 F 10.5 2 yearling cubs Adult tagged.
23 May 015 M 1.5 sibling Separated from No. 014 on 5/22, tagged to determine fate.
016 M 5.5 none Tagged.

during the previous winter and one was a yearling cub. The yearling cub and sibling were separated from the adult during her capture and remained separated by 5-7 miles for 48 hours. The larger (male) cub was captured and outfitted with a breakaway collar to determine the fate of the apparently deserted cubs. Within female.
48 hours of their capture the cubs had rejoined the
May-June 1985 Investigations
Based on the number of radio-collared untagged bears, and offspring, a minimum
bears, of 33
distinguishbrown bears
able were
active on the west Copper River Delta during the May-June goose nesting period. Of these, 40% were 1.5-or-less years old and an additional 15% either appeared, or were known to be, immature (4.5-or-less years old).
Radio-tagged animals were relocated a total of 231 times between 22 May-7 July when geese were nesting. Each bear was relocated an average of 26 times. Home ranges averaged 51 ± 33.8 mi 2 (Table 17) compared with 59 mi 2 during the same period in 1984 (Table 14). Average home range for age classes and reproductive status were adult males: 95 ± 49.0 mi 2 , all adult females: 32 ± 15.7 mi 2 , females with cubs: 27 ± 16.3 mi2, and immature bears 58 ± 7.1 mi2.
A zonation of bear activity by age class and reproductive condition, similar to that in 1984 (Campbell, unpubl. data) was observed on the Delta during the period when geese were nesting. The average distance from the coast, for all relocations of immature and female bears with cubs, was 1.9 miles compared with 4. 6 miles for adult males and breeding females. Zonation of activity was also reflected in habitat use (Table 18). Fiftynine percent of the relocations of immature bears and females with cubs were in coastal sedge marshes (29%) or alder/willow thickets (30%) , while over half (54%) of the relocations for breeding bears were in inland alder/willow thickets.
Nest predation was high in 1985 (Table 10). While data analysis is not yet complete, a major portion of the 81% nest loss is attributed to brown bears. Since 91% of the 120 bear relocations in or near major goose nesting areas were of either immature animals or sows with cubs, a relationship between high nest predation and the activities of immature or female bears with cubs is probable.
1986 Work Plan
Radio-collared brown bears will be relocated twice per month until they have denned to determine late summer and fall home ranges, habitat use, denning time, and location of den sites. If necessary, a late winter search for dens will be conducted to
30

Table 17. Horne range of radio-tagged brown bears on the West Copper River Delta, 22 May7 July 1985.
Reproductive Number of Area Bear Sex Age condition relocations (rni 2 )
010 F 7.5 With 2 yearling cubs 26 24.4 011 F 10.5 With 2 yearling cubs 26 11.6 014 F 10.5 With 2 yearling cubs 25 44.0 (60. 0) a 015 M 1.5 Cub of No. 014 25 41.2 (60.0)a 016 M 5.5 Breeding 25 60.4 020 M 5.5 Breeding 25 129.7 105 F 6.5 Estrus 27 32.6 106 M 3.5 Inactive 26 63.3 (286.8)a 108 F 4.5 Estrus (?) 26 53.3
w X 51. 2±33. 8 1-'
a Area in parentheses are horne ranges including major waterbodies such as Prince William Sound
and Gulf of Alaska.

Table 18. Distribution of radio-collared brown bear relocations, by habitat type, on the West Copper River during May-June 1985.
Coastal delta Inland delta UtlanqAge or Sed~e Alder/ Low- Shrub Alder/ Low Spruce Spruce A der/ Mountaine breeding Number of mea ow willow shrub bog meadow shrub forest forest willow meadow class relocations % % % % % % % % % %
All bears 257 19.1 20.6 4.7 4.7 26.1 2.3 6.6 13.2 2.3 0.4
Bears ac£ive on Delta 228 21.1 21.9 5.3 5.3 29.4 2.6 7.5 5.3 1.8 0
Males 113 19.5 27.4 3.5 5.3 33.6 2.7 5.3 2.7 0 0
Adult males 56 10.7 12.5 1.8 5.4 53.6 1.8 8.9 5.4 0 0
Femalesa 117 22.2 16.2 6.8 6.8 24.8 2.6 9.4 7.7 3.4 0
Femalesa with cubs 58 37.9 29.3 6.9 6.9 17.2 0 1.7 0 0 0
w N
Immature bears 85 22.4 30.6
a Excluding a female with 2 yearling cubs Heney Mtn. range and Point Whiteshed.
8.2 3.5
that spent over
12.9 2.4
90% of her time
4.7 10.6
to the west of
4.7
the Delta on
0
the

locate dens not located during the fall through early winter of 1985. Denned bears will be checked periodically during April-May in 1986 to determine approximate emergence dates. Once bears become active, additional animals will be tagged, with emphasis on 2~-year-olds accompanying marked sows. Radio-tracking will be intensified when geese begin to nest. At that time data pertinent to seasonal home range, habitat selectivity, and nest predation will be collected. After the peak of goose nesting, radio tracking will occur twice per month to determine bear activity on the Delta during the remainder of their annual activity cycle.
SPRING GOOSE MIGRATION IN COOK INLET
Since 1982, there has been a concerted effort to document the magnitude and timing of spring goose migrations through Cook Inlet and to assess the importance of the area's coastal marshes to staging geese (Campbell and Rothe 1985; Campbell, unpubl. data; Timm, unpubl. data; Petersen and Handel, unpubl. data; Handel and Gill, unpubl. data) . In 1985, coordinated surveys were conducted at 4 field sites and 5 aerial surveys were flown by U. s. Fish and Wildlife Service (USFWS) personnel, 18 April-22 May (Butler and Gill, unpubl. data). Alaska Department of Fish and Game crews were located at west Susitna Flats (28 April-10 May) and Redoubt Bay between the Kustatan and Big Rivers ( 30 April-10 May) . The USFWS crews were at Trading Bay and Redoubt Bay (between Big and Drift Rivers, 25 April-10 May) (Loranger and Eldridge, unpubl. data). The major objectives were to document numbers and subspecies composition of staging geese; to record habitat use patterns; observe major movements into and out of staging areas; and read as many neck-collar codes as possible on cackling Canada geese (Branta canadensis minima) .
Snow-melt and spring phenology was over 2 weeks late in comparison with 1980-84; especially in Redoubt Bay where snow cover persisted beyond 22 May. The lack of open coastal habitats contributed to a dramatic concentration of over 44,000 geese, mostly large Canadas, on sheltered agricultural fields and adjacent tide flats in the Matanuska Valley during the last 2 weeks of April. All areas west of the Susitna River, where most goose staging has occurred in the past, remained about 90 percent snow-covered through nearly all of the migration period. From 25 April-S May available habitat was very limited, consisting of tide flats, river mouths, and narrow zones along the berms of sloughs and rivers. High tides (30.9-33.2 feet) driven by southwest winds cleared zones along the shore of Cook Inlet and opened a large portion of the east Susitna Flats on 6 and 7 May. Consequently, most habitat use by staging geese was confined to the outer Puccinellia-Triglochin plant community. Field observations ind1cate that lesser Canada geese (B. £· parvipes) and tule white-fronts (Anser albifrons gambelli) followed the snowline inland farther than other geese.
33

Canada geese accumulated rapidly in upper Cook Inlet during the 3rd week of April and peaked at 70,516 as determined from a 25 April aerial survey (Butler and Gill, unpubl. data) . These early birds were predominately B. .£· parvipes, although B. c. taverneri and a few cacklers were observed. On 29 April, a major southwesterly movement of over 12,500 Canada geese, including 366 cacklers, was recorded passing the western edge of Susitna Flats from the direction of the Susitna River mouth.
Cacklers were first recorded on the ground by field crews at Susitna (100+) and Redoubt (100) on 30 April and were seen arriving from the southeast (Turnagain Arm) at high altitude on 3 May. The number of cacklers on the west side of Cook Inlet peaked on 5 May at west Susitna Flats (1, 500) and on 6 May at Redoubt Bay (800). The 1st movements out of Cook Inlet were observed on 4 May when 300 dark geese and over 1, 000 pintails went through Lake Clark Pass. Cacklers were seen leaving through the pass on 5 May (300-400) and 6 May (230) in front of a major weather system. By 9 May, a few cacklers were still arriving, but area estimates were: less than 500 at Susitna, 650 at Trading Bay, and about 1,300 at Redoubt Bay. Cackler departures from Redoubt Bay were noted on 10 May when crews left field sites.
Over the study period, 7 3 individual cacklers were identified from yellow neck collars: Susitna, 42; Redoubt Bay, 31; and Trading Bay, 0. None of the cacklers identified at any of the sites were recorded elsewhere (Susitna, 42; Kustatan River, 14; Big River, 10; Montana Bill Creek, 9) indicating there was little lateral mixing of cacklers along the coast. In addition, turnover rates on study sites appeared high; 74 percent of the collars were read only once. Eleven birds were seen twice, 5 were seen over 3-day periods, and one each was seen over 4-, 5-, and 7-day periods.
These observations indicate that, in 1985, cacklers arrived on a broad front from the east, spent little time staging in Cook Inlet and departed through several passes in the Alaska Range. Birds identified only at Susitna could have departed, undetected, through Merrill Pass between the Susi tna and Trading Bay study sites. From over 13,000 observations of cacklers, ratios of collared:uncollared birds were: Susitna 1:68, Big River (north Redoubt) 1:105, and Montana Bill Creek (central Redoubt) 1:140. These observed collar ratios indicate that approximately 7, 500 cacklers occurred in the Susitna and Redoubt study areas.
Aerial surveys were especially useful in documenting the number and distribution of white-fronted and snow geese (Butler and Gill, unpubl. data) . Snow geese accumulated on the Kenai and Kasilof Flats from mid-April to a peak of 15,350 on 26 April. Snows increased steadily on west Cook Inlet areas through
34

29 April when net movement across Susitna Flats was southwesterly. On 1 May, a net movement to the northeast was recorded and snow geese accumulated rapidly on Susi tna Flats. A concurrent build-up at Redoubt Bay reached 11,800 on 3 May and peaked about 6 May. Snows diminished on west Susitna Flats after 5 May and apparently moved east of the Susitna River where a peak of 20,800 was recorded on 9 May. Peak numbers of snow geese in Cook Inlet were tallied on aerial surveys 2-3 May (34,000) and 9-10 May (32,100) indicating that major departures occurred after the ground crews left field sites.
As in past years, observations of white-fronted geese were insufficient to detect major migration patterns. White-front chronology generally resembled that of other geese and a peak of about 1,900 was recorded on the 2-3 May survey, mostly at Trading and Redoubt Bays. An unknown but considerable portion of these birds could have been tule white-fronts that breed locally in these areas. Black brant also were seen at Redoubt Bay from 1-10 May, the largest group being about 100 birds at the mouth of the Kustatan River.
LITERATURE CITED
Bromley, R. G. H. 1976. Nesting and habitat studies of the dusky Canada goose (Branta canadensis occidentalis) on the Copper River Delta, Alaska. M. S. Thesis. Univ. Alaska, Fairbanks. 81pp.
Campbell, B. H., and T. C. Rothe. 1985. Annual report of survey-inventory activities. Part XIII. Waterfowl. Vol. XV. Alaska Dep. Fish and Game. Fed. Aid in Wildl. Rest. Proj. W-22-3. Job 11.0. Juneau. 31pp.
Carney, s. M., M. F. Sorenson, and E. M. Martin. 1985. Waterfowl harvest and hunter activity in the United States during the 1984 hunting season. U. S. Fish and Wildl. Serv. Admin. Rep. 27pp.
Chapman, J. A., C. J. Henney, and H. M. Wright. 1969. The status, population dynamics, and harvest of the dusky Canada goose. Wildl. Monogr. 18. 44pp.
Cornely, J. E., and R. L. Jarvis. 1985. Status of Canada geese wintering in western Oregon and southwestern Washington. Rep. to the Dusky Canada goose Subcommittee, Pac. Flyway Waterfowl Tech. Comm. 7pp.
Pacific Waterfowl Flyway Council. 1985. Dusky Canada Goose Management Plan. Dusky Canada Goose Subcommittee, Pacific Waterfowl Flyway Council Tech. Comm. 35pp.
35

Timm, D. E. 1972. Report of survey-inventory activities. Waterfowl hunter mail questionnaire survey. Vol. III. Alaska Dep. Fish and Game. Fed. Aid in Wildl. Rest. Prog. Rep. Proj. W-17-4. Job 10.0. Juneau. 17pp.
1972. Report of survey-inventory activities. Vol. III. Waterfowl. Alaska Dep. Fish and Game. Fed. Aid in Wildl. Rest. Prog. Rep. Proj. W-17-4. Job 10. Juneau. 46pp.
1977. Report of survey-inventory activities. Vol. VIII. Waterfowl. Alaska Dep. Fish and Game. Fed. Aid in Wildl. Rest. Prog. Rep. Proj. W-17-9. Job 11.0-11.3 and 22.0. Juneau. 27pp.
1978. Report of survey and inventory activities. Vol. IX. Waterfowl. Alaska Dep. Fish and Game. Fed. Aid in Wildl. Rest. Prog. Rep. Proj. W-17-10. Job 10.0. Juneau. 27pp.
Trainer, c. E. 1959. The 1959 western Canada goose (Branta canadensis occidentalis) study of the Copper River Delta, Alaska. In Annual waterfowl report, Alaska. U. S. Fish and Wild!. Serv. Juneau. 9pp.
36