alan kropp & associates - berkeley lab kropp & associates ... 2335-12 project: slide...
TRANSCRIPT

Alan Kropp & Associates Memorandum Date: May 29, 2009 AKA Project No.: 2335-12 Project: Slide Investigation Building 25 Area Project
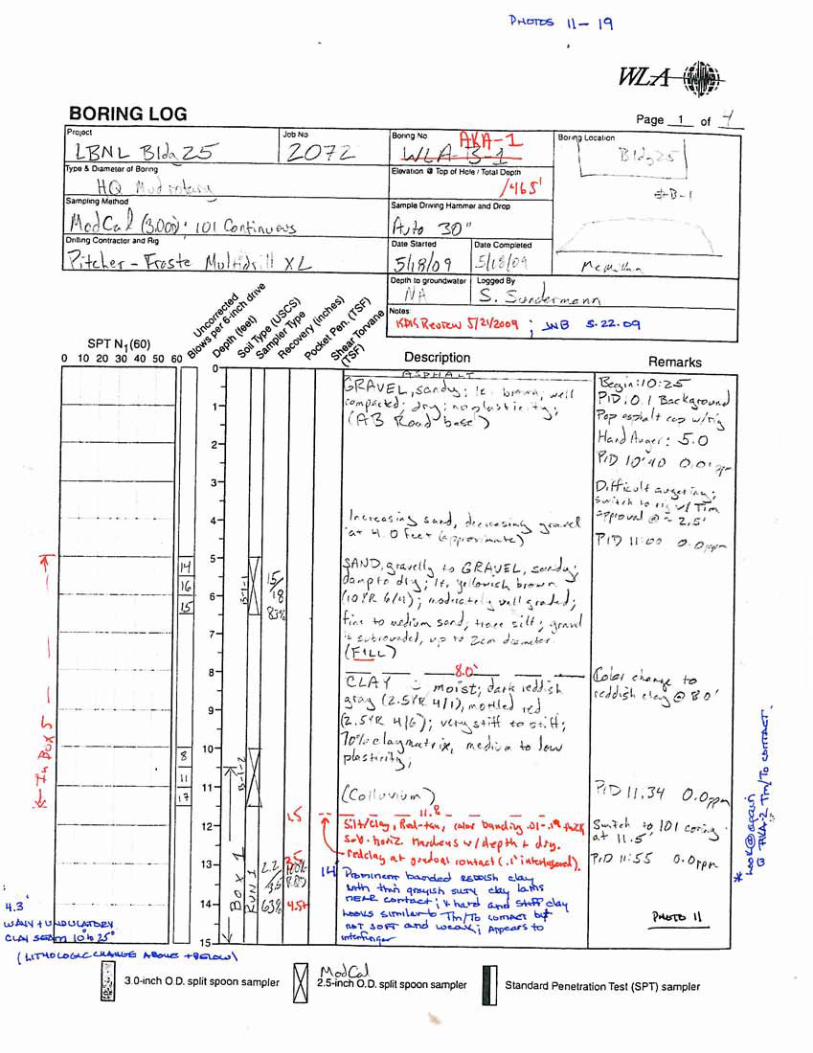
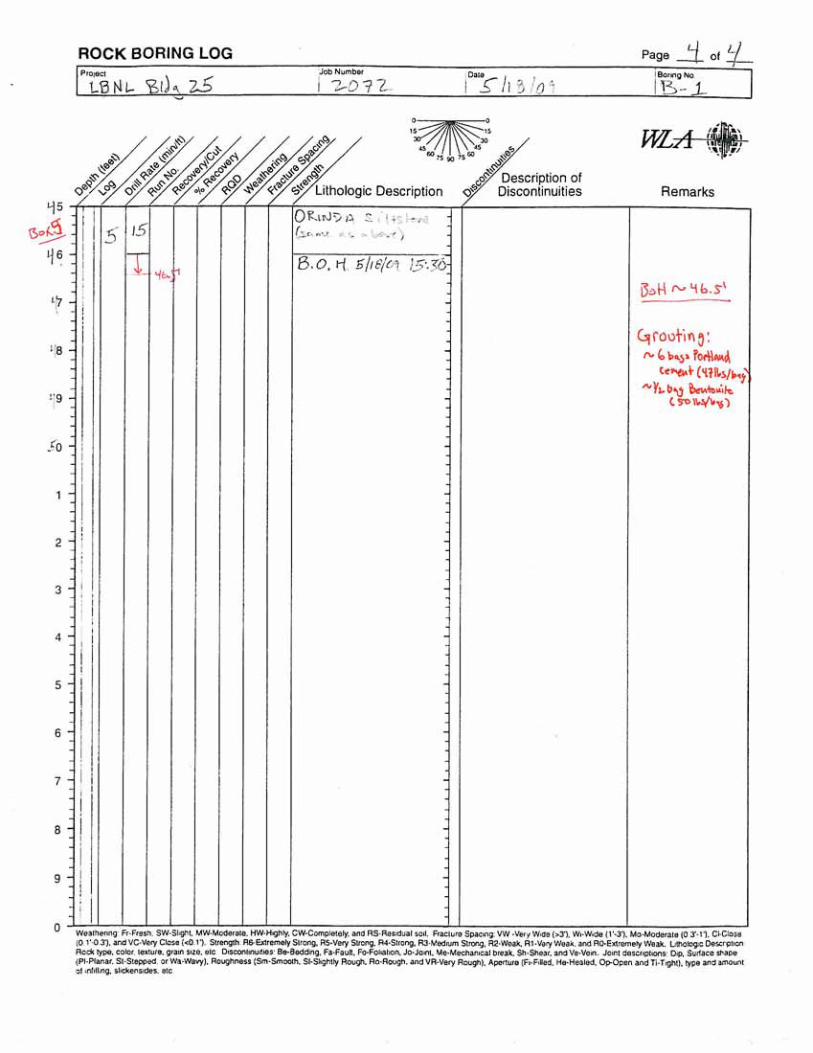
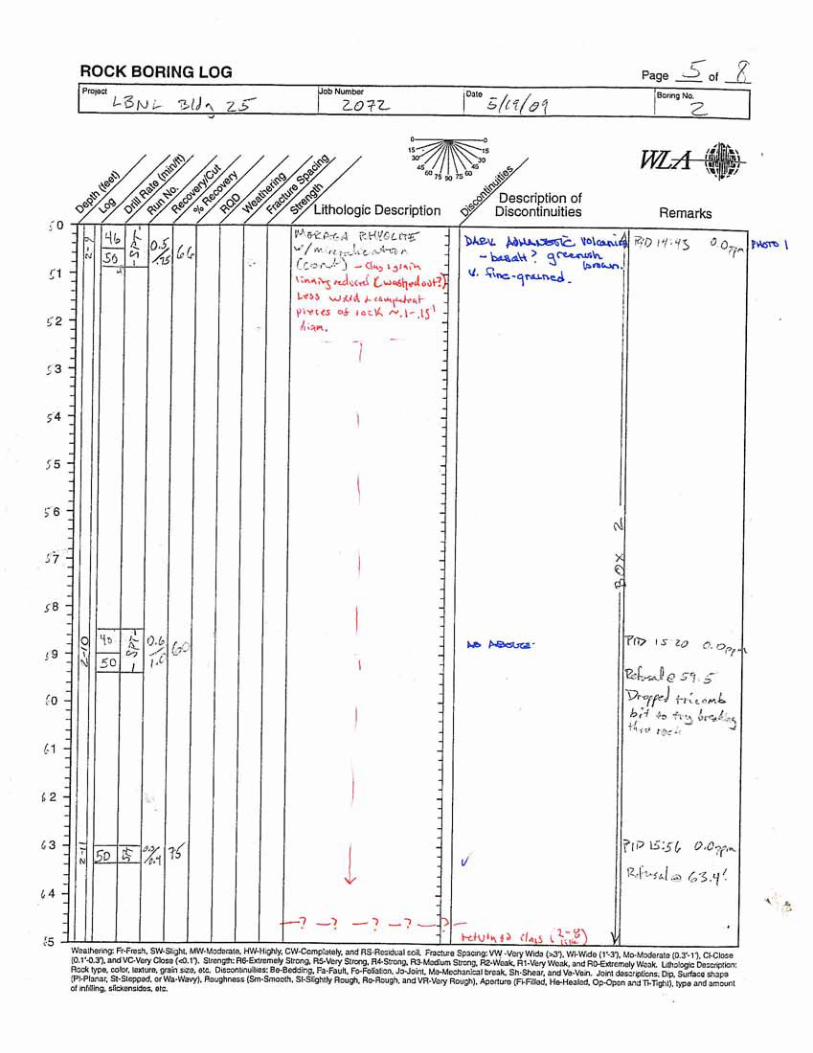
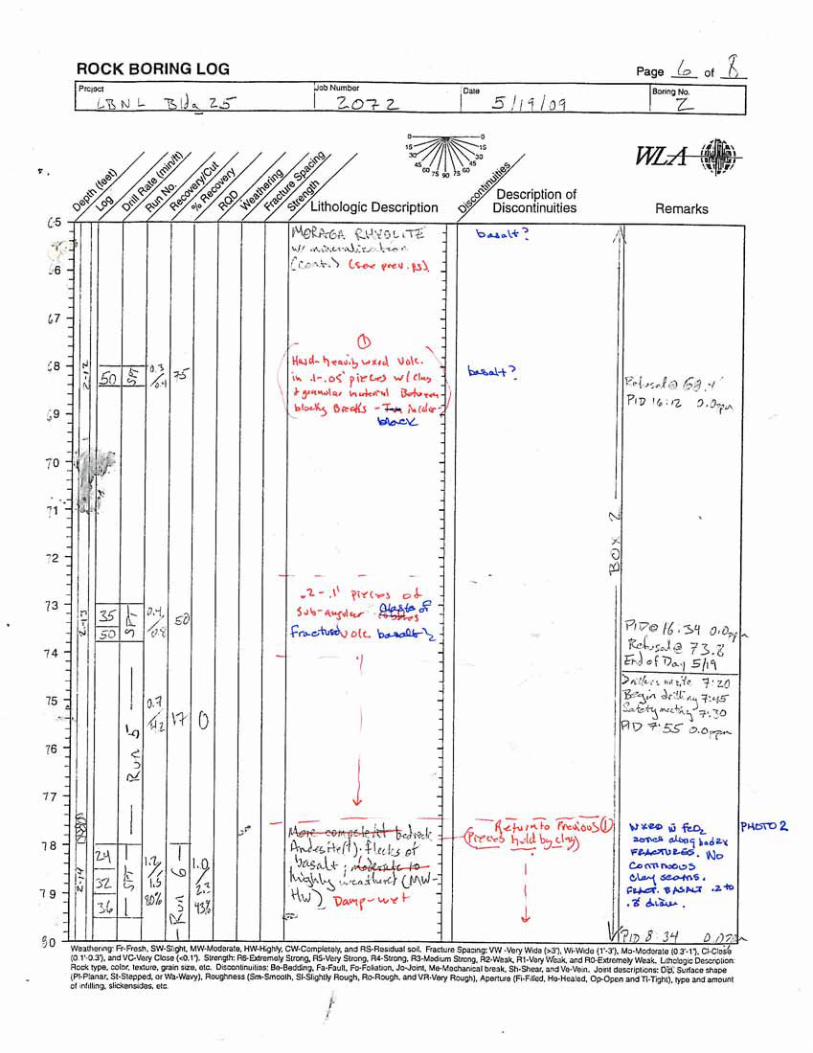
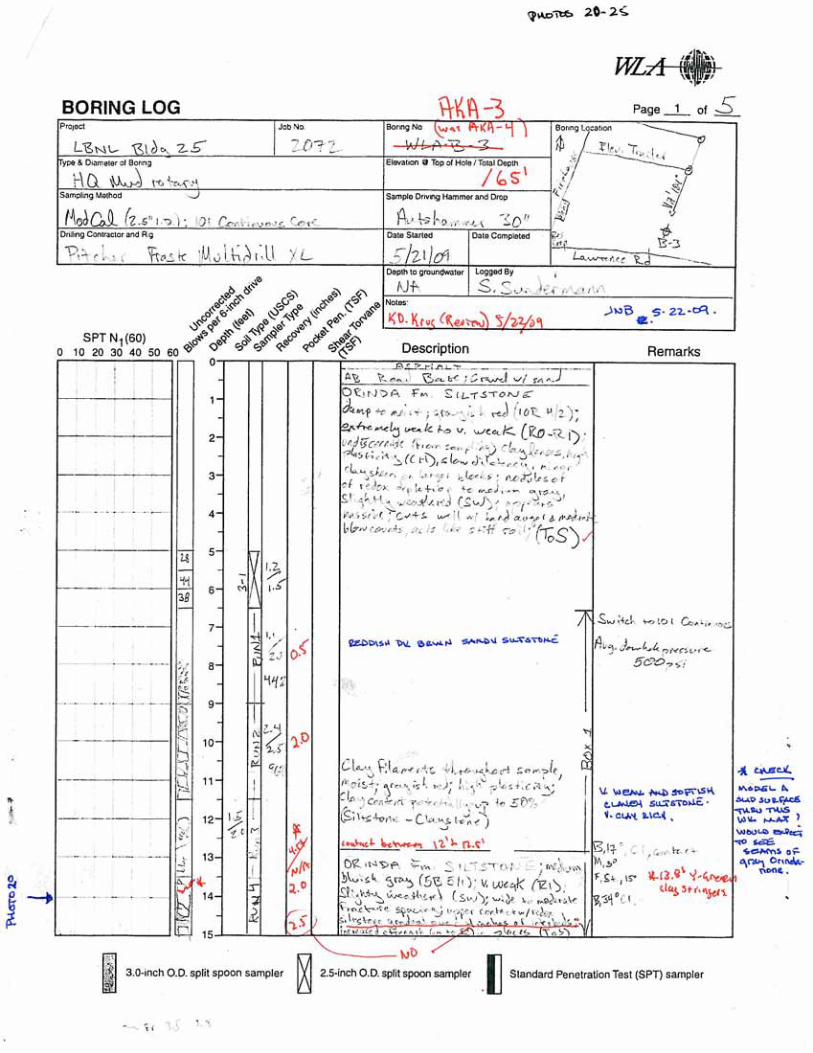
(LBNL Subcontract No. 6881630) To: Sheree Swanson From: Wayne Magnusen, G.E. R.E.: Summary of Preliminary Investigation and Analyses This memorandum summarizes the results of our preliminary investigation and analyses of a previously-mapped “paleolandslide” beneath Building 25 at the Lawrence Berkeley National Laboratory (LBNL). Alan Kropp & Associates (AKA) and William Lettis & Associates, Inc. (WLA) provided services in general accordance with AKA’s May 7, 2009 proposal, which was authorized under LBNL Subcontract No. 6881630. This memorandum has been prepared for the exclusive use of LBNL and their consultants for specific application to the proposed project in accordance with generally accepted geologic and geotechnical engineering practices. No other warranty, expressed or implied, is made. Purpose and Scope LBNL is considering various scenarios under which a new building would be constructed at the general location now occupied by Building 25. The purpose of our preliminary study was essentially threefold: To confirm or refute the existence of a previously mapped landslide beneath Building 25; To develop preliminary interpretations of geologic conditions in the Building 25 area; and To analyze slope stability and seismic deformations based on the preliminary geologic interpretations. The preliminary study was conducted over a two week-period in order to meet LBNL schedule objectives. For this reason, the scope of our investigation and analyses were limited to what could be reasonably completed within the targeted timeframe. The scope of the investigation included a preliminary review of existing data, geologic field reconnaissance, drilling three test borings (AKA-1 to AKA-3), and detailed geologic review and interpretation of the retrieved core (hand-edited logs of the borings are attached). The scope of the geologic analyses included developing a conceptual model of probable geologic conditions (preliminary geologic map and cross sections attached). The scope of our engineering analyses included evaluating slope stability and seismic deformations using simplified limit-equilibrium and pseudostatic-based methods (printouts from computer analyses are attached). The scope of our reporting consisted of a meeting with LBNL representatives (on May 28, 2009) to present the preliminary results, and this brief summary memorandum with attachments. It is understood by LBNL that additional data review, investigation, analyses, consultation, and design-level reporting would be needed to augment this preliminary study if LBNL proceeds with the design of a new building at the subject Building 25 site.
Page 1 of 3

Summary of Key Findings The key findings of this preliminary study include the following: 1. The geologic conditions encountered in the borings are considered generally consistent with the pre-
existing paleolandslide hypothesis. For instance, sheared bedrock materials were encountered at or near the target depths we established using information presented in the RCRA Facility Investigation (RFI) report.
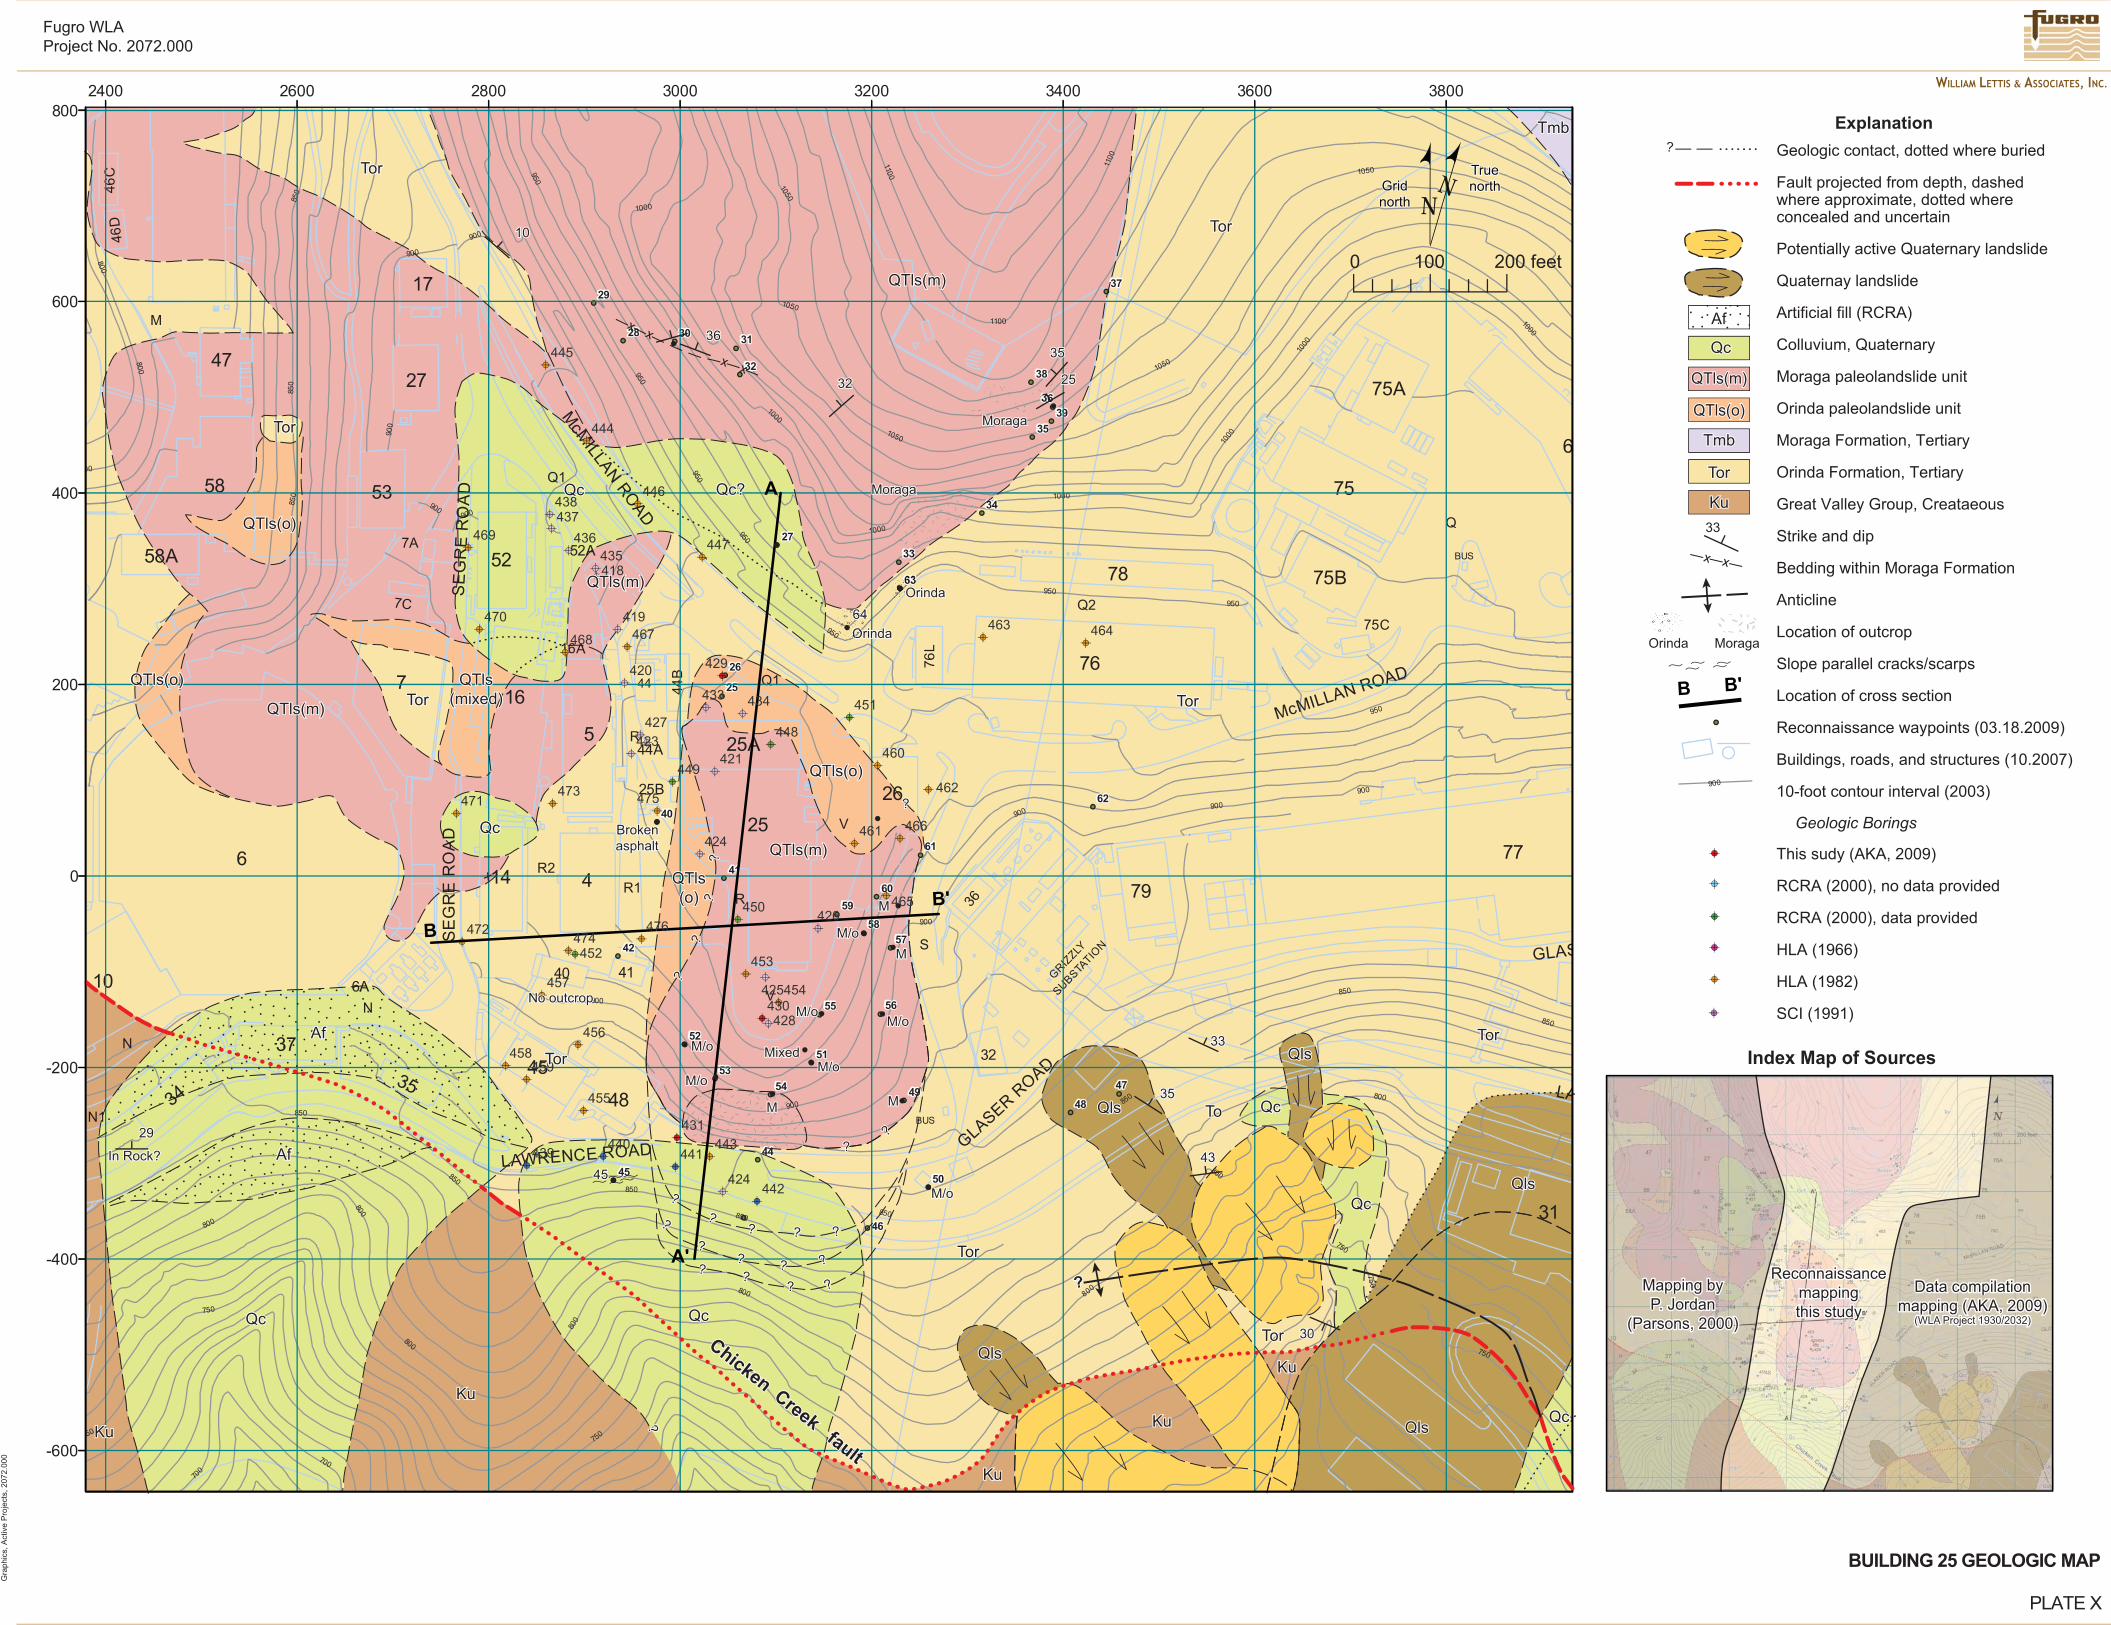
2. The vertical and lateral dimensions of the interpreted paleolandslide shown on the attached figures is based on the subsurface investigation, data compilation and review of previous boreholes in the vicinity of Building 25, geologic mapping and interpretation of historical aerial photography. The interpreted landslide geometry from this study differs somewhat from that presented in the RFI report; most significantly, it is permissible to interpret the Orinda Formation beneath Lawrence Road as potentially a part of the paleolandslide rather than “in-place” bedrock.
3. Our qualitative evaluation of historic aerial photography did not identify any geomorphic features suggestive of recent landsliding. We consider absence of such features together with our observation of generally rounded and subdued surface topography to be generally consistent with the hypothesis that the paleolandslide deposits are geologically stable.
4. Our geologic reconnaissance confirmed the general absence of kinematic indicators and landslide-related geomorphology that show the paleolandslide landslide to be active since the site was developed. Curb offsets noted in the road between Building 25 and Building 4 were found to be inconclusive with respect to evaluating historic landslide activity.
5. Backcalculation of shear strength using pre—grading topography and groundwater levels about 5 feet above their current elevations resulted in a slide plane friction angle of 15 degrees assuming zero cohesion. This value is low relative to laboratory tests performed on samples from nearby LBNL sites (typically closer to 20 degrees).
6. Our quantitative evaluation of slope stability using the 15 degree friction angle value resulted in very low factors of safety for the existing condition (FS<1.03). We judged this analysis to be overly conservative based on existing site geologic and geomorphic conditions.
7. Our quantitative evaluation of slope stability using a 20 degree friction angle resulted in a static factor of safety of 1.39. We judged this result to be generally reasonable and noted that strength values higher than about 20 degrees could not be justified based on our visual review of the retrieved core samples (note that no geotechnical laboratory testing was performed as part of this preliminary study).
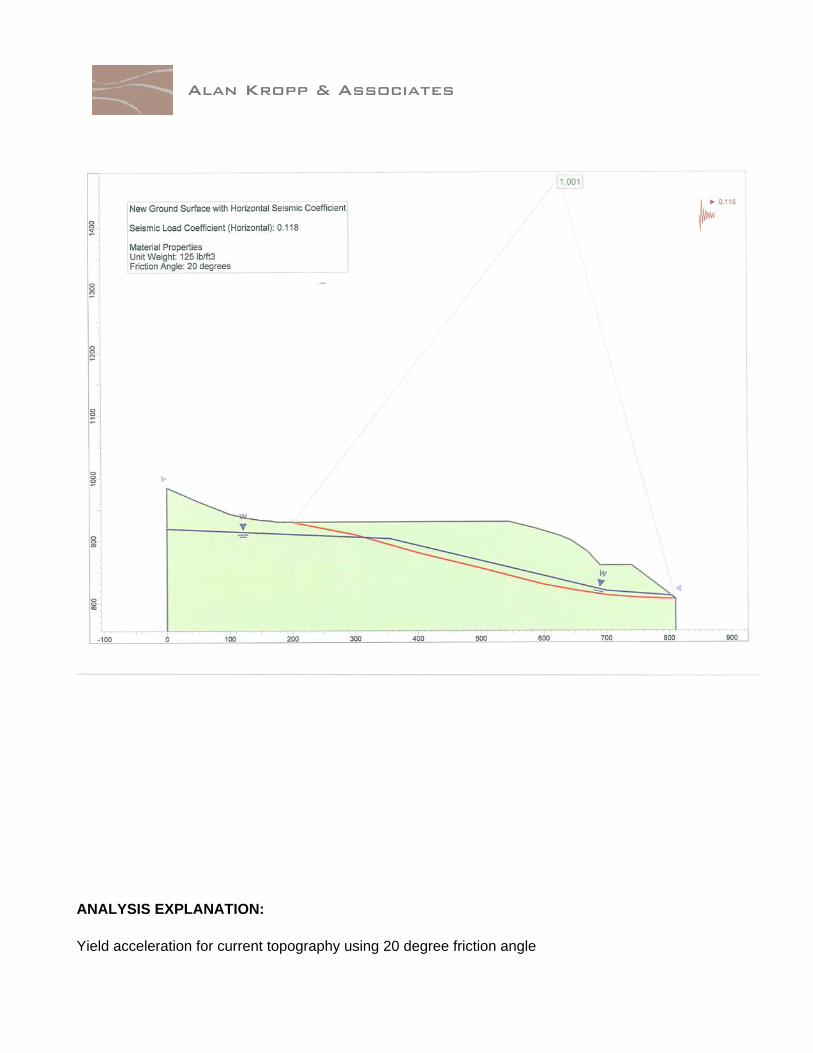
8. Our quantitative evaluation of yield acceleration of the slide mass (the out-of-slope horizontal pseudostatic acceleration at which the factor of safety equals 1.0) resulted in a value of 0.118 times the acceleration of gravity (g). This is the acceleration value at which the landslide would start to slide incrementally during a seismic event.
9. Our quantitative evaluation of deviatoric slope displacements (cumulative slope movement during an earthquake) using the 0.118 yield acceleration and ground motions obtained from the 2008 URS spectra for a 475-year return period level of hazard at an LBNL rock site resulted in a median displacement value of about 3.5 feet.
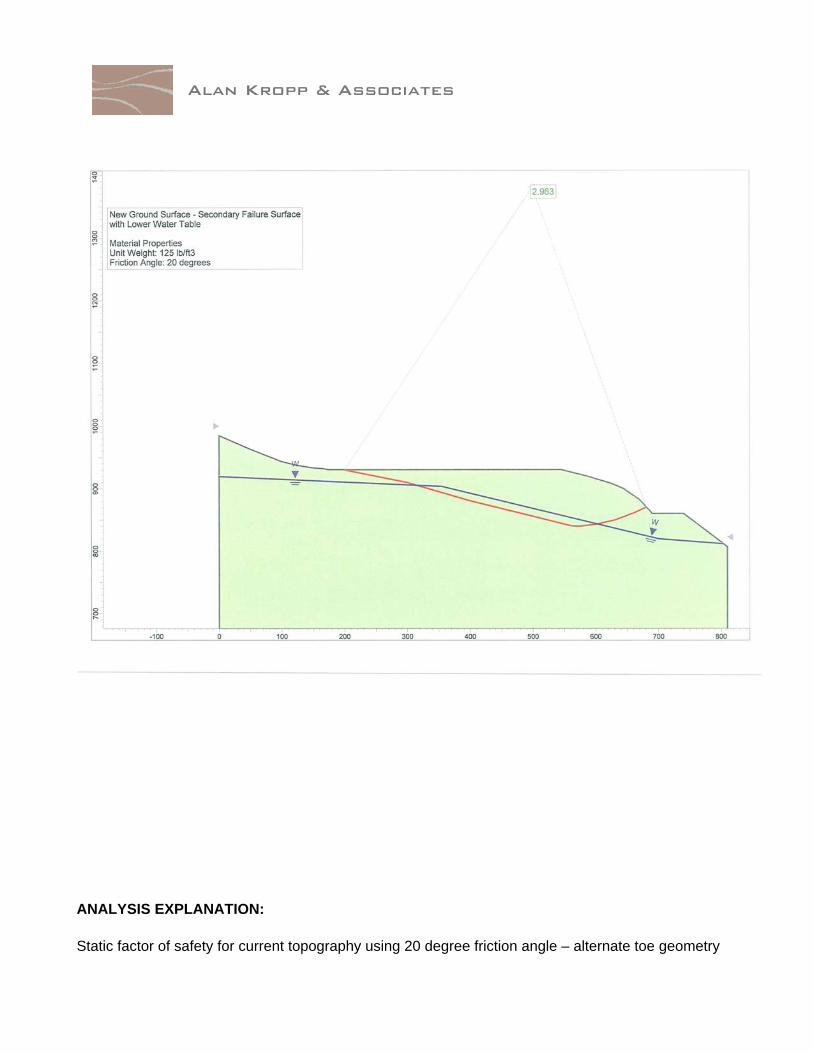
10. We re-evaluated slope stability and deviatoric slope displacements using an alternate and more favorable slide plane geometry where the Orinda Formation beneath Lawrence Road is “in-place” and not a part of the paleolandslide. These quantitative evaluations resulted in a static factor of safety of about 3.0, a yield acceleration of about 0.24, and a median seismic displacement value of about 1.3 feet.
Page 2 of 3

Page 3 of 3
Discussion The calculated median displacement values for the site (1.3 to 3.5 feet) obtained from the two hypothetical basal slide plane geometries is likely greater than that which could be tolerated by a new building straddling the landslide headscarp or lateral margins. The methodology used to arrive at this value is among the generally-accepted procedures currently used to evaluate seismic slope displacements in California. The principal researcher that developed the method (Dr. Jonathan Bray, also a member of the University’s Seismic Review Committee) generally stands behind this approach and views the analysis results of an index of seismic slope performance. He also commonly notes that displacements may be half or twice the calculated median value. This observation is generally consistent with the 16th and 84th percentile lines (below and above the mean, respectively) shown on the attached yield acceleration (kY) vs. displacement plot. The calculated displacement values, however, appear to differ from what would be expected by the review and preliminary analysis of historic photography and geomorphic mapping. In the opinion of the geologists, vertical and lateral displacements of several feet or more occurring periodically (~150 years) over many cycles of triggering earthquakes on the Hayward fault would probably be able to be discerned on the 1935 and 1939 pre-development photographs. However, these photographs exhibit very subdued landslide-related geomorphic relations in the region of the mapped paleolandslide with the exception of smaller, shallow, and younger-appearing slumps and debris flows at the margins of the paleolandslide. This apparent inconsistency is unresolvable using only the data from this preliminary study. In our opinion, reasonable “next steps” to further evaluate the suitability of this site include: A. Additional geologic investigation (i.e. trenching) might be performed to evaluate the recency of landslide
movement and provide a more substantive quantitative geologic argument showing that the landslide deposits have not experienced downslope movements over one or more large earthquake events on the Hayward fault. This type of geologic assessment my prove advantageous (if conclusive evidence is found showing that movement has not occurred across the paleolandslide margin over thousands of years); disadvantageous (if conclusive evidence is found showing that movement has occurred across the paleolandslide margin in relatively recent times); or may be inconclusive (if movement cannot be confirmed, disconfirmed or age-dated).
B. If additional geologic investigation yields advantageous results, supplemental investigations, laboratory
testing and engineering analyses may be warranted to “close the gap” between the geologic interpretation showing the site to be historically stable and the preliminary engineering evaluations suggesting that it is not.
C. If additional geologic investigation yields disadvantageous or inconclusive results, an engineering evaluation might be performed to evaluate what types of slope stabilization measures could feasibly be implemented to reduce seismic slope displacements to “tolerable” levels. We anticipate that such measures might include both structural (e.g piers, tiebacks and retaining walls) and geotechnical (e.g shear pins and ground improvement) methods.
The additional investigations and analyses outlined above were outside of the scope of this initial preliminary study. List of Attachments
1. Boring Logs 2. Geologic Map 3. Interpretive Cross Sections 4. Limit-Equilibrium Analysis Results 5. Deviatoric Slope Displacement Analysis Results


6
75
75B
75A
7852
52A
44A
77
31
76L
76
79
25A
25
44
5
16
414
44B
25B
4140
48
45
26
75C
16A
17
46C
46D
47
53
7A
7C
58
58A
27
7
6
10
37
3435
BUS
BUS
6A
32
36
McM
ILLANR
OAD
N1
N
N
LAWRENCE ROAD
SE
GR
ER
OA
D
R2
R1
R
SE
GR
ER
OA
DQ1
M
V
GLASERROAD
LA
Q1
R
S
V
McMILLAN ROAD
SUBSTATIO
N
GRIZ
ZLY
Q2
GLAS
Q
800
00
900
850
900
950
1000
950
800
850
900
1100
1000
1050
1050
1050
950
1100
1100
1050
1000
1050
1000
1000
850
900900
900
950
1000
1000950
950
900
950
950
900
850
900
800
850
850
800
900
850850
900
850
800
850
850
800
750
750
700
750
750
800
800
700
800 800
750
750
63
62
61
60
59
58
57
5655
54
53
52
51
50
4948
47
46
45
44
42
41
40
39
38
37
6
35
34
32
3130
29
28
27
26
25
2400 2600 2800 3000 3200 3400 3600 3800
-600
-400
-200
0
200
400
600
800
0 100 200 feet
Reconnaissancemappingthis study
Reconnaissancemappingthis study
Index Map of Sources
Data compilationmapping (AKA, 2009)
(WLA Project 1930/2032)
Data compilationmapping (AKA, 2009)
(WLA Project 1930/2032)
Mapping byP. Jordan
(Parsons, 2000)
Mapping byP. Jordan
(Parsons, 2000)
8
!A
!A
!A
!A
!A!A
!A
!A
!A
!A
!A
!A
!A
!A
!A
!A!A
!A
!A
!A
!A
!A!A
!A
!A
!A
!A
!A
!A
!A
!A
!A
!A
!A
!A
!A
!A
!A
!A
!A
!A!A
!A
!A
!A
!A !A
!A
!A
!A!A
!A
!A
!A
!A
!A
!A
!A
!A476
475
474
473
472
471
470
469
468 467
466
465
464463
462
461
460
459458
457
456
455
454
453452
451
450
449
448
447
446
445
444
443
442
441440
439
438437
436435
434433
431
430
429
428
427
426
425
424
424
423421
420
419
418
??
xx
x
x x
TorTor
TorTor
TorTor
TorTor
TorTor
TorTor
TorTor
TorTor
TorTor
QcQc
QcQc
QcQc
QTls(m)QTls(m)
QTls(m)QTls(m)
QTls(m)QTls(m)
QTls(m)QTls(m)
QTls(o)
QTls(o)
QTls(o)QTls(o)
QTls(o)QTls(o)
QTls(o)QTls(o)
QTls(mixed)
QTls(mixed)
Qc Qc
Qc Qc
Qc Qc
Qc Qc
Chicken Creek fault
Chicken Creek fault
QlsQls
QlsQls
QlsQls
QlsQls
QlsQls
KuKu
KuKu
KuKu
KuKu
KuKu
Qc?Qc?
AfAf
AfAf
ToTo
3333
1010
3636
3232
3535
2525
6464
OrindaOrinda
A'
A MoragaMoraga
MoragaMoraga
OrindaOrinda
BrokenasphaltBrokenasphalt
MM
??
MM
MM
M/oM/o
M/oM/o
M/oM/o
MM
??
??
????
??
??
????????
??
??
??
???? ?? ??
????
??
??
M/oM/oM/oM/o
M/oM/o
M/oM/o
No outcropNo outcrop
In Rock?In Rock?
MixedMixed
43434545
2929
3535
3030
TmbTmb
B'
B
TruenorthTruenorthGridGrid
northnorth
QTls(m)QTls(m)
QTls(o)QTls(o)
!A
!A
!A
!A
!A
!A
900
TorTor
KuKu
Qc Qc
AfAf
3333
OrindaOrinda MoragaMoraga
??
TmbTmb
B'B
xx
Explanation
Geologic Borings
Geologic contact, dotted where buried
Fault projected from depth, dashed where approximate, dotted whereconcealed and uncertain
Potentially active Quaternary landslide
Quaternay landslide
Artificial fill (RCRA)
Colluvium, Quaternary
Moraga paleolandslide unit
Orinda paleolandslide unit
Moraga Formation, Tertiary
Orinda Formation, Tertiary
Great Valley Group, Creataeous
Strike and dip
Bedding within Moraga Formation
Anticline
Location of outcrop
Slope parallel cracks/scarps
Location of cross section
Reconnaissance waypoints (03.18.2009)
Buildings, roads, and structures (10.2007)
10-foot contour interval (2003)
This sudy (AKA, 2009)
RCRA (2000), no data provided
RCRA (2000), data provided
HLA (1966)
HLA (1982)
SCI (1991)
Fugro WLAProject No. 2072.000
Gra
phic
s, A
ctiv
e P
roje
cts,
207
2.00
0
PLATE X
BUILDING 25 GEOLOGIC MAP

Fugro W
LAP
roject No. 2072.000
Graphics, Active Projects, 2072.000
SECTION A - A'
FIG
UR
E X
Ele
vatio
n (f
eet)
Ele
vatio
n (f
eet)
950
1000
900
850
800
750
950
1000
900
850
800
750
Northeast (UCB 3105, 400)
ASouthwest
(UCB 3015, -400)
A'
Tor
Apparentdip 23°
QTls(m)
QTls(m)
QTls(m)
Road
LawrenceRoad
UCB 185°
Building 25/25A
QTls(m)
QTls(o)
QTls(o)
QTls(o)
QTls(o)
? ?
??
?
?? ? ?
?
?
Qc
Qc/AfQc/Af
??
???
??
Tor
Tor
Vertical exaggeration: 2x
447(proj. 70 ft.
east)429
AKA-1(proj. 40 ft.
east)434
(proj. 12 ft.east)
421(proj. 35 ft.
east)
424(proj. 40 ft.
east)
425(proj. 40 ft.
west)
430AKA-2(proj. 40 ft.west)
431AKA-3
(proj. 30 ft.east)
443(proj. 5 ft.west) 424
(proj. 20 ft.west)
450(proj. 10 ft.
west)
IntersectionB - B'
Unit Descriptions Symbols
Contact is approximate; queried where uncertain
1922 - 23 UCB 20-ft. contour interval (approximate)
Potential shear
Boring with GIS ID number for project 2072(05.18.09) data compilation
Explanation
447
Tor
Note: Topographic data from 2003.
Colluvium, Quaternary
Potential slide body in Moraga Formation
Potential slide body in Orinda Formation
Orinda Formation, TertiaryTor
Qc

Fugro W
LAP
roject No. 2072.000
Graphics, Active Projects, 2072.000
SECTION B - B'
FIG
UR
E X
TorTor
Tor
Tor
QTls(m)QTls(o)
Qc
Qc/Af
Tor
SegreRoad
Building25
Unit Descriptions Symbols
Contact is approximate
1922 - 23 UCB 20-ft. contour interval (approximate)
Potential shear
Boring with GIS ID number for project 2072(05.18.09) data compilation
Colluvium, Quaternary
Potential slide body in Moraga Formation
Potential slide body in Orinda Formation
Orinda Formation, Tertiary
Note: Topographic data from 2003.
West (UCB 2740, -70)
BEast
(UCB 3270, -40)
B'
Vertical exaggeration: 2x
Explanation
474(proj. 20 ft.
north)
472
472
476(proj. 10 ft.
north)
450(proj. 10 ft.
south)
426(proj. 10 ft.
north) 465(proj. 20 ft.
south)
IntersectionA - A'
Road
UCB 087°
Tor
QTls(m)
QTls(o)
Qc
Ele
vatio
n (f
eet)
Ele
vatio
n (f
eet)
950
900
850
800
950
900
850
800

Alan Kropp & Associates
ANALYSIS EXPLANATION: Backcalculation of slide plane shear strength using pre-grading topography

Alan Kropp & Associates
ANALYSIS EXPLANATION: Static factor of safety for current topography using backcalculated 15.1 degree friction angle

Alan Kropp & Associates
ANALYSIS EXPLANATION: Static factor of safety for current topography using 20 degree friction angle (consistent with drained residual torsional ring shear tests from nearby LBNL sites)
Alan Kropp & Associates
ANALYSIS EXPLANATION: Yield acceleration for current topography using 20 degree friction angle
Alan Kropp & Associates
ANALYSIS EXPLANATION: Static factor of safety for current topography using 20 degree friction angle – alternate toe geometry

Alan Kropp & Associates
ANALYSIS EXPLANATION: Yield acceleration for current topography using 20 degree friction angle – alternate toe geometry

Alan Kropp & Associates
ANALYSIS EXPLANATION: Deviatoric slope displacement analysis using:
1. Shear wave velocity = 1200 fps; 2. Landslide thickness = 85 feet 3. Horizontal Uniform Hazard Spectra at 475-year return period, LBNL rock site (URS, 2008)