al-abbas sugar mills ltd.al-abbasal-abbas sugar mills ltd ... · audit of cost accounts of al-abbas...
TRANSCRIPT

SIDDIQI & COMPANYCost & Management Accountants
Suit # 147, 1st Floor, Haroon Shopping Emporium, Sector 15-A/1,North Karachi-75850 (Pakistan).
Tel: (92-21) 36971814 - 36931527, Fax: (92-21) 36931527E-mail <[email protected]>
Cost Auditors’ ReportFor the year ended September 30, 2014
Al-Abbas Sugar Mills Ltd.Al-Abbas Sugar Mills Ltd.Al-Abbas Sugar Mills Ltd.Al-Abbas Sugar Mills Ltd.

Al-Abbas Sugar Mills Limited Cost Audit Report, 2013-2014
( i )
COST AUDITORS’ REPORT
2013-2014 AL-ABBAS SUGAR MILLS LIMITED
INDEX Section – 1 Page #
1. Corporate Information ii 2. The Company & its Manufacturing Process iii
Section – 2
Cost Auditors’ Report 1 (1) Capacity 2 (2) Cost Accounting System 2 (3) Production 2 (4) Raw Material 3 (5) Wages & Salaries 4 (6) Stores & Spare Parts 5 (7) Depreciation 5 (8) Overheads 6 (9) Royalty / Technical Aid Payment 7 (10) Abnormal Non-Recurring Features 7 (11) Cost of Production 8 (12) Sales 9 (13) Profitability 10 (14) Cost Auditors’ Observations and Conclusions 12 (15) Reconciliation with Financial Account 13 (16) Cost Statements 13 (17) Miscellaneous 13
Statement of Capacity Utilization Statement of Stock-in-Trade
Section – 3 Cost Accounting Records: Schedule
1. Production Data 1 Annexures 2. Cost of Production and Sale of White Bagged Sugar I 3. Sugar Cane Produced II 4. Cost of Sugar Cane Crushed III 5. Cost of Beet Consumed IV 6. Cost of Process Material Consumed V 7. Cost of Salaries, Wages & Benefits VI 8. Cost of Steam / Generated Consumed VII 9. Cost of Electric Power Purchased / Generated and Consumed VIII 10. Other Factory Overheads IX 11. Administrative Expenses X 12. Selling Expenses XI
*****
Section - 1 Page #
1. Corporate Information ii 2. The Company & its Manufacturing Process iii

Al-Abbas Sugar Mills Limited Cost Audit Report, 2013-2014
( ii )
01. Corporate Information Board of Directors
Chairman Muhammad Iqbal Usman
Chief Executive Shunaid Qureshi
Executive Director Asim Ghani
Directors Ali Jehangir Siddiqui
Asma Aves Cochinwala Darakshan Ghani Duraid Qureshi
Sayyed Rafay Akber Rashdi Suleman Lalani
Company Secretary and Chief Financial Officer Zuhair Abbas
Statutory Auditors Haroon Zakaria & Co. Chartered Accountants
Cost Auditors SIDDIQI & COMPANY
Cost & Management Accountants
Audit Committee Sayyed Rafay Akber Rashdi – Chairman
Darakshan Ghani – Member Duraid Qureshi – Member
Tariq Iqbal – Secretary
Registered Office 2nd Floor, Pardesi House, Survey No. 2/1, R.Y. 16,
Old Queens Road, Karachi.
Sugar Factory Mirwah Gorchani, Distt. Mirpurkhas, Sindh

Al-Abbas Sugar Mills Limited Cost Audit Report, 2013-2014
( iii )
02. The Company &
Manufacturing Process 1) The Company:
The company was incorporated in Pakistan on 02 May, 1991 as Public Limited Company under the Companies Ordinance, 1984. Its shares are quoted on Karachi Stock Exchange. The principal activities of the company under following business segments / divisions comprise of: S.# Divisions Principal Activities 1) Sugar : Manufacturing and sale of sugar 2) Ethanol : Processing and sale of industrial ethanol 3) Chemical and alloys and : Manufacturing and sales of calcium carbide and ferro alloys. Power Generation and sales of electricity. 4) Tank Terminal : Providing bulk storage facility
2) Capacity: Installed sugar cane crushing capacity is 7,500 MT per day. 3) Production Process: The process consists of the following departments:-
i) Sugar Cane Procurement ii) Cane Cutting and Shredding iii) Milling (Juice Extraction) iv) Purification (Addition of Lime, Sulpher, Phosperic Acid) v) Clarification vi) Multiple Effect Evaporation vii) Crystallization viii) Centrifuge ix) Drying on Hoppers x) Packing (Polypropylene bags of 50 Kg each are used in packing)
4) Clarification Process: Defecation, Melt and Phosphitation.
5) Registered Office:
At 2nd Floor, Pardesi House, Survey No. 2/1, R.Y. 16, Old Queens Road, Karachi. 6) Factories / Storage Locations:
The company’s location of undertaking are as under: 1) Sugar / Ethanol : Mirwah Gorchani, Distt. Mirpurkhas, Sindh. 2) Chemical and Alloys and Power : Main National Highway, Dhabeji, Sindh. 3) Tank Terminal : Oil Installation Area, Kermari, Karachi, Sindh.

Cost Auditors’ Report
Section - 2
Cost Auditors’ Report 1
(1) Capacity 2 (2) Cost Accounting System 2 (3) Production 2 (4) Raw Material 3 (5) Salaries, Wages & Benefits 4 (6) Stores & Spare Parts 5 (7) Depreciation 5 (8) Overheads 6 (9) Royalty / Technical Aid Payment 7 (10) Abnormal Non-Recurring Features 7 (11) Cost of Production 8 (12) Sales 9 (13) Profitability 10 (14) Cost Auditors’ Observations and Conclusions 12 (15) Reconciliation with Financial Account 13 (16) Cost Statements 13 (17) Miscellaneous 13
Statement of Capacity Utilization
Statement of Stock-in-Trade

Al-Abbas Sugar Mills Limited Cost Audit Report, 2013-2014
[ 1 ]
COST AUDITORS’ REPORT We, SIDDIQI & COMPANY, Cost & Management Accountants having been appointed to conduct an audit of cost accounts of AL-ABBAS SUGAR MILLS LIMITED, have examined the books of account and the statements prescribed under clause (e) of sub-section (1) of section 230 of the Companies Ordinance, 1984 and the other relevant record for the year ended September 30, 2014, and report that-
1. We have obtained all the information and explanations which to the best of our knowledge and belief were necessary for the purposes of this audit.
2. In our opinion:
(a) proper cost accounting records as required by clause (e) of sub-section (1) of section 230 of the Companies Ordinance, 1984 (XLVII of 1984), and as required by these rules, have been kept by the company;
(b) proper returns, statements and schedules for the purpose of audit of cost accounts relating to branches were not required as the Company has no branches in or outside Pakistan;
(c) the said books and records give the information required by the rules in the manner so required; and
3. in our opinion and, subject to best of our information-
(a) The annexed statement of capacity utilization and stock-in-trade are in agreement with the books of account of the company and exhibit true and fair view of the Company’s affairs; and
(b) Cost accounting records have been properly kept so as to give a true and fair view of the cost of production, processing, manufacturing and marketing of the under mentioned products of the company, namely,
(i) Main Product: – White Sugar
(ii) By Products: – Molasses – Bagasse
(iii) Other activities: – Ethanol – Chemical and alloys and Power – Tank Terminal
However, the products other than sugar are not subject to cost audit.
The matters contained in the ANNEXED Forms are part of this report.
SIDDIQI & COMPANY
Cost & Management Accountants
Karachi:

Al-Abbas Sugar Mills Limited Cost Audit Report, 2013-2014
1. CAPACITY - (Sugar Segment)
(a) The licensed / installed cane crushing capacity and its utilization is given as follows:
2014 2013– Licensed / installed capacity
(Year 2014: Duration of season 124 days x 7,500 tonne per day) 930,000 690,000 (Year 2013: Duration of season 92 days x 7,500 tonne per day)
– Capacity utilized 621,679 503,179
– Percentage of capacity utilized 67% 73%
(b)S.#1)
2)
3)
4) Tank Terminal
2. COST ACCOUNTING SYSTEM–
3. PRODUCTION - (Sugar Segment) Qty. in Tonne
(a)– Main Product: 2014 2013 2014 2013 2014 2013
– White Sugar Bagged 93,000 69,000 63,650 52,727 68 76
– By Product:– Molasses 46,500 34,500 28,660 22,838 62 66– Bagasse 297,600 220,800 196,911 158,778 66 72– V. Filter Cake 27,900 20,700 18,650 15,095 67 73
Standard Recovery: (Molasses @ 5%, Bagasse @ 32% and V.Filter Cake @ 3%)
(b) The main reason for under-utilisation of capacity was the non-availability of sugar cane in sufficient quantity.
(c) There is no addition to the production capacity during the year under review or in the last two years.
The company is using an ERP Oracle Financials for sugar industry, whereby the cost accounts are integrated withfinancial accounting records allowing all the accounting entries for cost of production, at various levels, to beincorporated in the financial books of accounts. Company's weighment bridge is fully computerized which facilitates theincorporation of cane purchased in the books of accounts at the time of weighment. The software was assessed asadequate to determine correctly the cost of the production of the company.
The company kept adequate records to ascertain the cost of sugar produced and sold. The records have beentransformed according to the format prescribed in the Sugar Industry (Cost Accounting Records) Order, 2001. All thecost components are recorded department wise / cost centre wise.
Manufacturing and sale of calcium carbide and ferro alloys.
Providing bulk storage faciltiy.
Generation and sale of Electricity.
Ethanol
Principal ActivitiesManufacturing and sale of sugar.
Processing and sale of industrial ethanol.
Tonne
Y E A R SInstalled Capacity Production % of Installed
The actual cost incurred by the company is charged to various cost centers / units on actual basis and the cost of servicedepartment is allocated on the basis considered appropriate under the circumstances. The net realizable value ofmolasses transferred to distillery unit and bagasse consumed in boiler house or sold is deducted from the cost of sugarmanufactured as a reduction in overall cost of production.
The principal activities of the company under following business segments / divisions comprise of:
Chemical and alloys and Power
Division / SegmentSugar
[ 2 ]

Al-Abbas Sugar Mills Limited Cost Audit Report, 2013-2014
4. RAW MATERIAL - (Sugar Segment)
(a) Major Raw Materials Consumed
Quantity Rupees Quantity Rupees Quantity Rupees(Tonne) in '000 (Tonne) in '000 (Tonne) in '000
Cost of Sugarcane (See Annexure - III) 621,679 2,787,166 503,179 2,404,163 402,317 1,649,429
Process Material (See Annexure - V) - 25,326 - 14,699 - 12,056
(b) Major Raw Materials consumption per unit of production compared with standard requirements.
Standard 2014 2013 2012Tonne Tonne Tonne Tonne 2014 2013 2012
– Sugar Cane 10.00 9.77 9.54 10.19 (2.33) (4.57) 1.91
Standard: 10.00 tonne sugar cane = 1 tonne sugarYear 2014: 9.77 tonne sugar cane =1 tonne sugarYear 2013: 9.54 tonne sugar cane =1 tonne sugar
(c) Explanation of Variances
–
(d) Method of Accounting
–
– The company prepares a purchase indent after weighing the quantities of sugarcane received which are instantlyrecorded in Cane Purchase Receipts (CPRs). These CPRs constitute the reocrd of sugarcane based for computation ofcost of sugarcane consumed. The quantities of sugarcane received are issued to production floor.
Sugar cane is purchased from local growers on the basic price fixed by Government / negotiated price and it is crushedimmediately to extract the juice by processing. Other chemcials are purchased from the market.
Sugar cane yield depends upon the quality of sugar cane; and the quality varies with the periods / days of maturity of thecrop. Low yield of sugar cane and low recovery of sucrose from sugar cane in upper sindh is due to climatic conditions.
2013
% Increase / (Decrease)as compared to Standard
Sugar
20122014
[ 3 ]

Al-Abbas Sugar Mills Limited Cost Audit Report, 2013-2014
5. SALARIES, WAGES & BENEFITS - (Sugar Segment)
(a) Total salaries, wages and benefits paid for all categories of employees
2014 2013 2012
Rs. in '000 Rs. in '000 Rs. in '000 Rs. in '000 % Rs. in '000 %
(i) Direct labour cost on production 148,554 132,231 102,559 16,323 12 45,995 45
(ii) Indirect labour cost on production 25,567 23,134 25,516 2,433 11 51 0
(iii) Employees' cost on administration 28,767 31,476 33,842 (2,709) (9) (5,075) (15)
(iv) Employees' cost on selling and distribution - - - - - - -
(v) Total employees cost ( i to iv ) 202,888 186,841 161,917 16,047 9 40,971 25
(vi) Bonus to workers and employees 22,023 17,896 11,215 4,127 23 10,808 96
(Already included in above total salaries & wages)
(vii) Other employees cost - - - - - - -
– There was increase in total salaries & wages due to increase in volume of production and partly normal increaments as compared to last year.
Rupees in '000
(b) Salaries and perquisites of chief executive and directors Chief
Executive Directors Total
Remuneration 9,818 5,455 15,273
Perquisties 5,807 1,817 7,624
Total Rupees – 2014 15,625 7,272 22,897
Total Rupees – 2013 14,597 7,016 21,613
Number of Persons – 2014 1 1 2
Number of Persons – 2013 1 1 2
–
(c) Total men-days of direct labour Worked Available % Worked
763 men x 111 days (worked) 84,693 94,612 90
763 men x 124 days (available)
(d) Average number of production workers employed 2014 2013
763 712
(e) Direct labour cost per ton 2014 2013 2012
% %
Sugar (Tonne) 63,650 52,727 39,479 10,923 21 24,171 61
Direct Labour (Rs. in '000) 148,554 132,231 102,559 16,323 12 45,995 45
Direct Labour Cost (Rs. per Tonne) 2,334 2,508 2,598 (174) (7) (264) (10)
(f) Brief explanations for variances–
(g) Comments on Incentives Scheme– It is the policy of the company to pay bonus on every production of 10,000 M.Tonne.
– The company operates an approved funded gratuity scheme for all its employees who have completed the qualifying period under the scheme.
Increase / (Decrease)
Increase / (Decrease)
As compared to 2012
% Increase/(Decrease)
As compared to 2013 As compared to 2012
7%
As compared to 2013
In addition to the above perquisties, the Chief Executive and Directors are provided with free use of company's maintained cars for business and personaluse.
Per tonne direct labour cost decreased due to increase in volume of production as compared to last two years.
[ 4 ]

Al-Abbas Sugar Mills Limited Cost Audit Report, 2013-2014
6. STORES AND SPARE PARTS - (Sugar Segment)
(a) The expenditure per unit of output on stores, etc.
Production (Tonne)
Rs.in '000 Per Ton Rs. in '000 Per Ton
Stores and spares parts consumed 66,225 1,040 91,323 1,732
–
(b) System of stores accounting–
(c) Proportion of closing inventory of stores representing items which have not moved for over 24 months.–
7. DEPRECIATION - (Sugar Segment)
(a) Method of depreciation–
(b) Basis of allocation of depreciation on common assets to the different departments.
– Depreciation on sugar segement assets is allocated as under: 2014 2013Rs.in '000 Rs.in '000
(i) Cost of Sales 44,991 46,813 (ii) Admin. & General 5,291 5,753
Total 50,282 52,566
(c) Basis of charging depreciation to cost of products– The depreciation is allocated to cost of production on the value of assets employed.
Average per tonne cost of stores & spares decreased due to increase in volume of production and reduction inconsumption of stores and spares as compared to last year.
Assets are derecognized when disposed or when no future economic benefits are expected from its use or disposal. Gains orlosses on disposals, if any, are included in profit and loss account.
The company operates an ERP Oracle Financials for receipts and issuance of stores and spares items. All receipts are beingrecorded through stores receipt report (SRR), which is being prepared only after acceptance of stores items through materialinspection report (MIR) by the department initiating purchase of that item. Whereas all stores issues are being recorded onduly approved store issue receipt (SIR) and charged to respective departments in accordance with the accounting policy i.e.moving average cost. Almost all purchases except in case of emergency or minor items are being carried out by the headoffice on receipt of store purchase requisition (SPR) duly signed by authorized officer of concerned department. all inventoryitems are being valued at moving average cost and the same is being adopted consistently. Thus the company is maintainingproper record for receipt and issuance of stores items and valuation of stores items.
63,650 52,727
2014 2013
These are stated at cost less accumulated depreciation and impairment losses, if any, except for land, which is stated at cost.Depreciation is charged, on a systematic basis over the useful life of the asset, on reducing balance method, which reflectsthe patterns in which the asset's economic benefits are consumed by the company. Assets residual value and useful lives arereviewed and adjusted appropriately at each financial year end. Depreciation on addition is charged from the month in whcihthe assets are put to use while no depreciation is charged in the month of which the assets are disposed off. No amortizationis provided on leasehold land since the leases are renewable at the option of the lessee at nominal cost and their realizablevalues are expected to be higher than respective carrying values.
The provision for slow moving items and obsolescence of inventory is made for Rs. 22.805 million (Year 2013: 21.852 million)which is equivalent to 14% (Year 2013: 13%) of total stores & spares.
Subsequent costs are included in the asset's carrying amount or recognized as a separate asset, as appropriate, only when itis probable that future economic benefits associated with the item will flow to the company and the cost of the item can bemeasued reliably. All other repairs and maintenance are charged to profit and loss account during the financial year in whichthey are incurred.
[ 5 ]

Al-Abbas Sugar Mills Limited Cost Audit Report, 2013-2014
8. OVERHEADS - (Sugar Segment)(a) Total amounts of the overheads 2014 2013 2012
Rs.in '000 Rs.in '000 Rs.in '000(i) Factory 33,524 31,130 25,590 (ii) Administration 70,385 70,053 71,679 (iii) Selling & distribution 38,077 10,997 120,763 (iv) Financial 125,711 138,840 163,748
267,697 251,020 381,780
(i) Factory Overheads 2014 2013 2012Rs.in '000 Rs. in '000 Rs. in '000 Rupees % Rupees %
Printing & stationery 119 142 222 (23) (16) (103) (46) Communication charges 477 349 514 128 37 (37) (7) Insurance expenses 8,986 7,580 7,627 1,406 19 1,359 18 Travelling & conveyance 3,228 3,245 846 (17) (1) 2,382 282 Fees and Subscriptions 430 1,056 610 (626) (59) (180) (30) Entertainment 4,274 3,593 3,708 681 19 566 15 Vehicle running expenses 5,308 5,534 4,678 (226) (4) 630 13 Security charges 9,163 7,908 5,486 1,255 16 3,677 67 Newspaper and periodicals 59 34 56 25 74 3 5 Miscellaneous expenses 1,480 1,689 1,843 (209) (12) (363) (20)
33,524 31,130 25,590 2,394 8 7,934 31
–
(ii) Administration Overheads 2014 2013 2012Rs.in '000 Rs. in '000 Rs. in '000 Rupees % Rupees %
Salaries, allow & benefits 28,767 31,476 33,842 (2,709) (9) (5,075) (15) Rent, rates & taxes 3,067 3,506 3,180 (439) (13) (113) (4) Communication charges 1,908 1,987 2,236 (79) (4) (328) (15) Travelling & conveyance 540 1,006 2,304 (466) (46) (1,764) (77) Printing & stationery 1,471 927 600 544 59 871 145 Entertainment 1,051 1,273 1,278 (222) (17) (227) (18) Vehicle running expenses 7,570 7,299 7,397 271 4 173 2 Repairs & maintenance 1,230 1,492 2,072 (262) (18) (842) (41) Insurance 1,943 1,692 1,660 251 15 283 17 Fees and subscription 3,480 2,832 2,713 648 23 767 28 Legal & professional charges 6,419 5,398 3,910 1,021 19 2,509 64 Auditors' remuneration 839 759 783 80 11 56 7 Charity & donation 501 451 1,177 50 11 (676) (57) Newspaper & periodicals 42 44 24 (2) (5) 18 75 Utilities 2,590 2,267 2,098 323 14 492 23 Depreciation 5,291 5,753 4,689 (462) (8) 602 13 Security expenses 920 545 431 375 69 489 113 Miscellaneous 2,756 1,346 1,285 1,410 105 1,471 114
70,385 70,053 71,679 332 0 (1,294) (2)
–
% Increase / (Decrease)As compared to 2013 As compared to 2012
As compared to 2012
There was increase in factory overheads mainly on account of communication charges, insurance, entertainment, securityand newpaper expenses as comapred to last year.
% Increase / (Decrease)As compared to 2013
Overall there was no significant variance in administration overheads as compared to last year except increase in printing& stationery, legal & professional, security and miscellaneous expenses as compared to last two years.
[ 6 ]

Al-Abbas Sugar Mills Limited Cost Audit Report, 2013-2014
(iii) Selling Overheads 2014 2013 2012Rs.in '000 Rs. in '000 Rs. in '000 Rupees % Rupees %
Sugar bags handling exp 8,697 7,973 6,362 724 9 2,335 37 Export transportation & others 26,599 246 13,308 26,353 10,713 13,291 100 Marking fees 2,781 2,778 3,361 3 0 (580) (17) Service & local transportation - - 97,732 - - (97,732) (100)
38,077 10,997 120,763 27,080 246 (82,686) (68)
–
(iv) Financial Expenses 2014 2013 2012Mark-up on: Rs.in '000 Rs. in '000 Rs. in '000 Rupees % Rupees %Long term financing 7,954 28,414 53,339 (20,460) (72) (45,385) (85) Short term borrowings 112,915 105,071 105,603 7,844 7 7,312 7 Interest on WPPF fund 6 - - 6 100 6 100 Bank charges & guarantee 4,836 5,355 4,806 (519) (10) 30 1
125,711 138,840 163,748 (13,129) (9) (38,037) (23)
–
(b) Brief explanation for variance
– Comments on variances have already been given under the respective heads of account as shown above.
(c) Basis of allocation of overheads
– The overheads are charged to cost of production.
(d) Cost of Packing 2014 2013 2012(Empty polypropylene bags) % %Sugar (Tonne) 63,650 52,727 39,479 10,923 21 24,171 61 Packing material cost (Rs. in '000) 34,321 27,839 28,596 6,482 23 5,725 20 Per tonne cost (Rs. in '000) 539 528 724 11 2 (185) (26)
–
9. ROYALTY / TECHNICAL AID PAYMENTS– NOT APPLICABLE
10. ABNORMAL NON-RECURRING FEATURES
(a) Features affecting production– None except insufficient availability of sugar cane during the crushing season.
(b) Special expenses
% Increase / (Decrease)
= N O N E =
Increase / (Decrease)
% Increase / (Decrease)
There was increase in selling overheads mainly on account of loading / unloading and export transportation expesnes ascompared to last two years.
As compared to 2013
As compared to 2013
As compared to 2012
Overall packing material cost increased mainly due to increase in volume of production and partly due to increase in costof packing material as compared to last year.
As compared to 2012
As compared to 2012
There was decrease in financial overheads mainly on account of decrease in markup on long term fnances as comparedto last two years.
As compared to 2013
[ 7 ]
Al-Abbas Sugar Mills Limited Cost Audit Report, 2013-2014
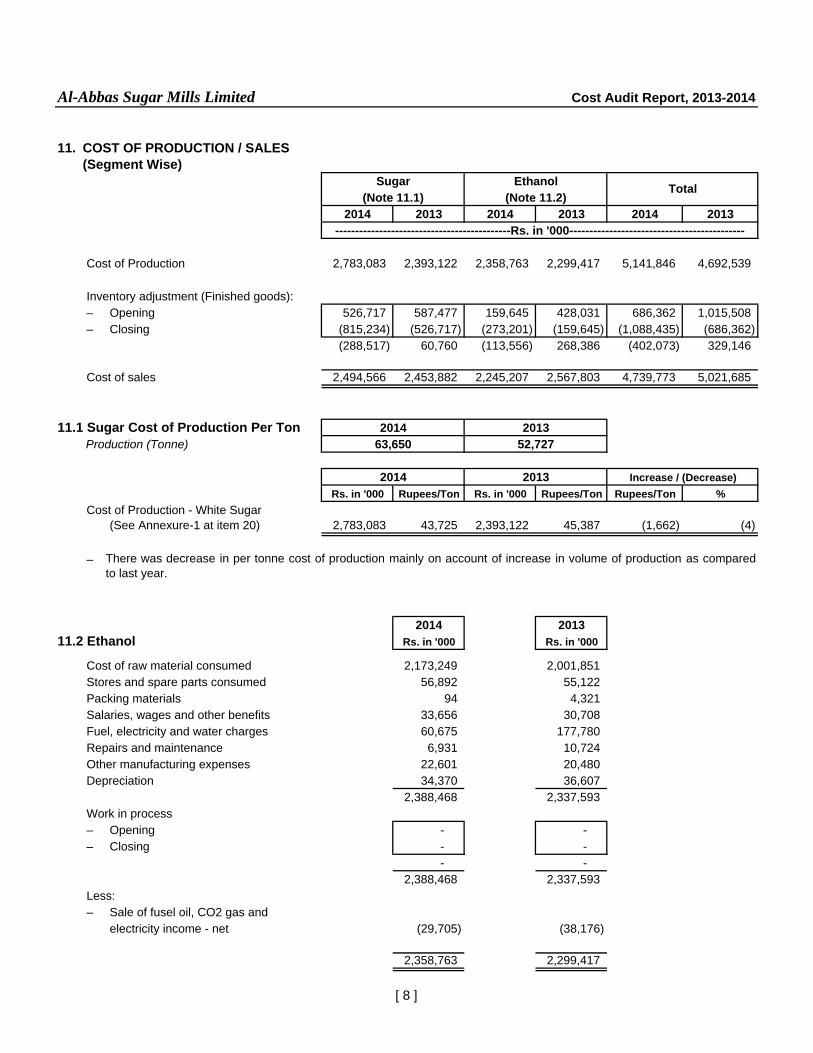
11. COST OF PRODUCTION / SALES(Segment Wise)
2014 2013 2014 2013 2014 2013
Cost of Production 2,783,083 2,393,122 2,358,763 2,299,417 5,141,846 4,692,539
Inventory adjustment (Finished goods):– Opening 526,717 587,477 159,645 428,031 686,362 1,015,508 – Closing (815,234) (526,717) (273,201) (159,645) (1,088,435) (686,362)
(288,517) 60,760 (113,556) 268,386 (402,073) 329,146
Cost of sales 2,494,566 2,453,882 2,245,207 2,567,803 4,739,773 5,021,685
11.1 Sugar Cost of Production Per Ton Production (Tonne)
Rs. in '000 Rupees/Ton Rs. in '000 Rupees/Ton Rupees/Ton %Cost of Production - White Sugar
(See Annexure-1 at item 20) 2,783,083 43,725 2,393,122 45,387 (1,662) (4)
–
2014 201311.2 Ethanol Rs. in '000 Rs. in '000
Cost of raw material consumed 2,173,249 2,001,851 Stores and spare parts consumed 56,892 55,122 Packing materials 94 4,321 Salaries, wages and other benefits 33,656 30,708 Fuel, electricity and water charges 60,675 177,780 Repairs and maintenance 6,931 10,724 Other manufacturing expenses 22,601 20,480 Depreciation 34,370 36,607
2,388,468 2,337,593 Work in process– Opening - - – Closing - -
- - 2,388,468 2,337,593
Less:– Sale of fusel oil, CO2 gas and
electricity income - net (29,705) (38,176)
2,358,763 2,299,417
Sugar Ethanol(Note 11.1) (Note 11.2)
Total
Increase / (Decrease)
There was decrease in per tonne cost of production mainly on account of increase in volume of production as comparedto last year.
--------------------------------------------Rs. in '000--------------------------------------------
2014
2014 2013
63,6502013
52,727
[ 8 ]

Al-Abbas Sugar Mills Limited Cost Audit Report, 2013-2014
12. SALES(Segment Wise)
(a) Net Sales Realization
2014 2013 2014 2013 2014 2013
Local 2,286,672 1,812,061 180,206 107,703 2,466,878 1,919,764
Export 494,806 968,368 2,719,041 3,044,346 3,213,847 4,012,714
2,781,478 2,780,429 2,899,247 3,152,049 5,680,725 5,932,478
Less:
Sales tax (37) (6,923) (23,022) (10,470) (23,059) (17,393)
Special excise duty - (2,063) - - - (2,063)
Federal excise duty (136,926) (63,322) - - (136,926) (63,322)
(136,963) (72,308) (23,022) (10,470) (159,985) (82,778)
Net sales realization 2,644,515 2,708,121 2,876,225 3,141,579 5,520,740 5,849,700
(b) Sugar Sales Per Tonne
Local Export Total Local Export Total
Sugar (Qty in tonne) 46,349 10,252 56,601 34,380 18,960 53,340
Sales value (Rs. in '000) 2,286,672 494,806 2,781,478 1,812,061 968,368 2,780,429
Less: Sales tax & excise duty (Rs. in '000) (136,963) - (136,963) (72,308) - (72,308)
Net Sales Realization (Rs. in '000) 2,149,709 494,806 2,644,515 1,739,753 968,368 2,708,121
Sugar sales per tonne (Rs. in '000) 46,381 48,264 46,722 50,604 51,074 50,771
(c) The export sales was made to………………………………………………………...during the year under review.
2014 2013
Total
--------------------------------------------Rs. in '000--------------------------------------------
EthanolSugar
[ 9 ]

Al-Abbas Sugar Mills Limited Cost Audit Report, 2013-2014
13. PROFITABILITY / (LOSS)
2014 2013Segment / Division wise Note Rs. in '000 Rs. in '000
– Sugar 13.1 (2,404) 50,686
– Ethanol 13.2 370,074 310,822
– Net profit from storage tank terminal 13.3 59,852 9,716
– Net loss from chemical, alloys and 13.4
Power segment & fixed expenses due suspension (39,403) (40,226)
Total Profit before taxation 388,119 330,998
13.1 SugarNote Qty in Ton Rs. in '000 Qty in Ton Rs. in '000
– Local 13.1.1 46,349 1,922 34,380 26,918
– Export 13.1.2 10,252 (4,326) 18,960 23,768
Total 56,601 (2,404) 53,340 50,686
–
13.1.1 LOCALSales of sugar (Tonne)
Rs. in '000 Rupees/Ton Rs. in '000 Rupees/Ton Rupees/Ton %
Net sales 2,149,709 46,381 1,739,753 50,604 (4,223) (8)
Less: Cost of sales (2,042,731) (44,073) (1,581,636) (46,005) 1,932 (4)
Gross profit / (loss) 106,978 2,308 158,117 4,599 (2,291) (99)
Less:
Selling expenses (11,478) (248) (7,088) (206) (41) 20
Admin. Expenses (57,636) (1,244) (45,152) (1,313) 70 (5)
Financial charges (102,941) (2,221) (89,489) (2,603) 382 (15)
Other charges (2,077) (45) (2,665) (78) 33 (42)
Other income 69,078 1,490 13,194 384 1,107 (288)
(105,055) (2,267) (131,199) (3,816) 1,550 (41)
Profit / (loss) before tax 1,922 41 26,918 783 (741) (95)
2014 2013 Increase / (Decrease)
The company incurred loss before tax of Rs. 2.404 million as against profit of Rs. 50.687 million in the last year.
2014 2013
46,349 34,3802014 2013
[ 10 ]
Al-Abbas Sugar Mills Limited Cost Audit Report, 2013-2014
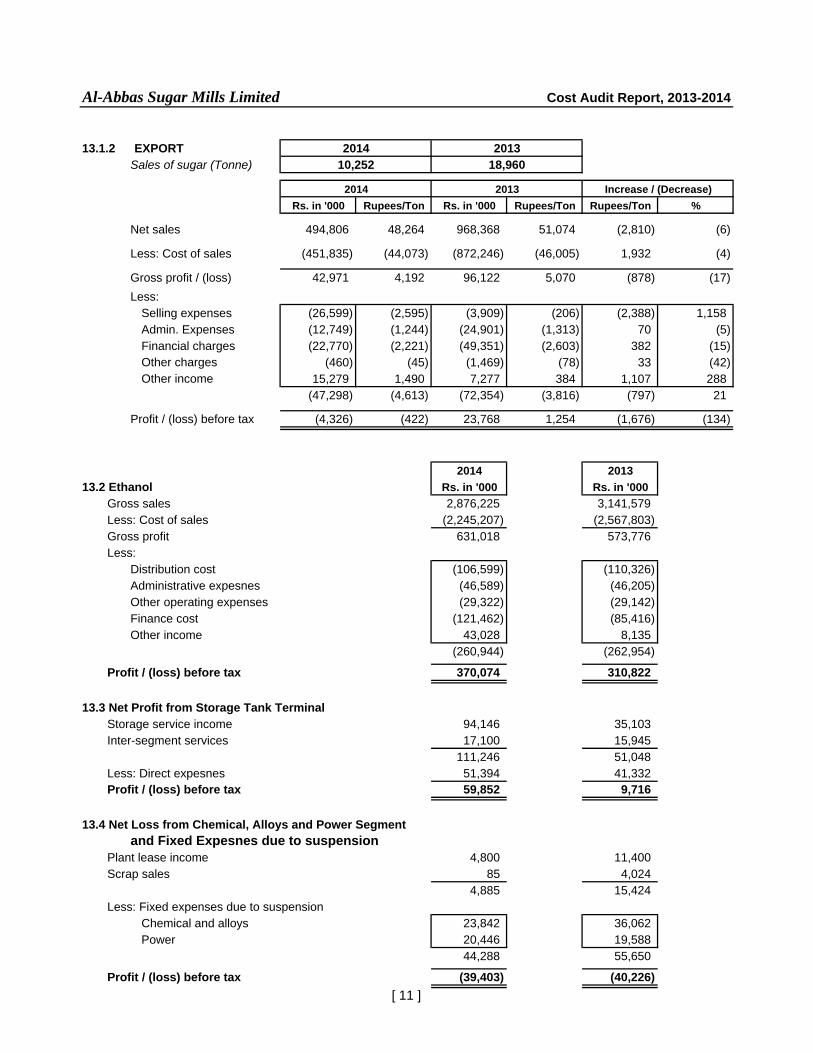
13.1.2 EXPORTSales of sugar (Tonne)
Rs. in '000 Rupees/Ton Rs. in '000 Rupees/Ton Rupees/Ton %
Net sales 494,806 48,264 968,368 51,074 (2,810) (6)
Less: Cost of sales (451,835) (44,073) (872,246) (46,005) 1,932 (4)
Gross profit / (loss) 42,971 4,192 96,122 5,070 (878) (17) Less:
Selling expenses (26,599) (2,595) (3,909) (206) (2,388) 1,158 Admin. Expenses (12,749) (1,244) (24,901) (1,313) 70 (5) Financial charges (22,770) (2,221) (49,351) (2,603) 382 (15) Other charges (460) (45) (1,469) (78) 33 (42) Other income 15,279 1,490 7,277 384 1,107 288
(47,298) (4,613) (72,354) (3,816) (797) 21
Profit / (loss) before tax (4,326) (422) 23,768 1,254 (1,676) (134)
2014 201313.2 Ethanol Rs. in '000 Rs. in '000
Gross sales 2,876,225 3,141,579 Less: Cost of sales (2,245,207) (2,567,803) Gross profit 631,018 573,776 Less:
Distribution cost (106,599) (110,326) Administrative expesnes (46,589) (46,205) Other operating expenses (29,322) (29,142) Finance cost (121,462) (85,416) Other income 43,028 8,135
(260,944) (262,954)
Profit / (loss) before tax 370,074 310,822
13.3 Net Profit from Storage Tank TerminalStorage service income 94,146 35,103 Inter-segment services 17,100 15,945
111,246 51,048 Less: Direct expesnes 51,394 41,332 Profit / (loss) before tax 59,852 9,716
13.4 Net Loss from Chemical, Alloys and Power Segmentand Fixed Expesnes due to suspension
Plant lease income 4,800 11,400 Scrap sales 85 4,024
4,885 15,424 Less: Fixed expenses due to suspension
Chemical and alloys 23,842 36,062 Power 20,446 19,588
44,288 55,650
Profit / (loss) before tax (39,403) (40,226)
2014 2013 Increase / (Decrease)
10,252 18,9602014 2013
[ 11 ]

Al-Abbas Sugar Mills Limited Cost Audit Report, 2013-2014
14. COST AUDITORS' OBSERVATIONS AND CONCLUSIONS
(a) Matters which appear to him to be clearly wrong in principle or apparently unjustifiable.
= N O N E =
(b) Cases where the company funds have been used in a negligent or inefficient manner.
= N O N E =
(c) Factors which could have been controlled but have not been done resulting in increase in the costof production.
– Availability of sugar cane remains the limiting factor in production which is beyond the control of management.
(d) (i) The Adequacy or otherwise of Budgetary Control System, if any, in vogue in the company.
– The Company prepares annual budget for planning purpose.
(ii) The scope and performance of Internal Audit, if any.
–
(e) Suggestions for improvements in performance.
(i) rectification of general imbalance in production facilities
– The mill is running smoothly with the existing facilities.
(ii) fuller utilisation of installed capacity
– Fuller utilisation of installed capacity rests on availability of sufficient sugar cane.
(iii) Comments on areas offering scope for
(a) Cost reduction
–
(b) Increased productivity
–
(c) Key limiting factors causing production bottle necks
–
(d) Improved inventory policies
– Present inventory policies are satisfactory.
Cost reduction may be achieved by operating the plant at maximum capacity to achieve savings inoverhead cost.
Same observations as at para (ii) item 14(e) above.
Non-availability of sugar cane in sufficient quantity is limiting factors in the production.
A full fledged internal audit department has been established by the company. The audit findings arereported to the top management and corrective measures are adopted wherever necessary.
[ 12 ]

Al-Abbas Sugar Mills Limited Cost Audit Report, 2013-2014
(e) Energy conservancy
– Bagasse is the cheapest source of fuel, which is being used to the maximum extent.
(iv) State of technology, whether modern or obsolete.
– Modern technology having defecation, re-melt and phosphitation process.
(v) Plant, whether new or second hand when installed.
– The plant was new when installed in 1993.
15. RECONCILIATIONS WITH FINANCIAL STATEMENTS
–
16. COST STATEMENTS
–
17. MISCELLANEOUS
–
SIDDIQI & COMPANYCost & Management Accountants
Engagement Partner: Mustafa Hussain Siddiqui, FCMA
Karachi :
Figures have been rounded off to nearest thousand. Previous year's figures have been re-arranged and regroupedwhere necessary to facilitate comparison.
Cost accounts are in agreement with audited financial accounts of the company for the year ended Sept. 30,2014. A statement shownig cost of sales as per cost accounts duly reconciled with audited financial accounts isannexed herewith.
Copies of all cost statements on the formats prescribed by Securities and Exchange Commission of Pakistanunder clause (e) of sub-section (1) of section 230 of the Companies Ordinance, 1984, duly authenticated by theChief Executive and Financial Officer of the company, and verified by us are appended to the report.
After the auditor appointed under section 252 of Companies Ordinance, 1984, submits his report, the costauditor shall submit a supplementary report on reconciliation with financial accounts, to the directors before thedate fixed for holding the annual general meeting of the company.
[ 13 ]

Al-Abbas Sugar Mills Limited Cost Audit Report, 2013-2014
2014COST OF SALES Rs. in '000
Cost of sales sugar segmentas per cost accounts (Annexure-I) 2,494,566
Add: Cost of sales Ethanol segment 2,245,207
Total Cost of sales as per audited financial accounts 4,739,773
Cost accounts are in agreement with audited financial accounts of the company for the year ended September30, 2014.
RECONCILIATION OF COST OF SALESbetween
Cost Accounts & Financial AccountsFor the year ended September 30, 2014

CapacityUtilization
No. of Tons Crushing No. of Tons CrushingDays Per Day Tons Days Per Day Tons
124 7,500 930,000 111 5,601 621,679 67%
92 7,500 690,000 90 5,591 503,179 73%
Source: Form RT-4
REASONS FOR SHORTFALL:
–
Chief Financial Officer Chief Executive
Karachi:
AL-ABBAS SUGAR MILLS LIMITED
STATEMENT OF CAPACITY UTILIZATIONunder Rule 4(1)(a) of Companies (Audit of Cost Accounts), Rule 1998
Sugar Segment Sugar Segment
As at September 30, 2014 as compared with September 30, 2013
Licensed and InstalledCapacity
Actual Capacity
The actual production is lower than installed capacity on account of short availability of sugar cane during theyear.
Utilization
CANE CRUSHING CAPACITY
Season / Year
%
Year 2012-2013
Year 2013-2014

Qty. in Tonne Rs. in `000 Qty. in Tonne Rs. in `000
1. Work in Process
– Sugar-in-process 83 3,485 133 5,823
2. Finished Goods
– White Sugar 18,498 815,234 11,449 526,717
3. GRAND TOTAL ( 1 + 2 ) 818,719 532,540
Notes:-
1.
2.
Chief Financial Officer Chief Executive
Karachi:
Sugar Segment Sugar Segment
AL-ABBAS SUGAR MILLS LIMITED
2013-2014 2012-2013
STATEMENT OF STOCK IN TRADEunder Rule 4(1)(b) of Companies (Audit of Cost Accounts), Rule 1998
As at September 30, 2014 as compared with September 30, 2013
In terms of clause 3(2) of Companies (Audit of Cost Accounts) Rules, 1998 (SRO: 846/(1)/98) dt. July 24,1998, the Cost Auditors were appointed by the directors with the prior approval of Securities & ExchangeCommission of Pakistan within sixty days of the close of financial year of the company.
In view of the above mentioned constrains appointing the Cost Auditors after the close of the financial year; thecost auditors were not present on the date of physical stock taking as of the close of the financial year. Underthese circumstances, the physical stock taking carried out and as shown in the financial accounts were reliedupon for the purpose of the above mentioned statement of stock in trade [under clause (4)(1)(b) of Companies(Audit of Cost Accounts) Rules, 1998].

Section - 3 Cost Accounting Records
Schedule 1. Production Data 1 Annexures 2. Cost of Production and Sale of White Bagged Sugar I 3. Sugar Cane Produced II 4. Cost of Sugar Cane Crushed III 5. Cost of Beet Consumed IV 6. Cost of Process Material Consumed V 7. Cost of Salaries, Wages & Benefits VI 8. Cost of Steam / Generated Consumed VII 9. Cost of Electric Power Purchased / Generated and Consumed VIII 10. Other Factory Overheads IX 11. Administrative Expenses X 12. Selling Expenses XI

Schedule - I
S.# 2013-2014 2012-2013
1. (a) Cane Crushed:Date Started 01-11-2013 28-11-2012Date Finished 04-03-2014 27-02-2013Duration of run days 124 92Total No. of days of actual crushing 111 90Total No. of hours of actual crushing 2,663 2,150Total No. of hours lost 564 89Total cane milled (Tonne) 621,679 503,179Converted Maunds 15,541,964 12,579,464Total mixed juice obtained (Tonne) 718,434 595,336
(b) Gur Melted: – –
2. Juice & Added Water:Average mixed juice % cane 115.564 118.315 Average water added % cane 47.238 49.754
3. Sugar Made:Total Sugar bagged of all grade (100) kg. – –Total Sugar bagged of all grade (50) kg. 1,273,000 1,054,540 Sugar bagged (M. Tons) 63,650 52,727 Sugar in Process (M. Tons) 83.232 133.235
4. Molasses Extracted:Total molasses sent out (M. Tons) 28,660 22,838 Molasses in Process (M. Tons) 3.659 6.626
5. Recovery Percent:Average recovery of marketable white sugar % cane 10.230 10.480 Average production of final molasses % cane 4.610 4.539
6. By Products:Bagasse % cane 31.674 31.555 V. Filter Cake % cane 3.000 3.000
7. Clarification Process : (Specify)– Defecation, Melt, Phosphitation
Chief Financial Office Chief Executive
Karachi:
Particulars
Production DataFor the year ended September 30, 2014
AL-ABBAS SUGAR MILLS LIMITED

ANNEXURE - IQuantitative Data - Bagged SugarOpening Stock (Tonne) 11,449 12,062 Production (Tonne) 63,650 52,727 Total Qty. available for sale (Tonne) 75,099 64,789 Closing Stock (Tonne) 18,498 11,449 Sales (Tonne) 56,601 53,340
S. Amount Cost Amount CostNo. (Rs. in '000) per Ton (Rs. in '000) per Ton1. Raw Materials:
(a) Sugar Cane (Annexure - III) 2,787,166 43,789 2,404,163 45,596 (b) Beet (Annexure - IV) - - - - (c) Gur - - - - (d) Raw Sugar - - - - (e) Process Material (Annexure - V) 23,696 372 14,482 275
2. Salaries / wages benefits (Annexure - VI) 119,968 1,885 105,042 1,992 3. Consumable Stores 40,899 643 76,624 1,453 4. Repairs & Maintenance 6,945 109 12,062 229 5. Utilities: Steam (Annexure - VII) 24,712 388 25,611 486 6. Electric Power (Annexure - VIII) 32,026 503 33,747 640 7. Water & Gas 976 15 2,863 54 8. Insurance - - - - 9. Depreciation 23,395 368 24,343 462 10. Other Factory Overheads (Annexure - IX) 32,810 515 30,467 578 11. Total Cost 3,092,593 48,587 2,729,404 51,765 12. Add : Opening Stock of W.I.P. 5,823 - 5,584 - 13. Less : Closing Stock of W.I.P. (3,485) - (5,823) - 14. Total Cost of Goods Manufactured 3,094,931 48,624 2,729,165 51,760 15. Less : Realisable Value of By-Products:
– Transfer price of Molasses (254,585) (4,000) (179,225) (3,399) – Sale of Molasses - net (4) (0) (1,134) (22) – Transfer price of Bagasse (Consumed) Annex-VII (60,674) (953) (175,582) (3,330) – Stock adjustment of Bagasse in hand - net (7,441) (117) (5,151) (98) – Sale of Bagasse - net (23,465) (369) (2,790) (53)
16. Net cost of Goods Manufactured 2,748,762 43,186 2,365,283 44,859 17. Add : Packing Material & Handling 34,321 539 27,839 528 18. Net Cost of Bagged Sugar 2,783,083 43,725 2,393,122 45,387 19. Add : Excise Duty / Sales Tax - - - - 20. Total Cost of Bagged Sugar 2,783,083 43,725 2,393,122 45,387 21. Add : Opening Stock of Sugar 526,717 - 587,477 - 22. Less : Closing Stock of Sugar (815,234) - (526,717) - 23. Cost of Sales 2,494,566 44,073 2,453,882 46,005 24. Administrative Expenses (Annexure - X) 70,385 1,244 70,053 1,313 25. Selling & Distribution Expenses (Annexure - XI) 38,077 673 10,997 206 26. Financial Expenses 125,711 2,221 138,840 2,603 27. Other Charges / (Income) (81,820) (1,446) (16,337) (306) TOTAL COST OF MAKE & SALE 2,646,919 46,765 2,657,435 49,821
Chief Financial Officer Chief Executive
AL-ABBAS SUGAR MILLS LIMITED
2012-2013Particulars
Statement Showing Cost of Production and Sale of White Bagged Sugar
2012-2013
For the year ended September 30, 2014
2013-2014
2013-2014

ANNEXURE - II
S.No. Particulars Amount Amount
Quantity (Rs. in '000) Quantity (Rs. in '000)
1. Seeds and Other Inputs
SeedFertilizers, herbicides etc.InsecticidesAbiana / Water ChargesTotal Cost of Inputs
2. Labour Cost
Land preparationPlantationMaintenance of cane crop / ratoonsOperation of tractorsHarvestingTotal Labour Cost
2. Other Cost
Fuel for tractors operationMaintenance and over haul of tractorsInsuranceInterest expensesDepreciation of equipmentsRent of agriculture equipments (if any)Total other costs
Total Cost of own production (1 + 2 + 3)Sales value at controlled priceProfit / Loss on own production
Chief Financial Officer Chief Executive
AL-ABBAS SUGAR MILLS LIMITED
Statement Showing Cost of Sugar Cane ProducedFor the year ended September 30, 2014
2013-2014 2012-2013
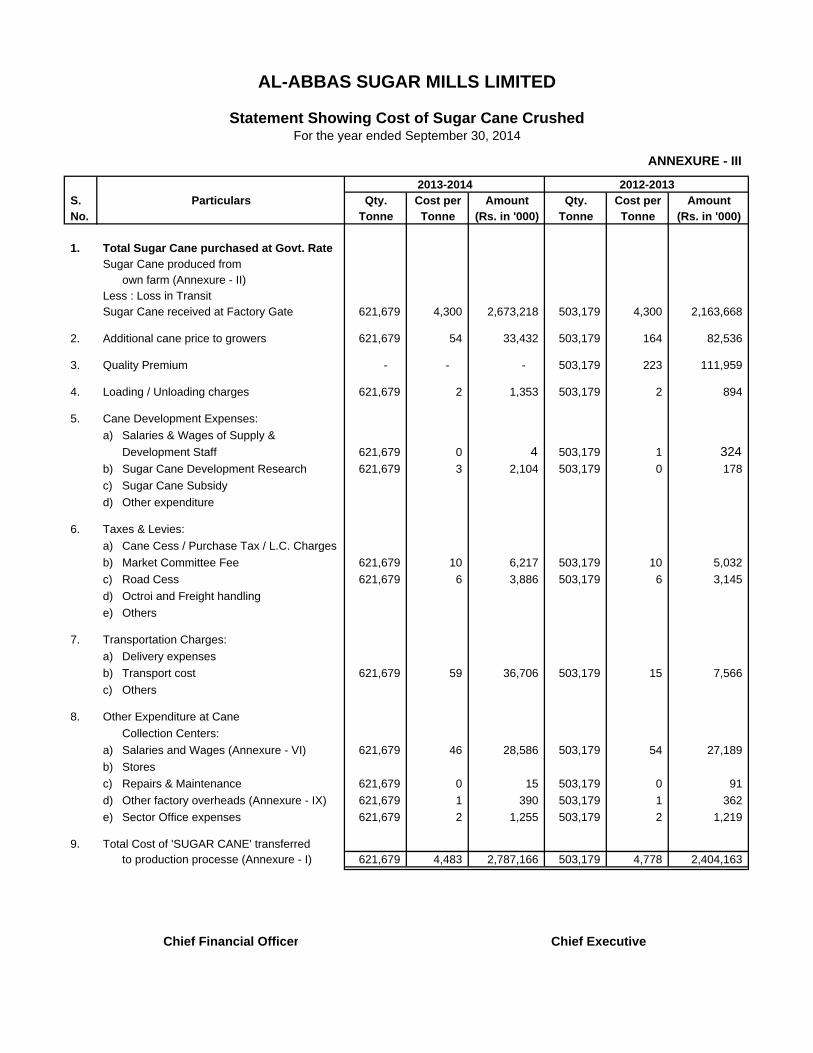
ANNEXURE - III
S. Qty. Cost per Amount Qty. Cost per AmountNo. Tonne Tonne (Rs. in '000) Tonne Tonne (Rs. in '000)
1. Total Sugar Cane purchased at Govt. RateSugar Cane produced from
own farm (Annexure - II)Less : Loss in TransitSugar Cane received at Factory Gate 621,679 4,300 2,673,218 503,179 4,300 2,163,668
2. Additional cane price to growers 621,679 54 33,432 503,179 164 82,536
3. Quality Premium - - - 503,179 223 111,959
4. Loading / Unloading charges 621,679 2 1,353 503,179 2 894
5. Cane Development Expenses:a) Salaries & Wages of Supply &
Development Staff 621,679 0 4 503,179 1 324 b) Sugar Cane Development Research 621,679 3 2,104 503,179 0 178 c) Sugar Cane Subsidyd) Other expenditure
6. Taxes & Levies:a) Cane Cess / Purchase Tax / L.C. Chargesb) Market Committee Fee 621,679 10 6,217 503,179 10 5,032 c) Road Cess 621,679 6 3,886 503,179 6 3,145 d) Octroi and Freight handlinge) Others
7. Transportation Charges:a) Delivery expensesb) Transport cost 621,679 59 36,706 503,179 15 7,566 c) Others
8. Other Expenditure at CaneCollection Centers:
a) Salaries and Wages (Annexure - VI) 621,679 46 28,586 503,179 54 27,189 b) Storesc) Repairs & Maintenance 621,679 0 15 503,179 0 91 d) Other factory overheads (Annexure - IX) 621,679 1 390 503,179 1 362 e) Sector Office expenses 621,679 2 1,255 503,179 2 1,219
9. Total Cost of 'SUGAR CANE' transferredto production processe (Annexure - I) 621,679 4,483 2,787,166 503,179 4,778 2,404,163
Chief Financial Officer Chief Executive
AL-ABBAS SUGAR MILLS LIMITED
2012-2013Particulars
Statement Showing Cost of Sugar Cane CrushedFor the year ended September 30, 2014
2013-2014
ANNEXURE - IV
S. Qty. Cost per Amount Qty. Cost per AmountNo. Tonne Tonne (Rs. in '000) Tonne Tonne (Rs. in '000)
1. Total beet purhcased at Govt. fixed rateLess : Loss in transitBeet received at factory gate
2. Commission paid
3. Loading / Unloading
4. Beet development expensesa) Salaries & Wages of Supply &
Development Staffb) Sugar Development Researchc) Supply Staff & transportation expensesd) Other expenditure
5. Taxes & Levies (if any):a) Purchase Tax b) Market Committee Feec) Road Cessd) Octroi and Freight handlinge) Other levies
7. Transportation Charges:a) Delivery expenses / travelling from
purchases centre to mill gateb) Transport subsidyc) Others
8. Other Expenditure at BeetCollection Centers:
a) Salaries and Wagesb) Storesc) Repairs & Maintenanced) Others
9. Total Cost of 'BEET' transferredto production processe (Annexure - I)
Chief Financial Officer Chief Executive
AL-ABBAS SUGAR MILLS LIMITED
2013-2014 2012-2013Particulars
Statement Showing Cost of Beet ConsumedFor the year ended September 30, 2014

ANNEXURE - V
S.No. Amount Cost Amount Cost
(Rs. in '000) per Tonne (Rs. in '000) per Tonne
Total Sugar Produced (Tonne)
1. Chemicals, Lubricants & Process:1. Unslaked Lime 4,567 72 3,070 58 2. Phosporic Acid 2,732 43 1,722 33 3. Chemquest 1,200 19 1,000 19 4. Talofloc Wax 7,756 122 5,926 112 5. Polyelectrolyt Accofloc 625 10 416 8 6. Talo Float 197 3 151 3 7. Caustic Soda 1,345 21 822 16 8. Soda Ash 17 0 6 0 9. Lead sub Accatate 116 2 239 5 10. Tri Sodium Phosphate - - 8 0 11. Chemrite 30 0 - - 12. Bleaching Powder 357 6 284 5 13. Formaline 8 0 18 0 14. Rock Salt 259 4 527 10 15. Softno Treat 192 3 190 4 16. Sewing Thread 504 8 - - 17. Cleaning Brushes 163 3 28 1 18. Others 5,258 83 292 6
TOTAL 25,326 398 14,699 279
2014 2013Rupees Rupees
2. ALLOCATED TO:
(a) Electric Generation (Annexure - VIII) 946 24
(b) Steam Generation (Annexure - VII) 684 193
(c) Production Process (Annexure - I) 23,696 14,482
TOTAL 25,326 14,699
Chief Financial Officer Chief Executive
AL-ABBAS SUGAR MILLS LIMITED
52,727
Particulars
Statement Showing Cost of Process Material ConsumedFor the year ended September 30, 2014
2012-20132013-2014
63,650

ANNEXURE - VI
S. Amount Cost Amount CostNo. (Rs. in '000) per Tonne (Rs. in '000) per Tonne
Total Sugar Produced (Tonne)COST1. Salaries / Wages:(i) Officers and permanent staff 111,294 1,749 106,491 2,020 (ii) Seasonal staff 3,877 61 3,297 63 (iii) Daily rated and contract labour 52,617 827 43,437 824 (iv) Bonuses 22,023 346 17,896 339
2. Benefits(i) Medical expenses 222 3 634 12 (ii) Canteen expenses 386 6 190 4 (iii) Welfare, Recreation - - 12 0 (iv) Transport and travelling - - - - (v) Education Cess / expenses 209 3 30 1 (vi) Group Insurance / Workmen - - - - (vii) Provident Fund - - - - (viii) Gratuity / Pension / Retirement benefits 3,681 58 6,035 114 (ix) Others 8,579 135 8,819 167
(x) TOTAL 202,888 3,188 186,841 3,544
2014 2013Allocated to: Rupees Rupees(a) Electricity Generation (Annexure - VIII) 18,113 07% 16,318 07%(b) Steam Generation (Annexure - VII) 7,454 03% 6,816 03%(c) Raw material - cane (Annexure - III) 28,586 24% 27,189 24%(d) Production process - (Annexure-I) 119,968 22% 105,042 22%(e) Administration expenses - (Annexure - X) 28,767 44% 31,476 44%(f) Selling & distribution expenses - (Annexure - XI) - - - -(g) Any other, if any - - - -
TOTAL 202,888 100% 186,841 100%
Chief Financial Officer Chief Executive
AL-ABBAS SUGAR MILLS LIMITED
% %
Statement Showing Cost of Salaries, Wages & BenefitsFor the year ended September 30, 2014
52,727
Particulars2012-20132013-2014
63,650

ANNEXURE - VIIS.No. Particulars
Type of Steam Boiler usedBoiler No. 1 & 2 & 3
1. No. of days worked2. Installed capacity3. Utilised capacity4. Production :
a) High Pressure Steamb) Medium Pressure Steamc) Low Pressure Steamd) Less : transit lossese) Total
5. Percentage of Capacity Utilization ( 3 / 2 x 100 )
S. Quantity Cost Amount Quantity Cost AmountNo. in Tonne per Tonne (Rs. in '000) in Tonne per Tonne (Rs. in '000)1. Water Charges 418,947 438,665 2. Fuels:
(a) Bagasse:(i) Own - Realizable value 418,947 144.83 60,674 438,665 400.50 175,686 (ii) Purchased - - - 438,665 4.77 2,094
(b) Pith(c) Coal purchased(e) Furnace Oil 418,947 2.34 980 438,665 5.78 2,537 (e) Fire wood 418,947 0.05 21 438,665 1.82 797 (f) Gas(g) Other fuels, if any
3. Quantity of waste heat from the plant, if any4. Consumable Stores
- Process Material (Annexure - V) 418,947 1.63 684 438,665 0.44 193 5. Direct Salaries, Wages & Benefits
(As per Annexure - VI) 418,947 17.79 7,454 438,665 15.54 6,816 6. Repairs & maintenance 418,947 3.78 1,584 438,665 5.03 2,207 7. Other direct expenses
- Factory Overheads (Annexure - IX) 418,947 0.77 324 438,665 0.69 301 8. Baggase handling charges 418,947 11.13 4,663 438,665 7.66 3,362 9. Depreciation 418,947 39.74 16,647 438,665 39.49 17,321
Total Cost of Steam Raised 418,947 222.06 93,031 438,665 481.72 211,314 10. Less : Out side sold
Total Cost of Steam for Self Consumption 418,947 222.06 93,031 438,665 481.72 211,314 Add : Cost of Steam Purchased
11. Total Cost of Steam Consumed 418,947 222.06 93,031 438,665 481.72 211,314 12. ALLOCATION
Total of item 12 allocated to:(i) White bagged sugar (Annexure - I) 385,431 85,386 421,118 203,391 (ii) Electric power house (Annexure - VIII) 33,516 7,645 17,547 7,923 (iii) Others: (a) Staff Colony
(b) Office building etc.TOTAL 418,947 222.06 93,031 438,665 481.72 211,314
Chief Financial Officer Chief Executive
Tonne / HourTonne / Hour
Days
Tonne 431,904 452,232
2013-2014 2012-2013
(12,957)TonneTonne
1241,445,400431,904
1,445,40092
Particulars
452,232
31%438,665(13,567)
418,94730%
AL-ABBAS SUGAR MILLS LIMITED
Statement Showing Cost of Steam Generated / ConsumedFor the year ended September 30, 2014
2012-20132013-2014Water Tube Boiler
Unit
Tonne / Hour

ANNEXURE - VIII
S.No. Particulars1. Installed capacity (kwh)2. No. of units generated from steam (KWH)3. No. of units purchased (KWH)4. Total (2 + 3)5. Consumption in power house including other losses6. Net units consumed (4 – 5)7. Percentage of Consumption and losses to total
units available = 5/4 x 1008. Percentage of power generated to
installed capacity
S.Qty. in Rate Amount Qty. in Rate Amount
No. KWH Per Unit (Rs. in '000) KWH Per Unit (Rs. in '000)1. Steam (Annexure - VII) 17,430,220 0.44 7,645 21,365,360 0.37 7,923 2. Consumable Stores
- Process Material (Annexure - V) 17,430,220 0.05 946 21,365,360 0.00 24 3. Direct Salaries, Wages & Benefits
(As per Annexure - VI) 17,430,220 1.04 18,113 21,365,360 0.76 16,318 4. Other Direct expenses5. Repairs & Maintenance 17,430,220 0.02 373 21,365,360 0.20 4,333 6. Other expenses7. Depreciation 17,430,220 0.28 4,949 21,365,360 0.24 5,149
Total 17,430,220 1.84 32,026 21,365,360 1.58 33,747 8. Less :
(a) Credit for Exhaust Steam used in process etc.
(b) Other credits, if any9. Cost of Power Generated 17,430,220 1.84 32,026 21,365,360 1.58 33,747 10. Less : Cost of Power Sold11. Add : Cost of Power purchased12. Total Net Cost of power consumed 17,430,220 1.84 32,026 21,365,360 1.58 33,747 13. Cost per unit averageALLOCATION
Total at item 12 allocated to:(i) White bagged sugar (Annexure - I) 17,430,220 1.84 32,026 21,365,360 1.58 33,747 (ii) Self consumption (iii) Others
(a) Staff colony / Office building(b) Other (specify)
14. TOTAL (i + ii + iii) 17,430,220 1.84 32,026 21,365,360 1.58 33,747
Chief Financial Officer Chief Executive
1.75%
27%
14,68217,740,682
310,46217,430,220
65,700,00017,726,000
21,745,914
2012-2013
21,365,360380,554
1.75%
33%
AL-ABBAS SUGAR MILLS LIMITED
70,894
Particulars
2013-2014
Statement Showing Cost of Electric Power Purhcased / Generated & ConsumedFor the year ended September 30, 2014
65,700,00021,675,020
2012-20132013-2014

ANNEXURE - IX
S. Amount Cost Amount CostNo. (Rs. in '000) per Tonne (Rs. in '000) per Tonne
1. Total Sugar Produced (Tonne)
2. COST:
1. Rent, rates & taxes - - - -
2. Printing & stationery 119 2 142 3
3. Communication charges 477 7 349 7
4. Insurance expenses 8,986 141 7,580 144
5. Travelling & conveyance 3,228 51 3,245 62
6. Fees and Subscriptions 430 7 1,056 20
7. Entertainment 4,274 67 3,593 68
8. Vehicle running expenses 5,308 83 5,534 105
9. Security charges 9,163 144 7,908 150
10. Newspaper and periodicals 59 1 34 1
11. Miscellaneous expenses 1,480 23 1,689 32
12. TOTAL 33,524 527 31,130 590
ALLOCATED TO :
(i) White bagged sugar (Annexure - I) 32,810 515 30,467 578
(ii) Raw material - cane (Annexure - III) 390 6 362 7
(iii) Steam generation (Annexure - VII) 324 5 301 6
(iv) Others:
(a) Staff colony - - - -
(b) Office building etc. - - - -
Total as per Item 12 above 33,524 527 31,130 590
Chief Financial Officer Chief Executive
52,727
2012-20132013-2014
63,650
AL-ABBAS SUGAR MILLS LIMITED
Particulars
Statement Showing Other Factory OverheadsFor the year ended September 30, 2014

ANNEXURE - X
S. Amount Cost Amount CostNo. (Rs. in '000) per Tonne (Rs. in '000) per Tonne
1. Total Sugar Sold (Tonne)
2. COST:
(i) Salaries, allowances & benefits (Annexure - VI) 28,767 508 31,476 590
(ii) Rent, rates & taxes 3,067 54 3,506 66
(iii) Insurance 1,943 34 1,692 32
(iv) Utilities 2,590 46 2,267 43
(v) Printing & stationery 1,471 26 927 17
(vi) Communication charges 1,908 34 1,987 37
(vii) Repairs & maintenance 1,230 22 1,492 28
(viii) Travelling & conveyance 540 10 1,006 19
(ix) Fees and subscription 3,480 61 2,832 53
(x) Entertainment 1,051 19 1,273 24
(xi) Legal & professional charges 6,419 113 5,398 101
(xii) Auditors' remuneration 839 15 759 14
(xiii) Vehicle running expenses 7,570 134 7,299 137
(xiv) Charity & donations 501 9 451 8
(xv) Newspaper and periodicals 42 1 44 1
(xvi) Security charges 920 16 545 10
(xvii) Depreciation 5,291 93 5,753 108
(xviii) Miscellaneous 2,756 49 1,346 25
TOTAL 70,385 1,244 70,053 1,313
Chief Financial Officer Chief Executive
53,340
2012-20132013-2014
56,601
AL-ABBAS SUGAR MILLS LIMITED
Particulars
Statement Showing Administration ExpensesFor the year ended September 30, 2014

ANNEXURE - XI
S. Amount Cost Amount CostNo. (Rs. in '000) per Tonne (Rs. in '000) per Tonne
1. Total Sugar Sold (Tonne)
2. COST:
(i) Salaries, allowances & benefits (Annexure - VI) - - - -
(ii) Sugar bags handling expenses 8,697 154 7,973 149
(iii) Export transportation and others 26,599 470 246 5
(iv) Marking fees 2,781 49 2,778 52
(v) Other expenses - - - -
TOTAL 38,077 673 10,997 206
Chief Financial Officer Chief Executive
53,340
2012-20132013-2014
56,601
AL-ABBAS SUGAR MILLS LIMITED
Particulars
Statement Showing Selling ExpensesFor the year ended September 30, 2014