akzonobel q3 2015 results investor update presentation
TRANSCRIPT
255-255-255
185-201-208
068-105-125
085-190-207
000-146-187
000-139-197
000-081-146
134-134-136
000-000-000
183-185-186
000-139-197
000-081-146
134-134-136
183-185-186
185-201-208
255-255-255
Text Bk D1
Color 6
Color 5
Color 4
Color 3
Color 2
Color 1
Text Bk D2
Text Bk L1
Text Bk L2
Hyper
F. Hyper
Text D2
Text L2
Agenda main
Agenda main 2nd
Investor Update Q3 2015 results
Maëlys Castella
October 22, 2015
2 Investor Update Q3 2015 results
Highlights
Operational review
Financial review
Conclusion
Questions
Agenda
255-255-255
185-201-208
068-105-125
085-190-207
000-146-187
000-139-197
000-081-146
134-134-136
000-000-000
183-185-186
000-139-197
000-081-146
134-134-136
183-185-186
185-201-208
255-255-255
Text Bk D1
Color 6
Color 5
Color 4
Color 3
Color 2
Color 1
Text Bk D2
Text Bk L1
Text Bk L2
Hyper
F. Hyper
Text D2
Text L2
Agenda main
Agenda main 2nd
Q3 2014 Q3 2015
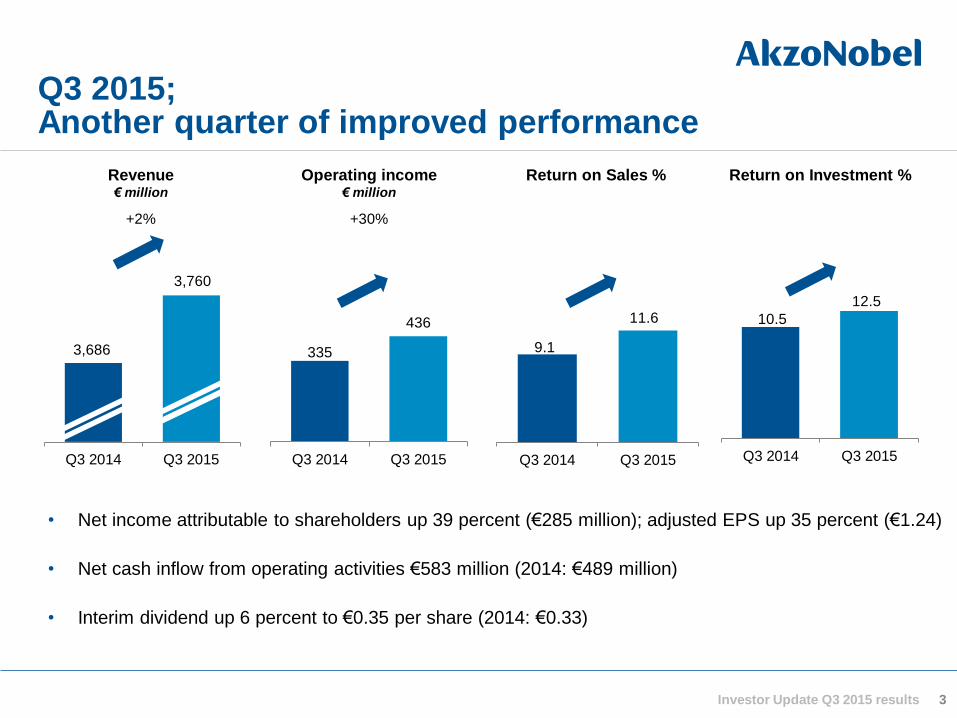
Q3 2015; Another quarter of improved performance
3 Investor Update Q3 2015 results
10.5
Q3 2014 Q3 2015
Revenue € million
Return on Investment %
• Net income attributable to shareholders up 39 percent (€285 million); adjusted EPS up 35 percent (€1.24)
• Net cash inflow from operating activities €583 million (2014: €489 million)
• Interim dividend up 6 percent to €0.35 per share (2014: €0.33)
335
436
Q3 2014 Q3 2015
Operating income € million
3,686
3,760
+2% +30%
Return on Sales %
9.1
11.6
Q3 2014 Q3 2015
12.5

4 Investor Update Q3 2015 results
~42% of revenues
New Build Projects
Maintenance, Renovation and Repair
Building Products and Components
~16% of revenues
Automotive OEM, Parts and Assembly
Automotive Repair
Marine and Air Transport
~17% of revenues
Consumer Durables
Consumer Packaged Goods
~25% of revenues
Natural Resource and Energy Industries
Process Industries

Mature markets remained stable, while Brazil, Russia and China contract further
5 Investor Update Q3 2015 results
*Bubble size=manufacturing output, 2015e (US$bn: 2010 prices)
Sources: Oxford Economics, HSBC (China), Markit (US)
Purchase Managers’ Index (PMI)*
Figures below 50 indicate pessimism
40
45
50
55
60
Purchase Managers’ Index (PMI)*
September 2015
Brazil China
Russia
France
Japan
India
Germany Netherlands
US
40
50
60
US
Eurozone
China

Consumer confidence remains low, although trends differ per country
6
Consumer confidence, Q2 2015
Figures below 100 indicate some degree of pessimism
Source: Nielsen Investor Update Q3 2015 results
131 120 107 104 101 99 97 90 87 87 83 81 78 70 66
0
20
40
60
80
100
120
140
Recent trends compared
to Q1 2015

255-255-255
185-201-208
068-105-125
085-190-207
000-146-187
000-139-197
000-081-146
134-134-136
000-000-000
183-185-186
000-139-197
000-081-146
134-134-136
183-185-186
185-201-208
255-255-255
Text Bk D1
Color 6
Color 5
Color 4
Color 3
Color 2
Color 1
Text Bk D2
Text Bk L1
Text Bk L2
Hyper
F. Hyper
Text D2
Text L2
Agenda main
Agenda main 2nd
-1% 0% -1%
4% 2%
Volume Price/Mix Acquisitions/Divestments
Exchange rates Total
Financial performance improved again during Q3 2015
€ million Q3 2014 Q3 2015 Δ%
Revenue 3,686 3,760 2
Operating income 335 436 30
Ratio, % Q3 2014 Q3 2015
Return on sales 9.1 11.6
Return on sales (excluding restructuring costs) 10.6 12.0
Moving average return on investment 10.5 12.5
Increase
Decrease
Revenue development Q3 2015 vs. Q3 2014
7 Investor Update Q3 2015 results

255-255-255
185-201-208
068-105-125
085-190-207
000-146-187
000-139-197
000-081-146
134-134-136
000-000-000
183-185-186
000-139-197
000-081-146
134-134-136
183-185-186
185-201-208
255-255-255
Text Bk D1
Color 6
Color 5
Color 4
Color 3
Color 2
Color 1
Text Bk D2
Text Bk L1
Text Bk L2
Hyper
F. Hyper
Text D2
Text L2
Agenda main
Agenda main 2nd
All Business Areas impacted by challenging market conditions
-6
-2
2
6
Decorative Paints Performance Coatings Specialty Chemicals AkzoNobel
Quarterly volume development in % year-on-year
-4
-1
2
5
Decorative Paints Performance Coatings Specialty Chemicals AkzoNobel
Quarterly price/mix development in % year-on-year
0% -2% -1% 0%
-2%
2% -2% 0%
2014
2015
8 Investor Update Q3 2015 results

255-255-255
185-201-208
068-105-125
085-190-207
000-146-187
000-139-197
000-081-146
134-134-136
000-000-000
183-185-186
000-139-197
000-081-146
134-134-136
183-185-186
185-201-208
255-255-255
Text Bk D1
Color 6
Color 5
Color 4
Color 3
Color 2
Color 1
Text Bk D2
Text Bk L1
Text Bk L2
Hyper
F. Hyper
Text D2
Text L2
Agenda main
Agenda main 2nd
0%
7%
0%
0%
Volume Price/Mix Acquisitions/Divestments
Exchange rates Total
-2%
9
= • Revenues flat due to
favorable currency effects
offset by adverse price/mix
• Volumes up in Asia; down
in Europe and Latin
America
• Operating income
improved due to the new
operating model, lower
costs and currency
developments
Decorative Paints Q3 2015 highlights
€ million Q3 2014 Q3 2015 Δ%
Revenue 1,050 1,052 -
Operating income 113 121 7
Ratio, % Q3 2014 Q3 2015
Return on sales 10.8 11.5
Return on sales (excl. restr. costs) 10.9 12.0
Increase
Decrease
Revenue development Q3 2015 vs. Q3 2014
Investor Update Q3 2015 results
2%
255-255-255
185-201-208
068-105-125
085-190-207
000-146-187
000-139-197
000-081-146
134-134-136
000-000-000
183-185-186
000-139-197
000-081-146
134-134-136
183-185-186
185-201-208
255-255-255
Text Bk D1
Color 6
Color 5
Color 4
Color 3
Color 2
Color 1
Text Bk D2
Text Bk L1
Text Bk L2
Hyper
F. Hyper
Text D2
Text L2
Agenda main
Agenda main 2nd
10
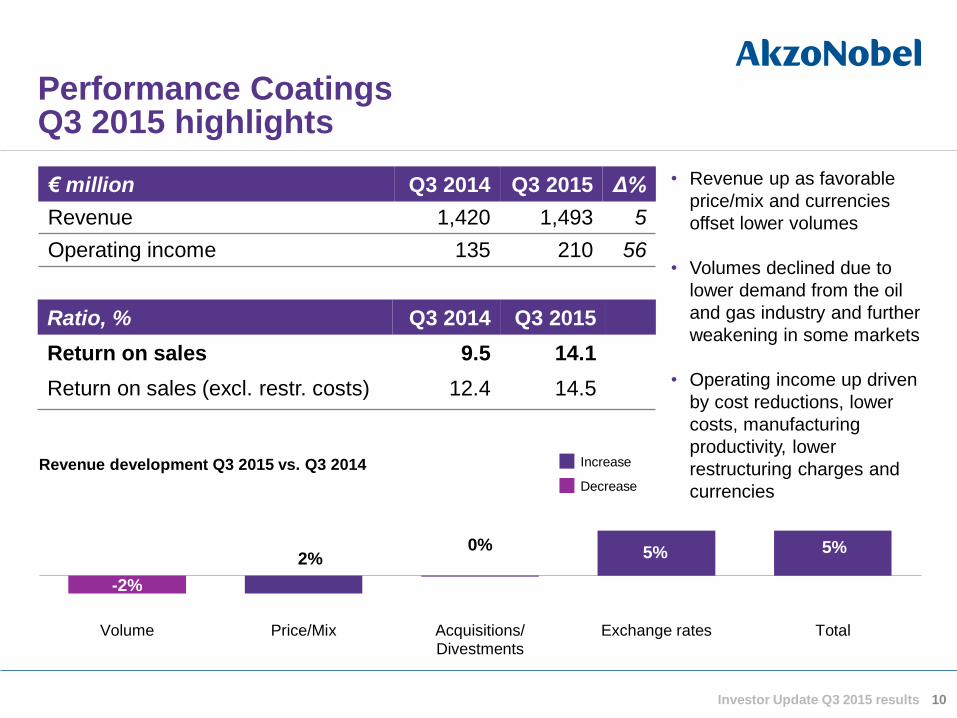
Performance Coatings Q3 2015 highlights
Increase
Decrease
-2%
2% 0% 5% 5%
Volume Price/Mix Acquisitions/Divestments
Exchange rates Total
Revenue development Q3 2015 vs. Q3 2014
• Revenue up as favorable
price/mix and currencies
offset lower volumes
• Volumes declined due to
lower demand from the oil
and gas industry and further
weakening in some markets
• Operating income up driven
by cost reductions, lower
costs, manufacturing
productivity, lower
restructuring charges and
currencies
-1%
€ million Q3 2014 Q3 2015 Δ%
Revenue 1,420 1,493 5
Operating income 135 210 56
Ratio, % Q3 2014 Q3 2015
Return on sales 9.5 14.1
Return on sales (excl. restr. costs) 12.4 14.5
Investor Update Q3 2015 results
11
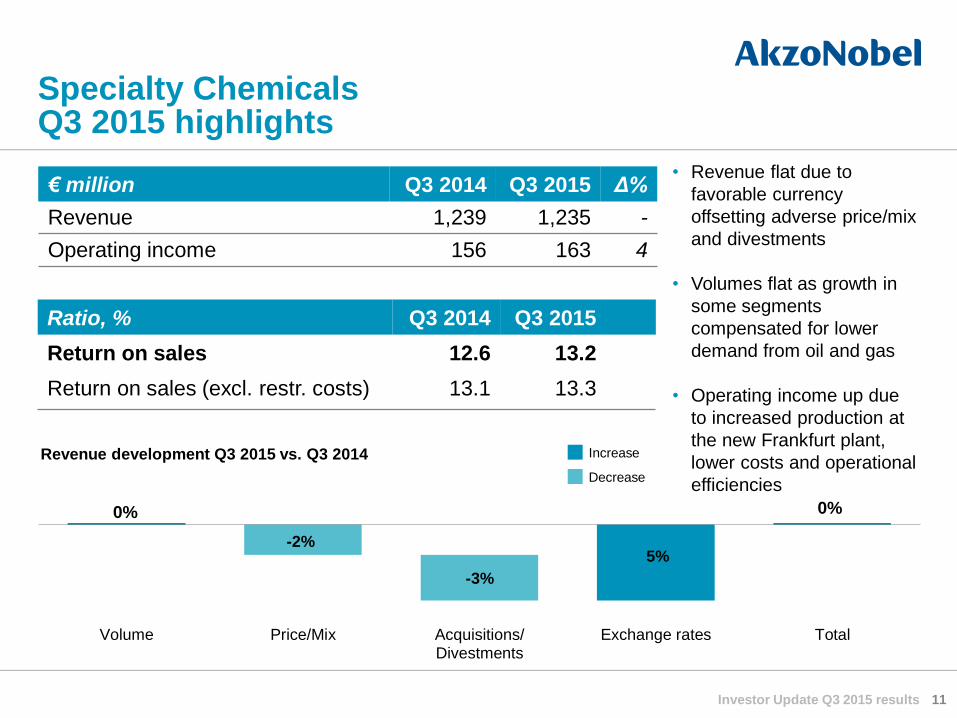
• Revenue flat due to
favorable currency
offsetting adverse price/mix
and divestments
• Volumes flat as growth in
some segments
compensated for lower
demand from oil and gas
• Operating income up due
to increased production at
the new Frankfurt plant,
lower costs and operational
efficiencies
Specialty Chemicals Q3 2015 highlights
Increase
Decrease
-2%
-3%
5%
0% 0%
Volume Price/Mix Acquisitions/Divestments
Exchange rates Total
Revenue development Q3 2015 vs. Q3 2014
€ million Q3 2014 Q3 2015 Δ%
Revenue 1,239 1,235 -
Operating income 156 163 4
Investor Update Q3 2015 results
Ratio, % Q3 2014 Q3 2015
Return on sales 12.6 13.2
Return on sales (excl. restr. costs) 13.1 13.3

12
Some business highlights from Q3 2015
V§ Color expertise
A striking shade of gold is the
Color of the Year for 2016. An
appropriate color for an
Olympic year, it was chosen
by a specially invited panel of
independent design and color
experts to spearhead the
company's ColorFuturesTM
2016 color trend guide.
Organic growth
We’ve announced plans to
double capacity at our powder
coatings facility in Dong Nai
and open a new office for
Performance Coatings in Ho
Chi Minh City. Due to be
ready in November, the new
production line will be
supported by a 20 percent
increase in workforce.
Doing more with less
As part of a new partnership
with Eneco and Groningen
Seaports, we’re aiming to
reduce our CO2 emissions by
more than 100,000 tons a
year. The agreement includes
purchasing sustainably
generated steam for the next
12 years.
Decorative Paints Performance Coatings Specialty Chemicals
Investor Update Q3 2015 results
255-255-255
185-201-208
068-105-125
085-190-207
000-146-187
000-139-197
000-081-146
134-134-136
000-000-000
183-185-186
000-139-197
000-081-146
134-134-136
183-185-186
185-201-208
255-255-255
Text Bk D1
Color 6
Color 5
Color 4
Color 3
Color 2
Color 1
Text Bk D2
Text Bk L1
Text Bk L2
Hyper
F. Hyper
Text D2
Text L2
Agenda main
Agenda main 2nd
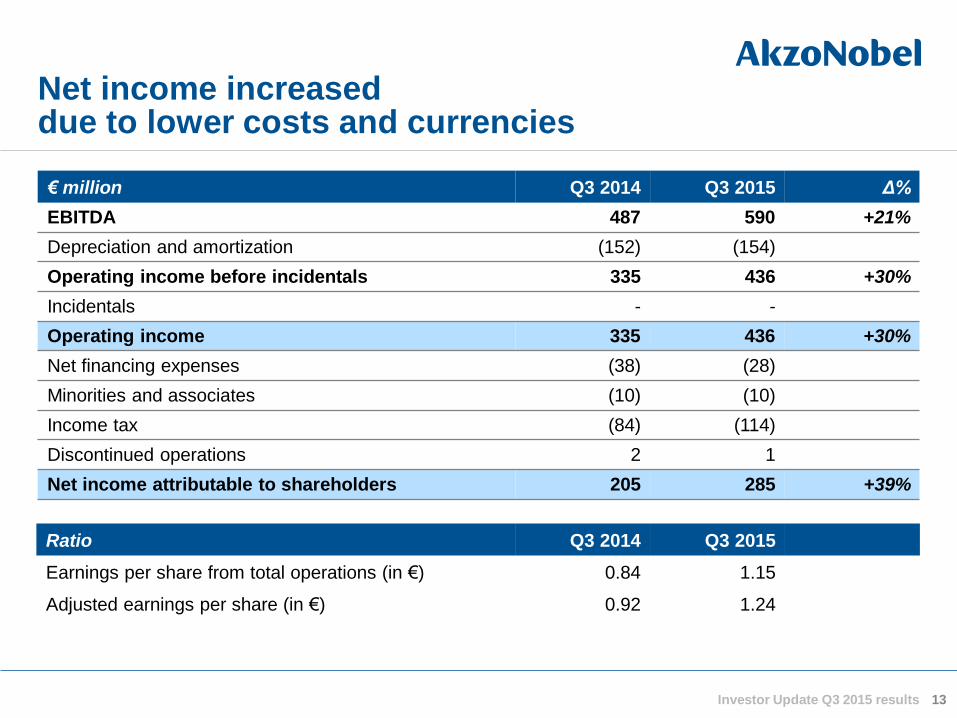
Net income increased due to lower costs and currencies
€ million Q3 2014 Q3 2015 Δ%
EBITDA 487 590 +21%
Depreciation and amortization (152) (154)
Operating income before incidentals 335 436 +30%
Incidentals - -
Operating income 335 436 +30%
Net financing expenses (38) (28)
Minorities and associates (10) (10)
Income tax (84) (114)
Discontinued operations 2 1
Net income attributable to shareholders 205 285 +39%
Ratio Q3 2014 Q3 2015
Earnings per share from total operations (in €) 0.84 1.15
Adjusted earnings per share (in €) 0.92 1.24
13 Investor Update Q3 2015 results
255-255-255
185-201-208
068-105-125
085-190-207
000-146-187
000-139-197
000-081-146
134-134-136
000-000-000
183-185-186
000-139-197
000-081-146
134-134-136
183-185-186
185-201-208
255-255-255
Text Bk D1
Color 6
Color 5
Color 4
Color 3
Color 2
Color 1
Text Bk D2
Text Bk L1
Text Bk L2
Hyper
F. Hyper
Text D2
Text L2
Agenda main
Agenda main 2nd
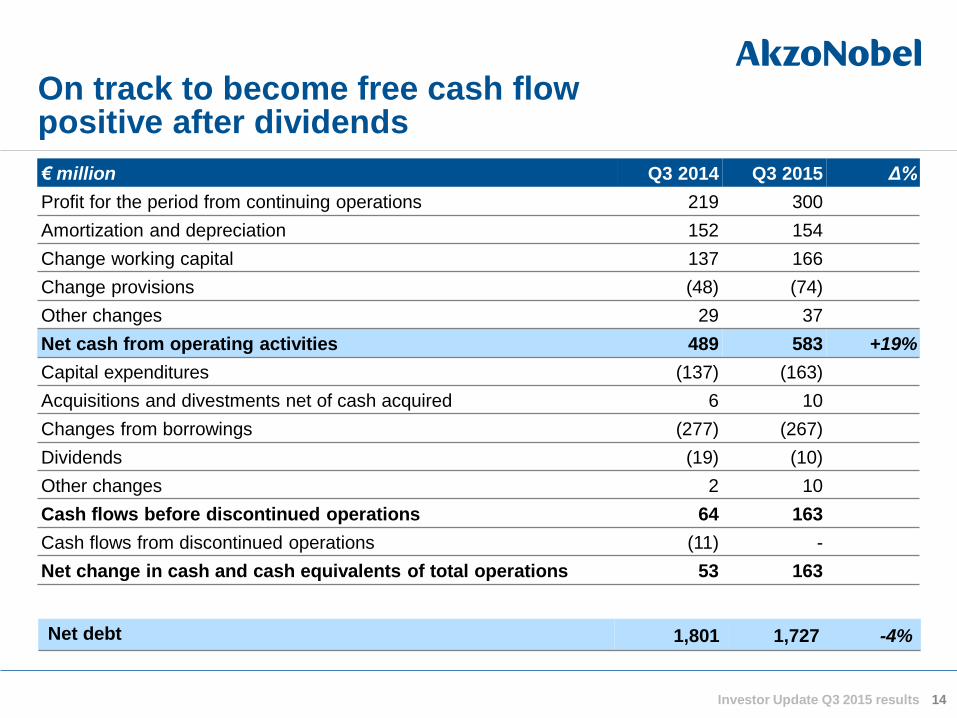
On track to become free cash flow positive after dividends
€ million Q3 2014 Q3 2015 Δ%
Profit for the period from continuing operations 219 300
Amortization and depreciation 152 154
Change working capital 137 166
Change provisions (48) (74)
Other changes 29 37
Net cash from operating activities 489 583 +19%
Capital expenditures (137) (163)
Acquisitions and divestments net of cash acquired 6 10
Changes from borrowings (277) (267)
Dividends (19) (10)
Other changes 2 10
Cash flows before discontinued operations 64 163
Cash flows from discontinued operations (11) -
Net change in cash and cash equivalents of total operations 53 163
14 Investor Update Q3 2015 results
Net debt 1,801 1,727 -4%

255-255-255
185-201-208
068-105-125
085-190-207
000-146-187
000-139-197
000-081-146
134-134-136
000-000-000
183-185-186
000-139-197
000-081-146
134-134-136
183-185-186
185-201-208
255-255-255
Text Bk D1
Color 6
Color 5
Color 4
Color 3
Color 2
Color 1
Text Bk D2
Text Bk L1
Text Bk L2
Hyper
F. Hyper
Text D2
Text L2
Agenda main
Agenda main 2nd
Cash management discipline continues
15
1,785 1,418
2,026
2,017
1,870
12.1%
10.1%
14.1% 12.8%
12.4%
0%
2%
4%
6%
8%
10%
12%
14%
16%
0
500
1,000
1,500
2,000
2,500
Q3 2014 Q4 2014 Q1 2015 Q2 2015 Q3 2015
Operating Working Capital
€ million
Capital Expenditures
€ million
Other
Decorative Paints
Performance Coatings
Specialty Chemicals
Investor Update Q3 2015 results
Operating Working Capital
OWC as % of LQ revenue * 4
9M 2014 9M 2015
€ 402 € 423
3.7% 3.7%
Capex as % of revenue

255-255-255
185-201-208
068-105-125
085-190-207
000-146-187
000-139-197
000-081-146
134-134-136
000-000-000
183-185-186
000-139-197
000-081-146
134-134-136
183-185-186
185-201-208
255-255-255
Text Bk D1
Color 6
Color 5
Color 4
Color 3
Color 2
Color 1
Text Bk D2
Text Bk L1
Text Bk L2
Hyper
F. Hyper
Text D2
Text L2
Agenda main
Agenda main 2nd
16 Investor Update Q3 2015 results
Pension deficit development during Q3 2015
€ million Decrease
Increase
IAS19 pension deficit down to €0.9 billion due to lower inflation
Key pension assumptions metrics Q3 2015 Q2 2015
Discount rate 3.5% 3.5%
Inflation rate 2.9% 3.1%
10 13 301
(1,099)
(53) (59)
(6)
(893)
Deficit end Q22015
Top-ups Discount rateson DBO
Inflationon DBO
Asset returnover P&L
UK Buy-in Other Deficit end Q32015
255-255-255
185-201-208
068-105-125
085-190-207
000-146-187
000-139-197
000-081-146
134-134-136
000-000-000
183-185-186
000-139-197
000-081-146
134-134-136
183-185-186
185-201-208
255-255-255
Text Bk D1
Color 6
Color 5
Color 4
Color 3
Color 2
Color 1
Text Bk D2
Text Bk L1
Text Bk L2
Hyper
F. Hyper
Text D2
Text L2
Agenda main
Agenda main 2nd
Conclusion
17 Investor Update Q3 2015 results
• Strong performance improvement in all businesses
• Interim dividend up 6 percent to €0.35 per share (2014: €0.33)
• Number one ranking on the influential Dow Jones Sustainability Index (DJSI), in the Materials industry
group, for the fourth consecutive year
• Market outlook is unchanged: positive trends in North America, no improvement for Europe overall as
well as a challenging environment in some countries, including Russia, Brazil and China. Based on
current rates, the positive impact of foreign currency is expected to moderate in the 4th quarter
• The significant actions taken in recent years form a sound basis for further improved performance
• On track to deliver the 2015 targets
Upcoming events:
Capital Markets Day, October 27, 2015
Q4 and Full Year Results, February 10, 2016
18 Investor Update Q3 2015 results
Questions
255-255-255
185-201-208
068-105-125
085-190-207
000-146-187
000-139-197
000-081-146
134-134-136
000-000-000
183-185-186
000-139-197
000-081-146
134-134-136
183-185-186
185-201-208
255-255-255
Text Bk D1
Color 6
Color 5
Color 4
Color 3
Color 2
Color 1
Text Bk D2
Text Bk L1
Text Bk L2
Hyper
F. Hyper
Text D2
Text L2
Agenda main
Agenda main 2nd
Safe Harbor Statement
This presentation contains statements which address such key issues as
AkzoNobel’s growth strategy, future financial results, market positions, product development, products in
the pipeline, and product approvals. Such statements should be carefully considered, and it should be
understood that many factors could cause forecasted and actual results to differ from these statements.
These factors include, but are not limited to, price fluctuations, currency fluctuations, developments in raw
material and personnel costs, pensions, physical and environmental risks, legal issues, and legislative,
fiscal, and other regulatory measures. Stated competitive positions are based on management estimates
supported by information provided by specialized external agencies. For a more comprehensive discussion
of the risk factors affecting our business please see our latest Annual Report, a copy of which can be found
on the company’s corporate website www.akzonobel.com.
19 Investor Update Q3 2015 results

20 Investor Update Q3 2015 results
Appendices
255-255-255
185-201-208
068-105-125
085-190-207
000-146-187
000-139-197
000-081-146
134-134-136
000-000-000
183-185-186
000-139-197
000-081-146
134-134-136
183-185-186
185-201-208
255-255-255
Text Bk D1
Color 6
Color 5
Color 4
Color 3
Color 2
Color 1
Text Bk D2
Text Bk L1
Text Bk L2
Hyper
F. Hyper
Text D2
Text L2
Agenda main
Agenda main 2nd
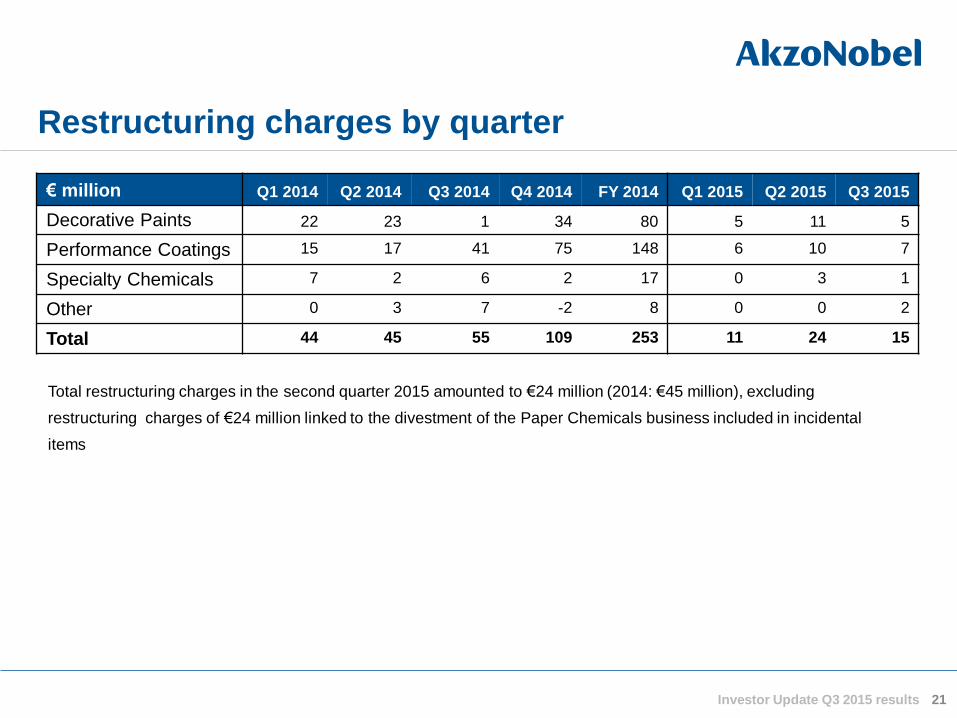
Restructuring charges by quarter
21
€ million Q1 2014 Q2 2014 Q3 2014 Q4 2014 FY 2014 Q1 2015 Q2 2015 Q3 2015
Decorative Paints 22 23 1 34 80 5 11 5
Performance Coatings 15 17 41 75 148 6 10 7
Specialty Chemicals 7 2 6 2 17 0 3 1
Other 0 3 7 -2 8 0 0 2
Total 44 45 55 109 253 11 24 15
Investor Update Q3 2015 results
Total restructuring charges in the second quarter 2015 amounted to €24 million (2014: €45 million), excluding
restructuring charges of €24 million linked to the divestment of the Paper Chemicals business included in incidental
items