aki riuttanen audio calibration tool development for …
TRANSCRIPT
Aki Riuttanen
AUDIO CALIBRATION TOOL DEVELOPMENT FOR JOT G3 FINAL TESTER
AUDIO CALIBRATION TOOL DEVELOPMENT FOR JOT G3 FINAL TESTER
Aki Riuttanen Thesis Spring 2015 Degree Programme in Information Technology Oulu University of Applied Sciences
3
ABSTRACT
Oulu University of Applied Sciences Degree Programme in Information Technology Author(s): Aki Riuttanen Title of the bachelor’s thesis: Audio Calibration Tool Development for JOT G3 Final Tester Supervisors: Tapio Marttila, Tuomas Piikivi, Eino Niemi Term and year of completion: Spring 2015 Number of pages: 51 + 4 The object of this Master’s thesis was to develop audio calibration tools, both hardware and software for JOT G3 Final Tester robot acoustic interfaces. The main target was to calibrate speaker frequency response to be able to produce flat frequency response. JOT Automation is one of the leading test automation solution providers companies in Finland, acts on four different continents. JOT G3 Final tester is an all-in-one test handler used for the production testing of final assembled hand held devices. This work was done between spring 2014 and 2015 at JOT Automation R&D office in Oulu. The work included specifying the needed features for hardware and software. A flow chart was created for describing the interaction between the operator, calibration hardware and software. The extra challenge was to develop a tool that could be used without a graphical user interface. As a result of this thesis, an audio calibration product specific part (test adapter) was designed to the JOT G3 Final Tester. PSP integrates a high precision microphone and sound source, an internal data acquisition card together with a PSP printed circuit board, developed during the thesis to the G3 Final Tester. The calibration software uses PSP PCB indication LEDs and pneumatic actuators to guide the operator during the calibration process. The calibration SW controls a DAQ card during measurements and stores the needed compensation values. An additional graphical user interface is provided to visualize measurement results and guide the operator but, it is not mandatory for the calibration execution. Preliminary results from the frequency response calibration are available. Hardware changes during thesis work prevented the execution of the final measurements. A verification plan and future development ideas are listed in their own chapter.
Keywords: Audio calibration, frequency response, production testing, audio verifications, mobile devices, handheld devices
4
PREFACE
This Master’s thesis was made for JOT Automation Oulu R&D center between spring 2014 and 2015. The aim of the thesis was to develop audio calibration tools for G3 Final Tester used for handheld devices production testing. The calibration tools developed during this thesis work will be used in future for G3 Final Tester calibrations both at JOT production and in customer premises. Other new learnings will be used as an input for new JOT G-tester family products. Eino Niemi, senior lecturer from School of Engineering and Natural Resources, acted as supervisor from the Oulu University of Applied Sciences. Tapio Marttila, application specialist and Tuomas Piikivi, SW architect and G3 Final Tester program manager supervised and guided the thesis work from JOT Automation’s side. I would like to thank all my supervisors for good advice related to thesis work, helping to re-adjust goals during this journey and keeping the target setting clear all the way to the finalization of the thesis. I have also received a great deal of help and support from other colleagues from JOT Automation and I would like to mention a few names from this group. Rami Rahikkala SW designer, Mika Madetoja senior HW designer, Marko Pahikkala HW designer, Markku Koskela senior mechanics designer and last but not least my line manager and G3 Final Tester product owner Tuomas Nieminen. They all have given the best possible support during this thesis development work. All above mentioned colleagues together with Tapio and Tuomas have shared a lot of their valuable time during challenging times to help me to understand the root causes of unexpected behaviors. They gave me numerous improvement ideas, helped to evaluate new proposals and eventually enabled all the design changes needed. The hard work and our uncompromising attitude as a team made it possible to create the final product which we all can be proud of. Finally, I would like to give my warmest and biggest thanks to my wife Sari who has kept things rolling at home during my studies and has been very patient and supportive during my absences. I would also like to thank my son Leo, who has been wondering where daddy is in so many late evenings. I’m looking forward to spend more time with the ones who mean the world to me. Oulu, Finland, May 2015 Aki Riuttanen
5
CONTENTS
ABSTRACT 3
PREFACE 4
CONTENTS 5
1 INTRODUCTION 8
1.1 Overview 8
1.2 JOT Automation 8
1.3 JOT G3 Final Tester 8
1.4 Theory of audio measurements 9
1.4.1 Characteristics of the sine wave 9
1.4.2 Sound pressure 11
1.4.3 Relation between different units 12
1.4.4 Frequency weighting 13
1.5 Audio testing in production 14
1.6 Why audio calibration is needed 15
2 INTRODUCTION TO G3 FINAL TESTER 16
2.1 Overview of G3 Final Tester 16
2.2 Test features of G3 Final Tester robot assembly 17
2.3 Customer and product specific parts of G3 Final Tester 18
2.4 Instrument drawer of G3 Final Tester 20
2.5 Audio signal routing of G3 Final Tester 21
3 AUDIO CALIBRATION STATUS OF THE G3 FINAL TESTER BEFORE THE
THESIS 23
3.1 Old calibration procedure 23
3.1.1 Old microphone calibration method 23
3.1.2 Old speaker calibration method 23
3.2 Feedback from old calibration methods 24
3.3 Plan for a new calibration procedure 24
4 G3 FINAL TESTER CALIBRATION HARDWARE 26
4.1 Calibration hardware 26
4.1.1 Calibration PSP printed circuit board 26
4.1.2 Calibration PSP mechanics 27
6
4.1.3 G3 Final Tester reference sound source adapter 28
4.2 Calibration software 30
4.3 Calibration flow 32
4.4 Calibration output values and how to use them 32
5 MEASUREMENT RESULTS 34
5.1 Reference microphone measurements 34
5.2 Robot microphone measurements 35
5.3 Robot speaker measurements 39
5.3.1 Robot speaker frequency response calibration 39
5.3.2 Robot speaker frequency response calibration repeatability study 40
6 FUTURE DEVELOPMENT 43
6.1 General development plans 43
6.2 Future plans for a robot microphone gain calibration 43
6.3 Future plans for a robot speaker gain calibration 44
6.4 Future plans for robot speaker frequency response measurements 45
6.4.1 Final verification for a speaker frequency response calibration 45
6.4.2 Future improvements for a speaker frequency response calibration 45
7 CONCLUSIONS 47
REFERENCES 50
APPENDICES 52
7
TERMS AND ABBREVIATIONS
AC Alternating Current
API Application Programming Interface
C# C sharp Programming Language
DAQ Data Acquisition
DUT Device Under Test
GUI Graphical User Interface
IHF Integrated Hands Free
NI-DAQ National Instruments Data Acquisition instrument
Pa Pascal, Pressure unit
PCB Printed Circuit Board
PSP Product Specific Part (G3 adapter for DUT interfaces)
RF Radio Frequency
RMS Root Mean Square, effective value of AC signal
SPL Sound Pressure Level
THD Total Harmonic Distortion
THD+N Total Harmonic Distortion plus Noise
Vp Voltage, Amplitude Peak
Vpp Voltage, Peak-to-Peak
Vrms Voltage, Root Mean Square
8
1 INTRODUCTION
1.1 Overview
The main purpose of this thesis work was to develop acoustic calibration tools
including both hardware and software for JOT G3 Final Tester microphone
(artificial ear) and speaker (artificial mouth). A new tool planned to be compatible
with JOT Automation production as well as enable the recalibration by customers
on the field. As a side project it was also agreed to execute typical audio
performance measurements for JOT G3 Final Tester and provide an outcome as
an input for product data sheets. The third purpose of this thesis was to provide
more detailed information for the JOT G3 Final Tester audio documentation. The
initial thought was to provide an application note, a reference manual type of
documentation from the JOT G3 Final Tester audio measurements to help
customers to integrate JOT G3 Final Tester to their test systems.
1.2 JOT Automation
JOT Automation was founded in 1988 to support the growth of mobile telecom
industry. Currently JOT Automation provides production and test solutions for a
wide variety of customer industries including telecom, automotive and healthcare.
The main products are automated product handlers and testing equipment. JOT
Automation operates on four continents, employing in excess of 300 people in 13
countries providing a global support for hundreds of manufacturing facilities
around the globe. (1)
1.3 JOT G3 Final Tester
JOT G3 Final Tester is designed to be an all-in-one type test handler, which
enables several types of tests in the production environment for final assembled
handheld devices in a single test box. This reduces the operator handling time and
thus increases productivity. On the other hand, this means that the tester cannot
provide an ideal environment for all type of tests, which leads to compromises e.g.
in audio and RF testing environments.
9
1.4 Theory of audio measurements
Sound is a vibration or a series of vibrations that move through the air, like ripples
(waves) in the water if you throw a stone in it. Sound source is anything which
causes air particles to move to the same direction with the sound wave and
generates a vibration within our hearing range. Human hearing range covers 20
Hz to 20 kHz with high end being very age dependent, about 20 kHz at 15 years
and falling roughly by 1 Hz/day so that 2–4 kHz would be quite typical at 70 years
(2, Ch.1.4.2.1).
1.4.1 Characteristics of the sine wave
Microphones can be used to convert acoustic energy to electrical energy and
speakers can be used to convert electrical energy back to acoustic energy. A pure
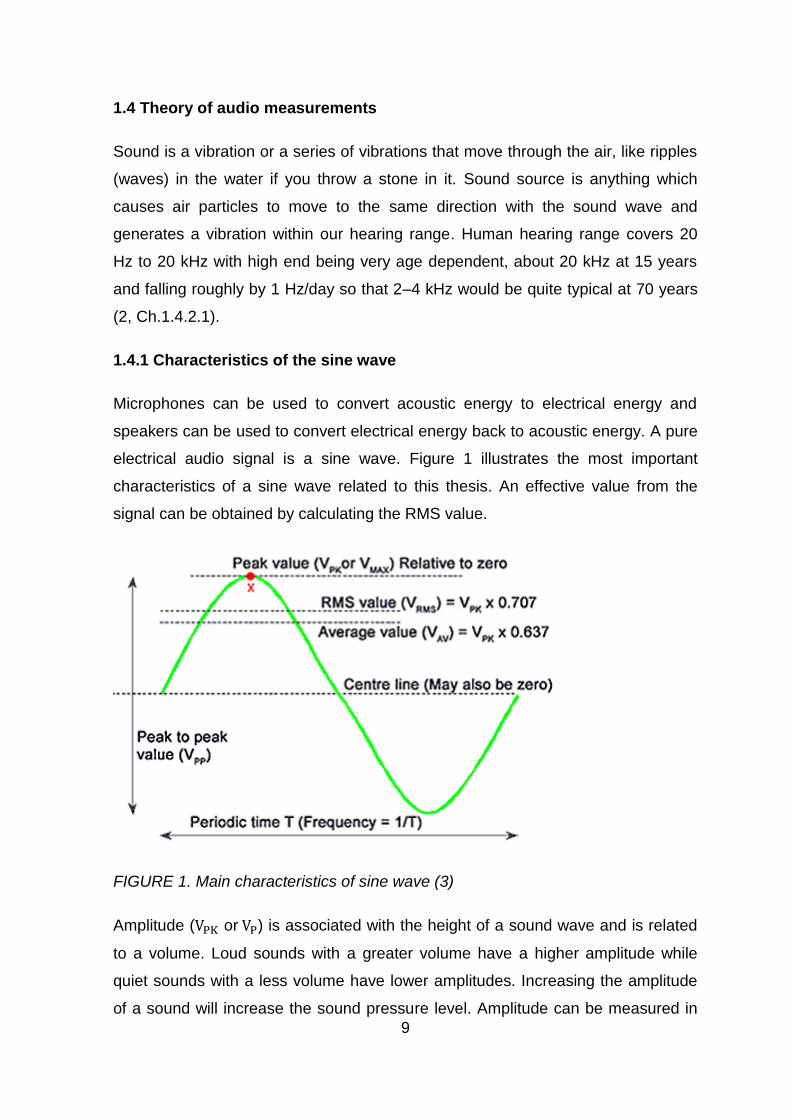
electrical audio signal is a sine wave. Figure 1 illustrates the most important
characteristics of a sine wave related to this thesis. An effective value from the
signal can be obtained by calculating the RMS value.
FIGURE 1. Main characteristics of sine wave (3)
Amplitude (VPK or VP) is associated with the height of a sound wave and is related
to a volume. Loud sounds with a greater volume have a higher amplitude while
quiet sounds with a less volume have lower amplitudes. Increasing the amplitude
of a sound will increase the sound pressure level. Amplitude can be measured in
10
decibels (dB). Most people can recognize about 3 dB change in the amplitude. (4,
Ch.1.)
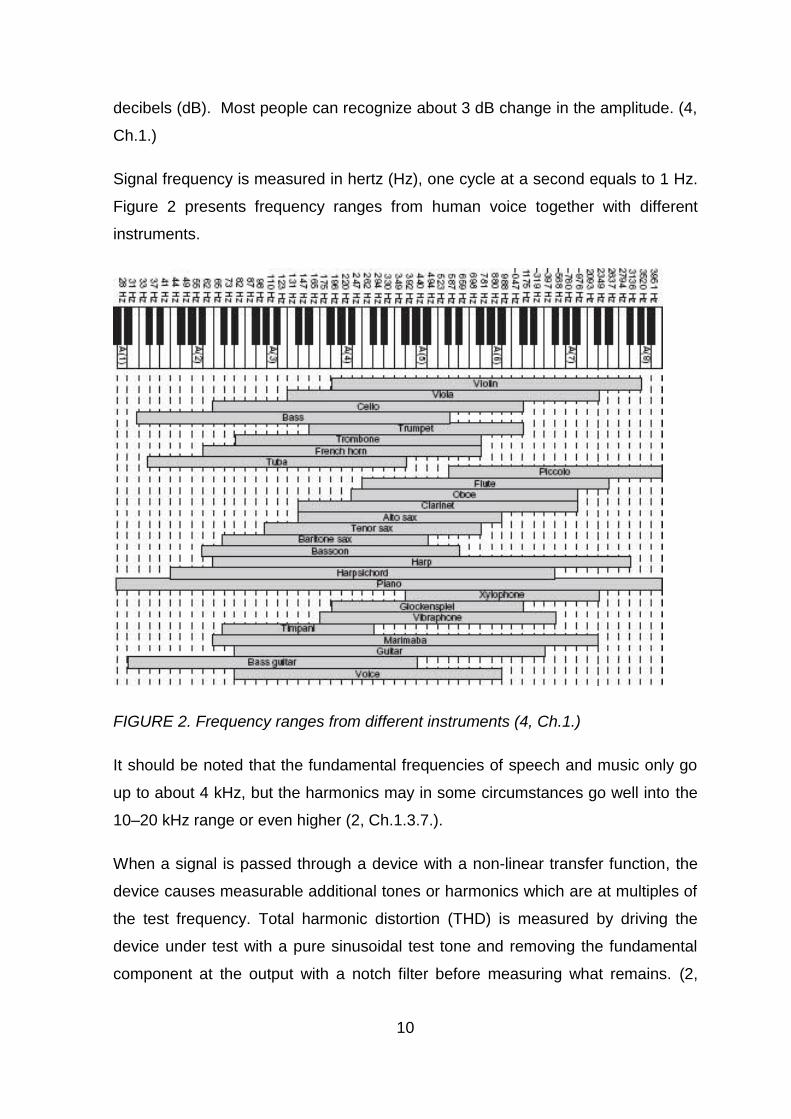
Signal frequency is measured in hertz (Hz), one cycle at a second equals to 1 Hz.
Figure 2 presents frequency ranges from human voice together with different
instruments.
FIGURE 2. Frequency ranges from different instruments (4, Ch.1.)
It should be noted that the fundamental frequencies of speech and music only go
up to about 4 kHz, but the harmonics may in some circumstances go well into the
10–20 kHz range or even higher (2, Ch.1.3.7.).
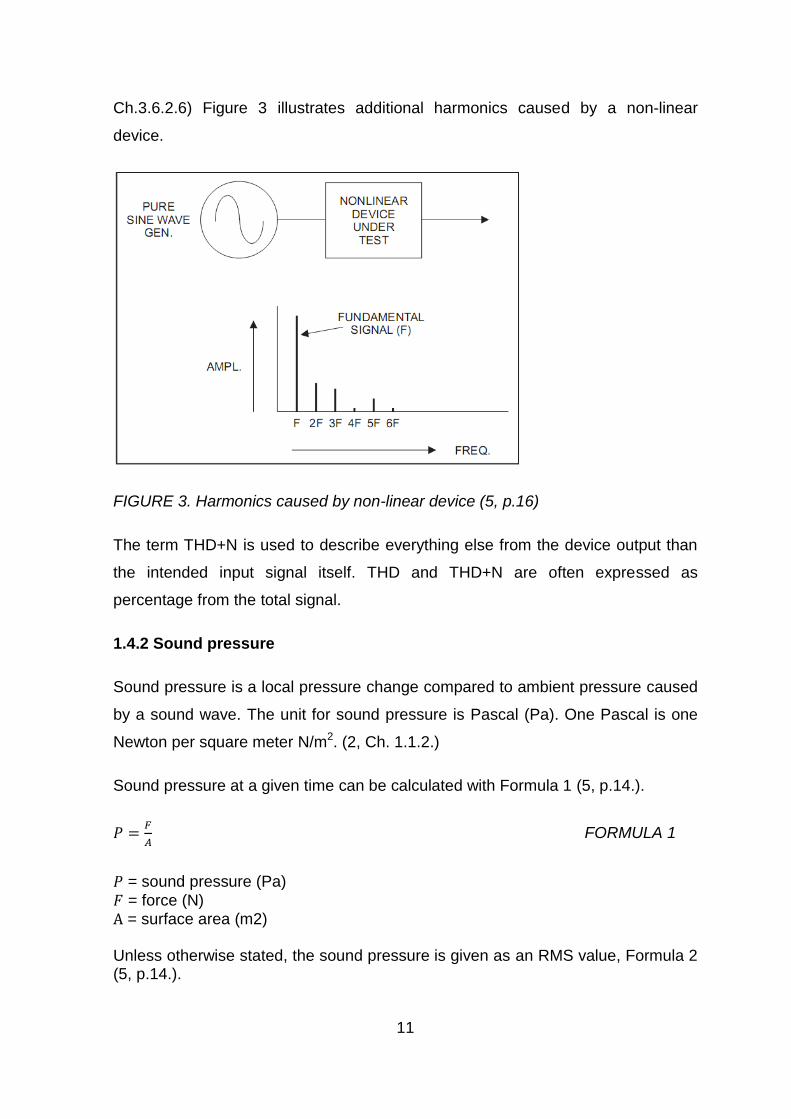
When a signal is passed through a device with a non-linear transfer function, the
device causes measurable additional tones or harmonics which are at multiples of
the test frequency. Total harmonic distortion (THD) is measured by driving the
device under test with a pure sinusoidal test tone and removing the fundamental
component at the output with a notch filter before measuring what remains. (2,
11
Ch.3.6.2.6) Figure 3 illustrates additional harmonics caused by a non-linear
device.
FIGURE 3. Harmonics caused by non-linear device (5, p.16)
The term THD+N is used to describe everything else from the device output than
the intended input signal itself. THD and THD+N are often expressed as
percentage from the total signal.
1.4.2 Sound pressure
Sound pressure is a local pressure change compared to ambient pressure caused
by a sound wave. The unit for sound pressure is Pascal (Pa). One Pascal is one
Newton per square meter N/m2. (2, Ch. 1.1.2.)
Sound pressure at a given time can be calculated with Formula 1 (5, p.14.).
𝑃 =𝐹
𝐴 FORMULA 1
𝑃 = sound pressure (Pa)
𝐹 = force (N) A = surface area (m2) Unless otherwise stated, the sound pressure is given as an RMS value, Formula 2 (5, p.14.).
12
𝑃𝑟𝑚𝑠 =𝑃
√2 FORMULA 2
𝑃 = sound pressure at given time
Sound-wave pressures fall in the range from 0.00002 Pa to around 200 Pa.
0.00002 Pa corresponds approximately to the pressure required to create an
audible sensation in the average human ear at its most sensitive frequency. 200
Pa is around the pain threshold. (2, Ch. 1.3.1.)
Sound pressure level is convenient to be expressed as a logarithmic decibel scale
related to the lowest human hearable sound, Formula 3 (6).
𝐿𝑝 = 10 𝑙𝑜𝑔10 (𝑃𝑟𝑚𝑠
2
𝑃𝑟𝑒𝑓2 ) = 20 𝑙𝑜𝑔10 (
𝑃𝑟𝑚𝑠
𝑃𝑟𝑒𝑓) 𝑑𝐵 = 𝑑𝐵 𝑆𝑃𝐿 FORMULA 3
𝐿𝑝= sound pressure level (dB)
𝑃𝑟𝑚𝑠 = sound pressure (Pa) 𝑃𝑟𝑒𝑓 = reference sound pressure 20 (µPa)
1.4.3 Relation between different units
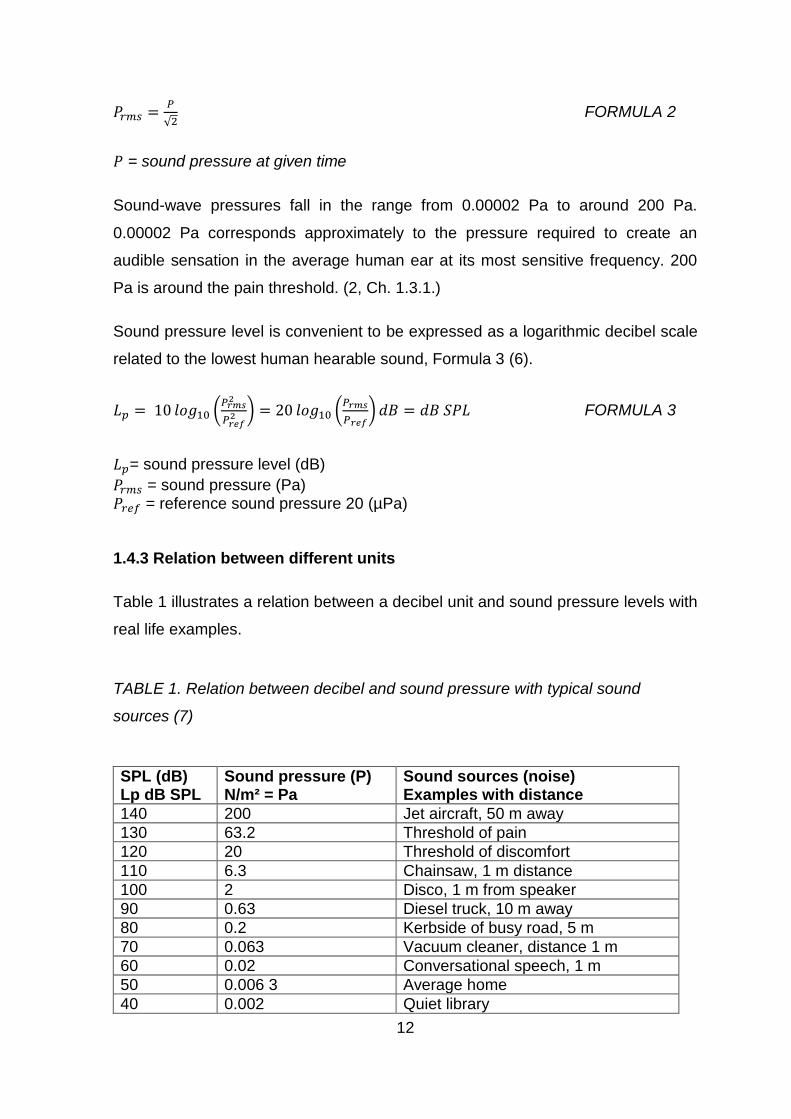
Table 1 illustrates a relation between a decibel unit and sound pressure levels with
real life examples.
TABLE 1. Relation between decibel and sound pressure with typical sound
sources (7)
SPL (dB) Lp dB SPL
Sound pressure (P) N/m² = Pa
Sound sources (noise) Examples with distance
140 200 Jet aircraft, 50 m away
130 63.2 Threshold of pain
120 20 Threshold of discomfort
110 6.3 Chainsaw, 1 m distance
100 2 Disco, 1 m from speaker
90 0.63 Diesel truck, 10 m away
80 0.2 Kerbside of busy road, 5 m
70 0.063 Vacuum cleaner, distance 1 m
60 0.02 Conversational speech, 1 m
50 0.006 3 Average home
40 0.002 Quiet library
13
30 0.000 63 Quiet bedroom at night
20 0.000 2 Background in TV studio
10 0.000 063 Rustling leaves in the distance
0 0.000 02 Hearing threshold
International standards have established 1 pascal (Pa) as 94 dB SPL (sound
pressure level) in 1 kHz. This reference point is used for specifying the sensitivity
of microphones.
When sound pressure is doubled, the sound pressure level (dB SPL) rises by 3
decibels. Likewise, doubling the power equals to 3 dB increase in the power level.
A two times higher voltage is seen as 6dB rise in the voltage level. (8, p.29.)
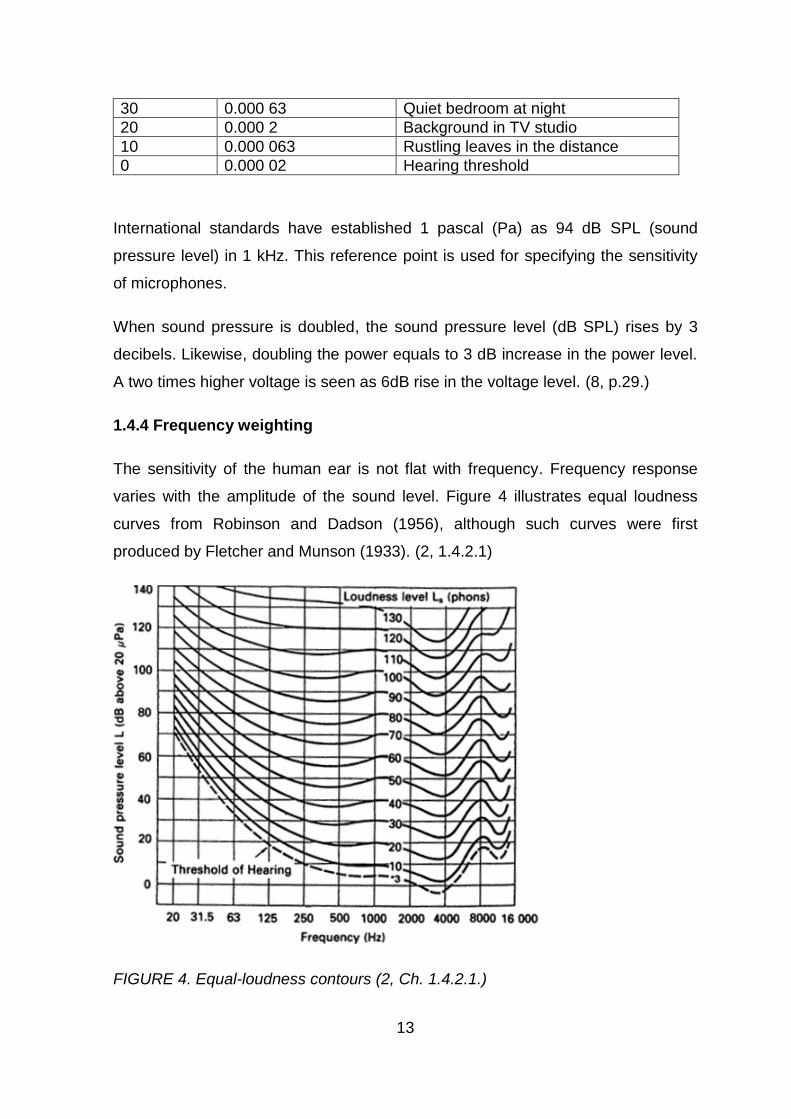
1.4.4 Frequency weighting
The sensitivity of the human ear is not flat with frequency. Frequency response
varies with the amplitude of the sound level. Figure 4 illustrates equal loudness
curves from Robinson and Dadson (1956), although such curves were first
produced by Fletcher and Munson (1933). (2, 1.4.2.1)
FIGURE 4. Equal-loudness contours (2, Ch. 1.4.2.1.)
14
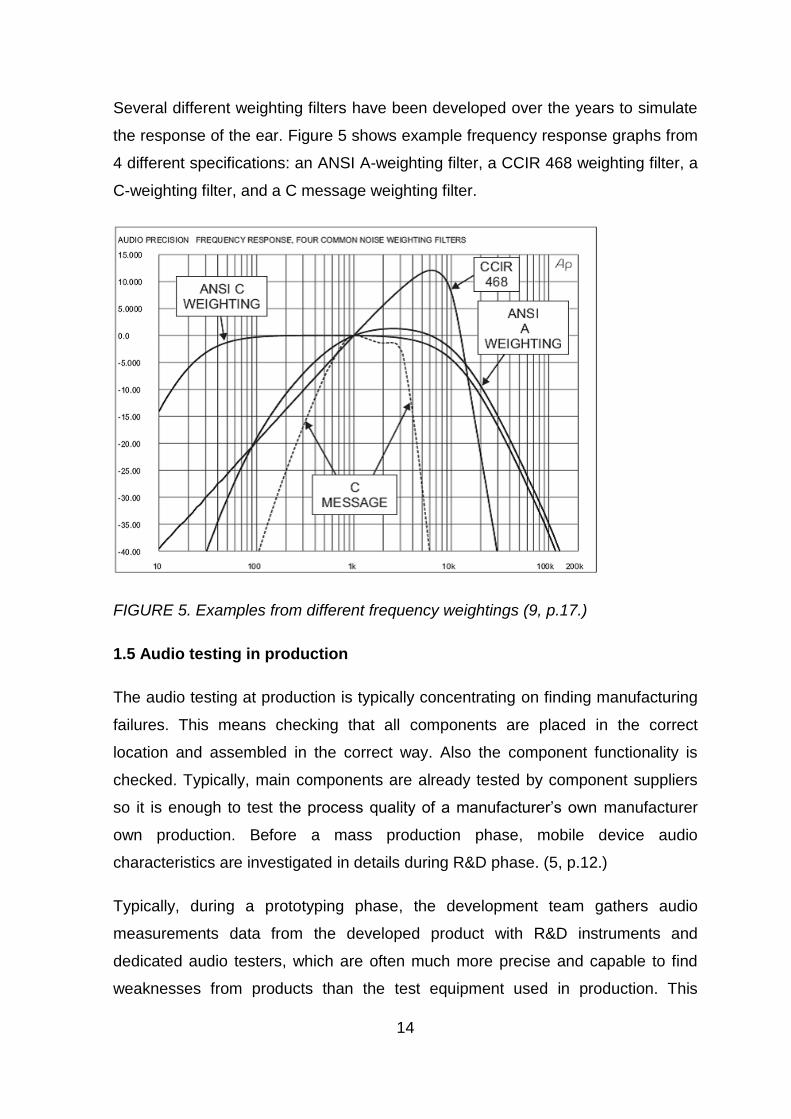
Several different weighting filters have been developed over the years to simulate
the response of the ear. Figure 5 shows example frequency response graphs from
4 different specifications: an ANSI A-weighting filter, a CCIR 468 weighting filter, a
C-weighting filter, and a C message weighting filter.
FIGURE 5. Examples from different frequency weightings (9, p.17.)
1.5 Audio testing in production
The audio testing at production is typically concentrating on finding manufacturing
failures. This means checking that all components are placed in the correct
location and assembled in the correct way. Also the component functionality is
checked. Typically, main components are already tested by component suppliers
so it is enough to test the process quality of a manufacturer’s own manufacturer
own production. Before a mass production phase, mobile device audio
characteristics are investigated in details during R&D phase. (5, p.12.)
Typically, during a prototyping phase, the development team gathers audio
measurements data from the developed product with R&D instruments and
dedicated audio testers, which are often much more precise and capable to find
weaknesses from products than the test equipment used in production. This
15
information is then used to define critical measurements which are verified with
prototype series. Finally, only a minimum set of the most effective measurements
to catch possible process failures are used in the mass production phase.
1.6 Why audio calibration is needed
The tolerance from a component such as a speaker, an amplifier or a signal cable
causes a variation in the audio signal path. It is as seen as unexpected outcome
from the signal path. Calibration is done to equalize the measurements between
different JOT G3 Final Testers. The audio paths in G3 are complex due to the all-
in-one type of structure and this increases the need for compensation. More
information from JOT G3 Final Tester signal routing can be found in chapter 2.5.
Calibration is carried out with the known accurate microphone or sound source to
be able to measure a signal response through the whole signal path. Based on the
measured offset, the compensation values are used to compensate the signal path
losses. Depending on the implementation, the compensation can be done in
different ways. In JOT G3 Final Tester the sensitivity of microphone and speaker
amplifiers can be adjusted by changing the amplifier gain with a software
controllable potentiometer to compensate losses in the signal path. The speaker
frequency compensation on the other hand is done only with a software by
compensating a DAQ card input to produce a flat response from the speaker
output.
16
2 INTRODUCTION TO G3 FINAL TESTER
2.1 Overview of G3 Final Tester
JOT G3 Final Tester is an automated all-in-one test solution for the production
testing of electronic handheld devices. JOT G3 Final Tester supports the testing of
mechanical, RF, electrical, audio and visual interfaces of mobile devices. JOT G3
Final tester includes a microphone (artificial ear) and a speaker (artificial mouth)
for the audio interface testing of a device under test, later DUT. Both input and
output signals are routed via a National Instruments digital acquisition card, which
can be controlled either by a JOT G3 Final Tester on-board computer or a test
system computer.
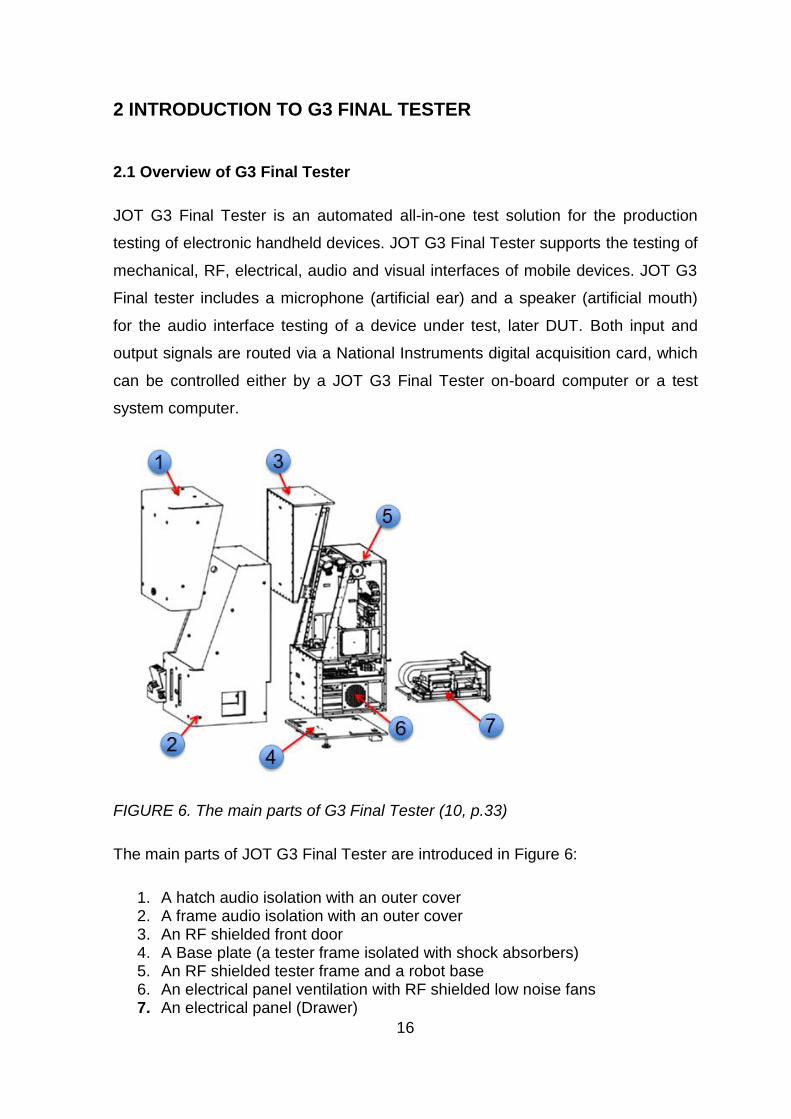
FIGURE 6. The main parts of G3 Final Tester (10, p.33)
The main parts of JOT G3 Final Tester are introduced in Figure 6:
1. A hatch audio isolation with an outer cover 2. A frame audio isolation with an outer cover 3. An RF shielded front door 4. A Base plate (a tester frame isolated with shock absorbers) 5. An RF shielded tester frame and a robot base 6. An electrical panel ventilation with RF shielded low noise fans 7. An electrical panel (Drawer)
17
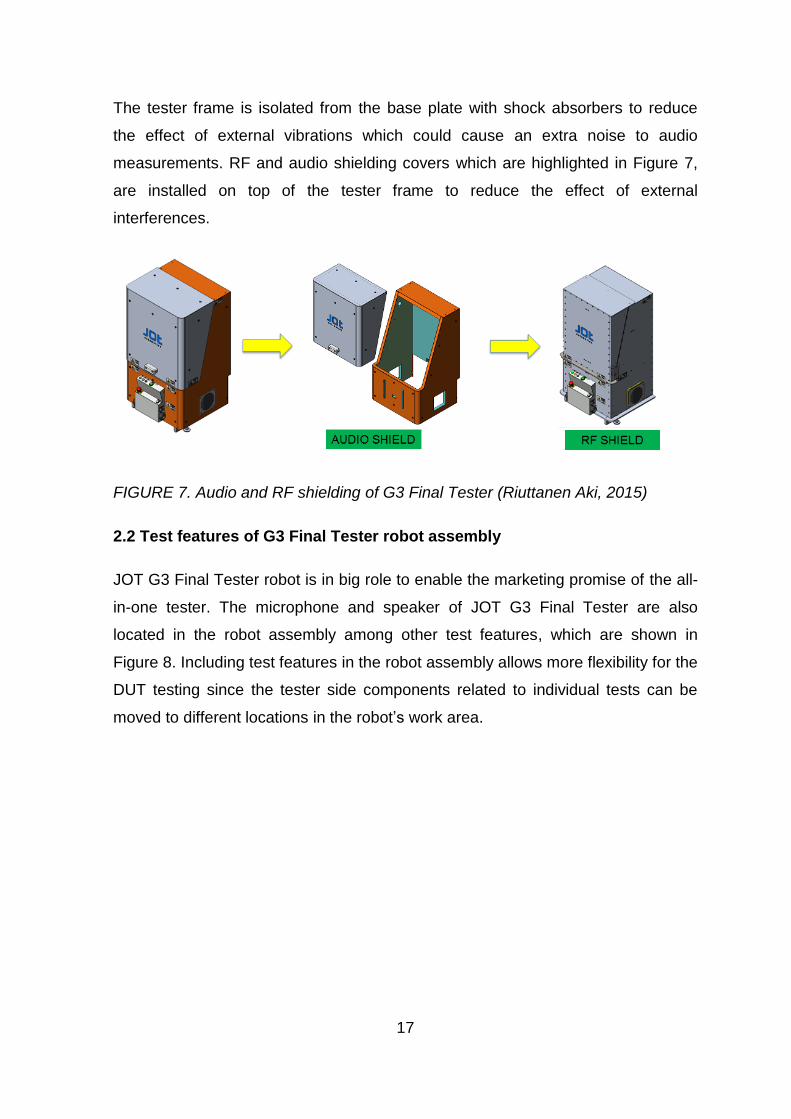
The tester frame is isolated from the base plate with shock absorbers to reduce
the effect of external vibrations which could cause an extra noise to audio
measurements. RF and audio shielding covers which are highlighted in Figure 7,
are installed on top of the tester frame to reduce the effect of external
interferences.
FIGURE 7. Audio and RF shielding of G3 Final Tester (Riuttanen Aki, 2015)
2.2 Test features of G3 Final Tester robot assembly
JOT G3 Final Tester robot is in big role to enable the marketing promise of the all-
in-one tester. The microphone and speaker of JOT G3 Final Tester are also
located in the robot assembly among other test features, which are shown in
Figure 8. Including test features in the robot assembly allows more flexibility for the
DUT testing since the tester side components related to individual tests can be
moved to different locations in the robot’s work area.

18
FIGURE 8. Testing features of JOT G3 Final Tester robot (10, p.48)
Testing features of JOT G3 Final Tester robot are shown in Figure 8:
1. An ambient light source (moves on X-Y direction) 2. A robot Z-axis with a changeable fingertip (moves on X-Y-Z directions) 3. A microphone (artificial ear) for the DUT loudspeaker testing (moves on X-
Y-Z directions) 4. A light-cube for the DUT front-camera testing (moves on X-Y-Z directions) 5. A speaker (artificial mouth) for the DUT microphone testing (moves on X
direction) 6. A Z-axis processor card for controlling robot test features
2.3 Customer and product specific parts of G3 Final Tester
DUT in JOT G3 Final Tester is located under the robot on top of a product specific
adapter sometimes also called as a test jig. The test adapter consists of a
customer specific part (CSP), which has interfaces shared on all products with a
specific customer, and a product specific part (PSP), which has interfaces which
may vary between different products.

19
FIGURE 9. Customer (CSP) and product specific parts (PSP) interfaces of G3
Final Tester (10, p.52)
JOT G3 Final Tester electrical adaptation boards related to a product specific
adapter are shown in Figure 9:
1. A mechanics part of the adapter 2. A product specific PCB 3. A customer specific PCB 4. The main connector board with a processor board controlling CSP and PSP
test features
Motherboard is the same in all JOT G3 Final Testers with a standard interface to a
CSP board which can be varied between different customers. From CSP there is
again a standard interface towards a PSP board which can be different for all
customer device types. In many cases also the PSP PCB can be shared with
multiple device types and there are differences between adapters only at the PSP
mechanics and test applications connected to the PSP PCB.
20
Most electrical interfaces from JOT G3 Final Tester to DUT are routed thru a
motherboard, a CSP and PSP printed circuit boards which are located below the
robot’s work area and above the instrument drawer. The control of PSP features is
done with a motherboard processor card. Additionally, the PSP usually also
includes pneumatic valves and RF connections which can also be controlled by
the motherboard processor card. The test features located at the robot assembly
are controlled by a Z-axis processor card.
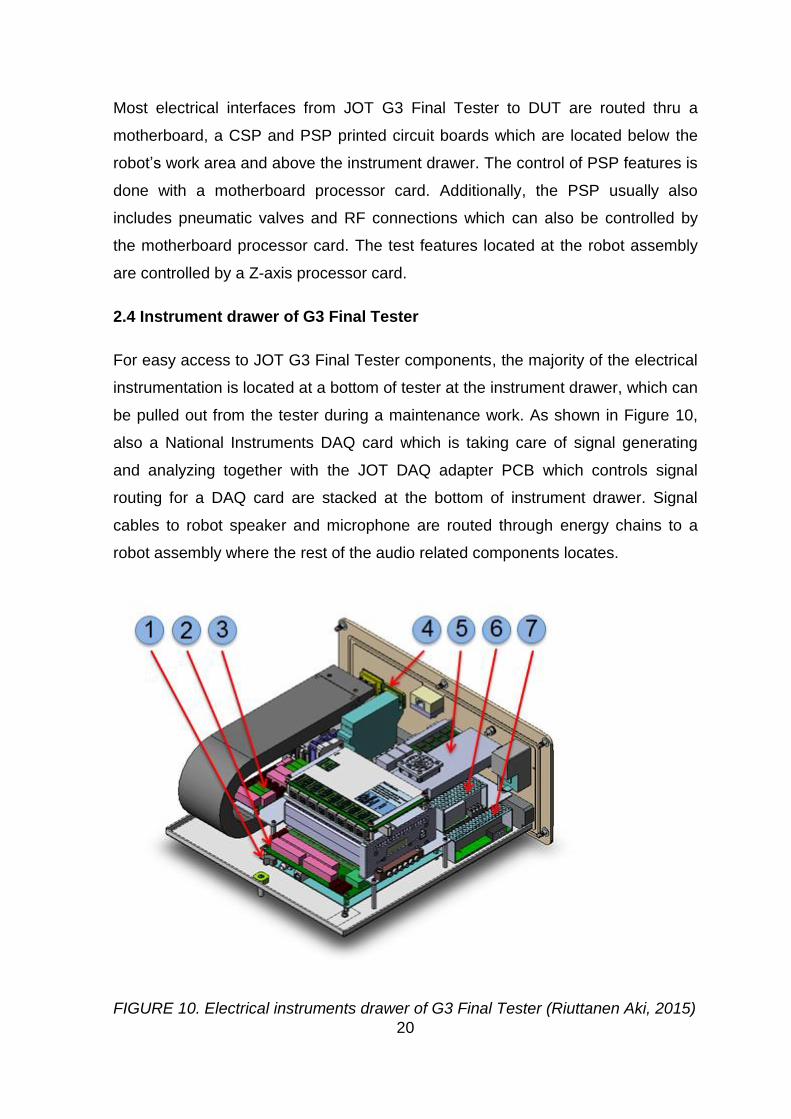
2.4 Instrument drawer of G3 Final Tester
For easy access to JOT G3 Final Tester components, the majority of the electrical
instrumentation is located at a bottom of tester at the instrument drawer, which can
be pulled out from the tester during a maintenance work. As shown in Figure 10,
also a National Instruments DAQ card which is taking care of signal generating
and analyzing together with the JOT DAQ adapter PCB which controls signal
routing for a DAQ card are stacked at the bottom of instrument drawer. Signal
cables to robot speaker and microphone are routed through energy chains to a
robot assembly where the rest of the audio related components locates.
FIGURE 10. Electrical instruments drawer of G3 Final Tester (Riuttanen Aki, 2015)
21
The main components of JOT G3 Final Tester related to audio measurements
inside electrical instruments drawer are follows:
1. A National Instruments data acquisition card (USB-6361) 2. A JOT DAQ adapter PCB (for signal route switching and filtering) 3. A JOT Power Lines Divider PCB 4. An optional USB connection to the DAQ card for a test system PC 5. A G3 Final Tester on board computer 6. A power supply 12 V 7. A power supply 24 V
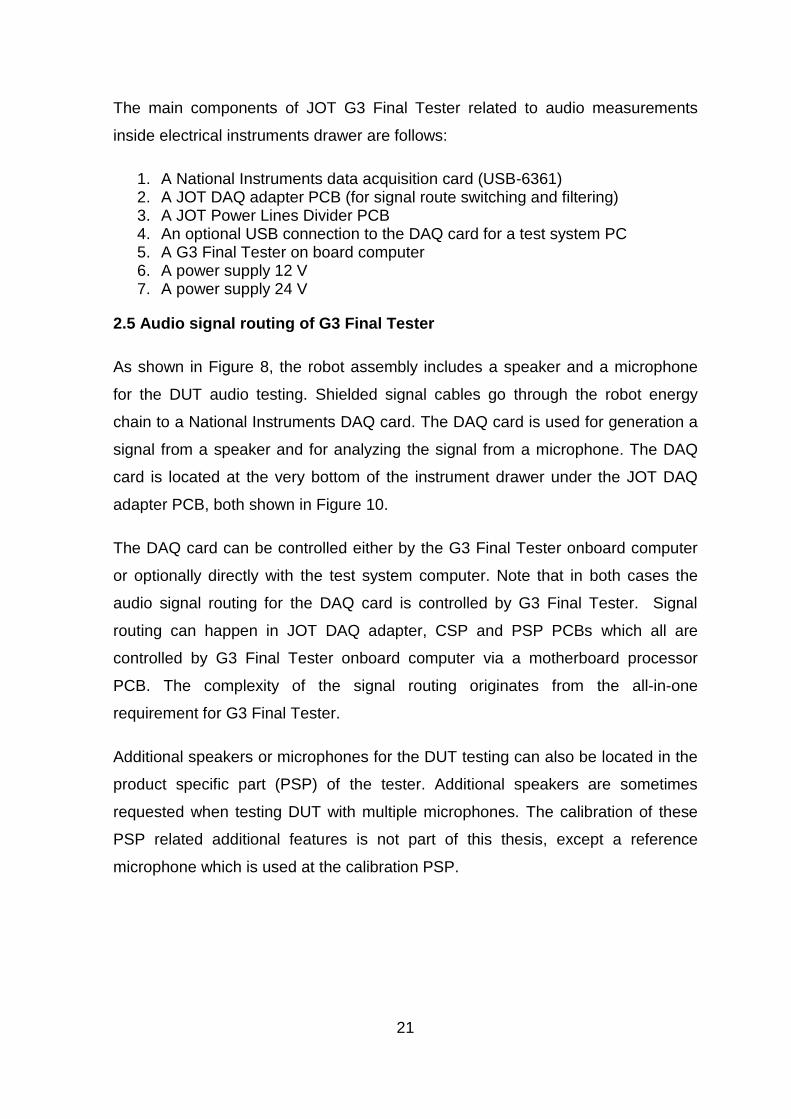
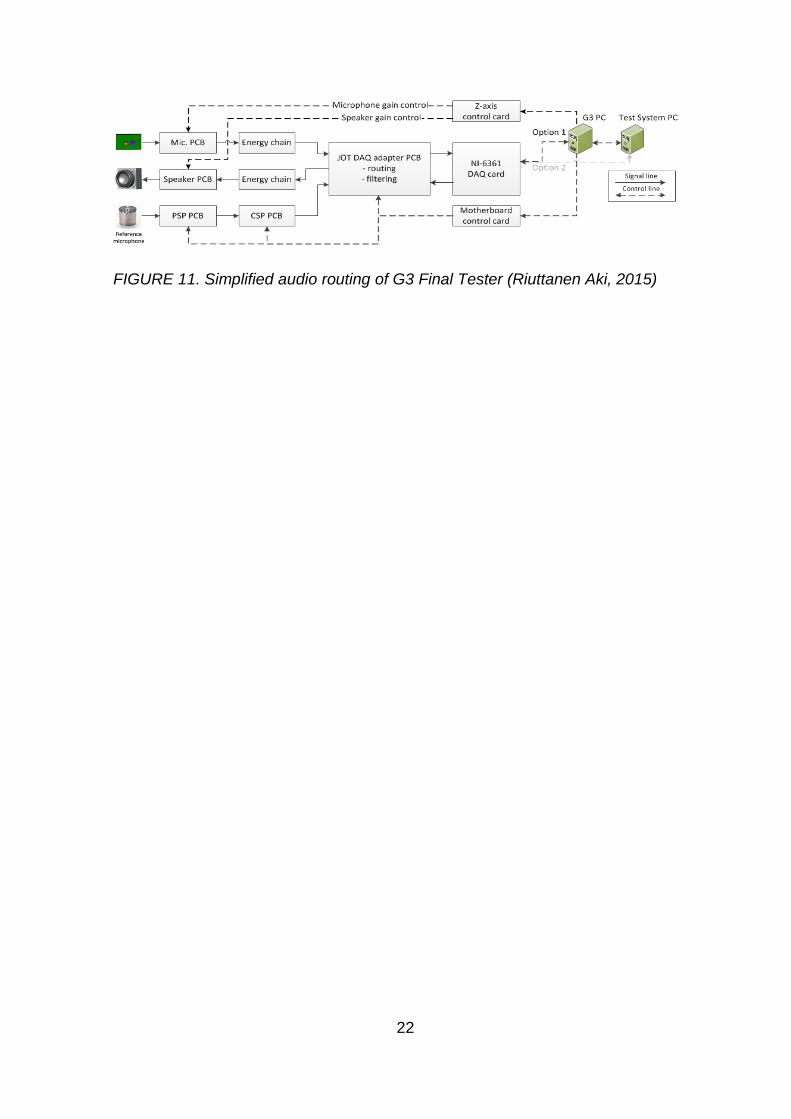
2.5 Audio signal routing of G3 Final Tester
As shown in Figure 8, the robot assembly includes a speaker and a microphone
for the DUT audio testing. Shielded signal cables go through the robot energy
chain to a National Instruments DAQ card. The DAQ card is used for generation a
signal from a speaker and for analyzing the signal from a microphone. The DAQ
card is located at the very bottom of the instrument drawer under the JOT DAQ
adapter PCB, both shown in Figure 10.
The DAQ card can be controlled either by the G3 Final Tester onboard computer
or optionally directly with the test system computer. Note that in both cases the
audio signal routing for the DAQ card is controlled by G3 Final Tester. Signal
routing can happen in JOT DAQ adapter, CSP and PSP PCBs which all are
controlled by G3 Final Tester onboard computer via a motherboard processor
PCB. The complexity of the signal routing originates from the all-in-one
requirement for G3 Final Tester.
Additional speakers or microphones for the DUT testing can also be located in the
product specific part (PSP) of the tester. Additional speakers are sometimes
requested when testing DUT with multiple microphones. The calibration of these
PSP related additional features is not part of this thesis, except a reference
microphone which is used at the calibration PSP.
22
FIGURE 11. Simplified audio routing of G3 Final Tester (Riuttanen Aki, 2015)
23
3 AUDIO CALIBRATION STATUS OF THE G3 FINAL TESTER
BEFORE THE THESIS
Earlier, audio calibrations of JOT G3 Final Tester consisted of a single point gain
calibration for a robot microphone and a speaker. Electrical and acoustic self-tests
for both the microphone and the speaker are performed during a manufacturing
verification phase. The self-diagnostic PSP of JOT G3 Final Tester, which includes
its own microphone and speaker, is in use for signal routing during the production
testing of JOT G3 Final Tester.
3.1 Old calibration procedure
The gain for the microphone and speaker amplifier is adjusted during the audio
calibration for a 1 kHz single frequency. The gain setting is done against a known
sound source (B&K Sound Calibrator Type 4231) to achieve the wanted sensitivity
level. The gain is adjusted by a software adjustable hardware potentiometer, the
actual value being stored to a registry of the potentiometer.
3.1.1 Old microphone calibration method
A B&K sound source with a 1 kHz 94 dB SPL signal produces a reference signal
for the microphone. The gain for the microphone amplifier is adjusted to produce
the output response as close as possible to 400 mV (RMS). Audio levels for other
frequencies are not compensated.
3.1.2 Old speaker calibration method
The artificial mouth calibration method of JOT G3 Final Tester was based on a
self-diagnostic PSP calibrated with a B&K sound source with a 1 kHz 94 dB SPL
signal and a National Instruments Test Stand sequence. The speaker gain is
adjusted to the produce at the same output level with a 1 kHz and 100 mV (RMS)
input signal as the reference level stored to a diagnostic adapter memory.
24
3.2 Feedback from old calibration methods
Especially, a speaker sound pressure level (SPL) calibration over several
frequencies was requested to enable the tester to produce a flat frequency
response over requested SPL levels.
Often customers used their own method, usually a so called golden unit (a known
good sample device from the mean of deviation) method to compare the results
between good and bad units and to set production limits based on those
measurements. Speaker output levels were balanced by requesting different
output voltages from DAQ cards until the response from the golden unit was in line
with the reference tester.
3.3 Plan for a new calibration procedure
Based on feedback from the evaluation testers delivered to customers and JOT
internal measurements, it was proven that more robust adjustments were needed
in JOT G3 Final Tester production to prove a sufficient acoustic performance.
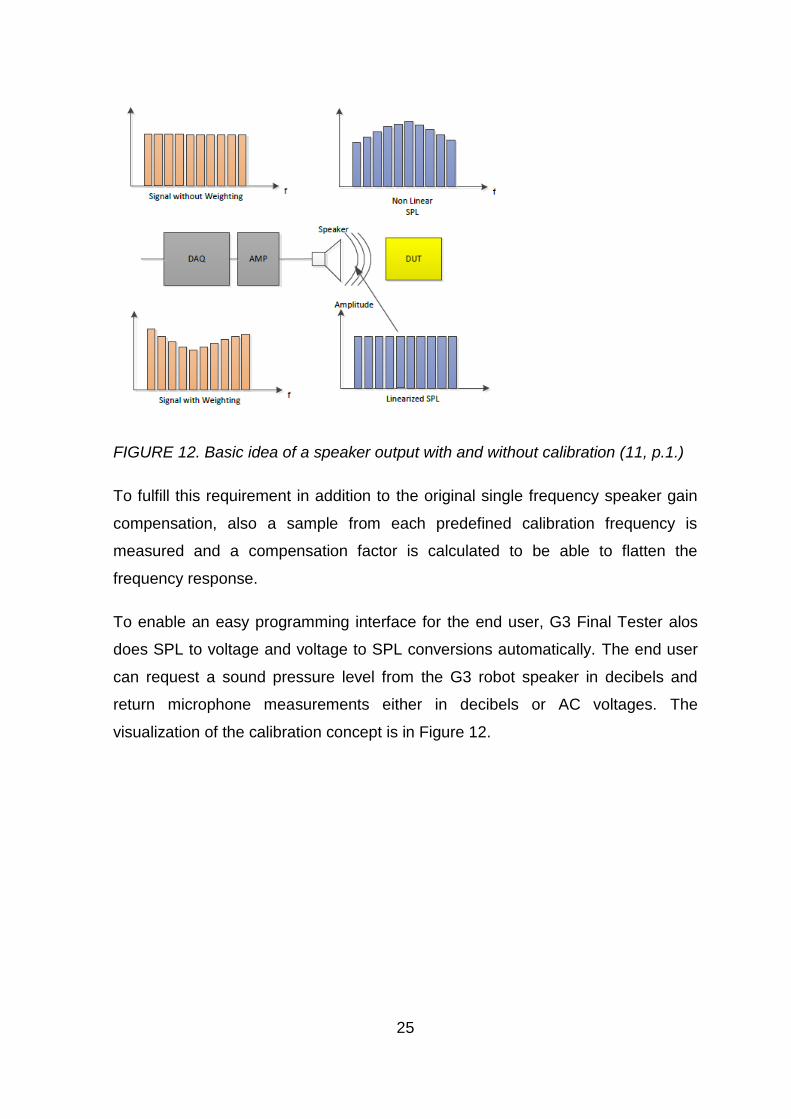
Below is a robot speaker SPL calibration definition from the JOT G3 Final Tester
audio calibration specification: “Level of each Tone frequency from DAQ is
selected so that acoustic output (SPL) from JOT G3 system speaker is constant in
DUT microphone position. Correction values for DAQ are defined in G3 tester.”
(11, p.1.)
25
FIGURE 12. Basic idea of a speaker output with and without calibration (11, p.1.)
To fulfill this requirement in addition to the original single frequency speaker gain
compensation, also a sample from each predefined calibration frequency is
measured and a compensation factor is calculated to be able to flatten the
frequency response.
To enable an easy programming interface for the end user, G3 Final Tester alos
does SPL to voltage and voltage to SPL conversions automatically. The end user
can request a sound pressure level from the G3 robot speaker in decibels and
return microphone measurements either in decibels or AC voltages. The
visualization of the calibration concept is in Figure 12.
26
4 G3 FINAL TESTER CALIBRATION HARDWARE
4.1 Calibration hardware
Calibration hardware is a product specific adapter which has a place for a sound
source (Brüel & Kjaer Sound Calibrator Type 4231), a high-precision condenser
microphone (G.R.A.S. MIC 40AG) and a pre-amplifier (G.R.A.S. Preamplifier Type
26AM). The reference sound source and microphone selection was done based
on the earlier good experiences at JOT Automation.
The selected sound source conforms to the EN/IEC 60942 (2003) Class LS and
Class 1, and ANSI S1.40–2006 which means it is classified for the calibration of
sound level meters and other sound measurement equipment in laboratory
environments. According to the data sheet a sound source is capable to produce a
1 kHz (±0.1%) signal with sound pressure levels 94.0 dB (±0.2 dB principal SPL)
or 114.0 dB (±0.2 dB re 20µPa at reference conditions). (12, p.1.)
The selected reference microphone and preamplifiers are designed for laboratory
and production environments. The frequency accuracy for a reference microphone
is ±1 dB from 5 to 12.5 kHz and ±2 dB from 3.15 to 20 kHz. (13, p.1.)
The preamplifier frequency accuracy is ±0.2 dB from 2.5 to 200 kHz (with 18 ρF
dummy microphone) and typical noise is 1.8 µV. (14, p.1.)
4.1.1 Calibration PSP printed circuit board
The special PSP PCB for calibration PSP was developed together with hardware
specialists from JOT Automation to power a high accuracy microphone and adjust
the microphone output level suitable for the DAQ card which is used for generating
a signal for a speaker and analyzing a signal from a microphone.
The calibration PSP includes a button for the operator input and a few digital
inputs and outputs to enable the calibration flow control. Some LEDs, one inside
the PSP button, are used to indicate the calibration progress and needed user
actions. Some inputs and outputs are needed to control indication LEDs and
pneumatic actuators are used to release a sound source locking mechanism and
27
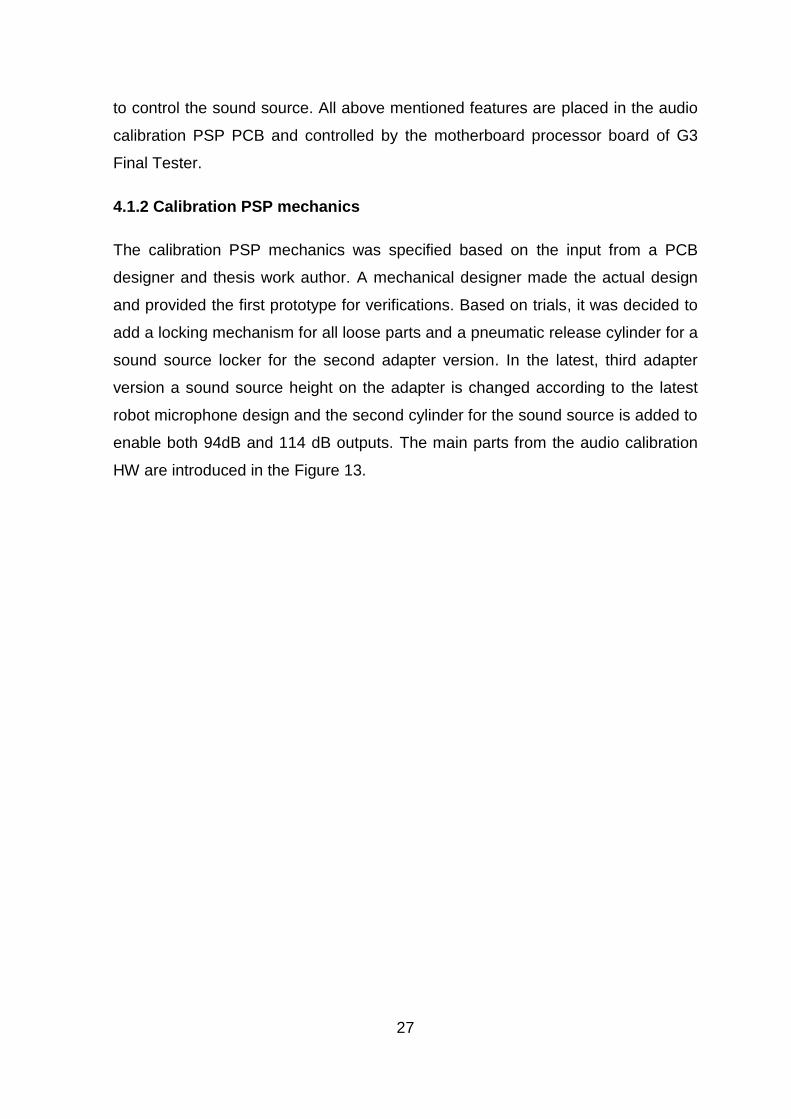
to control the sound source. All above mentioned features are placed in the audio
calibration PSP PCB and controlled by the motherboard processor board of G3
Final Tester.
4.1.2 Calibration PSP mechanics
The calibration PSP mechanics was specified based on the input from a PCB
designer and thesis work author. A mechanical designer made the actual design
and provided the first prototype for verifications. Based on trials, it was decided to
add a locking mechanism for all loose parts and a pneumatic release cylinder for a
sound source locker for the second adapter version. In the latest, third adapter
version a sound source height on the adapter is changed according to the latest
robot microphone design and the second cylinder for the sound source is added to
enable both 94dB and 114 dB outputs. The main parts from the audio calibration
HW are introduced in the Figure 13.
28
FIGURE 13. Audio calibration PSP mechanics (Riuttanen Aki, 2015)
4.1.3 G3 Final Tester reference sound source adapter
G3 Final Tester robot microphone needs a mechanical adapter to seal properly
against the reference sound source (B&K Sound Calibrator Type 4231) during
calibration measurements. Figure 14 presents a cross-sectional view from the
used sound source and the intended placement for the calibrated microphone.

29
FIGURE 14. Cross-sectional view of the B&K calibrator Type 4231 (12, p. 2)
The original G3 Final Tester artificial ear adapter was designed as a low leakage
coupler and thus it was not sealing properly against the sound source during
microphone gain calibration. The mechanical designer created a designated
adapter (Figure 15) for calibration purposes. Due to mechanical restrictions in G3
Final tester, the microphone could not be located inside the sound source.
FIGURE 15. The first version of an artificial earpiece adapter between a robot
microphone and the B&K sound source standard half inch interface (Riuttanen Aki,
2015)
30
4.2 Calibration software
The audio calibration software consists of an audio calibration PSP configuration
file and an audio calibration application and both of them are delivered with JOT
G3 Final Tester server software installer.
The PSP configuration file defines the needed digital and pneumatic inputs and
outputs for controlling adapter cylinders and indication LEDs. The audio calibration
application is C# code which includes all methods for JOT G3 Final Tester server
software to be able to execute JOT G3 Final Tester audio calibration procedure.
The original idea was to create the calibration functionality without any graphical
software user interface (GUI) and thus, the calibration PSP is including indication
LEDs to guide the operator thru the calibration process. This approach enables a
faster calibration at mass production lines with typically multiple G3 Final Testers
which need to be calibrated one by one.
During the development work, it came clear that some extra info is needed to both
guide the operator for the first few times to learn about the calibration flow and
also to give more detailed information from the calibration than pass or fail LED.
Eventually, it was decided to create an AudioCalibrationUI-application which
presents advice messages and the most important measurement results to the
operator. According to the original requirement, the calibration can still be
executed also without a graphical user interface. Figure 16 introduces typical view
from AudioCalibrationUI- application after a successful calibration.
31
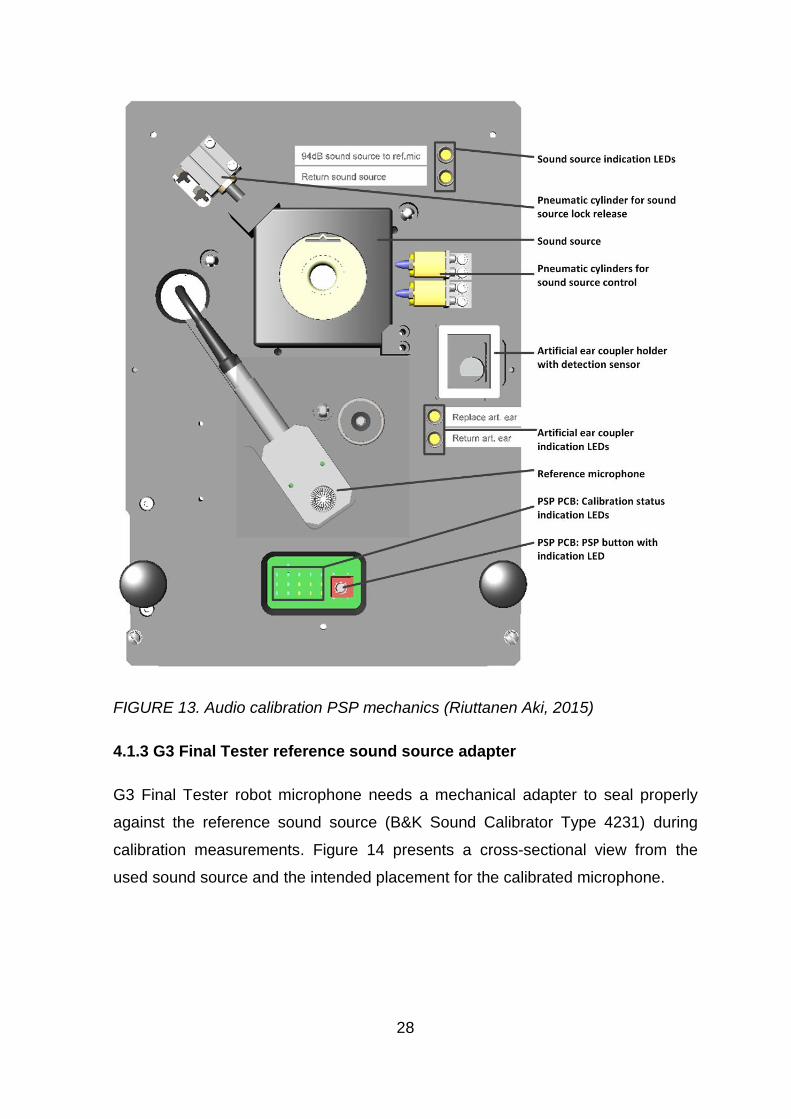
FIGURE 16. AudioCalibrationUI graphical user interface (Riuttanen Aki, 2015)
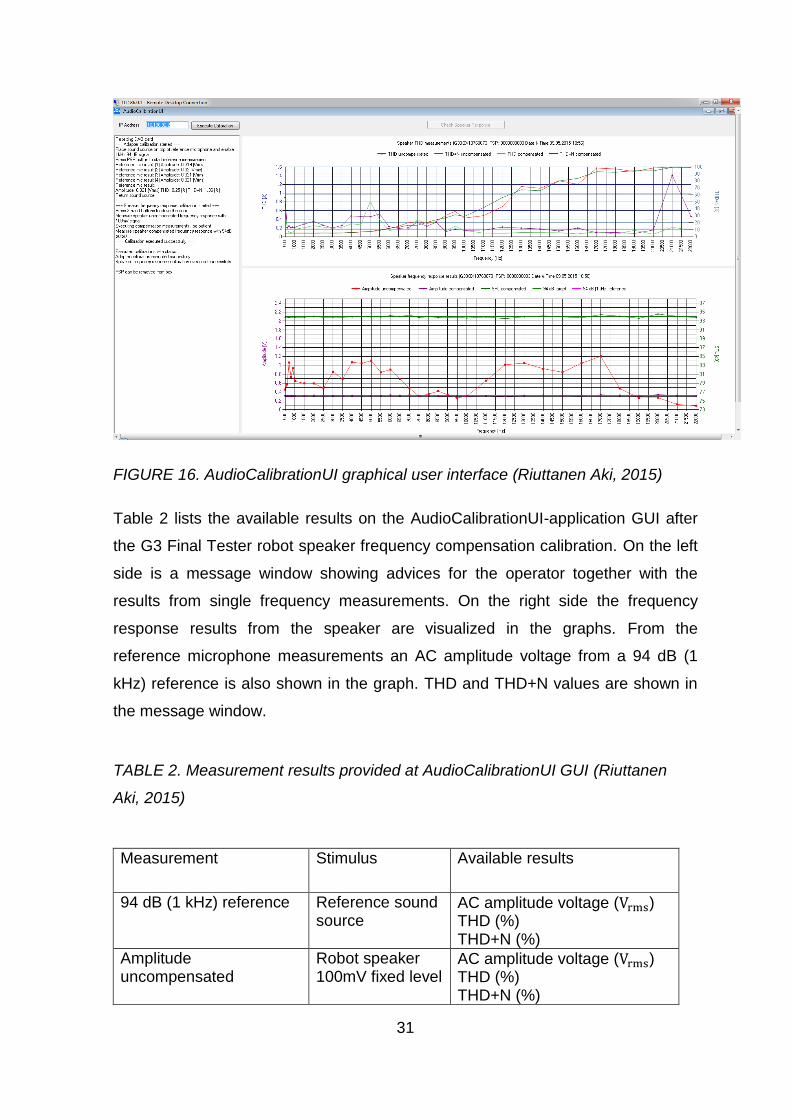
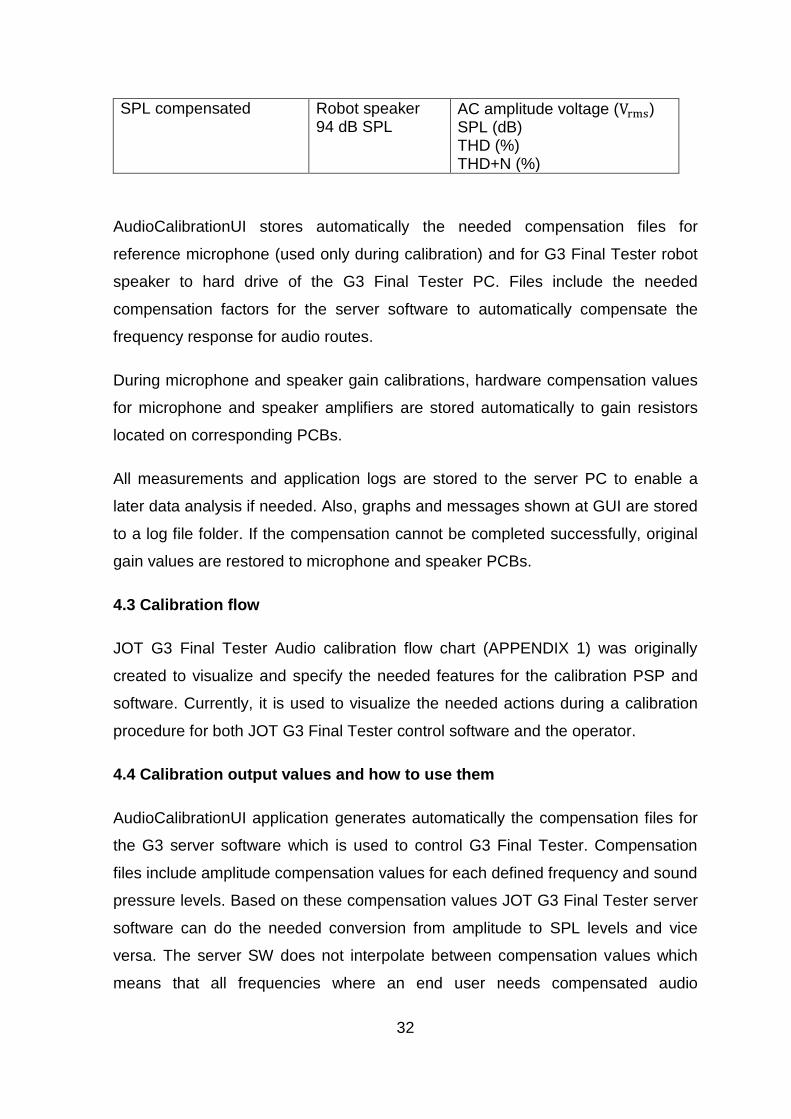
Table 2 lists the available results on the AudioCalibrationUI-application GUI after
the G3 Final Tester robot speaker frequency compensation calibration. On the left
side is a message window showing advices for the operator together with the
results from single frequency measurements. On the right side the frequency
response results from the speaker are visualized in the graphs. From the
reference microphone measurements an AC amplitude voltage from a 94 dB (1
kHz) reference is also shown in the graph. THD and THD+N values are shown in
the message window.
TABLE 2. Measurement results provided at AudioCalibrationUI GUI (Riuttanen
Aki, 2015)
Measurement Stimulus Available results
94 dB (1 kHz) reference Reference sound source
AC amplitude voltage (Vrms) THD (%) THD+N (%)
Amplitude uncompensated
Robot speaker 100mV fixed level
AC amplitude voltage (Vrms) THD (%) THD+N (%)
32
SPL compensated Robot speaker 94 dB SPL
AC amplitude voltage (Vrms) SPL (dB) THD (%) THD+N (%)
AudioCalibrationUI stores automatically the needed compensation files for
reference microphone (used only during calibration) and for G3 Final Tester robot
speaker to hard drive of the G3 Final Tester PC. Files include the needed
compensation factors for the server software to automatically compensate the
frequency response for audio routes.
During microphone and speaker gain calibrations, hardware compensation values
for microphone and speaker amplifiers are stored automatically to gain resistors
located on corresponding PCBs.
All measurements and application logs are stored to the server PC to enable a
later data analysis if needed. Also, graphs and messages shown at GUI are stored
to a log file folder. If the compensation cannot be completed successfully, original
gain values are restored to microphone and speaker PCBs.
4.3 Calibration flow
JOT G3 Final Tester Audio calibration flow chart (APPENDIX 1) was originally
created to visualize and specify the needed features for the calibration PSP and
software. Currently, it is used to visualize the needed actions during a calibration
procedure for both JOT G3 Final Tester control software and the operator.
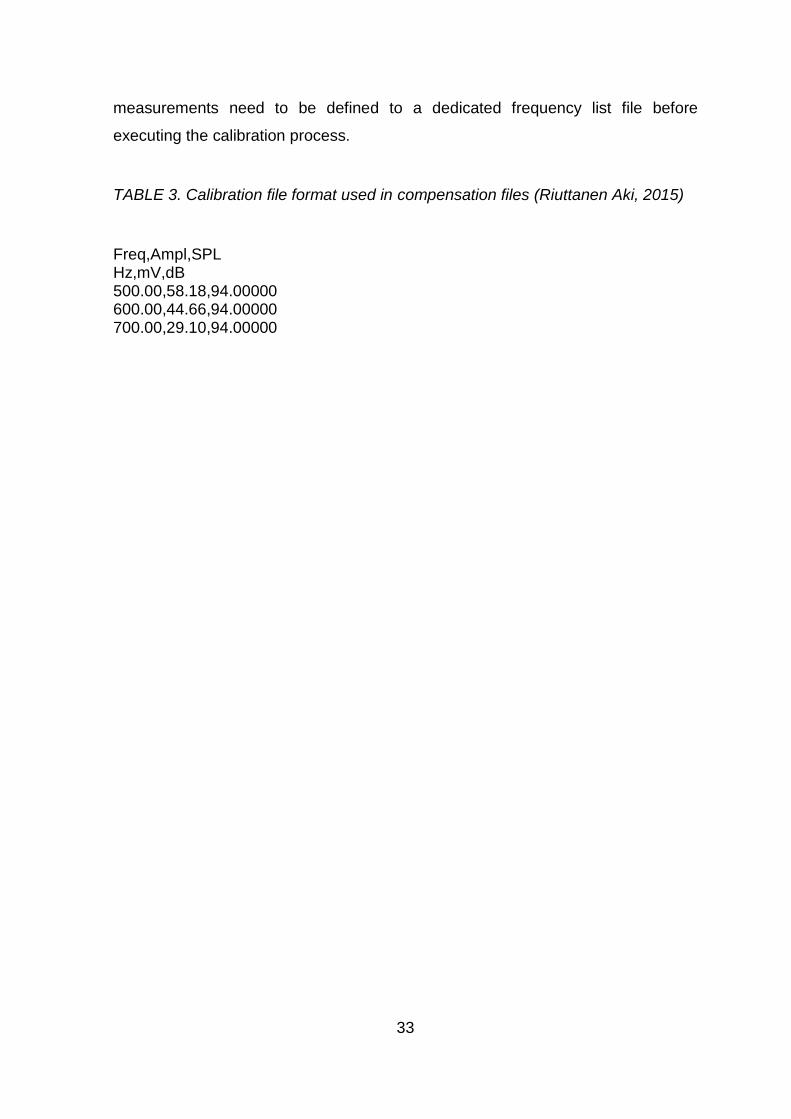
4.4 Calibration output values and how to use them
AudioCalibrationUI application generates automatically the compensation files for
the G3 server software which is used to control G3 Final Tester. Compensation
files include amplitude compensation values for each defined frequency and sound
pressure levels. Based on these compensation values JOT G3 Final Tester server
software can do the needed conversion from amplitude to SPL levels and vice
versa. The server SW does not interpolate between compensation values which
means that all frequencies where an end user needs compensated audio
33
measurements need to be defined to a dedicated frequency list file before
executing the calibration process.
TABLE 3. Calibration file format used in compensation files (Riuttanen Aki, 2015)
Freq,Ampl,SPL Hz,mV,dB 500.00,58.18,94.00000 600.00,44.66,94.00000 700.00,29.10,94.00000
34
5 MEASUREMENT RESULTS
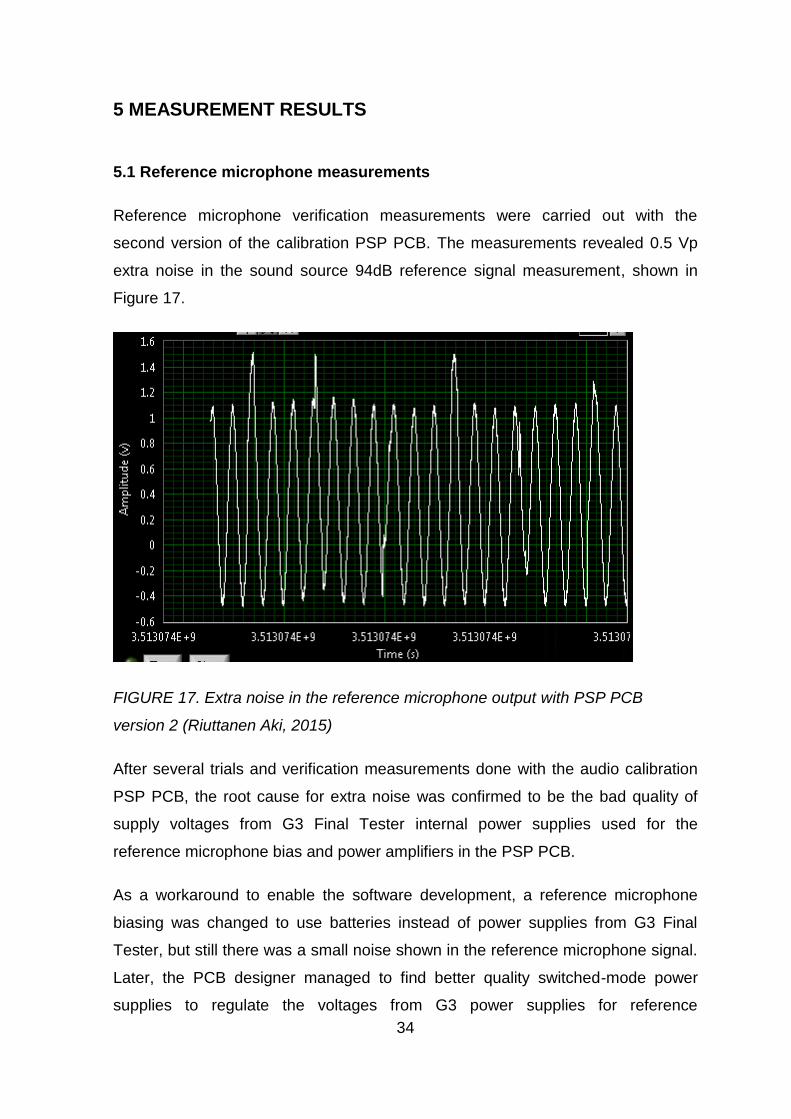
5.1 Reference microphone measurements
Reference microphone verification measurements were carried out with the
second version of the calibration PSP PCB. The measurements revealed 0.5 Vp
extra noise in the sound source 94dB reference signal measurement, shown in
Figure 17.
FIGURE 17. Extra noise in the reference microphone output with PSP PCB
version 2 (Riuttanen Aki, 2015)
After several trials and verification measurements done with the audio calibration
PSP PCB, the root cause for extra noise was confirmed to be the bad quality of
supply voltages from G3 Final Tester internal power supplies used for the
reference microphone bias and power amplifiers in the PSP PCB.
As a workaround to enable the software development, a reference microphone
biasing was changed to use batteries instead of power supplies from G3 Final
Tester, but still there was a small noise shown in the reference microphone signal.
Later, the PCB designer managed to find better quality switched-mode power
supplies to regulate the voltages from G3 power supplies for reference
35
microphone bias and power amplifiers. This caused a new design round for the
calibration PSP PCB.
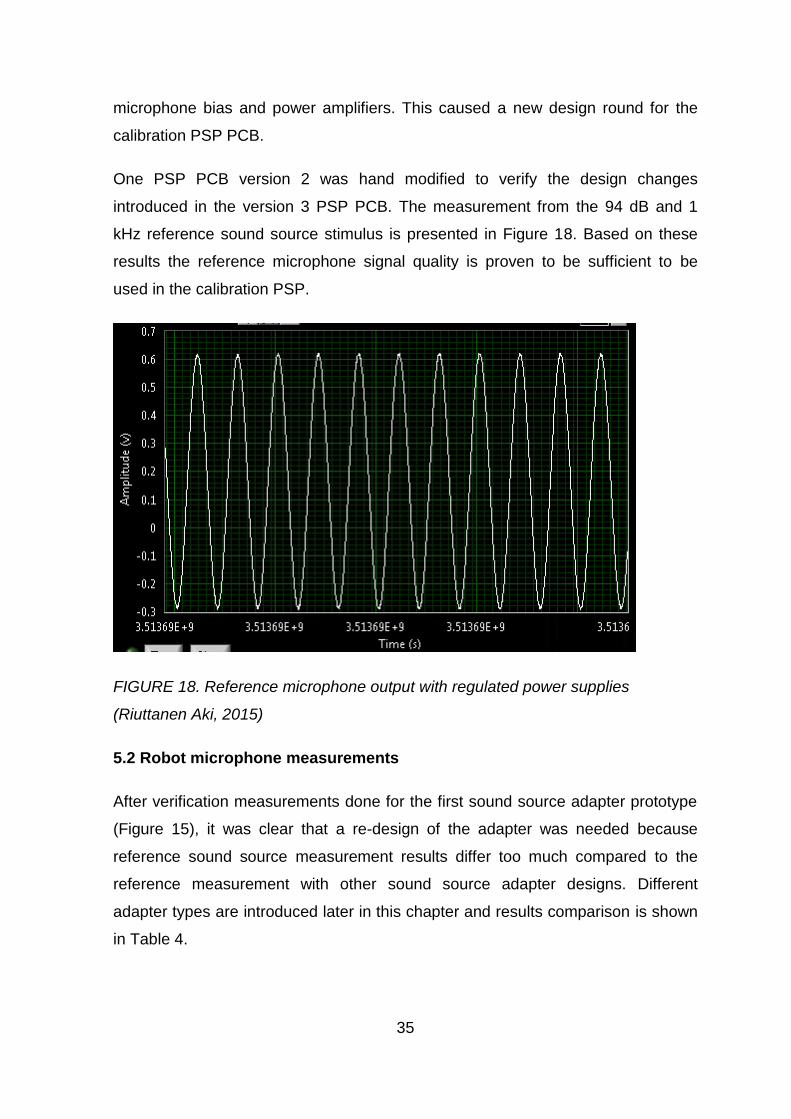
One PSP PCB version 2 was hand modified to verify the design changes
introduced in the version 3 PSP PCB. The measurement from the 94 dB and 1
kHz reference sound source stimulus is presented in Figure 18. Based on these
results the reference microphone signal quality is proven to be sufficient to be
used in the calibration PSP.
FIGURE 18. Reference microphone output with regulated power supplies
(Riuttanen Aki, 2015)
5.2 Robot microphone measurements
After verification measurements done for the first sound source adapter prototype
(Figure 15), it was clear that a re-design of the adapter was needed because
reference sound source measurement results differ too much compared to the
reference measurement with other sound source adapter designs. Different
adapter types are introduced later in this chapter and results comparison is shown
in Table 4.
36
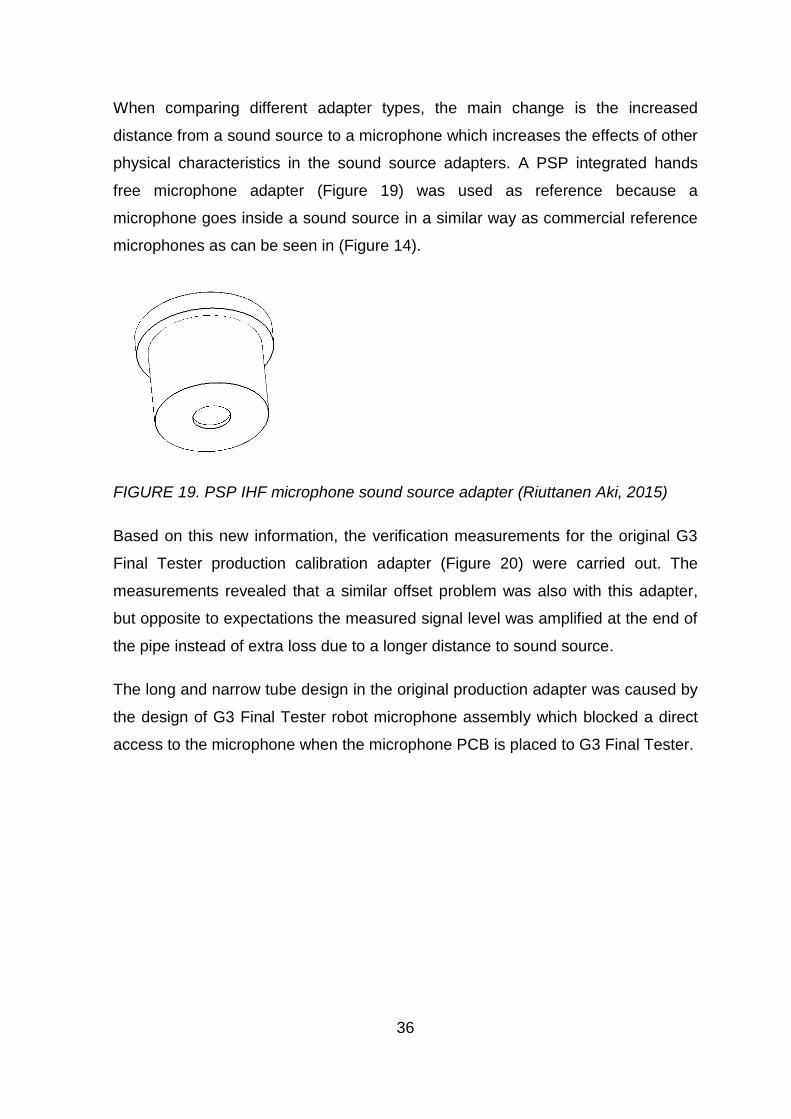
When comparing different adapter types, the main change is the increased
distance from a sound source to a microphone which increases the effects of other
physical characteristics in the sound source adapters. A PSP integrated hands
free microphone adapter (Figure 19) was used as reference because a
microphone goes inside a sound source in a similar way as commercial reference
microphones as can be seen in (Figure 14).
FIGURE 19. PSP IHF microphone sound source adapter (Riuttanen Aki, 2015)
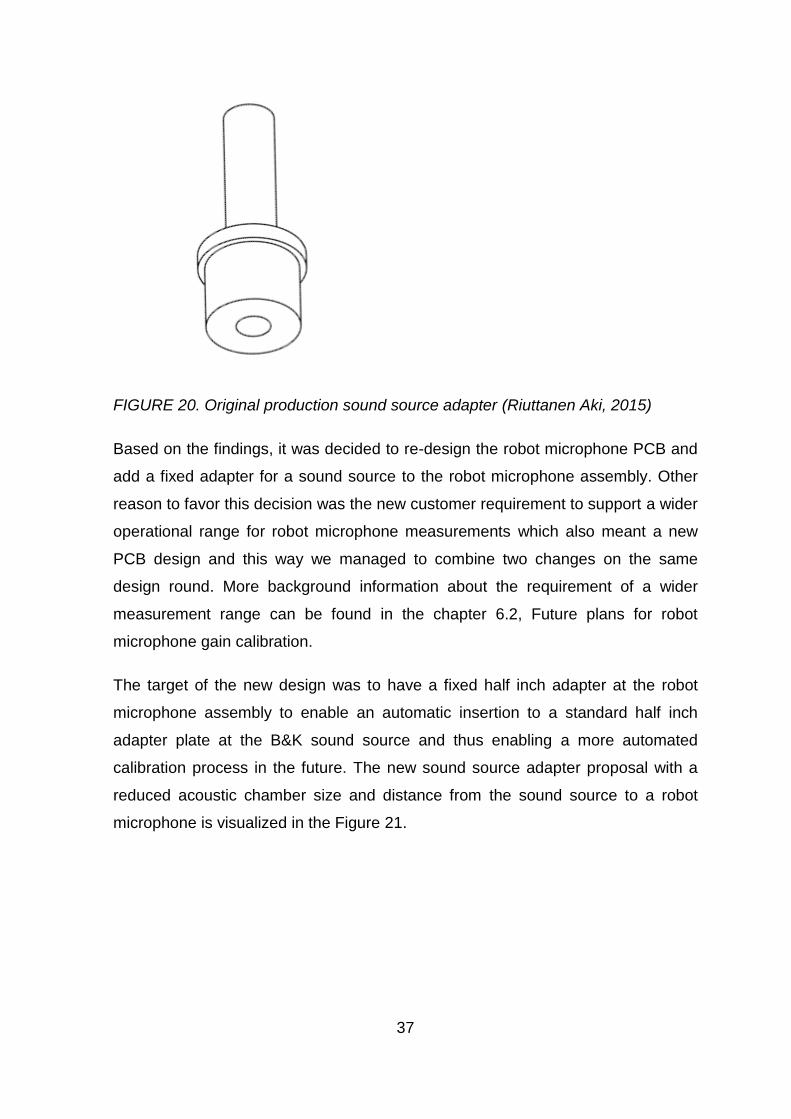
Based on this new information, the verification measurements for the original G3
Final Tester production calibration adapter (Figure 20) were carried out. The
measurements revealed that a similar offset problem was also with this adapter,
but opposite to expectations the measured signal level was amplified at the end of
the pipe instead of extra loss due to a longer distance to sound source.
The long and narrow tube design in the original production adapter was caused by
the design of G3 Final Tester robot microphone assembly which blocked a direct
access to the microphone when the microphone PCB is placed to G3 Final Tester.
37
FIGURE 20. Original production sound source adapter (Riuttanen Aki, 2015)
Based on the findings, it was decided to re-design the robot microphone PCB and
add a fixed adapter for a sound source to the robot microphone assembly. Other
reason to favor this decision was the new customer requirement to support a wider
operational range for robot microphone measurements which also meant a new
PCB design and this way we managed to combine two changes on the same
design round. More background information about the requirement of a wider
measurement range can be found in the chapter 6.2, Future plans for robot
microphone gain calibration.
The target of the new design was to have a fixed half inch adapter at the robot
microphone assembly to enable an automatic insertion to a standard half inch
adapter plate at the B&K sound source and thus enabling a more automated
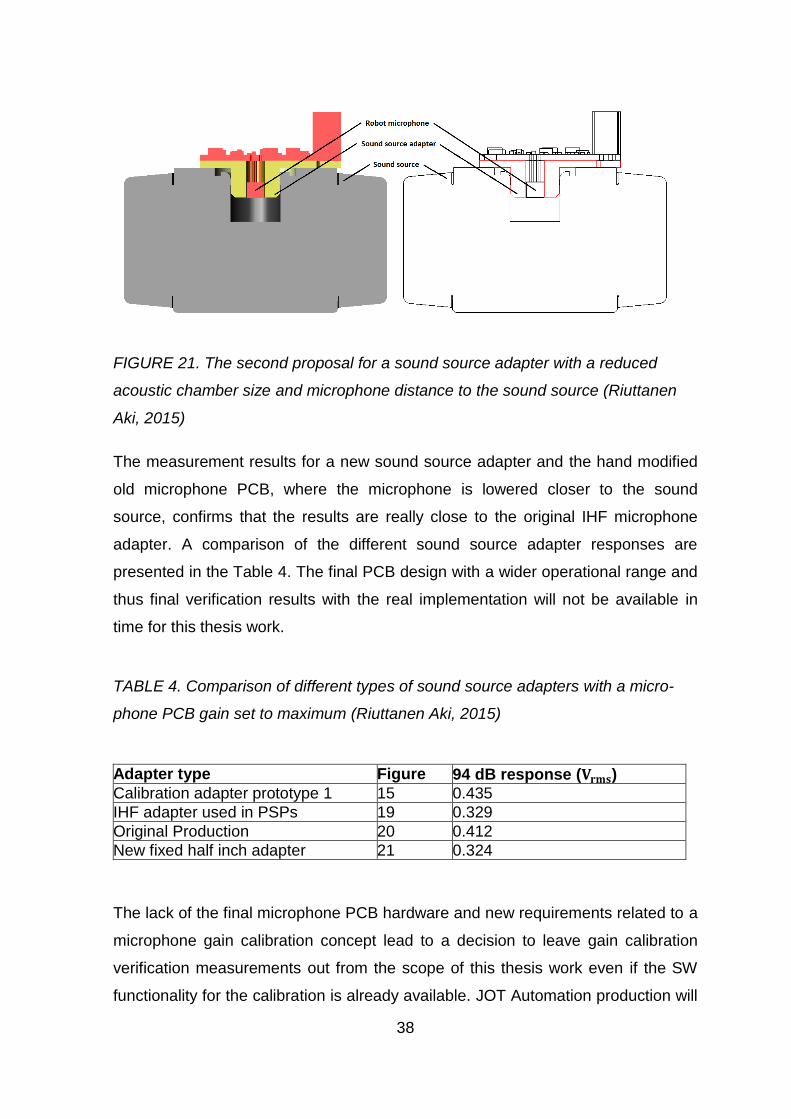
calibration process in the future. The new sound source adapter proposal with a
reduced acoustic chamber size and distance from the sound source to a robot
microphone is visualized in the Figure 21.
38
FIGURE 21. The second proposal for a sound source adapter with a reduced
acoustic chamber size and microphone distance to the sound source (Riuttanen
Aki, 2015)
The measurement results for a new sound source adapter and the hand modified
old microphone PCB, where the microphone is lowered closer to the sound
source, confirms that the results are really close to the original IHF microphone
adapter. A comparison of the different sound source adapter responses are
presented in the Table 4. The final PCB design with a wider operational range and
thus final verification results with the real implementation will not be available in
time for this thesis work.
TABLE 4. Comparison of different types of sound source adapters with a micro-
phone PCB gain set to maximum (Riuttanen Aki, 2015)
Adapter type Figure 94 dB response (𝐕𝐫𝐦𝐬)
Calibration adapter prototype 1 15 0.435
IHF adapter used in PSPs 19 0.329
Original Production 20 0.412
New fixed half inch adapter 21 0.324
The lack of the final microphone PCB hardware and new requirements related to a
microphone gain calibration concept lead to a decision to leave gain calibration
verification measurements out from the scope of this thesis work even if the SW
functionality for the calibration is already available. JOT Automation production will
39
continue using the old calibration method for the old robot microphone PCB until
the new PCB and calibration method are verified according to the plans presented
in the chapter 6.
5.3 Robot speaker measurements
5.3.1 Robot speaker frequency response calibration
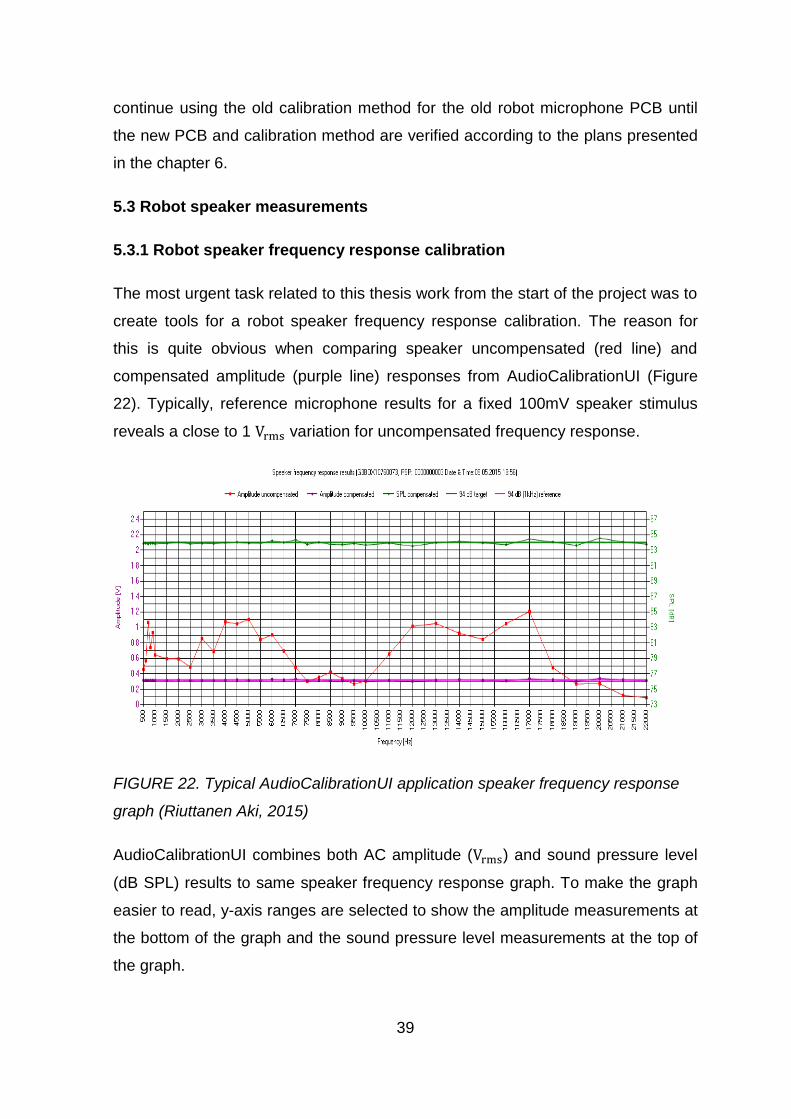
The most urgent task related to this thesis work from the start of the project was to
create tools for a robot speaker frequency response calibration. The reason for
this is quite obvious when comparing speaker uncompensated (red line) and
compensated amplitude (purple line) responses from AudioCalibrationUI (Figure
22). Typically, reference microphone results for a fixed 100mV speaker stimulus
reveals a close to 1 Vrms variation for uncompensated frequency response.
FIGURE 22. Typical AudioCalibrationUI application speaker frequency response
graph (Riuttanen Aki, 2015)
AudioCalibrationUI combines both AC amplitude (Vrms) and sound pressure level
(dB SPL) results to same speaker frequency response graph. To make the graph
easier to read, y-axis ranges are selected to show the amplitude measurements at
the bottom of the graph and the sound pressure level measurements at the top of
the graph.
40
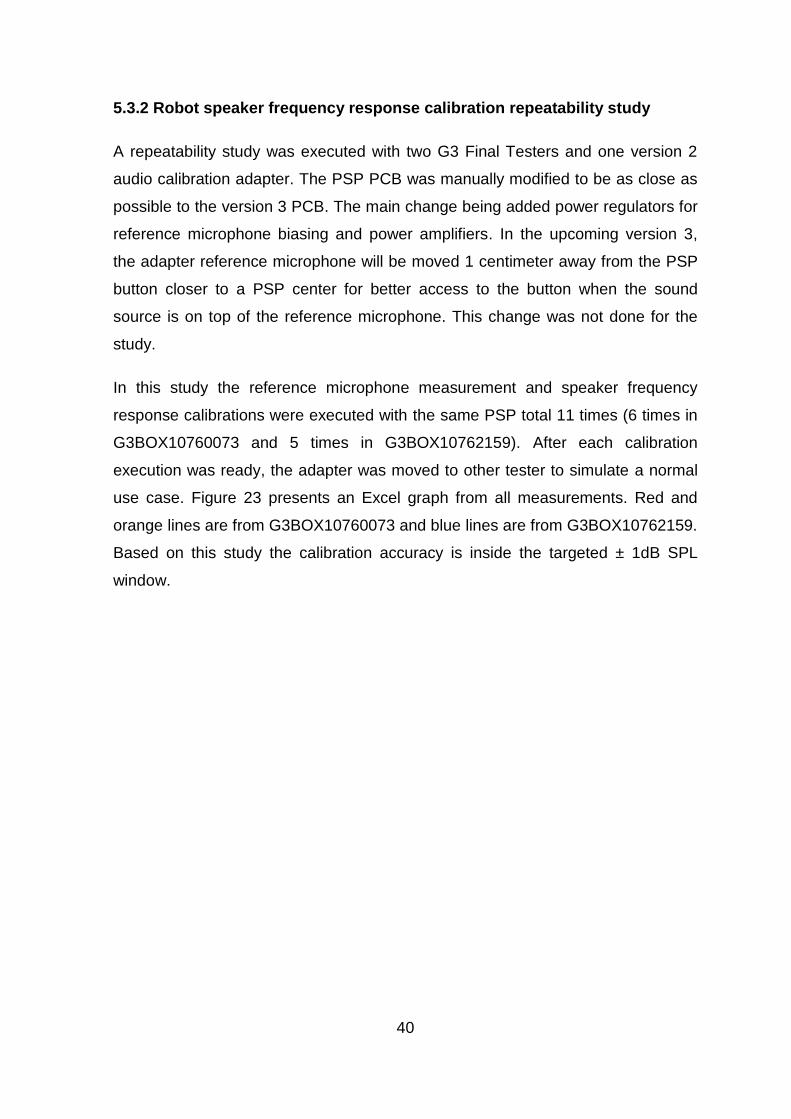
5.3.2 Robot speaker frequency response calibration repeatability study
A repeatability study was executed with two G3 Final Testers and one version 2
audio calibration adapter. The PSP PCB was manually modified to be as close as
possible to the version 3 PCB. The main change being added power regulators for
reference microphone biasing and power amplifiers. In the upcoming version 3,
the adapter reference microphone will be moved 1 centimeter away from the PSP
button closer to a PSP center for better access to the button when the sound
source is on top of the reference microphone. This change was not done for the
study.
In this study the reference microphone measurement and speaker frequency
response calibrations were executed with the same PSP total 11 times (6 times in
G3BOX10760073 and 5 times in G3BOX10762159). After each calibration
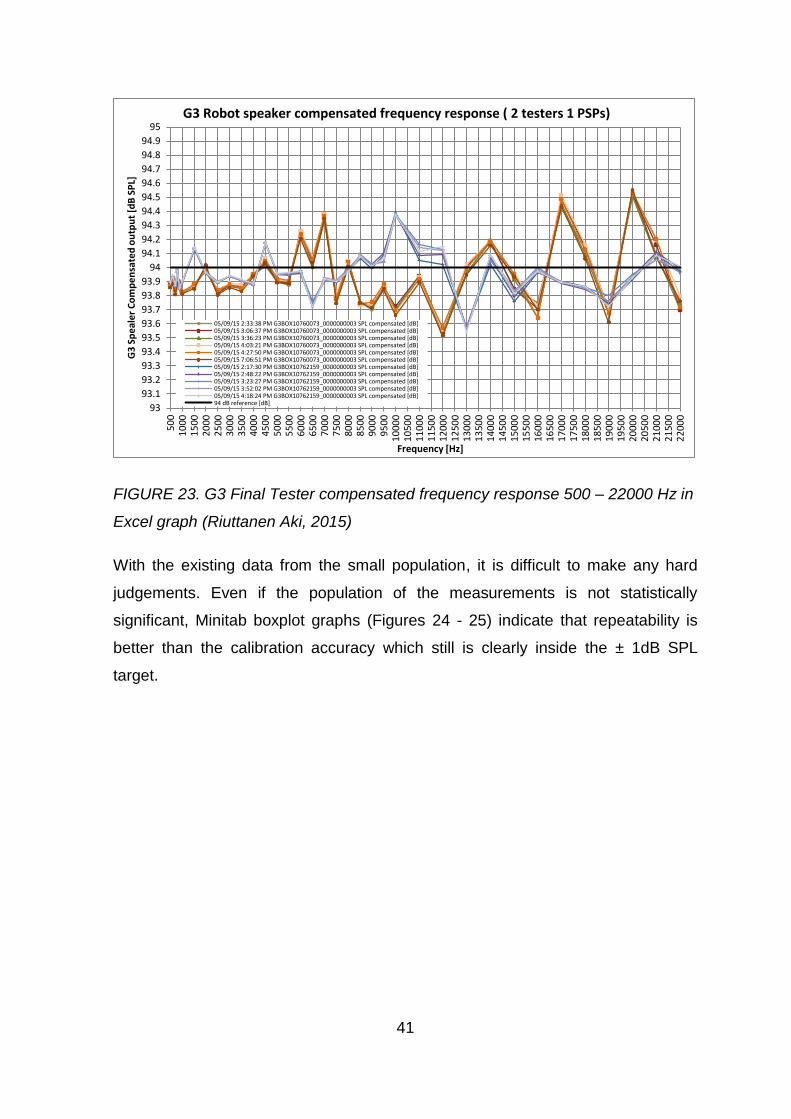
execution was ready, the adapter was moved to other tester to simulate a normal
use case. Figure 23 presents an Excel graph from all measurements. Red and
orange lines are from G3BOX10760073 and blue lines are from G3BOX10762159.
Based on this study the calibration accuracy is inside the targeted ± 1dB SPL
window.
41
FIGURE 23. G3 Final Tester compensated frequency response 500 – 22000 Hz in
Excel graph (Riuttanen Aki, 2015)
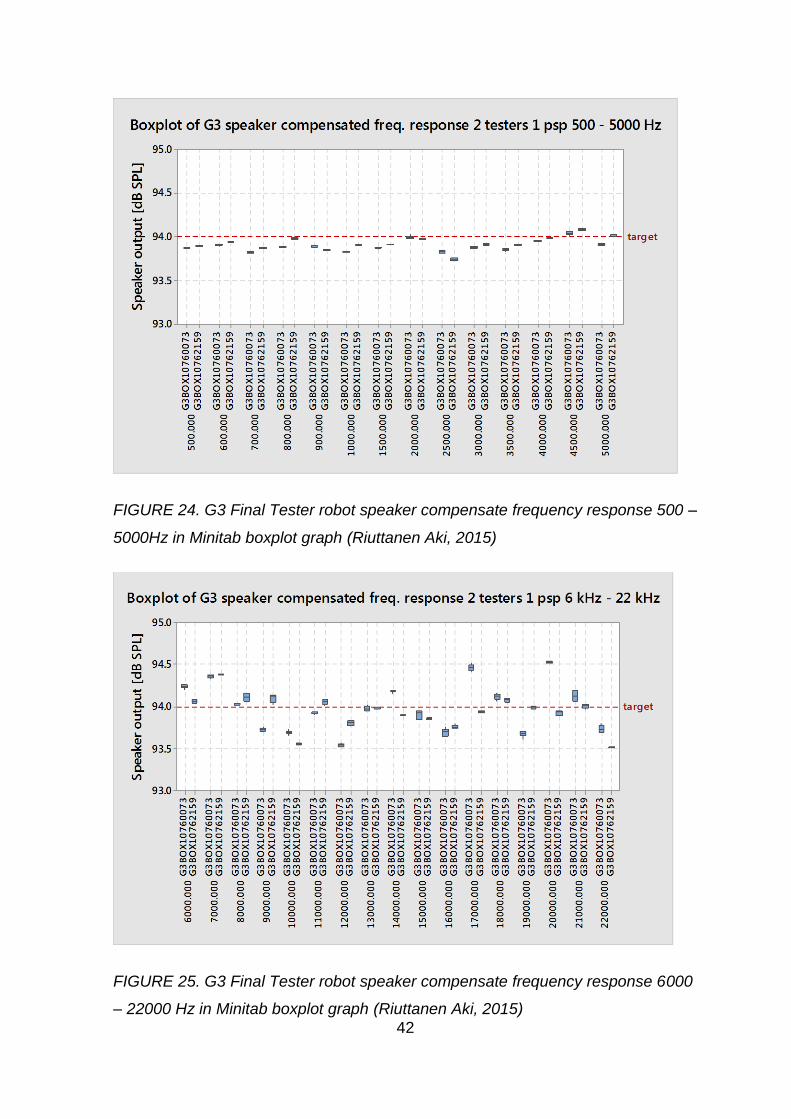
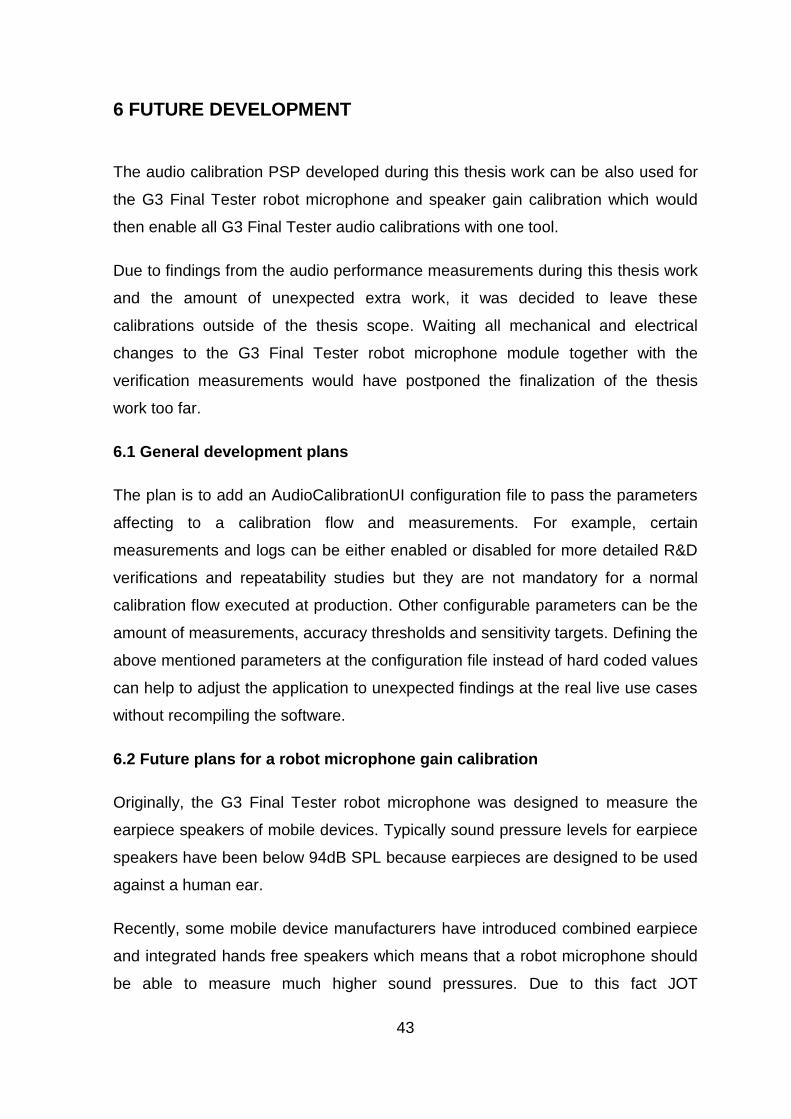
With the existing data from the small population, it is difficult to make any hard
judgements. Even if the population of the measurements is not statistically
significant, Minitab boxplot graphs (Figures 24 - 25) indicate that repeatability is
better than the calibration accuracy which still is clearly inside the ± 1dB SPL
target.
93
93.1
93.2
93.3
93.4
93.5
93.6
93.7
93.8
93.9
94
94.1
94.2
94.3
94.4
94.5
94.6
94.7
94.8
94.9
95
50
01
000
15
002
000
25
003
000
35
004
000
45
005
000
55
006
000
65
007
000
75
008
000
85
009
000
95
001
000
01
050
01
100
01
150
01
200
01
250
01
300
01
350
01
400
01
450
01
500
01
550
01
600
01
650
01
700
01
750
01
800
01
850
01
900
01
950
02
000
02
050
02
100
02
150
02
200
0
G3
Sp
eal
er
Co
mp
en
sate
d o
utp
ut
[dB
SP
L]
Frequency [Hz]
G3 Robot speaker compensated frequency response ( 2 testers 1 PSPs)
05/09/15 2:33:38 PM G3BOX10760073_0000000003 SPL compensated [dB]05/09/15 3:06:37 PM G3BOX10760073_0000000003 SPL compensated [dB]05/09/15 3:36:23 PM G3BOX10760073_0000000003 SPL compensated [dB]05/09/15 4:03:21 PM G3BOX10760073_0000000003 SPL compensated [dB]05/09/15 4:27:50 PM G3BOX10760073_0000000003 SPL compensated [dB]05/09/15 7:06:51 PM G3BOX10760073_0000000003 SPL compensated [dB]05/09/15 2:17:30 PM G3BOX10762159_0000000003 SPL compensated [dB]05/09/15 2:48:22 PM G3BOX10762159_0000000003 SPL compensated [dB]05/09/15 3:23:27 PM G3BOX10762159_0000000003 SPL compensated [dB]05/09/15 3:52:02 PM G3BOX10762159_0000000003 SPL compensated [dB]05/09/15 4:18:24 PM G3BOX10762159_0000000003 SPL compensated [dB]94 dB reference [dB]
42
FIGURE 24. G3 Final Tester robot speaker compensate frequency response 500 –
5000Hz in Minitab boxplot graph (Riuttanen Aki, 2015)
FIGURE 25. G3 Final Tester robot speaker compensate frequency response 6000
– 22000 Hz in Minitab boxplot graph (Riuttanen Aki, 2015)
43
6 FUTURE DEVELOPMENT
The audio calibration PSP developed during this thesis work can be also used for
the G3 Final Tester robot microphone and speaker gain calibration which would
then enable all G3 Final Tester audio calibrations with one tool.
Due to findings from the audio performance measurements during this thesis work
and the amount of unexpected extra work, it was decided to leave these
calibrations outside of the thesis scope. Waiting all mechanical and electrical
changes to the G3 Final Tester robot microphone module together with the
verification measurements would have postponed the finalization of the thesis
work too far.
6.1 General development plans
The plan is to add an AudioCalibrationUI configuration file to pass the parameters
affecting to a calibration flow and measurements. For example, certain
measurements and logs can be either enabled or disabled for more detailed R&D
verifications and repeatability studies but they are not mandatory for a normal
calibration flow executed at production. Other configurable parameters can be the
amount of measurements, accuracy thresholds and sensitivity targets. Defining the
above mentioned parameters at the configuration file instead of hard coded values
can help to adjust the application to unexpected findings at the real live use cases
without recompiling the software.
6.2 Future plans for a robot microphone gain calibration
Originally, the G3 Final Tester robot microphone was designed to measure the
earpiece speakers of mobile devices. Typically sound pressure levels for earpiece
speakers have been below 94dB SPL because earpieces are designed to be used
against a human ear.
Recently, some mobile device manufacturers have introduced combined earpiece
and integrated hands free speakers which means that a robot microphone should
be able to measure much higher sound pressures. Due to this fact JOT
44
Automation has started a new design round to introduce a wider measurement
range.
Originally, the robot microphone amplifier PCB included one fixed coarse gain
setting and a digital potentiometer to fine tune sensitivity by adjusting an amplifier
gain based on the 94dB SPL sound source reference. A new wider operational
range means at least two separated gain settings: a low range one calibrated with
94 dB SPL reference and a high range one with 114 dB SPL.
The current approach is to change also the coarse gain setting to be controlled by
a digital potentiometer. In theory this enables the robot microphone to measure a
much wider range of signals with a reasonable signal to noise ratio. The gain value
settings for a low and high range selection would be handled by a G3 server
software based on the end user range selection passed with an audio API call
together with used route information.
Enabling two different gain ranges means changes to both SW and to the
calibration PSP. In the AudioCalibrationUI software new measurements and gain
calculations for a higher reference level and most likely the gain sensitivity level
also for the 94dB reference need to be changed. For the calibration PSP a new
pneumatic cylinder is needed to enable a 114 dB SPL signal from the sound
source (already available in the latest version 3 PSP design).
6.3 Future plans for a robot speaker gain calibration
Currently, the robot speaker amplifier gain calibration can be done using a G3
Final Tester self-diagnostic PSP which includes a reference microphone and
memory where reference result is stored. This means that the implementation of
the robot speaker gain calibration to the audio calibration PSP is not time critical
and the main reason to do the implementation would be to enable all robot audio
calibrations with a single PSP.
In the future the implementation of the speaker gain calibration should be relatively
straightforward and most parts of the current production calibration can be
inherited. The main task is to replace the self-diagnostic PSP microphone, which
45
happens to be the same type as in G3 robot, with a more accurate high precision
microphone located in the audio calibration PSP.
On the software side the needed actions include the integration of the current
calibration methods to the AudioCalibrationUI application and additional printings
of measurement results to GUI and log files.
6.4 Future plans for robot speaker frequency response measurements
6.4.1 Final verification for a speaker frequency response calibration
The plan is to repeat the measurements done in chapter 5.3.2 as soon as more
G3 Final Testers (3 to 4) and at least 2 audio calibration PSPs are available to get
more reliable results from the repeatability and reproducibility. Unfortunately, in an
R&D environment it is not feasible to get enough G3 Final Testers and PSPs
under measurements at the same time for a proper Gauge R&R study.
Gauge R&R is a statistical tool to find a variation from the measurements system
caused either by a measurement device (Gauge) or the operator (people) using
the gauges. To verify the calibration PSP PSBs design robustness, one option to
gain more data for analyses is to use several PCBs and swap a PCB to the same
mechanics. Even with this approach, final repeatability and reproducibility
verifications will be left to be done in co-operation with customers when the first
mass production deliveries are done.
6.4.2 Future improvements for a speaker frequency response calibration
Currently, calibration measurements take quite a lot of time (10 minutes for 40
frequencies). Most of the time is spent to measure every frequency multiple times.
A few measurements are used to find a correct level and after that several
measurements are done to check the accuracy of the measurements and protect
them against random noises.
When more G3 Final Testers and calibration PSPs are available and when a
calibration hardware and software stabilizes, a repeatability study should be
carried out to find the best parameters for the calibration. Moving parameters to
46
configuration files, as proposed earlier in this chapter, would make trials more
convenient and faster.
One way to save time spent during the calibration phase could be using a variable
sample rate at the DAQ card for each measured frequency. At the current
implementation the same sample rate is used for all frequencies. The advantages
of a dynamic sample rate would be a faster calibration process at the low
frequencies where a smaller sample rate could be used and the potentially
increased calibration accuracy at the high frequencies in case the default sample
rate is not suitable.
The fastest way to minimize the time used for calibration is to minimize the used
frequencies and it is already available with the current implementation. In the R&D
phase more measurements and the frequency points might be needed but
typically during the mass production phase all extra measurements from the test
sequence are removed to minimize the time consumed for testing and that opens
an opportunity to calibrate only those few specific frequencies used in the mass
production test plan.
47
7 CONCLUSIONS
The initial main targets for this thesis work were to develop calibrations tools for a
JOT G3 Final Tester, execute the typical performance measurements and update
audio documentation to help the integration to the tester features. Due to
unexpected findings during the thesis work and thus changed schedules, the
original requirements of final verification results and creation of audio application
notes were removed from the final targets. The verification plan and the
measurement for the data sheets will still be provided internally at JOT Automation
after the finalization of this thesis work.
The work started more than one year before the actual implementation was ready
by specifying hardware and software features needed for the calibration. The
specification work proceeded well after all minor issues were found during the
implementation phase from the calibration concepts itself. The main findings were
related to JOT G3 Final Tester design which caused unexpected delays to the
thesis in the form of new design rounds.
A new design was needed for the calibration PSP PCB due to JOT Final Tester
power supplies do not provide as good a signal quality as is needed for a high
sensitivity microphone powering. This problem is only related to a high voltage
needed for the reference microphone powering and should not affect other test
features which the JOT G3 Final Tester provides.
Other design change found during this thesis work, which affected both to JOT G3
Final Tester and calibration PSP, was the robot microphone design issue, which
caused an unwanted offset to the robot microphone calibration. Based on the
findings, a new design round is ongoing and a verification work will be started as
soon as a new hardware is available. Unfortunately, this thesis documentation has
to be returned before all the verification measurements are done.
The most important new frequency response calibration is implemented and is
usable based on the preliminary measurements done by hand soldered
prototypes. The final confirmation will be given when the new hardware versions
from both mechanics and the PSP PCB are available and the Gauge R&R study is
48
made in the production environment with several JOT G3 Final Testers and
calibration PSPs. The gain calibration for a microphone and speaker amplifiers is
possible to do with the existing self-diagnostic adapter and it is thus left to be
integrated after the frequency response calibration is verified and a new
microphone design with two gain ranges is available.
Due to the audio calibration work spread over a longer period of time than
expected, the majority of the audio documentation updates were done together
with the G3 audio API interface transformation work from the .NET to HTTP
interface by the software designer. This removed the original target setting related
to the audio application note and reference manual creation during this thesis
work. Instead of creating the document, more attention was directed to review the
audio documentation. In the end a lot of valuable feedback was given to the API
documentation and eventually most of the documentation in the API
documentation was replaced by the SW developer with real life functional audio
measurement example codes. This enables a much faster integration of G3 Final
Tester audio measurement to customer’s own test systems. Other advantage from
this approach is up to date and verified codes because example codes are part of
a software release testing process.
This thesis work has given a lot of valuable information for JOT Automation. The
understanding of JOT G3 Final Tester audio performance has increased due to
the measurements done for the robot microphone and speaker. Also, the output
qualities of the G3 Final Tester internal power supplies are now understood more
deeply. All the measurements done during this thesis work are added to an
internal issue tracking system where they can be used as an input to product data
sheets. As an outcome of this thesis work JOT Automation has a new calibration
PSP which can be used in its own production as well as a customer’s premises to
re-calibrate robot audio interfaces.
Personally, I learned a lot from the audio measurements and physics related to
audio measurements during this thesis work. New experience was gained during
the AudioCalibrationUI-application development from a C# chart handling which
was not used prior to this thesis work neither by me nor my closest colleagues.

49
When looking back to this journey the most valuable information for me was the
insights for the whole calibration PSP development and all the actions and the
difference stakeholders related to that work.
50
REFERENCES
1. JOT Automation Ltd. home page. 2015. Date of retrieval 20.2.2015.
http://www.jotautomation.com/en/about-jot.html.
2. Coates, E. 2015. Measuring the Sine Wave. Date of retrieval 14.5.2015.
http://www.learnabout-electronics.org/ac_theory/ac_waves02.php
3. Talbot-Smith, M. 2013. Audio Engineer's Reference Book, 2nd Edition. Oxford:
Focal Press.
4. Dittmar, T. 2013. Audio Engineering 101. Oxford: Focal Press.
5. Rahikkala, R. 2010. Mobiililaitteiden tuotannontestaukseen tarkoitetun
audiomittalaitteen elektroniikan suunnittelu ja toteutus. University of Oulu.
Sähkö- ja tietotekniikan osasto. Sähkötekniikan koulutusohjelma. Diplomityö
6. www.engineeringtoolbox.com. 2015. Sound Pressure. Date of retrieval
14.5.2015. http://www.engineeringtoolbox.com/sound-pressure-d_711.html
7. Sengpiel, E. 2015. Table of sound pressure levels. Date of retrieval 14.5.2015.
http://www.sengpielaudio.com/TableOfSoundPressureLevels.htm
8. Blomberg, E & Lepoluoto, A. 2005. Audiokirja. Date of retrieval 14.5.2015.
http://ari.lepoluo.to/audiokirja/
9. Metzler B. (2005) Audio measurement handbook. Oregon: Audio precision
10. JOT Automation Ltd., 2014. G3 Training material.pdf, 15.09.2014. Internal
source.
11. JOT Automation Ltd., 2014. JOT G3 Final Tester Audio Calibration
specification version 5, 23.03.2014. Internal source.
12. Brüel & Kjær, 2015. Sound Calibrator Type 4231 Product Data. Date of
retrieval 11.5.2015.
http://www.bksv.com/Products/transducers/acoustic/calibrators/4231?tab=speci
fications.
51
13. G.R.A.S, 2015. G.R.A.S. 40AG 1/2" Ext. Polarized Pressure Microphone
product information. Date of retrieval 13.5.2015. http://www.gras.dk/40ag.html.
14. G.R.A.S, 2015. G.R.A.S. 26AM 1/2'' Standard Preamplifier with 3 m integrated
cable product information. Date of retrieval 13.5.2015.
http://www.gras.dk/26am.html.
52
APPENDICES
G3 Final Tester Audio calibration flow chart
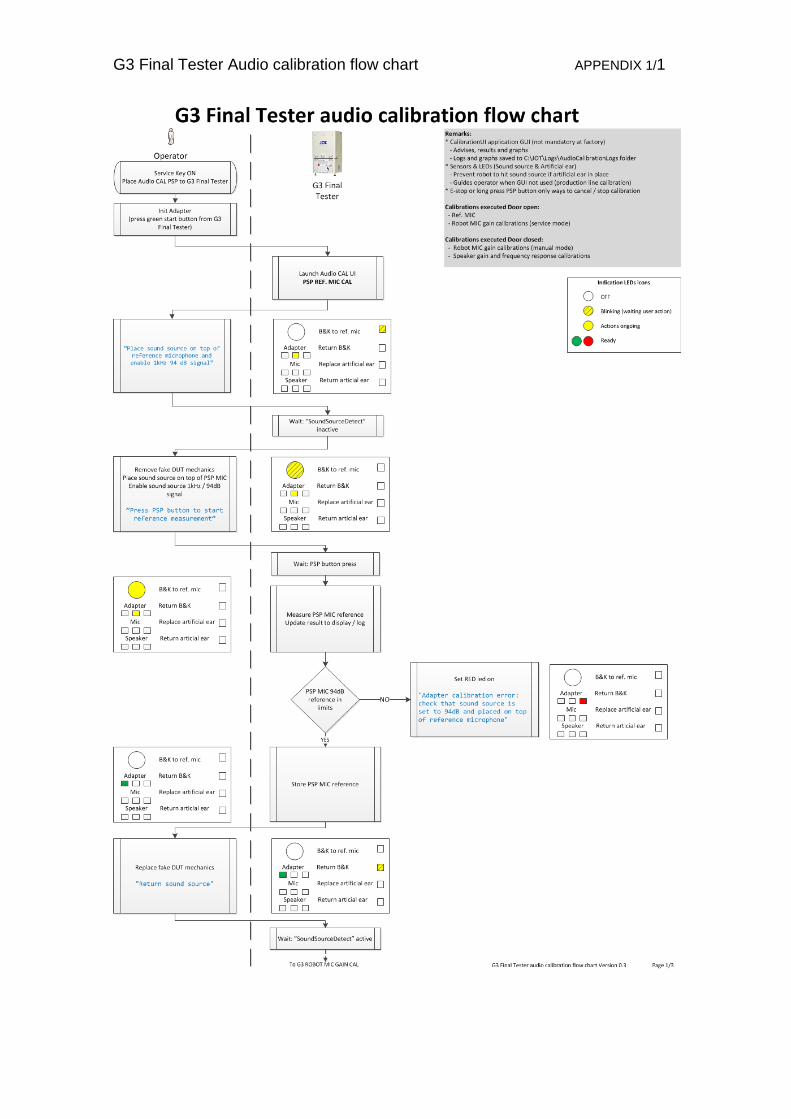
G3 Final Tester Audio calibration flow chart APPENDIX 1/1
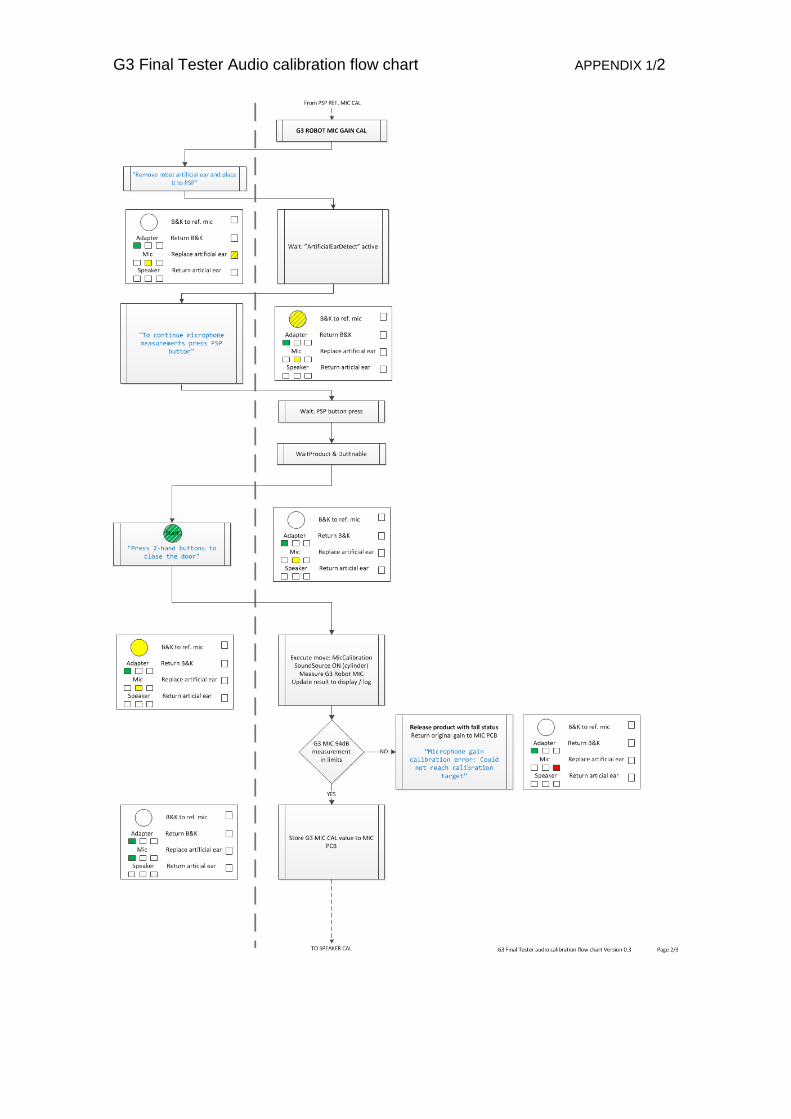
G3 Final Tester Audio calibration flow chart APPENDIX 1/2
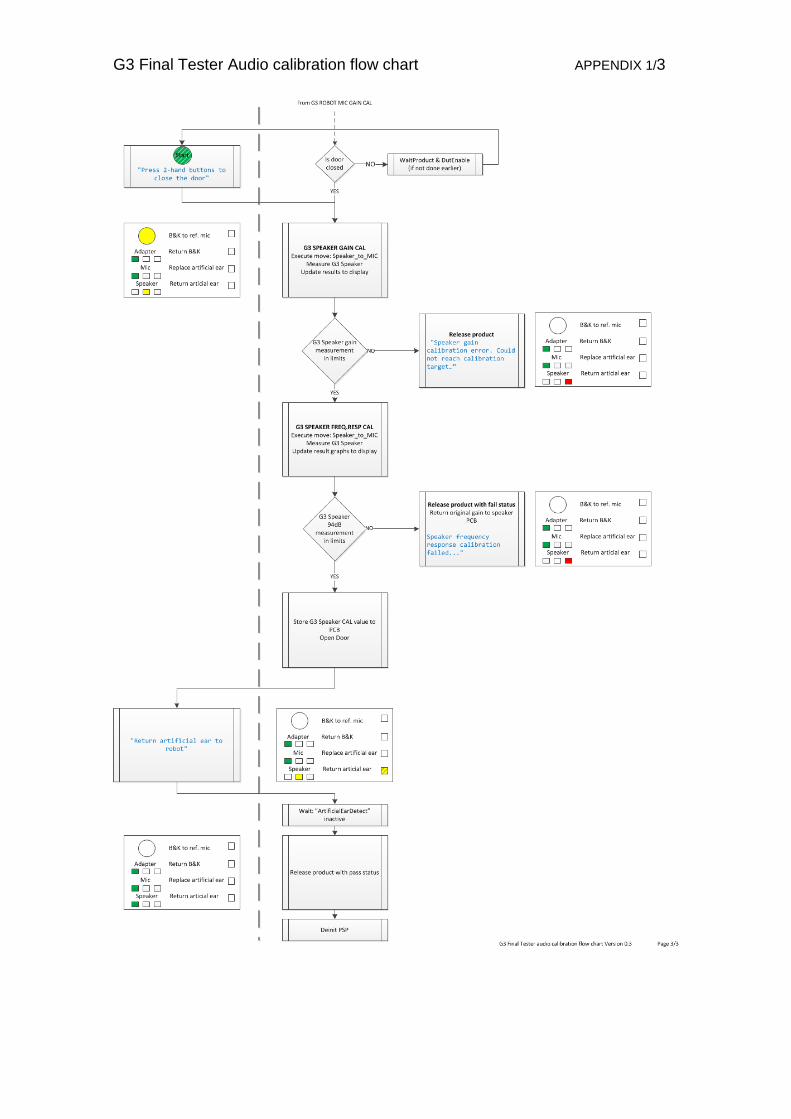
G3 Final Tester Audio calibration flow chart APPENDIX 1/3