akfen gayrİmenkul tİ aret ve İnŞaat a.Ş. · akfen gayrimenkul ticaret ve İnşaat a.Ş....
TRANSCRIPT
AKFEN GAYRİMENKUL TİCARET
VE İNŞAAT A.Ş.
Company Appraisal Report
February 2016

2
Akfen GT – Company Appraisal Report
DISCLAIMER
This appraisal report (“Report”) has been issued for information purposes only with regards to the value
of Akfen Gayrimenkul Ticaret ve İnşaat A.Ş. (“Akfen GT”), as assessed by Türkiye Sınai Kalkınma Bankası
A.Ş. (“TSKB”) and includes various documents and financial tables. This Report and/or the information
contained here cannot be copied, disclosed or distributed to parties other than authorities to which Akfen
Gayrimenkul Yatırım Ortaklığı A.Ş. (“Akfen GYO”) and/or Akfen GT is required to submit a copy hereof.
TSKB hereby explicitly waives and excludes any kind of responsibility or obligation arising out of or due to
any data or omission on the documents or any written and/or oral information or on the assumptions
indicated on the business plan of Akfen GT obtained from Akfen GYO, Akfen GT and other sources in order
to issue this report. Unless stated otherwise, the information in this Report is up-to-date and valid as of
the date of this Report.
Analysis, opinions and results presented within this report have been constituted through our personal,
objective and professional appraisal, assessment and interpretation of documents and information and
investment assumptions provided by Akfen GYO. The information and documents provided by Akfen GYO
and the assumptions and the arguments concluded were all assumed to be true and correct in this Report.
3
Akfen GT – Company Appraisal Report
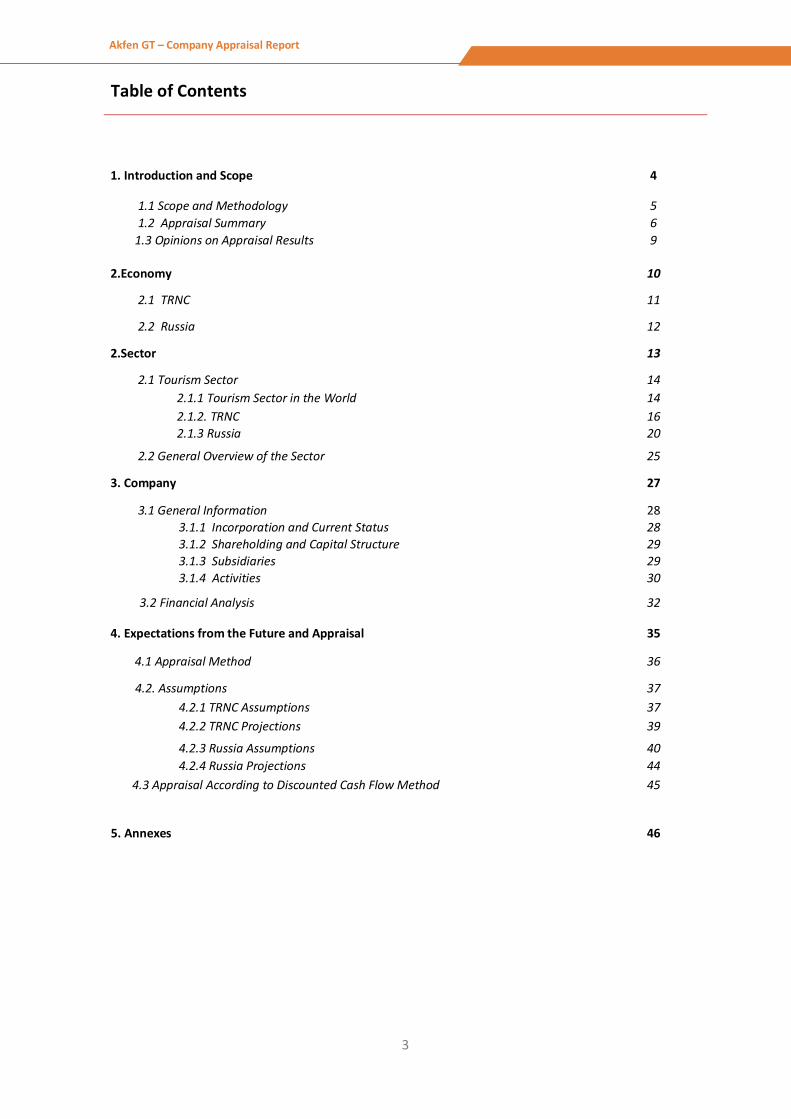
Table of Contents
1. Introduction and Scope 4
1.1 Scope and Methodology 5
1.2 Appraisal Summary 6
1.3 Opinions on Appraisal Results 9
2.Economy 10
2.1 TRNC 11
2.2 Russia 12
2.Sector 13
2.1 Tourism Sector 14
2.1.1 Tourism Sector in the World 14
2.1.2. TRNC 16
2.1.3 Russia 20
2.2 General Overview of the Sector 25
3. Company 27
3.1 General Information 28
3.1.1 Incorporation and Current Status 28
3.1.2 Shareholding and Capital Structure 29
3.1.3 Subsidiaries 29
3.1.4 Activities 30
3.2 Financial Analysis
32
4. Expectations from the Future and Appraisal 35
4.1 Appraisal Method 36
4.2. Assumptions 37
4.2.1 TRNC Assumptions 37
4.2.2 TRNC Projections 39
4.2.3 Russia Assumptions 40
4.2.4 Russia Projections 44
4.3 Appraisal According to Discounted Cash Flow Method 45
5. Annexes 46

4
Akfen GT – Company Appraisal Report
Introduction and Scope
5
Akfen GT – Company Appraisal Report
Scope ve Methodology
Akfen Gayrimenkul Ticaret ve İnşaat A.Ş. (“Akfen GT” or “Company”) was founded in 1999 in order to
operate within the real estate sector and was taken over by Akfen Group companies in 2004. In 2007,
Akfen Gayrimenkul Yatırım Ortaklığı A.Ş. (“Akfen GYO”) became a 100% subsidiary of the Company.
Akfen GYO has applied to Türkiye Sınai Kalkınma Bankası (“TSKB”) in order to obtain company appraisal
consultancy services to assess and determine the value of its subsidiary Akfen GT on 03 November 2015.
This appraisal study has been carried out based on the current and future business plans of Akfen GT and
no detailed legal or financial inspections, accounting audits and/or management presentations have been
performed in order to assess the value of the related Company upon the request as indicated above.
This appraisal study consists of the chapters indicated below:
1. Introduction and Scope
2. Sector
3. The Company
4. Expectations from the Future and the Appraisal
5. Annexes
The purpose of this study is to calculate the company value of Akfen GT. The main activity scope of the
Company is the real estates owned by it and the real estate projects undertaken by the Company and this
report has been issued by mainly using the Discounted Cash Flow (“DCF”) method.
The value calculated by using the Discounted Cash Flow expresses the “fair market value” of the Company.
However, the main factor in sale-purchase transactions regarding an asset is the “price” agreed as a result
of the negotiations that have taken place between a motivated buyer and a seller. However, attention
should be drawn to the fact that the “price” which constitutes the ground for such sale-purchase
transaction might be realized at a level different than the “fair market value”.
The data and business plan assessed during this study have been obtained from Akfen GT. Although
utmost care and attention was shown to eliminate any mistakes and omissions in this study, all major
items affecting the appraisal results shall be considered with the possibility of that such information may
be incorrect and missing since the data has been obtained from external sources, and the same has been
assumed in this study.

6
Akfen GT – Company Appraisal Report
Appraisal Summary
Company
The main scope of activity of Akfen Gayrimenkul Ticaret ve İnşaat A.Ş. is to plan, develop, operate and
contract others to operate real estate investments. Akfen GT, of which Akfen GYO is a 100%1 shareholder,
currently obtains rental income from the 5-star hotel it owns in the Turkish Republic of Northern Cyprus,
and from hotel and other projects in Russia.
The 5-star hotel located in the Turkish Republic of Northern Cyprus has been in operation with its casino
since 2007. Further, Akfen GT has rented and obtained the allocation rights of a plot, with a surface area
of 167 decares located in the Bafra region of TRNC from the Forestry Administration on behalf of the TRNC
Ministry of Agriculture and Natural Resources for 49 years on 30/12/2010.
The Company carries out all of its projects in Russia through its subsidiaries Russian Hotel Investment B.V.
(“RHI”), and Russian Property Investment B.V. (“RPI”), founded in the Netherlands and of which the
Company is 95% shareholder.
Out of these subsidiaries, RHI was founded by the partnership between Akfen GT and Eastern European
Investment Ltd (“EEPI”) on 21 September 2007 in order to realize the hotel projects in Russia and 95% of
the shares of the Company are owned by Akfen GT while the remaining 5% is owned by Cüneyt Baltaoğlu
as of 31 December, 2013.
RPI has been founded by the joint venture of Akfen Gayrimenkul Geliştirme ve Tic. A.Ş. and Eastern
European Property Investment Ltd (“EEPI”) on 8 January 2008, again to carry out projects in Russia. The
shares of Akfen Gayrimenkul Geliştirme ve Tic. A.Ş. has been transferred to Akfen GT on 5 June 2009 and
95% of the shares of the Company are owned by Akfent GT and the remaining 5% is owned by Cüneyt
Baltaoğlu as of 31 December, 2013.
The hotel and office projects, the number of rooms and the realized opening dates for these projects in
Russia are as stated in the table below.
1 Shareholding structure is detailed under section 3.1.2.

7
Akfen GT – Company Appraisal Report
Table 1: Russia Projects
The Hotel and
Office Projects
Number
of Rooms
Commencement
Date
Operation
Date Plot Area(m2)
Total
Area
(m2)
Samara IBIS 204 07/2009 03/2012 2,466 9,961
Yaroslavl lBIS 177 04/2010 09/2011 4,468 7,916
Kaliningrad IBIS 167 08/2011 08/2013 5,099 6,322
Samara Ofis - 07/2009 01/2012 1,048 6,510
(Source: Akfen GT)
The Company requested appraisal of its projects in Russia and its real estate in TRNC (hotel and plot)
from EPOS Gayrimenkul Danışmanlık ve Değerleme A.Ş. on 08.01.2016. The results of the related
appraisal study are as indicated below.
Table 2: Property Values according to Expertise Reports – 31.12.2015 (Excluding VAT)
Properties Value
(EURO)
Akfen Share
Percentage (%)
Akfen Share
Amount (EURO)
Kaliningrad IBIS 15,524,000 95% 14,747,800
Samara IBIS 17,605,000 95% 16,724,750
Samara Ofıs 6,610,000 95% 5,795,000
Yaroslavl IBIS 15,190,000 95% 14,430,500
“Merit Park Otel” + Bafra Plot 77,769,000 100% 77,769,000
TOTAL 132,698,000 129,467,050
(Source: Akfen GT)
Appraisal Results
Discounted Cash Flow (“DCF”) method has been used in this report issued in order to assess the value
of Akfen GT. In the DCF method, the estimated operating volume (sales revenue) the Company is
projected to achieve and cash flows to be obtained from its operations (operating income +
depreciation) and the free cash flows it will obtain after tax payments and required operating costs
and fixed asset investments are covered are calculated. The cash projected to be generated for the
coming years is discounted by the weighted average cost of capital to obtain the current equivalent
value of cash flows. This value calculated is called the Enterprise Value and expressed the company
value by excluding financial liabilities. The Equity Value is calculated by deducting, if any, net financial
liabilities (financial liabilities – cash and cash equivalents) and if required, severance and notice pay,
and by adding if any, subsidiaries or non-operational other assets to the Enterprise Value.
The equity value of Akfen GT calculated by DCF method according to the analysis performed is
summarized in the table below:
8
Akfen GT – Company Appraisal Report
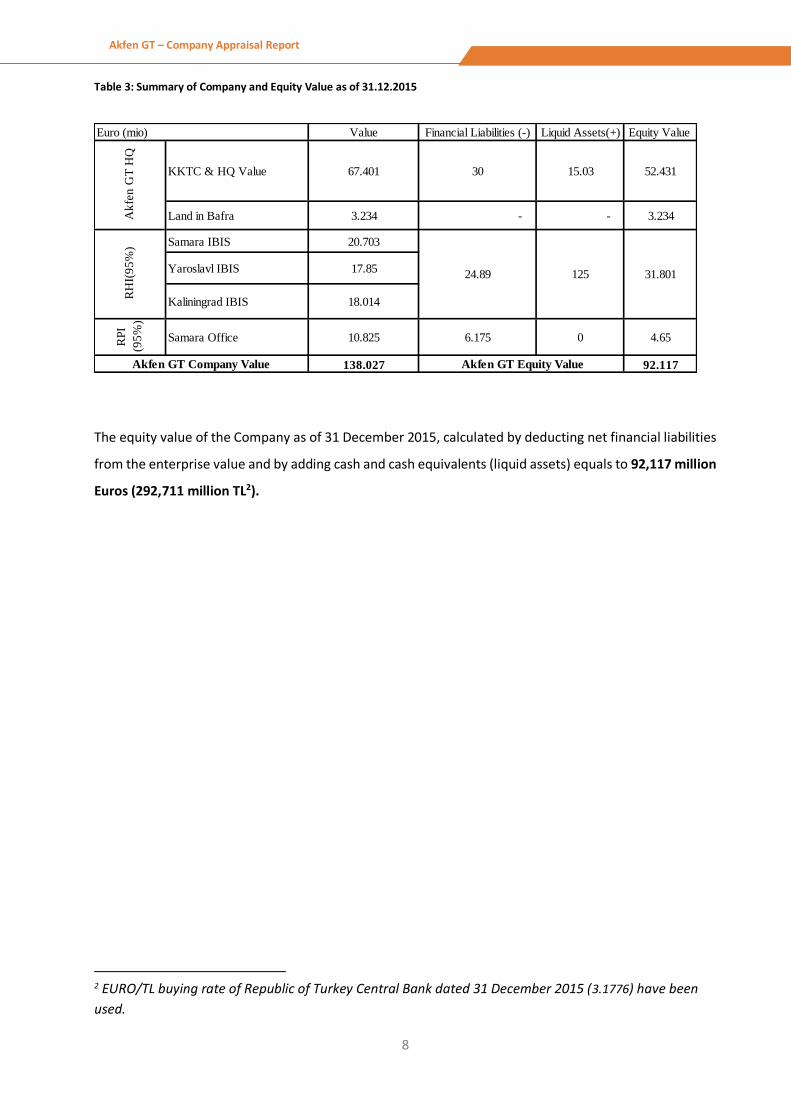
Table 3: Summary of Company and Equity Value as of 31.12.2015
The equity value of the Company as of 31 December 2015, calculated by deducting net financial liabilities
from the enterprise value and by adding cash and cash equivalents (liquid assets) equals to 92,117 million
Euros (292,711 million TL2).
2 EURO/TL buying rate of Republic of Turkey Central Bank dated 31 December 2015 (3.1776) have been
used.
Value Financial Liabilities (-) Liquid Assets(+) Equity Value
Land in Bafra 3.234 - - 3.234
Samara IBIS 20.703
Yaroslavl IBIS 17.85
RP
I
(95
%)
Samara Office 10.825 6.175 0 4.65
138.027 92.117Akfen GT Company Value Akfen GT Equity Value
52.431
24.89 125 31.801
Kaliningrad IBIS 18.014
RH
I(9
5%
)Euro (mio)
KKTC & HQ Value 67.401 30 15.03
Ak
fen
GT
HQ
9
Akfen GT – Company Appraisal Report
Opinions on Appraisal Results
Akfen GT is currently engaged in real estate projects such as the 5-star hotel it has purchased in TRNC,
Girne, the plot allocated in Bafra and other hotel and office projects in Russia.
The 5-star hotel located in TRNC has been in operation together with its casino since 2007, has been
rented out to Voyager Kıbrıs Ltd. Şti. According to the rental agreement signed on 15.05.2012 the 5-star
hotel, including the Casino has been rented by Voyager Kıbrıs Ltd. Şti since the beginning of 2013 for 20
years. It was noted that the name of the hotel was changed as “Merit Park Otel ve Casino” in the new
rental period. The Company realized various hotel and office projects through its subsidiaries in Russia
and these projects are operated by Accor, as well.
It was assumed that the 5-star hotel in TRNC will be rented out together with its casino. Further, the
Company has a plot of which it has acquired the allocation rights as of 30 December 2010 located in the
Bafra region of TRNC. The value of the aforementioned plot has been taken as the value indicated in the
expertise study dated 08.01.2016 of EPOS Gayrimenkul Danışmanlık ve Değerleme A.Ş.
The projects in Russia have been considered in this appraisal according to their investment value,
occupancy rates and rate assumptions indicated in the expertise report and as per the business plan of
the Company.
The Equity Value of the Company has been calculated as 92,117 million Euros (292,711 milyon TL3) in this
appraisal study.
The value of the Company has been calculated according to the current and potential business plans by
using the Discounted Cash Flow Method (DCF).
3 EURO/TL buying rate of Republic of Turkey Central Bank dated 31 December 2015 (3.1776) have been
used.
10
Akfen GT – Company Appraisal Report
Economy TRNC
Russia

11
Akfen GT – Company Appraisal Report
TRNC Economy
The economy of the TRNC (Turkish Republic of Northern Cyprus) is showing an increasingly growing trend
in line with the growth observed in the tourism sector.
The “Solving the Cyprus Problem” plan developed by the United Nations in 2003 and which is still being
negotiated and allowing free passage between Northern and Southern Regions of Cyprus have both
initiated and provoked positive improvements in the investment environment. As a result of the
improvement observed in the investment climate, during the 2003-2007 periods, the TRNC’s economy
became one of the highest growing economies amongst European countries and in this period, its growth
rate was around 6.5% annually on average.
TRNC Economy has recorded a decline of 2.9% and 5.5% respectively in 2008 and 2009 with the affect of
the global crisis. In 2010, with the effects of the crisis weakening on the markets and owing to measures
taken, the construction and building sector grew by 3.8%, the agriculture sector by 10.0% and trade
industry by 18.3% (43.2% of this growth observed in trade was due to import and 20.5% was due to export)
and the Gross Domestic Product rate increased by 3.7%. In 2011, with the growth of agriculture and trade,
two of the main sectors of the economy, TRNC Economy registered a growth of 3.9%. In the early periods
of 2012, the prevailing air of optimism in the U.S. economy and the Euro Zone disappeared and both
economic and political risks emerged particularly in EU countries. On top of that, the drought in the
agriculture sector and the increase of costs in the construction sector led to GDP growth declining and
registering a growth of 1.8% and 1.1% in 2012 and 2013 respectively. With the passing of the effects of
the risks, TRNC Economy increased its GDP growth back to 4.3% in 2014.
According to the macroeconomic foresights of TRNC State Planning Organization Report published in
September, 2015, GDP growth is projected to be 4.9% in 2015 and 3.5% annually between 2016-2018.
Graph 2: Growth Rates of TRNC Between 2007-2014 and growth forecasts for 2016-2018
Source: TRNC State Planning Organization Report September, 2015
2.8%
-2.9%
-5.5%
3.7% 3.9%
1.8%1.1%
4.3%4.9%
3.5% 3.5%
2007 2008 2009 2010 2011 2012 2013 2014 2015E 2016E 2017E
12
Akfen GT – Company Appraisal Report
Main factors behind the growth in TRNC’s economy are growths in the main sectors (the preparation of
Agricultural Master Plan, the restructuring of KIB-TEK, government electricity company, as an autonomous
institution) and the increasing import tax revenues as a result of improving foreign trade. Besides all these
positive developments in TRNC’s economy, it is still very fragile and is still in need of financing.
Russian Economy
Russia, as the major natural gas producer and the second largest petrol producer in the world, suffers
from the fall in oil prices and the economic sanctions imposed by European Union. Russian economy which
achieved a GDP of 2.1 trillion US Dollars in 2013, shrunk by 14.28% to declined to 1.2 trillion US Dollars in
2014. According to IMF World Economic Outlook 2015 report, as of October 2015, Russian economy
shrunk by 33% compared to 2014 and declined to 1.2 trillion US Dollars. As sanctions and low oil price
take effect, Russia became the 10th and 13th largest economy in 2014 and 2015 respectively, while it was
the 8th largest economy in the World according to its 2013 GDP figure.
Russia was adversely affected from the economic crisis towards the end of the year 2008 and the Russian
Economy shrank by 7.9% in 2009. The economy started improving in 2010 and an economical growth
equal to 4.8% in 2010 and 4.2% in 2011 was achieved. In 2011, with this percentage, Russia became the
3rd country with the highest growth rate in the world. In 2012 and 2013, Russia's growth decreased to
3.4% and 1.3% respectively, according to information released from the Russian State Institute of
Statistics, the major reasons of decline of growth are the decrease in the export of energy resources due
to the decrease in demand and economic stagnation in the Euro Zone, slowdown in consumer loans and
the decline in production of in mining and electricity industries. Due to the political instability caused by
the Ukranian dispute in 2014 and slumping oil prices in 2015, Russian economy is not expected to recover
in the near future. The country's growth forecast for 2015 and 2016 is given by the World Bank as
respectively -3.8% and -0.6%.
Russia had double-digit inflation rates in 2008-2009 yet, the inflation rate dropped down to one-digit
numbers in 2010 as a result of appreciation of ruble and low import rates and receded to 6.9%. Inflation
again increased in 2011 and although the inflation rate, which was around 8-9% at the beginning of 2011
dropped down to 6%; average inflation rate in 2011 was recorded as 8.5%. In 2012, inflation dropped to
5.1% with Russian economy’s improving performance and the figure is increased again, to the level of
6.8% in 2013. The inflation increased to 7.8% in 2014, and the inflation is expected to record its steepest
increase to 15.8% in 2015 according to IMF estimates.
13
Akfen GT – Company Appraisal Report
Sector World
TRNC
Russia
14
Akfen GT – Company Appraisal Report
Tourism Sector
Tourism Sector in the World
Tourism sector, rapidly growing and expanding since 1950 globally, is creating significant economic value
for many countries across the world and having both direct and indirect benefits to economies. As the
borders slowly disappear World began to shrink more and people began to be able to travel to longer
distances. Creating large employment opportunities owing to its labor-intensive nature and generating
added value in which regions and countries the sector is developing attach higher importance to the
tourism sector. Considered one of the largest industries contributing to economies, the sector continues
to grow and develop.
The tourism sector is a broad sector containing various activities, including touristic activities such as
holiday planning, accommodation, holiday organization/sales, and it further includes transportation, auto
rental, etc. activities not only of tourists, but of people who participate in such touristic activities.
With the globalization trend becoming preeminent since the 1980s, transportation and communication
have become much more accessible and, therefore, a mobile environment has been created. Further,
improving life standards has become another driving force behind the development of tourism. The sector
affects various items and areas such as holidays, travel tours, hotels, parks, museums, highways, travel
agencies, passenger transportation services, sports-health-culture tourism and offers employment
opportunities for people who are involved in these areas and, therefore, booms the economy by
increasing the expenditure of people who directly/indirectly create benefits in production.
The tourism sector has shown a tendency to stagnate during economic slowdown periods and tends to
improve and grow in line with the economy during economic recovery periods. The tourism sector also
strengthens other main sectors, such as transportation, service and retail sectors.
Along with its contribution to revenue, tourism also plays an important role in balancing the deficit faced
in balance of payments in foreign currencies. Depending on the demand for tourism sector, infrastructure
developments, increasing agricultural and industrial production, improvements in communication and
transportation systems, increased efficiency in mercantile and service businesses are expected. The
tourism sector, which is also an effective marketing and advertisement tool for countries, contributes to
international cultural and social communication.

15
Akfen GT – Company Appraisal Report
World tourism, which grew by 4.3% in the first 8 months of 2015 compared to the same period last year,
reached a record figüre with 810 million people. This figure, compared to the same period last year, shows
an increase of 33 million people.
According to the World Travel & Tourism Council 2015 Report, tourism sector, constitutes 3.1% of global
GDP when its direct effect is considered. Considering its direct and indirect effects, tourism sector
constitutes 9.8% of global GDP. Considering the effect on other sectors, the travel and tourism sector
constitutes 9.6% of global employment. Further, when travel and tourism sector is classified according to
foreign tourist numbers, leisure and business travels constitute 53% and 14% of respectively.
Travel and tourism industry is projected to grow with an annual average rate of 3.8%, reaching USD 11.3
trillion, which is 10.3% of the global GDP, in 10 years. Tourism sector is expected to constitute 10.7% of
global employment by 2025 when its direct and indirect effect is considered.
According to World Tourism Organization (WTO) 2015 Report, number of tourists travelling around the
world showed a growth of 4.4% and reaching 1.135 billion in 2014. It is explained in the report that, 4.4%
of growth is above the last 5 – year average. According to the same report, Europe is the most visited
region by tourists in 2014, with a share of 51% and approximately 584 million tourists. Regarding the
future expectations, number of tourists travelling is predicted to rise to 1.8 billion, 5 million people is
predicted to travel internationally, fastest growth in the sector is predicted to be in Asia-Pacific countries
and travels for visiting families, friends or with health purposes is predicted to dominate travels for leisure
and business purposes in 20304.
Graph 1: Breakdown of Number of Tourists (in Million People) and Shares (%) by Regions in 2014
Kaynak: World Travel & Tourism Council Report
4 World Travel & Tourism Council 2015
51%
23%
16%
4%5%Europe-584 Mn
Asia Pasicif-263 Mio
America-182 Mio
Middle East-50 Mio
Africa-56 Mio
16
Akfen GT – Company Appraisal Report
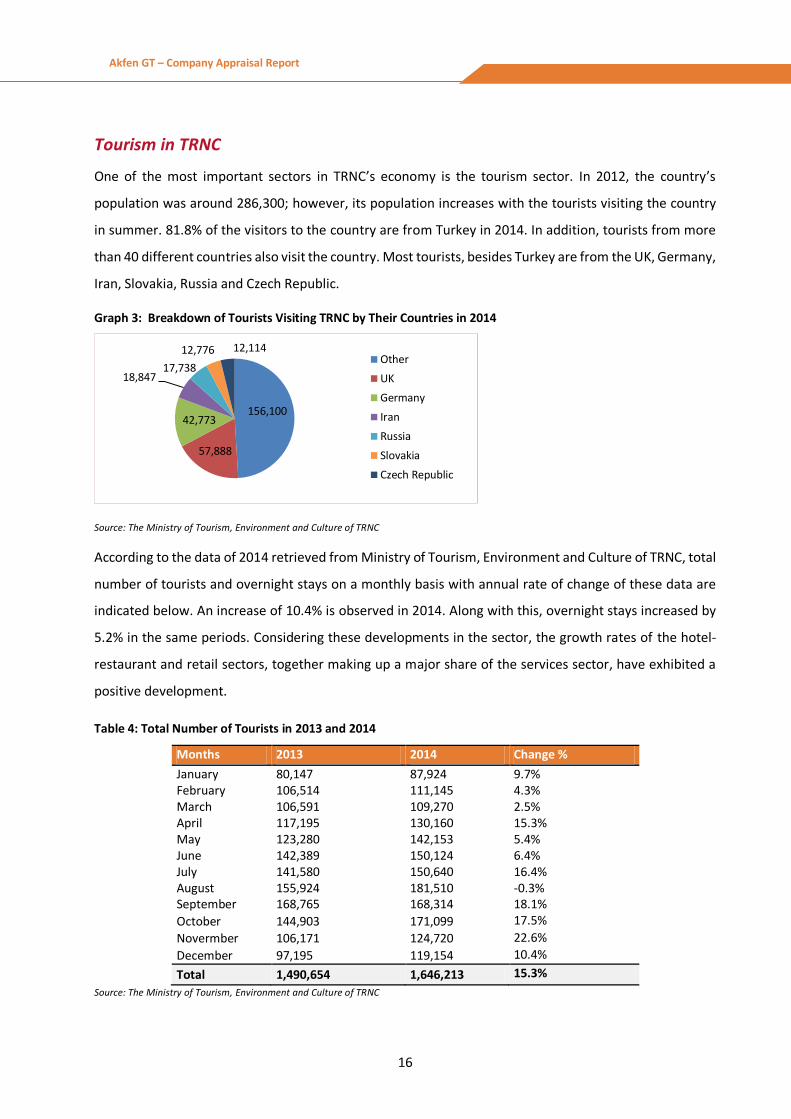
Tourism in TRNC
One of the most important sectors in TRNC’s economy is the tourism sector. In 2012, the country’s
population was around 286,300; however, its population increases with the tourists visiting the country
in summer. 81.8% of the visitors to the country are from Turkey in 2014. In addition, tourists from more
than 40 different countries also visit the country. Most tourists, besides Turkey are from the UK, Germany,
Iran, Slovakia, Russia and Czech Republic.
Graph 3: Breakdown of Tourists Visiting TRNC by Their Countries in 2014
Source: The Ministry of Tourism, Environment and Culture of TRNC
According to the data of 2014 retrieved from Ministry of Tourism, Environment and Culture of TRNC, total
number of tourists and overnight stays on a monthly basis with annual rate of change of these data are
indicated below. An increase of 10.4% is observed in 2014. Along with this, overnight stays increased by
5.2% in the same periods. Considering these developments in the sector, the growth rates of the hotel-
restaurant and retail sectors, together making up a major share of the services sector, have exhibited a
positive development.
Table 4: Total Number of Tourists in 2013 and 2014
Months 2013 2014 Change %
January 80,147 87,924 9.7% February 106,514 111,145 4.3% March 106,591 109,270 2.5% April 117,195 130,160 15.3% May 123,280 142,153 5.4% June 142,389 150,124 6.4% July 141,580 150,640 16.4% August 155,924 181,510 -0.3% September 168,765 168,314 18.1%
October 144,903 171,099 17.5%
Novermber 106,171 124,720 22.6%
December 97,195 119,154 10.4%
Total 1,490,654 1,646,213 15.3%
Source: The Ministry of Tourism, Environment and Culture of TRNC
156,100
57,888
42,773
18,847 17,738
12,776 12,114 Other
UK
Germany
Iran
Russia
Slovakia
Czech Republic

17
Akfen GT – Company Appraisal Report
Table 5: Total Number of Overnight Stays in 2013 and 2014
Nationality 2013 2014 Change %
Turkish 1,436,243 1,574,880 9.7%
Foreign 1,357,001 1,347,504 -0.7%
TRNC 84,320 103,485 22.7%
Total 2,877,564 3,025,869 5.2%
Source: The Ministry of Tourism, Environment and Culture of TRNC
According to the number of facilities recognized by the Ministry of Tourism, Environment and Culture of
TRNC, at the end of 2014 numbers of facilities rose by 2 and in total 147 facilities have been identified.
Graph 4: Number of Facilities in TRNC between 2012 and 2014
Source: The Ministry of Tourism, Environment and Culture of TRNC
On the other hand, looking at the bed capacity, there is a decline of up to 4.6% in the first 5 months of
2014, meanwhile the bed capacity increases by up to 3.7% through the rest of the year. In the monthly
occupancy rates, the most intense months have been observed to be in the period from June to October.
Occupancy rates have shown a minör decrease compared to the previous year, and the average occupancy
rate has decreased by 0.6%. Another noticeable point is that the yearly average occupancy rate of hotels
with casinos is at 51.7% while this figure stays at 39.8% for hotels without casinos.
Table 6: Total Bed Capacity in 2013 and 2014
Source: The Ministry of Tourism, Environment and Culture of TRNC
159
145147
2012 2013 2014
Months 2013 2014 Change %
January 19,405 18,522 -4.6
February 19,405 18,724 -3.5
March 19,413 18,748 -3.4
April 19,413 18,748 -3.4
May 19,187 18,784 -2.1
June 19,187 19,346 0.8
July 19,151 19,346 1.0
August 19,227 19,346 0.6
September 19,019 19,334 1.7
October 19,019 19,414 2.1
Novermber 18,766 19,452 3.7 December 18,766 19,276 2.7

18
Akfen GT – Company Appraisal Report
Table 7: Monthly Occupancy Rates (%)
Source: The Ministry of Tourism, Environment and Culture of TRNC
When the occupancy rates for 2014 are examined, Gazimağusa has the highest occupancy rate with
60.0%, followed by Girne with 51.8% and Lefkoşa with 40.5%.
Table 8: Occupancy Rates according to Cities in 2014
Source: The Ministry of Tourism, Environment and Culture of TRNC
Considering the number of hotels as of 2014, the city of Girne currently with 91 hotels ranks the first with
61.9% of the total number of hotels in TRNC. The same ranking is also valid in terms of number of beds.
The city of Gazimağusa, which has the highest occupancy rate, has 6.8% of the total number of hotels and
bed capacity and ranks the 3rd in the number of hotels ranking with 10 hotels located in the city.
Months 2013 (%) 2014 (%) Change %
January 23.6 23.8 0.8
February 25.2 22.3 -11.5
March 36.4 34.4 -5.5
April 41.4 42.5 2.7
May 48.3 49.6 2.7
June 61.4 59.4 -3.3
July 68.2 61.7 -9.5
August 75.1 74.5 -0.8
September 64.5 64.2 -0.5
October 55.2 57.4 4
November 38.8 43.5 12.1
December 25.7 30.9 20.2
Average 47.3 47.6 -0.6
City Share %
Gazimağusa 60.0
Girne 51.8
Lefkoşa 40.5
İskele 30.9
Güzelyurt 7.2

19
Akfen GT – Company Appraisal Report
Table 9: Number of Hotels according to Cities in 2014
City Number of Hotels Share % Number of Beds Share%
Girne 91 62.0 13,227 66.6
İskele 37 25.1 4,107 20.7
Gazimağusa 10 6.8 1,576 7.9
Lefkoşa 5 3.4 843 4.2
Güzelyurt 4 2.7 126 0.6
Total 147 100 19,857 100 Source: The Ministry of Tourism, Environment and Culture of TRNC
In the following table the total existing hotels in TRNC as of 2014 are ranked according to their qualities.
According to the data, most preferred facilities in the region are bungalow houses with 30 units, 1 star
hotels with 18 units, guest houses with 17 units and 5 star hotels with 17 units. 5 star hotels have the
highest bed capacity, and they cover 52.0% of residential needs of tourism with a total of 10,318 beds.
Table 10: Number of Hotels according to their Types
Type Number of Facilities Share% Number of Beds Share%
Five Star Hotels 17 11.56 10,318 51.96
Four Star Hotels 4 2.72 1,346 6.78
Three Star Hotels 10 6.80 1,798 9.05
Two Star Hotels 18 12.24 1,368 6.89
One Star Hotels 18 12.24 663 3.34 Hotels with private certificates 1
0.68 34 0.17
2nd class holiday resorts 5 3.40 486 2.45
Bungalow houses 5 3.40 862 4.34
Apart Hotels 30 20.41 1,661 8.36
Guesthouse 2 1.36 96 0.48
Boutique Hotels 3 2.04 96 0.48
Local Houses 17 11.56 218 1.10
Indoor Facilities 1 0.68 108 0.54
Other 16 10.88 803 4.04
Total 147 100 19,857 100 Source: The Ministry of Tourism, Environment and Culture of TRNC

20
Akfen GT – Company Appraisal Report
Tourism in Russia
Russia has a population of approximately 143.8 million as of 2014, and the country’s travel and tourism
sector constituted 6.1% of the total economic output with the size of 140.9 billion US Dollars. The
contribution of travel and tourism sector to GDP is based mainly on the number of visitors arriving to the
country in question. Russia attracted 28.1 million tourists in 2014 achieving 19.1 billion US Dollars tourism
exports. It is forecasted that the number of tourists will decrease by 2.7% and 27.4 million in 2015. In
addition, number of tourists is expected to reach 52.2 million in 2025 creating a value of 30 billion US
Dollars. Total product of the tourism sector, with around 143.5 billion US Dollars size, is expected to
decrease by 6.3% in 2015 and will increase at an annual average of 3.0% reaching 143.4 billion US Dollars
in 2025. However, it is expected that the Ukrainian political dispute and tensions with Turkish government
will cause negative effect on tourism sector output in 2015.
According to the Russian Tourism Industry Association estimates, due to the sharp fall in Russian rubles
against U.S. dollar, in the first 9 month of 2015, number of visitors has increased 13% compared to the
same period last year. According to the same estimates, Chinese tourists became the largest group of
foreign tourists to Russia which constitutes 22.9% of whole tourists, pushing American and Turkish tourists
2nd and 3rd place which constitute 12.6% and 4.6% of whole tourists respectively. According to the same
estimates, the tourist ouflow from Russia declined by 31.4% due to the sharp fall in Russian rubles. It is
expected that the Ukrainian political dispute, tensions with Turkish government and plane crash in Egypt
will both affect tourist inflow and outflow in Russia.
Moreover, the number of Turkish tourists are expected to decrease under Russia’s economic sanctions to
Turkey which also contains suspension of visa-free regime with Turkey. The increasing number of Turkish
tourists is one of the main sources of number of total tourists visiting Russia in the first 9 month of 2015.
It reveals the fact that, suspension of visa-free regime with Turkey may have some potential effects on
Russian tourism in upcoming years.
The on going economic crisis in Russia also affects the number of companies selling foreign tours to
Russian tourists. According to the Russian Tour Operators Association, the number of tour operators were
2,050 before crisis, whereas they are 650 as of December, 2015. The main reason behind the fall is seen
as the sharp decline in Russian ruble against U.S Dollar which results in a large fall in Russian tourists’
disposable income. Russian tour operators also suffer from bans against Turkey and Egypt which suspend
selling package tours. According to the Russian Tour Operators Association, in the best-case scenario, the
number of tour operators is expected to be 500 tour companies whereas in the worst-case scenario, 300.
21
Akfen GT – Company Appraisal Report
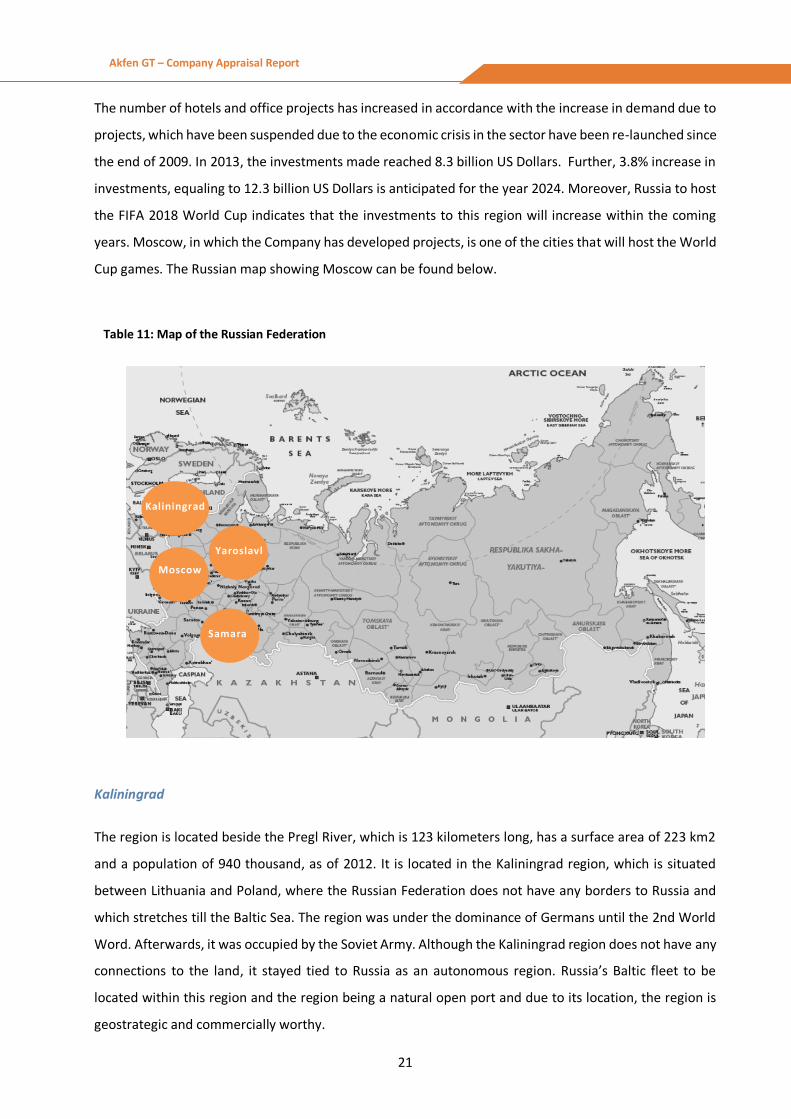
The number of hotels and office projects has increased in accordance with the increase in demand due to
projects, which have been suspended due to the economic crisis in the sector have been re-launched since
the end of 2009. In 2013, the investments made reached 8.3 billion US Dollars. Further, 3.8% increase in
investments, equaling to 12.3 billion US Dollars is anticipated for the year 2024. Moreover, Russia to host
the FIFA 2018 World Cup indicates that the investments to this region will increase within the coming
years. Moscow, in which the Company has developed projects, is one of the cities that will host the World
Cup games. The Russian map showing Moscow can be found below.
Table 11: Map of the Russian Federation
Kaliningrad
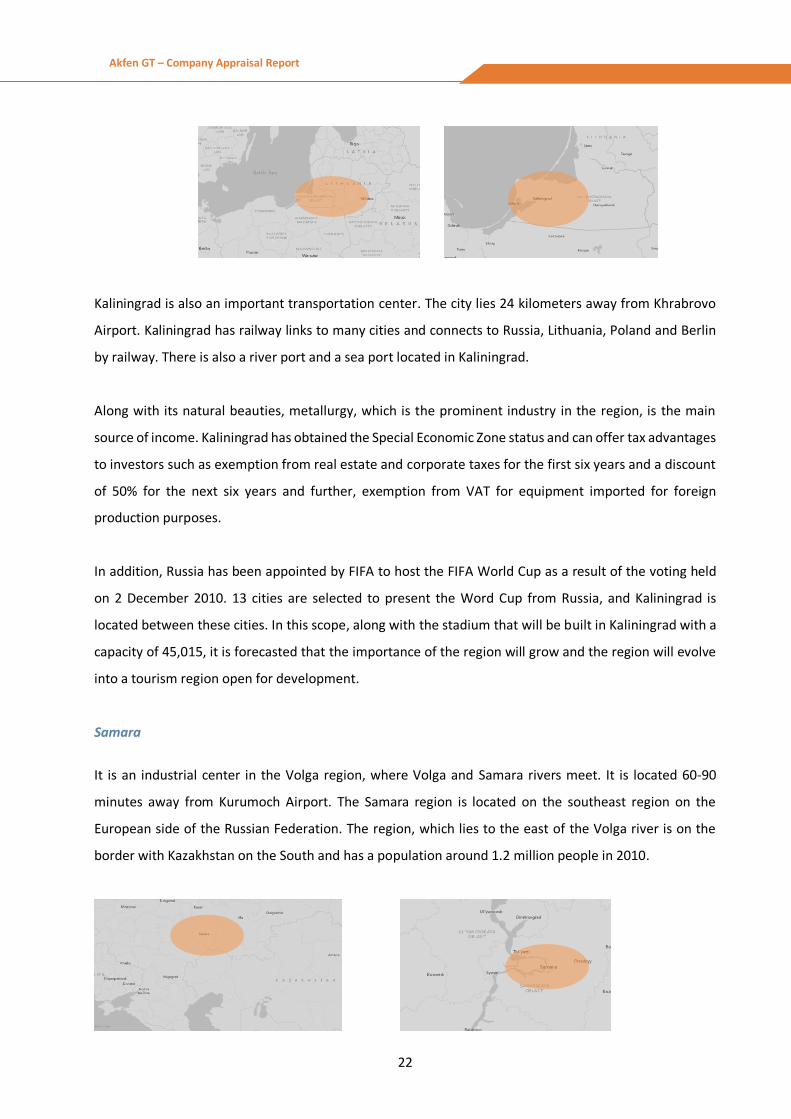
The region is located beside the Pregl River, which is 123 kilometers long, has a surface area of 223 km2
and a population of 940 thousand, as of 2012. It is located in the Kaliningrad region, which is situated
between Lithuania and Poland, where the Russian Federation does not have any borders to Russia and
which stretches till the Baltic Sea. The region was under the dominance of Germans until the 2nd World
Word. Afterwards, it was occupied by the Soviet Army. Although the Kaliningrad region does not have any
connections to the land, it stayed tied to Russia as an autonomous region. Russia’s Baltic fleet to be
located within this region and the region being a natural open port and due to its location, the region is
geostrategic and commercially worthy.
Moscow
Kaliningrad
Yaroslavl
Samara
22
Akfen GT – Company Appraisal Report
Kaliningrad is also an important transportation center. The city lies 24 kilometers away from Khrabrovo
Airport. Kaliningrad has railway links to many cities and connects to Russia, Lithuania, Poland and Berlin
by railway. There is also a river port and a sea port located in Kaliningrad.
Along with its natural beauties, metallurgy, which is the prominent industry in the region, is the main
source of income. Kaliningrad has obtained the Special Economic Zone status and can offer tax advantages
to investors such as exemption from real estate and corporate taxes for the first six years and a discount
of 50% for the next six years and further, exemption from VAT for equipment imported for foreign
production purposes.
In addition, Russia has been appointed by FIFA to host the FIFA World Cup as a result of the voting held
on 2 December 2010. 13 cities are selected to present the Word Cup from Russia, and Kaliningrad is
located between these cities. In this scope, along with the stadium that will be built in Kaliningrad with a
capacity of 45,015, it is forecasted that the importance of the region will grow and the region will evolve
into a tourism region open for development.
Samara
It is an industrial center in the Volga region, where Volga and Samara rivers meet. It is located 60-90
minutes away from Kurumoch Airport. The Samara region is located on the southeast region on the
European side of the Russian Federation. The region, which lies to the east of the Volga river is on the
border with Kazakhstan on the South and has a population around 1.2 million people in 2010.

23
Akfen GT – Company Appraisal Report
Samara ranks as one of the ten cities in Russia in terms of income and industrial volume. The Samara
region accommodates many diverse industries such as automobile, energy, metal processing and petro
chemistry, chemicals, construction materials, space ships, engine and cables. Further, the region has rich
petrol and natural gas resources.
Samara has many historical artifacts, which attracts many tourists’ attention. The most scenic and the
longest stretch of the Volga River also lie in this region. The Samara region has convenient transport links
to many other cities via railways and highways. It is considered as a developing region in terms of tourism
and it has an important potential in terms of new hotels and facilities. Many festivals are organized by the
Mastrukovski lakes of Volga during the summer time and the population of the city increases during the
summer.
Another factor supporting the potential of tourism in the region is the stadium that will be built in Samara,
like Kaliningrad, for the World Cup that will take place in 2018. With the 44,918 people capacity stadium
importance of the region will increase and the region is expeced to become a tourism region, open for
development.
Yaroslavl
The city of Yaroslavl is located in the north east of and 250 kilometers away from the city center of
Moscow, north of Russia on the Volga basin. The city has a population of around 595 thousand in 2010.
Due to the proximity of the city to Moscow and being located by the Volga River makes Yaroslavl unique
when compared to other cities of the Russian Federation as it has a vast historical heritage and is under
the protection of Unesco. City is located on very strategic transportation routes, which is another
advantage. In ancient times, the city was situated on the intersection point of the Volga and Kotorosl
rivers and the historical parts of the city have been selected as a Unesco world heritage site.
24
Akfen GT – Company Appraisal Report
The city is expected to have a high potential for tourism and around 2.5 million visitors are estimated to
have visited the city by 2014. Cruise tourism, culture tourism and business tourisms are the most
important areas within the tourism sector. Similar to the cities mentioned above, the ongoing
construction of 44,042 capacity stadium within the scope of the World Cup that will take place in 2018 is
expected to increase the importance of the region and help the region evolve into a tourism region open
for development.
Being one of the Golden Ring cities together with being listed in UNESCO World Heritage played an
important role in building a cultural heritage in the city. In addition to its culture tourism, cruise tourism
and business tourism, induced by international congresses organized every year, makes the city attraction
center.
25
Akfen GT – Company Appraisal Report
General Overview of the Future for the Sector
According to the World Travel and Tourism Report published in 2015 by the World Travel Tourism Council,
when the effects of tourism to other sectors is also examined, the tourism and travel sector, which started
recovering from the adverse effects of the economic crisis in the second half of 2010 accounted for 9.8%
of the global gross product and the turnover was around USD 7.6 trillion in 2014. It is estimated that the
sector will grow annually on average by 3.8% until 2025, will reach USD 11.4 trillion turnover.
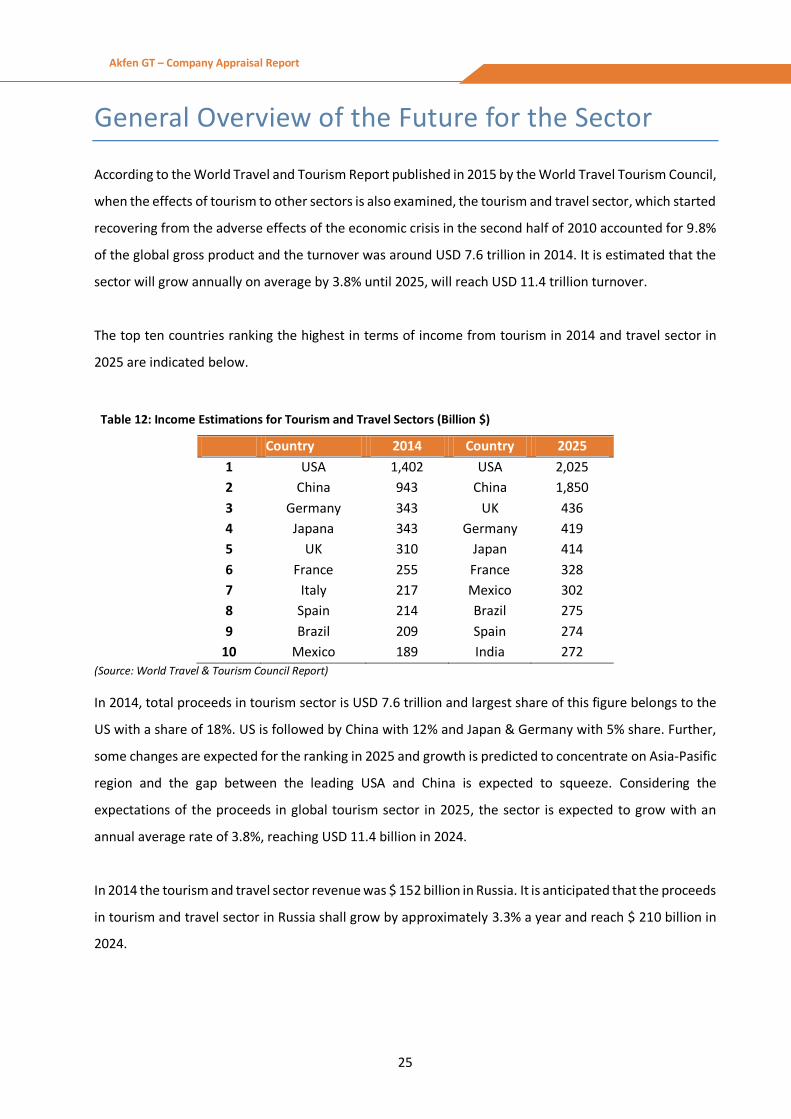
The top ten countries ranking the highest in terms of income from tourism in 2014 and travel sector in
2025 are indicated below.
Table 12: Income Estimations for Tourism and Travel Sectors (Billion $)
Country 2014 Country 2025
1 USA 1,402 USA 2,025
2 China 943 China 1,850
3 Germany 343 UK 436
4 Japana 343 Germany 419
5 UK 310 Japan 414
6 France 255 France 328
7 Italy 217 Mexico 302
8 Spain 214 Brazil 275
9 Brazil 209 Spain 274
10 Mexico 189 India 272 (Source: World Travel & Tourism Council Report)
In 2014, total proceeds in tourism sector is USD 7.6 trillion and largest share of this figure belongs to the
US with a share of 18%. US is followed by China with 12% and Japan & Germany with 5% share. Further,
some changes are expected for the ranking in 2025 and growth is predicted to concentrate on Asia-Pasific
region and the gap between the leading USA and China is expected to squeeze. Considering the
expectations of the proceeds in global tourism sector in 2025, the sector is expected to grow with an
annual average rate of 3.8%, reaching USD 11.4 billion in 2024.
In 2014 the tourism and travel sector revenue was $ 152 billion in Russia. It is anticipated that the proceeds
in tourism and travel sector in Russia shall grow by approximately 3.3% a year and reach $ 210 billion in
2024.

26
Akfen GT – Company Appraisal Report
Table 13: Proceeds of Tourism and Travel Sector
(Source: World Travel & Tourism Council Report)
In 2014, the investments in tourism accounted for 4.3% of all investments and equaled to USD 814 billion.
It is anticipated that this figure will increase annually by 4.6% on average and reach USD 1.34 trillion level
till 2025 and tourism’s share in all investments will increase to 4.9%.
Billion $ 2014 2025T Average Annual Growth %
World 7,581 11,382 3.9 %
Russia 152 210 3.3%

27
Akfen GT – Company Appraisal Report
The Company
28
Akfen GT – Company Appraisal Report
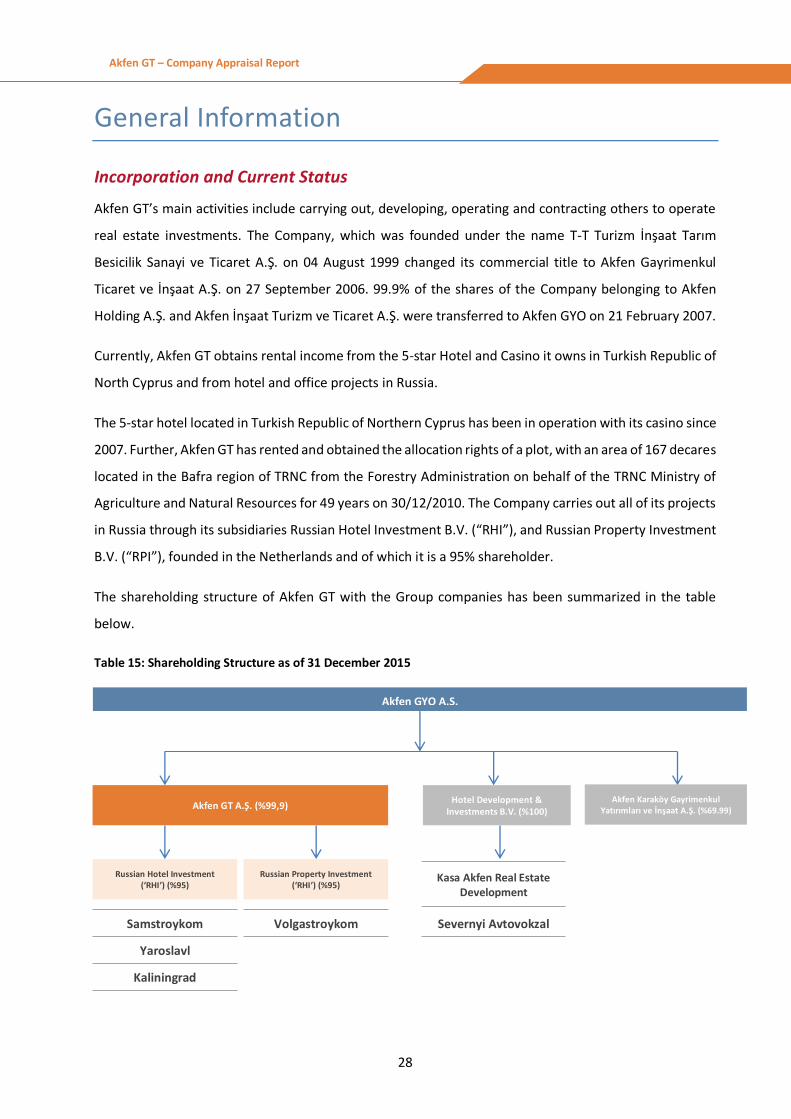
General Information
Incorporation and Current Status
Akfen GT’s main activities include carrying out, developing, operating and contracting others to operate
real estate investments. The Company, which was founded under the name T-T Turizm İnşaat Tarım
Besicilik Sanayi ve Ticaret A.Ş. on 04 August 1999 changed its commercial title to Akfen Gayrimenkul
Ticaret ve İnşaat A.Ş. on 27 September 2006. 99.9% of the shares of the Company belonging to Akfen
Holding A.Ş. and Akfen İnşaat Turizm ve Ticaret A.Ş. were transferred to Akfen GYO on 21 February 2007.
Currently, Akfen GT obtains rental income from the 5-star Hotel and Casino it owns in Turkish Republic of
North Cyprus and from hotel and office projects in Russia.
The 5-star hotel located in Turkish Republic of Northern Cyprus has been in operation with its casino since
2007. Further, Akfen GT has rented and obtained the allocation rights of a plot, with an area of 167 decares
located in the Bafra region of TRNC from the Forestry Administration on behalf of the TRNC Ministry of
Agriculture and Natural Resources for 49 years on 30/12/2010. The Company carries out all of its projects
in Russia through its subsidiaries Russian Hotel Investment B.V. (“RHI”), and Russian Property Investment
B.V. (“RPI”), founded in the Netherlands and of which it is a 95% shareholder.
The shareholding structure of Akfen GT with the Group companies has been summarized in the table
below.
Table 15: Shareholding Structure as of 31 December 2015
Akfen GYO A.Ş.
Akfen GT A.Ş. (%99,9)
Russian Hotel Investment (‘RHI’) (%95)
Samstroykom
Yaroslavl
Kaliningrad
Russian Property Investment (‘RHI’) (%95)
Volgastroykom
Hotel Development & Investments B.V. (%100)
Akfen Karaköy Gayrimenkul Yatırımları ve İnşaat A.Ş. (%69.99)
Severnyi Avtovokzal
Kasa Akfen Real Estate Development

29
Akfen GT – Company Appraisal Report
Shareholding and Capital Structure
The subscribed capital of the Company has been increased from 100 million TL to 121 million TL as of 27
December, 2012, and this capital increase was paid in cash and was announced on the Official Bulletin of
Turkish Trade Registry.
Table 16: Share Distribution as of 31 December 2015
Shareholders Number of Shares (TL) Shareholding Percentage (%)
Akfen GYO A.Ş. 121,000,000 100%
(Source: Akfen GT)
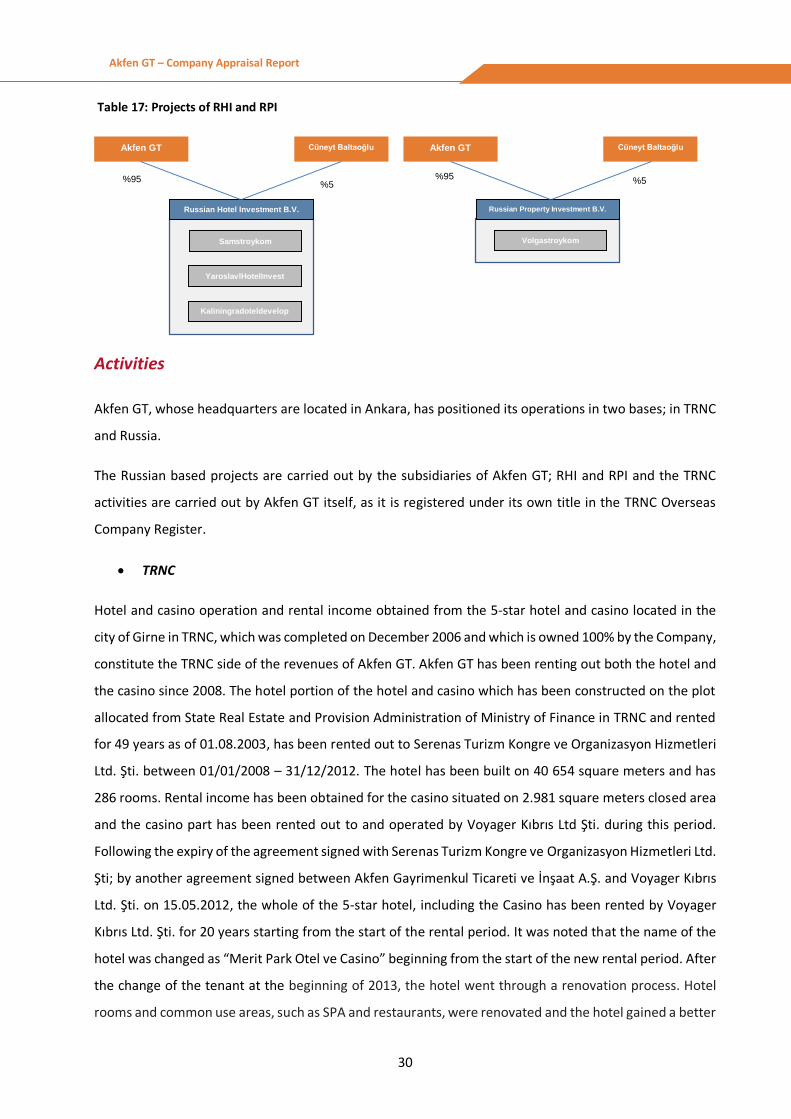
Subsidiaries
Akfen GT has two subsidiaries founded in the Netherlands. One of these subsidiaries is Russian Hotel
Investment B.V.(“RHI”) and the other one is Russian Property Investment B.V. (“RPI”).
From these subsidiaries, RHI was founded under an equal 50 to 50% partnership structure between Akfen
GT and Estern European Investment Ltd (“EEPI”) on 21 September 2007 in order to realize hotel projects
in Russia. EEPI transferred 45% of its shares in RHI to Kasa Investments B.V. and 5% to Cüneyt Baltaoğlu
on 28 December 2010 and Kasa Investments B.V. transferred its 45% share to Akfen GT on 29 July 2011
and Akfen GT’s shares in RHI has increased to 95% and 5% of RHI is still owned by Cüneyt Baltaoğlu.
Due to the legal requirements in Russia under the current regulations, a new company is required to be
founded for a hotel project and therefore, all these companies established for realizing hotel projects in
Russia are situated under the umbrella of RHI. The companies founded to carry out the hotel projects which
are under the control of RHI have been indicated in Table 3.3.
RPI was founded by the joint venture of Akfen Gayrimenkul Geliştirme ve Tic. A.Ş. and Eastern European
Property Investment Ltd (“EEPI”) on 8 January 2008, to carry out office projects in Russia and all companies
founded on project basis are gathered under the umbrella of RPI. Akfen GT took over the share of Akfen
Gayrimenkul Geliştirme ve Tic. A.Ş. on 5 June 2009. Besides the Samara Office project which is still ongoing,
all companies under the structure of RPI are currently inactive. Eastern European Property Investment Ltd.
(EEPI), respectively transferred 45% of its shares in RPI to Kasa Investments B.V. and 5% of its shares to
Cüneyt Baltaoğlu on 21 December 2010 and then, Kasa Investments B.V. transferred its 45% share to Akfen
GT on 29 July 2011 and Akfen GT’s shares in RHI has increased to 95% and 5% of RHI is still owned by Cüneyt
Baltaoğlu.
30
Akfen GT – Company Appraisal Report
Table 17: Projects of RHI and RPI
Activities
Akfen GT, whose headquarters are located in Ankara, has positioned its operations in two bases; in TRNC
and Russia.
The Russian based projects are carried out by the subsidiaries of Akfen GT; RHI and RPI and the TRNC
activities are carried out by Akfen GT itself, as it is registered under its own title in the TRNC Overseas
Company Register.
TRNC
Hotel and casino operation and rental income obtained from the 5-star hotel and casino located in the
city of Girne in TRNC, which was completed on December 2006 and which is owned 100% by the Company,
constitute the TRNC side of the revenues of Akfen GT. Akfen GT has been renting out both the hotel and
the casino since 2008. The hotel portion of the hotel and casino which has been constructed on the plot
allocated from State Real Estate and Provision Administration of Ministry of Finance in TRNC and rented
for 49 years as of 01.08.2003, has been rented out to Serenas Turizm Kongre ve Organizasyon Hizmetleri
Ltd. Şti. between 01/01/2008 – 31/12/2012. The hotel has been built on 40 654 square meters and has
286 rooms. Rental income has been obtained for the casino situated on 2.981 square meters closed area
and the casino part has been rented out to and operated by Voyager Kıbrıs Ltd Şti. during this period.
Following the expiry of the agreement signed with Serenas Turizm Kongre ve Organizasyon Hizmetleri Ltd.
Şti; by another agreement signed between Akfen Gayrimenkul Ticareti ve İnşaat A.Ş. and Voyager Kıbrıs
Ltd. Şti. on 15.05.2012, the whole of the 5-star hotel, including the Casino has been rented by Voyager
Kıbrıs Ltd. Şti. for 20 years starting from the start of the rental period. It was noted that the name of the
hotel was changed as “Merit Park Otel ve Casino” beginning from the start of the new rental period. After
the change of the tenant at the beginning of 2013, the hotel went through a renovation process. Hotel
rooms and common use areas, such as SPA and restaurants, were renovated and the hotel gained a better
Russian Hotel Investment B.V.
Akfen GT
YaroslavlHotelInvest
Kaliningradoteldevelopment
Russian Property Investment B.V.
Volgastroykom
%95
Cüneyt Baltaoğlu
%5
Akfen GT Cüneyt Baltaoğlu
%95 %5
Samstroykom
31
Akfen GT – Company Appraisal Report
outlook as part of renovation process. According to Merit Park Otel’s architectural project, the number of
rooms, which were 299 before the renovation process, decreased to 286 as 13 rooms merged by pulling
down intermediary walls.
The tenant Voyager Kıbrıs Limited is paying an annual rent of EUR4,750,000.00 to Akfen GT for the hotel
and the casino. Based on the contract, the annual rent shall be fixed for the first five years and on the
following 6th and 7th years, if Euribor is under 2%; the rent increase shall equal to Euribor and if it is above
2%, the rent shall increase by 2%. In the following 8th, 9th and 10th years, the rent shall be updated
according to changes in Euribor rates.
Russia
The other part of Akfen GT’s activities consists of hotel and office investment projects in Russia. As
indicated above, the Company realizes its operations related with the hotel and office projects in Russia
through its subsidiaries; RHI and RPI.
The hotel and office projects are as indicated in the table below.
Table 18: Russia Projects
The Hotel and Office
Projects
Number of
Rooms
Commencement
Date
Operation
Date Plot Are (m2) Total Area (m2)
Samara IBIS 204 07/2009 03/2012 2,466 9,961
Yaroslavl lBIS 177 04/2010 09/2011 4,468 7,916
Kaliningrad IBIS 167 08/2011 08/2013 5,099 6,322
Samara Ofis - 07/2009 01/2012 1,048 6,510
(Source: Akfen GT)
As of 8 September 2011, Yaroslavl IBIS Hotel has been open and is now in operation. Samara IBIS Hotel
commenced its activities in March 2012 and Kaliningrad Ibis Hotel started operating its activities in August
2013. Construction of Samara Office was completed in January 2012. 1,562 m2 was rented to OAO Bank
VTB based on the contract signed in March, 1, 2013; 1,869 m2 was rented to Rosneft Oil Company for 24
months based on the contract signed in December, 2, 2013; 746 m2 was rented to Samarasnabpodshipnik,
a subsidiary of Samara Podshibnik, the biggest bearing manufacturers of Russia, as a sales office, based
on the contract signed on February, 19, 2014.
32
Akfen GT – Company Appraisal Report
Financial Analysis
The consolidated condensed, unaudited financial tables of Akfen GT for the years 2013-2014 and 2015
year-end are as indicated below. The financial data of Akfen GT Headquarters and Akfen GT TRNC have
been consolidated by the Company in accordance with the international financial reporting standards.
However, the investments of RHI and RPI have been included in the investment properties and investment
properties in progress item.
Table 19: Balance Sheet of Akfen GT
CONSOLIDATED BALANCE SHEET OF AKFEN GAYRİMENKUL TİCARET VE İNŞAAT A.Ş
Source: Akfen GT
Balance Sheet € 31.12.2013 31.12.2014 31.12.2015
Current Assets 9,946,323 10,270,480 32,247,644
Cash and Cash Equivalents 7,294,493 7,008,403 15,166,587
Trade Receivables 823,954 2,485,868 3,269,846
Other Receivables 12,697 624,910 13,315,569
Other Current Assets 1,815,180 151,299 495,642
Fixed Assets 159,376,418 132,631,248 137,994,503
Other Receivables 3,304,994 3,500,863 5,329,030
Financial Investments 0 60 108
Investments assessed with Equity method 0 0 0
Investment Properties and Investment Properties in Progress 154,237,806 127,536,029 130,560,857
Tangible Fixed Assets 21,067 1,907 4,398
Other Fixed Assets 1,812,551 1,592,388 2,100,110
Total Assets 169,322,741 142,901,728 170,242,147
Short-Term Liabilities 7,491,341 8,948,402 4,723,815
Financial liabilities 6,081,189 7,029,210 3,985,789
Trade liabilities 1,162,842 839,670 78,550
Other liabilities 205,829 1,075,713 654,913
Other short-term liabilities 41,480 3,809 4,563
Long-Term Liabilities 55,178,250 45,319,737 71,919,306
Financial liabilities 43,179,429 36,501,154 59,093,832
Deferred tax liability 11,998,821 8,818,583 12,825,474
Equity 106,653,151 88,633,589 93,599,027
Paid-in Capital 40,351,644 41,174,118 34,925,624
Share capital adjustments 0 -90,035 -79,923
Effect of merges under joint control -191,386 -199,101 -176,738
Foreign currency conversion adjustments -9,576,686 -28,826,659 -35,076,649
Previous year’s profit/(losses) 64,052,074 73,950,155 65,191,474
Net term profit 9,898,081 -8,758,681 18,382,366
Minority interests 2,119,424 11,383,792 10,432,873
Total Liabilities 169,322,741 142,901,728 170,242,147
33
Akfen GT – Company Appraisal Report
The balance sheet of the Company has been converted to EUR by using the term end foreign exchange
purchase rates of Central Bank of Turkey as indicated in the table below:
Table 20: Central Bank of Turkey term-end foreign exchange purchase rates
2013 2014 2015
EURO/TL (Term end exchange rate) 2.9344 2.8207 3.1776
(Source: Central Bank of Turkey)
The income statement of the Company has been converted to EUR by using the average foreign exchange
purchase rates of Central Bank of Turkey as indicated in the table below:
Table 21: Central Bank of Turkey Average foreign exchange purchase rates
2013 2014 2015
EURO/TL (Average Rate) 2.5254 2.9042 3.0183
(Kaynak: T.C.M.B.)
The total assets of Akfen GT as of the end of 2015, equals to 169.5 million Euros. 76.7% of these assets
are investment properties.
The investment properties account consists of the 5-star hotel located in the city of Girne in TRNC, which
undergoes assessment on yearly basis and the subsidiaries of the company RHI and RPI.
Trade receivables account stems from the hotel operator for Akfen GT hotels in Russia. Aforementioned
hotels started to go into operation since 2011 and rental income for Samara IBIS, opened in 2012, and for
Kaliningrad IBIS, opened in 2013, increased the trade receivables account.
"Other Current Assets" and "Other Fixed Assets", being one of the major items in Company Balance Sheet,
mainly covers deferred VAT. "Trade Receivables" account consists of rent receivables from operating
hotels in Russia.
42.2% of the liabilities of the Company Balance Sheet as of the end of 2015, consist of long-term liabilities.
Long-term financial liabilities, constituting 34.7% of the liabilities of the Company, covers loans used for
hotel projects in TRNC and Russia.
34
Akfen GT – Company Appraisal Report
All long term loans of the Company are loans borrowed in Euro currency. Long-term Russian loans used
for Samara Ibis, Yaroslavl Ibis and Kaliningrad Ibis are all Euro currency loans obtained from Credit Europe
Bank and for these loans, the Company is obliged to pay a fixed interest of 6.4%. The maturity date of
loans for the Russian assets are 28 July 2025. The Company has borrowed 29.5 million Euro from
Fibabanka on 6 November 2015 and 500 thousand Euro from Credit Europe Bank regarding TRNC
operations. The Company will be paying on average a fixed interest of 6.4% for these loans and the
maturity date is 30 July 2025.
"Trade Payables" item of the Company consists of payables to contractors for hotel projects in Russia.
"Other Short-term Liabilities" item covers mainly deferred income.
The subscribed capital of the Company has been increased from 100 million TL to 121 million TL as of 27
December, 2012, and this capital increase was paid in cash and was announced on the Official Bulletin of
Turkish Trade Registry.
Table 22: Income Statement of Akfen GT
INCOME STATEMENT OF AKFEN GAYRİMENKUL TİCARET VE İNŞAAT A.Ş.
(Source: Akfen GT)
The main income of the Company for the years examined consists of the rental income obtained from the
hotel and the casino.
Income Statement € 31.12.2013 31.12.2014 31.12.2015
Sales Revenues 7,231,813 9,303,899 9,429,400
Cost of Sales -468,169 -281,399 -353,110
Gross Profit 6,763,644 9,022,500 9,076,290
General administration expenses -1,065,068 -371,298 -574,842
Appreciation of investment properties, net 0 0 0
Appreciation of investment properties in progress 0 0 0
Other income 17,522,375 22,483 21,175,420
Other operating expenses -977,898 -3,873,544 -25,328
Operating Profit 22,243,054 4,800,140 29,651,539
Share in loss of investments assessed with the Equity method 0 0 0
Financial income 10,371,822 3,447,571 5,556,627
Financial expenses -19,030,824 -20,735,636 -13,202,692
Profit before Tax 13,584,053 -12,487,925 22,005,474
- Deferred tax income/loss -3,844,966 2,868,575 -4,987,780
Net Term Profit 9,739,086 -9,619,350 17,017,694
Non controlling interests -158,995 -860,669 -1,364,672

35
Akfen GT – Company Appraisal Report
Expectations from the Future and
Appraisal
36
Akfen GT – Company Appraisal Report
Appraisal Method
There are various methods that can be used for valuation of companies. These range from methods based
solely on the future performance of a company (cash generation, dividend yield, etc.) to approaches that
re-assess the value of current assets of a company (re-construction or sell-off) or comparison of current
and future size of a company to similar companies operating within the markets and assessment based
on price multipliers based on elected market indicators.
In this study carried out in order to assess the value of Akfen GT, the Discounted Cash Flow (DCF) method
has been utilized. In the DCF method, the estimated operating volume (sales revenue) the Company is
projected to achieve and cash flows to be obtained from its operations (operating income + depreciation)
and the free cash flows it will obtain after tax payments and required operating costs and fixed assets are
covered are calculated. The cash flows projected on a yearly basis are discounted by a certain rate to
reach the current value of cash flows. The Discount rate is the weighted average cost of capital reflecting
the weighted average of cost of equity and borrowing (Weighted Average Cost of Capital).
This value calculated is the Enterprise Value expressing the company value by excluding financial liabilities
and the value of assets. The Equity Value is calculated by deducting, if any, net financial liabilities (financial
liabilities – cash and cash equivalents) and if required, severance and notice pay, and by adding if any,
subsidiaries or non-operational other assets to the Enterprise Value.

37
Akfen GT – Company Appraisal Report
Assumptions
TRNC Assumptions
Revenues
Akfen GT has signed a rental agreement Voyager Kıbrıs Limited on 15 May 2012. Net Holding subsidiary
Voyager Kıbrıs Limited is a company founded under the laws of TRNC and is currently operating and active
and has been operating the casino of the 5-star hotel located in the city of Girne in TRNC since 2007
through a rental agreement. The 5-star hotel built on the plot allocated to Akfen GT by the TRNC Ministry
of Tourism and Economy, together with its casino, operating materials, machinery, equipment, fixings and
etc. have been included in the rental agreement lately signed with Voyager Kıbrıs Limited. It was also
noted that the name of the hotel was changed as “Merit Park Otel ve Casino” as of the new rental period.
The date the rental agreement came into force was 15 May, 2012 and the term of the Agreement is 20
years.
The tenant Voyager Kıbrıs Limited is paying an annual rent of EUR4,750,000.00 to Akfen GT for the hotel
and the casino. Based on the contract, the annual rent shall be fixed for the first five years and on the
following 6th and 7th years, if Euribor is under 2%; the rent increase shall equal to Euribor and if it is above
2%, the rent shall increase by 2%. In the following 8th, 9th and 10th years, the rent shall be updated
according to changes in Euribor rates.
When calculating the value of the 5-star hotel in TRNC owned by Akfen GT, it was assumed that the casino
and the hotel shall both be rented out and therefore, utilized.
Expenses
Since the revenues of the company are based on the rental income, the general administration expenses
including the personnel and offices expenses in expense accounts were not taken into consideration and
the annual inflation rate was increased by an estimate of 2.5% .
According to the conditions of the Agreement, all kinds of taxes, duties and expenses are for the account
of Voyager Kıbrıs Limited and Akfen GT shall only be liable for real estate taxes and expenses related
property rights. The fee for right of building paid to Devlet Emlak was determined according to the
agreement and has been increased by 3% until the end of the term of the agreement. The real estate tax
was added to the accounts and it was assumed that these amounts will increase with fixed rate annually.
38
Akfen GT – Company Appraisal Report
Since all costs regarding the operation of the hotel shall be for the account of the tenant Voyager Kıbrıs
Limited Şirketi, no operation costs were provided for Akfen GT.
Investment Assumptions
The rental agreements state that all expenses regarding basic renovation and replacements required
within the hotel shall be covered by the tenants. Based on the assumption that such investments will be
covered by the tenants, a small replacement investment equal to 0.85% of annual sales is anticipated.
This amount is calculated as EUR 40,375 for 2016.
Tax Assumptions
The projections have been extended until the year 2052 since the plot on which the 5-star hotel is located
has been rented for 49 years and the effects of taxes that will be imposed on the Company in TRNC during
this period were evaluated. As of 2010, the Company had an investment allowance equal to 68 million TL,
which is deductible from the taxable amount for corporate tax and further, an accumulated loss of 1.7
million TL from previous years in accordance with the Tax Procedure Law. The investment incentive
projections for 2015 are calculated from the investment incentives of 2013 and 2014. When the future
years’ revenues were examined, it was determined that the Company shall not liable for tax payments
until 2020 and as of 2020, the corporate tax rate in TRNC shall equal to 23.5%.
Depreciation
The depreciation terms for the fixed assets of the Company start from 2007: 25 years for buildings, 10
years for facilities and machinery, 5-7 years for vehicles and on average 30 years for special costs.
Discount Rate
Weighted Average Cost of Capital was used in order to calculate the present value of the anticipated free
cash flows of the hotel income spread over the years. The details regarding the calculation of this rate are
as stated in Annex 1.
Other Assumptions
Zero net working capital is assumed for the hotel for the next years.

39
Akfen GT – Company Appraisal Report
TRNC Projections
TRNC - Euro 2016 2017 2018 2019 2020 2021 2022 2023 2024 2025
Rent Revenue 4,750,000 4,750,000 4,845,000 4,941,900 5,040,738 5,141,553 5,244,384 5,349,271 5,456,257 5,565,382
Expenses related to the Hotel (64,598) (66,213) (67,868) (69,565) (71,304) (73,087) (74,914) (76,787) (78,706) (80,674)
Consolidated EBITDA (loss) for TRNC & HQ 4,699,256 4,698,057 4,791,830 4,887,474 4,985,027 5,084,527 5,186,012 5,289,524 5,395,100 5,502,784
Taxes - - - - (515,000) (965,090) (988,939) (1,013,264) (1,038,075) (1,063,380)
Investments (40,375) (40,375) (41,183) (42,006) (42,846) (43,703) (44,577) (45,469) (46,378) (47,306)
Cash Flows for TRNC & HQ 4,658,881 4,657,682 4,750,647 4,845,468 4,427,181 4,075,734 4,152,496 4,230,791 4,310,648 4,392,098
Discount Rate (Wacc) 6.5% 6.5% 6.5% 6.5% 6.5% 6.5% 6.5% 6.5% 6.5% 6.5%
TRNC - Euro 2026 2027 2028 2029 2030 2031 2032 2033 2034 2035
Rent Revenue 5,676,690 5,790,223 5,906,028 6,024,149 6,144,631 6,267,524 6,392,875 6,520,732 6,651,147 6,784,170
Expenses related to the Hotel (82,691) (84,758) (86,877) (89,049) (91,275) (93,557) (95,896) (98,293) (100,751) (103,270)
Consolidated EBITDA (loss) for TRNC & HQ 5,612,618 5,724,643 5,838,903 5,955,445 6,074,312 6,195,551 6,319,210 6,445,337 6,573,982 6,705,193
Taxes (1,089,191) (1,115,517) (1,142,368) (1,169,756) (1,197,689) (1,226,181) (1,650,640) (1,482,580) (1,521,407) (1,547,944)
Investments (48,252) (49,217) (50,201) (51,205) (52,229) (53,274) (54,339) (55,426) (56,535) (57,665)
Cash Flows for TRNC & HQ 4,475,175 4,559,909 4,646,334 4,734,484 4,824,393 4,916,097 4,614,231 4,907,331 4,996,040 5,099,584
Discount Rate (Wacc) 6.5% 6.5% 6.5% 6.5% 6.5% 6.5% 6.5% 6.5% 6.5% 6.5%
TRNC - Euro 2036 2037 2038 2039 2040 2041 2042 2043 2044 2045
Rent Revenue 6,919,853 7,058,250 7,199,415 7,343,403 7,490,272 7,640,077 7,792,878 7,948,736 8,107,711 8,269,865
Expenses related to the Hotel (105,851) (108,498) (111,210) (113,990) (116,840) (119,761) (122,755) (125,824) (128,969) 132,194
Consolidated EBITDA (loss) for TRNC & HQ 6,839,024 6,975,525 7,114,751 7,256,755 7,401,594 7,549,323 7,700,001 7,853,686 8,010,438 8,170,319
Taxes (1,579,394) (1,611,472) (1,644,190) (1,677,561) (1,711,598) (1,746,314) (1,781,724) (1,817,840) (1,854,676) (1,892,248)
Investments (58,819) (59,995) (61,195) (62,419) (63,667) (64,941) (66,239) (67,564) (68,916) (70,294)
Cash Flows for TRNC & HQ 5,200,811 5,304,058 5,409,366 5,516,776 5,626,329 5,738,068 5,852,038 5,968,282 6,086,846 6,207,777
Discount Rate (Wacc) 6.5% 6.5% 6.5% 6.5% 6.5% 6.5% 6.5% 6.5% 6.5% 6.5%
TRNC - Euro 2046 2047 2048 2049 2050 2051 2052
Rent Revenue 8,435,262 8,603,968 8,776,047 8,951,568 9,130,599 9,313,211 5,569,555
Expenses related to the Hotel 135,499 138,886 142,358 145,917 149,565 153,304 92,130
Consolidated EBITDA (loss) for TRNC & HQ 8,333,391 8,499,718 8,669,364 8,842,396 9,018,882 9,198,890 5,505,215
Taxes (1,930,570) (1,969,657) (2,009,524) (2,050,186) (2,091,661) (2,133,963) (1,291,820)
Investments (71,700) (73,134) (74,596) (76,088) (77,610) (79,162) (47,341)
Cash Flows for TRNC & HQ 6,331,121 6,456,927 6,585,244 6,716,121 6,849,611 6,985,766 4,166,054
Discount Rate (Wacc) 6.5% 6.5% 6.5% 6.5% 6.5% 6.5% 6.5%

40
Akfen GT – Company Appraisal Report
Russia Assumptions
Revenues
Targeted revenues for each hotel, included in the hotel projects in Russia, which shall be operated by Accor have
been calculated based on the expertise reports and business plans of Akfen GT and by further considering the
occupancy rates, number of rooms and average daily rates and also based on the assumption that such hotels
shall operate 365 days a year.
Table 23: Occupancy Rates
Occupancy Rates 2016 2017 2018 2019 2020 2021 2022 2023 2024 2025
Samara IBIS 50% 52% 53% 55% 60% 65% 70% 73% 76% 80%
Yaroslavl lBIS 58% 60% 62% 63% 65% 70% 75% 77% 80% 82%
Kaliningrad IBIS 70% 72% 74% 75% 76% 78% 80% 80% 80% 82%
(Source: Akfen GT)
The average daily room tariffs were for bed and breakfast and the expected increases in these tariffs have been
summarized in the table below.
Table 24: Average Daily Room Rates
Average
Daily Rate €
Number of
Rooms 2016 2017 2018 2019 2020 2021 2022 2023 2024 2025
Samara IBIS 204 40 41 42 44 45 48 52 55 60 62
Yaroslavl IBIS 177 40 42 43 44 45 50 53 57 60 65
Kaliningrad IBIS 167 40 41 42 43 47 52 55 60 62 65
In addition to revenues obtained from rooms, hotel extras have also been included in the revenue projections
and have been assumed to be between 27% of the total revenue for the rooms.
Since there are shops which can be rented out within the Yaroslavl project, rental income for such shops has
also been included in these calculations. For the rentable shops located on 400 square meters, its rent is
assumed as approximately 25,000 € in 2015 and a 2% rent increase was further accounted for in the
projections.
For Samara Office Project, being part of RPI’s portfolio, a subsidiary of Akfen GT, it was assumed that 90% of
the 4,637 m2 net rentable area will be occupied. It was assumed that the average occupancy rate will increase
to 95% after 2016 and it is projected that there will be on average 5% annual rent loss in the upcoming years.
It was assumed that the monthly rent fee per square meters will be 10.5 Euro in 2016, 12 Euro in 2020 and

41
Akfen GT – Company Appraisal Report
14.6 Euro in 2025. Further, it was assumed that half of the office block management expenses, which
constitute 21% of the income revenue for the Samara Office Project, will be compensated by the common
area shares to be collected from the tenants.
Profitability Projections
Based on the expertise reports submitted by the company, it was assumed that, the gross profit margins of
Samara Ibis and Yaroslavl Ibis will be 40% in 2016, 46% in 2020 and 51% in 2025. For Kaliningrad Ibis, it was
assumed that the gross profit margin will be 40% in 2016, 47% in 2020 and 65% in 2025.
Table 25: Average Gross Profit Margins
Gross Activity Margins% 2016 2017 2018 2019 2020 2021 2022 2023 2024 2025
Samara IBIS 40% 41% 42% 43% 46% 48% 49% 51% 51% 51%
Yaroslavl IBIS 40% 40% 40% 44% 46% 48% 48% 50% 51% 51%
Kaliningrad IBIS 40% 41% 42% 43% 47% 52% 55% 60% 62% 65%
(Source: Akfen GT )
4% of the income expected to be obtained over the years is reserved in order to be used for fixtures and
stocks over the years. Further, 4% of the proceeds of the hotel is paid to Accor as a fee. According to the
agreement, Akfen GT receives a rental income equal to 75% of the adjusted gross operation profit after such
amounts are deducted from the proceeds of IBIS Hotels located in Samara, Yaroslavl and Kaliningrad.
Since the adjusted gross profit margins of Samara and Yaroslavl Ibis will be below the minimum guarantee
until 2024 and same for Kaliningrad Ibis until 2021, the gross profit margins are taken as 1.4 million Euro for
Samara Ibis, 1.2 million Euro for Yaroslavl Ibis and 1.0 million Euro for Kaliningrad Ibis for the aforementioned
dates.
Expense Assumptions
The expenses on project basis include maintenance and repair costs, insurance costs, and immovable
property tax and plot rents. It was projected for maintenance and repair costs to be 3.5% of the total hotel
revenues.
As of 2015, the insurance expenses for Samara Ibis Hotel was projected as EUR 22,500.00 and it was fixed at
EUR 22,500.00 for the coming years. The real estate tax rate in Russia is 2.2%. As a result of the tax exemption
provided, the real estate tax will not be paid until 2019, when such exemption advantage will expire, EUR
114,000 of real estate tax will be paid in 2019 and this amount shall decrease with a rate of 4% over the years
(in Russia, the real estate taxes decrease over the years according to the attrition rate of the building). The
land tax for the Samara İbis Hotel plot has been estimated as EUR 5,080 for the year 2016 and onward. The
42
Akfen GT – Company Appraisal Report
Corporate Tax for Samara Ibis Hotel, which was deferred due to previous year’s losses, was projected to be
EUR 106 thousand in 2016 and to be around 20% of the operating profit as of 2017.
The insurance expenses for Yaroslavl Ibis Hotel was taken as EUR 19,800.00 as of 2016 and it is assumed to
be fixed for the following years. The real estate tax was estimated to be around EUR 147,200 for 2016 and a
4% annual decrease was projected. Land tax for the Yaroslavl İbis Hotel plot has been estimated as EUR
18,500 for the year 2016 and it is assumed to be fixed for the following years. The Corporate Tax for Yaroslavl
İbis Hotel was projected to be around 96 thousand EUR in 2016 and to be around 20% of the operating profit
as of 2017.
The insurance expenses for Kaliningrad Ibis Hotel was taken as EUR 15,000 as of 2016 and it is assumed to
be fixed for the following years. Since the hotel shall be exempt from real estate tax until 2018, the first
payable tax shall be imposed in 2018 and it was estimated to be around EUR 57,000 and a 4% annual decrease
was projected. Land tax for the Kaliningrad İbis Hotel plot has been estimated as EUR 4,400 for the year 2016
and it is assumed to be fixed for the following years. Additionally, EUR 1,000 (for 2 months) of land rent will
be paid in 2016 and the land will be bought for EUR 50,000 in March, 2016. Further, the hotel shall be exempt
from Corporate Tax for the first six years and a discount of 50% shall apply for the next five years and the
corporate tax payments, which shall begin in 2019, were projected to be around 10%.
For Samara Office Project realized by RPI, a subsidiary of Akfen GT, the office block management expenses
were taken as 21% of the rental income and half of this amount shall be compensated by the common area
shares to be collected from the tenants. It was assumed that common area shares for areas which are not
rented out shall be paid by the property owner. For Samara Office Project, the maintenance and repair
expenses were projected as 2% of the rent revenue. Insurance expenses for the Samara Office Project were
assumed to be around EUR 11,500 in 2016 and this amount is assumed to be fixed for the coming years. The
real estate tax will be paid first in 2020. The real estate tax is assumed to be 6,525 Euro in 2020 and will
decrease by 4% with the depreciation of the building. The land tax was assumed to be 2,392 Euro in 2016
and will stay fixed for the upcoming years. Due to postponements from losses of previous years, it is assumed
that the corporate tax will be 87 thousand Euro in 2018 and will be 20% of the operating profit starting from
2019.
Along with the costs of the hotel project based in the cities, the general administration costs of Akfen GT
headquarters were also calculated and included in the cash flows of the projects.
Depreciation
The depreciation term of the fixed assets of the Company is five years and 30 years have been assumed for

43
Akfen GT – Company Appraisal Report
other fixed investments.
Investment Assumptions
No further invesment is anticipated as Samara Ibis, Yaroslavl Ibis, Kaliningrad Ibis and Samara Office
projects are completed.
Other Assumptions
Weighted Average Cost of Capital was used in order to calculate the current value of the anticipated free
cash flows of the hotel proceeds spread over the years. The details regarding the calculation of this rate are
as state in Annex 1.
In this appraisal study, when the final values of cash flows belonging to all hotel projects based in Russia were
calculated, a 3% growth rate was used. Further, it was assumed that the plot is to be rented out and
purchasing option shall be used for Yaroslavl and Kaliningrad projects. Zero net working capital is assumed
for the hotel and the office for the next years.
44
Akfen GT – Company Appraisal Report
Russia Projections
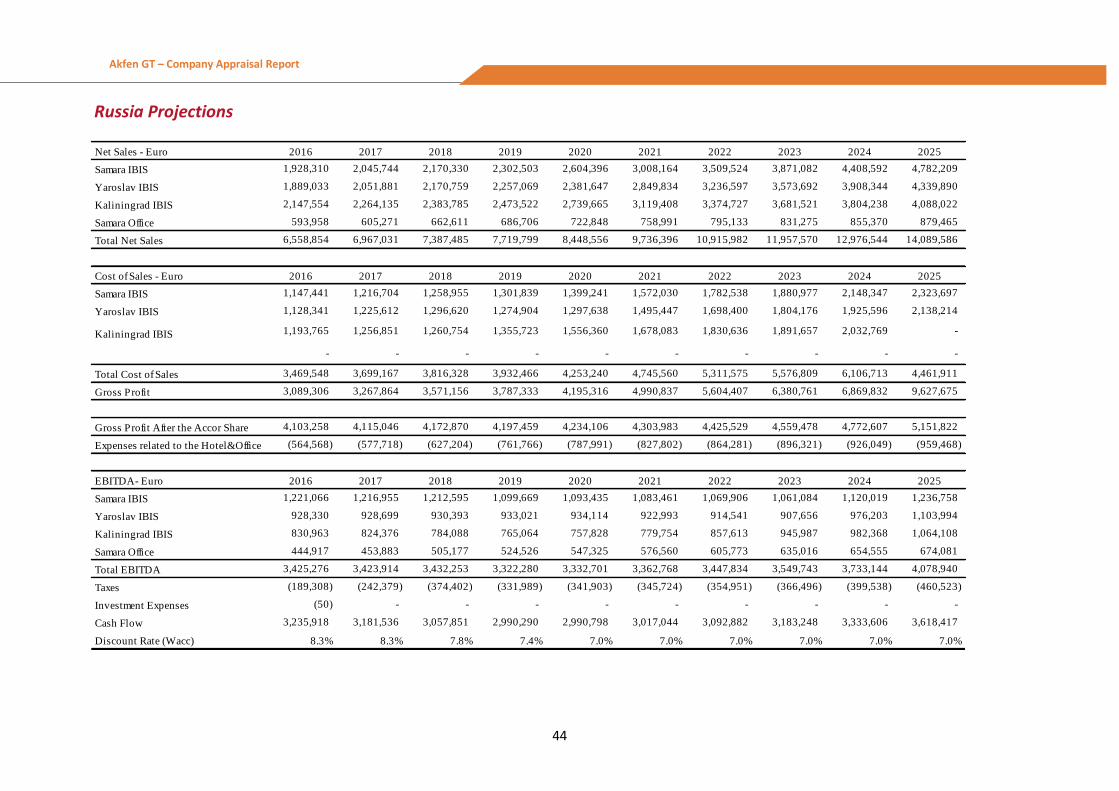
Net Sales - Euro 2016 2017 2018 2019 2020 2021 2022 2023 2024 2025
Samara IBIS 1,928,310 2,045,744 2,170,330 2,302,503 2,604,396 3,008,164 3,509,524 3,871,082 4,408,592 4,782,209
Yaroslav IBIS 1,889,033 2,051,881 2,170,759 2,257,069 2,381,647 2,849,834 3,236,597 3,573,692 3,908,344 4,339,890
Kaliningrad IBIS 2,147,554 2,264,135 2,383,785 2,473,522 2,739,665 3,119,408 3,374,727 3,681,521 3,804,238 4,088,022
Samara Office 593,958 605,271 662,611 686,706 722,848 758,991 795,133 831,275 855,370 879,465
Total Net Sales 6,558,854 6,967,031 7,387,485 7,719,799 8,448,556 9,736,396 10,915,982 11,957,570 12,976,544 14,089,586
Cost of Sales - Euro 2016 2017 2018 2019 2020 2021 2022 2023 2024 2025
Samara IBIS 1,147,441 1,216,704 1,258,955 1,301,839 1,399,241 1,572,030 1,782,538 1,880,977 2,148,347 2,323,697
Yaroslav IBIS 1,128,341 1,225,612 1,296,620 1,274,904 1,297,638 1,495,447 1,698,400 1,804,176 1,925,596 2,138,214
Kaliningrad IBIS 1,193,765 1,256,851 1,260,754 1,355,723 1,556,360 1,678,083 1,830,636 1,891,657 2,032,769 -
- - - - - - - - - -
Total Cost of Sales 3,469,548 3,699,167 3,816,328 3,932,466 4,253,240 4,745,560 5,311,575 5,576,809 6,106,713 4,461,911
Gross Profit 3,089,306 3,267,864 3,571,156 3,787,333 4,195,316 4,990,837 5,604,407 6,380,761 6,869,832 9,627,675
Gross Profit After the Accor Share 4,103,258 4,115,046 4,172,870 4,197,459 4,234,106 4,303,983 4,425,529 4,559,478 4,772,607 5,151,822
Expenses related to the Hotel&Office (564,568) (577,718) (627,204) (761,766) (787,991) (827,802) (864,281) (896,321) (926,049) (959,468)
EBITDA- Euro 2016 2017 2018 2019 2020 2021 2022 2023 2024 2025
Samara IBIS 1,221,066 1,216,955 1,212,595 1,099,669 1,093,435 1,083,461 1,069,906 1,061,084 1,120,019 1,236,758
Yaroslav IBIS 928,330 928,699 930,393 933,021 934,114 922,993 914,541 907,656 976,203 1,103,994
Kaliningrad IBIS 830,963 824,376 784,088 765,064 757,828 779,754 857,613 945,987 982,368 1,064,108
Samara Office 444,917 453,883 505,177 524,526 547,325 576,560 605,773 635,016 654,555 674,081
Total EBITDA 3,425,276 3,423,914 3,432,253 3,322,280 3,332,701 3,362,768 3,447,834 3,549,743 3,733,144 4,078,940
Taxes (189,308) (242,379) (374,402) (331,989) (341,903) (345,724) (354,951) (366,496) (399,538) (460,523)
Investment Expenses (50) - - - - - - - - -
Cash Flow 3,235,918 3,181,536 3,057,851 2,990,290 2,990,798 3,017,044 3,092,882 3,183,248 3,333,606 3,618,417
Discount Rate (Wacc) 8.3% 8.3% 7.8% 7.4% 7.0% 7.0% 7.0% 7.0% 7.0% 7.0%
Akfen GT – Company Appraisal Report
Appraisal According to Discounted Cash Flow
The Discounted Cash Flow (DCF) method has been utilized in order to assess the value of Akfen GT.
This method is based on calculating the current value of the company from the free future cash
flows projected for the Company by the weighted average cost of capital of the Company. According
to this method the current value of future cash flows gives the Enterprise Value and the Equity
value is achieved by deducting the net financial liabilities from this amount.
The equity value of Akfen GT calculated by using the DCF method is as indicated below.
Table 26: Company and Equity Values as of 31.12.2015
The Company Value of Akfen GT, calculated by discounting the cash flows of the Company spread over
the years by the weighted average cost of capital is 138.027 million Euros as of 31 December 2014.
The Equity Value of Akfen GT, calculated by deducting the net financial liabilities from and by adding
the cash and cash equivalents (liquid assets) to the Company Value is 92.117 million Euros (292.711
million TL5 ) as of 31 December 2015.
5 EURO/TL buying rate of Republic of Turkey Central Bank dated 31 December 2015 (3.1776) have
been used.
Value Financial Liabilities (-) Liquid Assets(+) Equity Value
Land in Bafra 3.234 - - 3.234
Samara IBIS 20.703
Yaroslavl IBIS 17.85
RP
I
(95
%)
Samara Office 10.825 6.175 0 4.65
138.027 92.117Akfen GT Company Value Akfen GT Equity Value
52.431
24.89 125 31.801
Kaliningrad IBIS 18.014
RH
I(9
5%
)
Euro (mio)
KKTC & HQ Value 67.401 30 15.03
Ak
fen
GT
HQ
46
Akfen GT – Company Appraisal Report
Annexes

47
Akfen GT – Company Appraisal Report
-Annex:1
DISCOUNT RATE CALCULATION
Weighted Average Cost of Capital (WACC) method has been used for determining the discount
coefficient for calculating the discount rate in Discounted Cash Flow Method. The mathematical
formula of this method is as indicated below:
WACC = (Liabilities/(Liabilities+Equity) x Liability Costs x (1-t) +(Equity/(Liability+Equity) x Cost of Equity
WACC calculation method has been followed for both TRNC and Russia.
TRNC
The liability-equity balance of the Company was calculated as 60% liabilities – 40% equity based on the
current situtation.
The cost of borrowing was estimated to be around 6.38% level when the current market conditions
and the indebtedness structure of the Company were considered. The Eurobond yield interest, with
maturity as 1 April 2023, was considered as 3.33% level, fixed for the projection period. The Corporate
Tax rate indicated as t in the formula is 23.5% and the cost of borrowing, with tax effect, is calculated
as 4.88%.
For calculation of cost of equity, the classic Capital Asset Pricing Model (CAPM) was used.
In the CAPM Model, mathematically expressed as Ke = Rf + ß * Market Risk Premium, the Market Risk
Premium was calculated as 6.5%.
The levered beta of Akfen GT for Cyprus was taken as 0.85 and since the debt structure of the Company
will not change in the future years, it was taken as a constant. Eurobond yield interest rate dated 1
April 2023 equal to 3.33% has been taken as Rf.

48
Akfen GT – Company Appraisal Report
Russia
For calculation of cost of equity, the classic Capital Asset Pricing Model (CAPM) was used for Russia,
like TRNC.
When the financial projections, current loan repayment plans and the future financing needs
calculated were considered, the liability-equity balance of the Company was calculated as 60% liability
– 40% equity in the coming years.
For the cost of borrowing of the Company, the expenses assumed by the Company for EBRD, IFC and
CEB loans, with maturity dates in 2023 used for financing the projects of the Company in Russia was
weighted by the loans borrowed per project and the respective interest rates and was calculated as
6.38%. This percentage was fixed for the coming years. The Corporate Tax rate indicated as t in the
formula is 20% and the cost of borrowing, with tax effect, is calculated as 5.10%.
In the CAPM Model, mathematically expressed as Ke = Rf + ß *(Rm - Rf ), the yield interest of the
Eurobond issued on 16 September 2013 with maturity of 2020 was taken as Rf..
As a consequence of Russia’s political risk, Rf for 2015 and 2016 is assumed to be 4.85%, the current
yield interest of the Eurobond with maturity date in 2020. Assuming the Russia economy to recover in
the short-midterm, 3.5%, the average yield interest of the Eurobond since it was issued, is assumed for
2017 and for the following years.
The rate for market risk premium expressed mathematically in the CAPM Model as (R-m - Rf ) was
taken as 8.9% for 2016 and 2017. Assuming that this premium will drop gradually, it was taken as 6.4%
for the upcoming years. Levered beta for Russia was taken as 1.00.