air.unimi.it · web viewon a regional scale, the regional residues project (piano regionale...
TRANSCRIPT

SUMMARYABSTRACT......................................................................................................................3INTRODUCTION.............................................................................................................6
NATIONAL RESIDUES PROJECT.............................................................................8PURPOSE OF THIS WORK..........................................................................................10EXPERIMENTAL PHASE.............................................................................................13
PRELIMINARY OBSERVATIONS ABOUT THIS EXPERIMENTATION...........14Animals.................................................................................................................14Manure..................................................................................................................15ELISA tests...........................................................................................................15HPLC MS-MS tests..............................................................................................16Persistence tests....................................................................................................17
REAGENTS AND CHEMICALS...............................................................................19STANOZOLOL...........................................................................................................21
OVERVIEW............................................................................................................22ELISA tests..............................................................................................................25HPLC MS-MS tests.................................................................................................28PERSISTENCE tests................................................................................................31
ZERANOL...................................................................................................................34OVERVIEW............................................................................................................35ELISA tests..............................................................................................................39HPLC MS-MS tests.................................................................................................42PERSISTENCE tests................................................................................................45
NITROFURANS.........................................................................................................49OVERVIEW............................................................................................................50ELISA tests..............................................................................................................54HPLC MS-MS tests.................................................................................................59PERSISTENCE tests................................................................................................63
CLENBUTEROL.........................................................................................................66OVERVIEW............................................................................................................67ELISA tests (1).........................................................................................................70ELISA tests (2).........................................................................................................73HPLC MS-MS tests.................................................................................................79PERSISTENCE tests................................................................................................82
DES and DIENESTROL.............................................................................................84OVERVIEW............................................................................................................85
1

ELISA TESTS..........................................................................................................88HPLC MS-MS tests.................................................................................................90PERSISTENCE tests................................................................................................93
ISOXSUPRINE...........................................................................................................95OVERVIEW............................................................................................................96HPLC MS-MS tests.................................................................................................98PERSISTENCE tests..............................................................................................101
2-THIOURACIL........................................................................................................103OVERVIEW..........................................................................................................104HPLC MS-MS tests...............................................................................................107
TRENBOLONE.........................................................................................................110OVERVIEW..........................................................................................................111ELISA tests............................................................................................................114HPLC MS-MS tests...............................................................................................116PERSISTENCE tests..............................................................................................119
CHLORAMPHENICOL............................................................................................121OVERVIEW..........................................................................................................122ELISA tests............................................................................................................126HPLC MS-MS tests...............................................................................................128
CORTICOSTEROIDS...............................................................................................130OVERVIEW..........................................................................................................131ELISA tests............................................................................................................136HPLC MS-MS tests...............................................................................................138
BOLDENONE and METABOLITES.......................................................................141OVERVIEW..........................................................................................................142HPLC MS-MS tests...............................................................................................147PERSISTENCE tests..............................................................................................150
CONCLUSIONS...........................................................................................................154REFERENCES..............................................................................................................158
2

UNIVERSITÀ DEGLI STUDI DI MILANO
FACOLTÀ DI MEDICINA VETERINARIA
DIPARTIMENTO DI SCIENZE E TECNOLOGIE VETERINARIE PER LA SICUREZZA ALIMENTARE
CORSO DI DOTTORATO DI RICERCA IN
ALIMENTAZIONE ANIMALE E SICUREZZA ALIMENTARE CICLO XXI
SCUOLA DI DOTTORATO IN
SCIENZE VETERINARIE PER LA SALUTE ANIMALE E LA SICUREZZA ALIMENTARE
PERSISTENCE OF ILLEGAL DRUGS IN BOVINE MANURE
Tesi di Dottorato di:
Dott.Matteo Piero Gavinelli
Tutor: Chiar.mo Prof. Giuseppe Pompa
Coordinatore: Chiar.mo Prof. Valentino Bontempo
ANNO ACCADEMICO 2007/2008
3

ABSTRACT
Oral or parenteral livestock drugs can be detected unmodified or as metabolites in
animal dejections (urines and/or faeces). During manure maturation and before its
disposal on cultivated lands, drugs present in cattle dejections can undergo a
degradation, most of all due to the presence of faecal bacteria. The degradation level
depends on the chemical structure of the different compounds. The general purpose of
this work is to evaluate if manure can be a useful matrix to detect the presence of
forbidden drugs in animal production, so to become a cheap and quick method of
analysis.
Considering the compounds banned in European Directive 96/23/EC group A and in
attachment IV of Reg. CEE 2377/90, some of them have been chosen, based on positive
cases frequency in later years, to select those of most interest for cattle husbandry. A
bibliographic research has been performed on these compounds, to analyze their
metabolic characteristics and to find out the best analytical methods to check these
substances during screening and confirmatory analysis.
Methods have been improved for screening analysis, using immunoassay techniques
with sensitivity more or less up to ng/g. Generally we have adapted kits ELISA, already
used in urine or in other tissues, to detect these compounds in manure. We optimized in
manure matrix HPLC MS-MS methods for compounds where kit ELISA could not be
used and to confirmatory analysis.
Afterwards, the degradation kinetics of substances in manure has been evaluated in a 4
months period, using in vitro models and both ELISA and HPLC MS-MS techniques.
The studied substances and preliminary results are reported below.
STANOZOLOL
ELISA technique: a kit for urine, serum and plasma has been adapted. We have
found the limit of quantification about at 0.1ng/ml and the curve saturation was at
2ng/ml. Matrix effect was high.
HPLC MS-MS: the method has been optimized for 16 β OH stanozolol with CCα
of 0.42ng/ml, CCβ of 0.58ng/ml.
4

ZERANOL α and β
ELISA technique: a kit for urine, serum and bovine tissue has been adapted.
Matrix effect was high so the maximum level for quantification was 0.67ng/ml.
HPLC MS-MS: the method has been optimized to show both of the compounds,
CCα was 0.25ng/ml and 0.45 ng/ml for α and β-zeranol respectively; CCβ was
0.45ng/ml and 0.90ng/ml for α and β zeranol respectively.
NITROFURAN (AOZ and AMOZ)
ELISA technique: a kit for different tissues in different animal species has been
adapted. Matrix effect was scarce for AOZ but not so waek for AMOZ. Both
metabolites showed sensibility close to 0.2ng/ml.
HPLC MS-MS: samples have been derivatized before extraction. CCα was
0.20ng/ml and CCβ 0.30ng/ml for AMOZ and 0.45ng/ml and 1.30ng/ml for
AOZ.
Β2 AGONISTS (CLENBUTEROL and TERBUTALINE)
ELISA technique: a kit for analyzing clenbuterol and another one for analyzing
together clenbuterol and terbutaline have been adapted. The limit of
quantification was between 0.1 and 0.2ng/ml and saturation level about at
10ng/ml for clenbuterol on its own; together with terbutaline the limit of
quantification was 0.5ng/ml and saturation level between 10 and 20ng/ml
without matrix effect.
HPLC MS-MS: CCα was 0.14ng/ml and CCβ was 0.22ng/ml.
DIETHYLSTILBESTROL
ELISA technique: a kit for urine, bile, muscle and faeces has been adapted. The
limit of quantification was between 12.5 and 25ppt, the saturation level about on
10ng/ml without matrix effect.
HPLC MS-MS: CCα was 0.41ng/ml and CCβ was 0.86ng/ml.
TRENBOLONE
ELISA technique: a kit for urine, bile, muscle, liver and faeces has been adapted.
The limit of quantification was 2ng/ml and saturation level of 10ng/ml
HPLC MS-MS: CCα was 0.80ng/ml and CCβ was 1.10ng/ml.
5

CHLORANPHENICOL
ELISA technique: a kit for honey, eggs, urine, milk, plasma, meat and fish has
been adapted. The limit of quantification was between 0.2 and 0.5ng/ml
HPLC MS-MS: CCα was 0.32ng/ml and CCβ was 1.07ng/ml.
ISOXSUPRINE
HPLC MS-MS: we searched this compound only with mass spectrometry and
CCα and CCβ values were 0.24ng/ml and 0.36ng/ml respectively.
TIOURACIL
HPLC MS-MS: it has been derivatized before extraction; we found 0.34ng/ml
for CCα and 0.49ng/ml for CCβ.
CORTICOSTEROIDS
HPLC MS-MS :we searched some drugs: prednisolone, prednisone, cortisol,
cortisone, dexamethasone, betamethasone and methylprednisone and we found
CCα from 0.10ng/ml to 0.60ng/ml and CCβ from 0.15ng/ml to 0.75ng/ml for all
compounds.
ANABOLIC-ANDROGENIC STEROIDS
HPLC MS-MS: we searched androstadienedione, α-boldenone, β-boldenone,
androstenedione, testosterone and epitestosterone only with mass spectrometry.
If we exclude ET CCα value range from 0.20ng/ml to 0.80ng/ml and CCβ from
0.40ng/ml to 2.50ng/ml.
6

INTRODUCTION
The knowledge of metabolic ways and the degradation’s kinetics of a certain drug, in
case of drugs abuse or illegal use, can be an effective aid to the zoo technical
surveillance.
Many drugs are traceable in organism in its excreta or in faeces themselves only for
short periods, in fact they are widely metabolized by organism. On the contrary their
metabolites are traceable, this is why the presence of the metabolites themselves
suggests a possible pharmaceutical treatment. This possibility is illustrated by screening
methods, employed in finding most of legal and illegal drugs, where their presence is
indicated by the positivity in tests to their respective metabolites.
Drugs given both parenterally and orally are traceable, unmodified or as metabolites in
urine and in faeces for the entire period of treatment and sometimes for a certain period
of time after the treatment too.
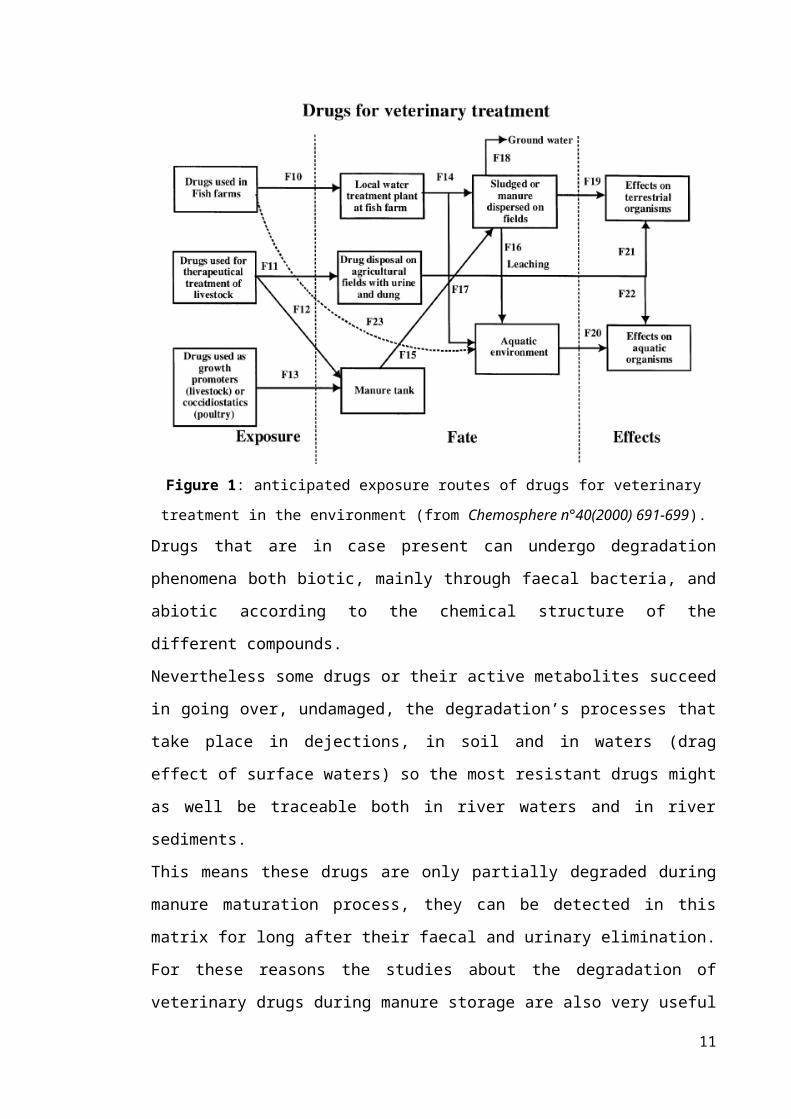
During the maturation process, the early animal dejections (faeces and urine) become
manure, a useful soil used in agriculture. A possible destination of veterinary drugs,
once introduced in environment, is showed in figure 1.
Figure 1: anticipated exposure routes of drugs for veterinary treatment in the environment
(from Chemosphere n°40(2000) 691-699).
7

Drugs that are in case present can undergo degradation phenomena both biotic, mainly
through faecal bacteria, and abiotic according to the chemical structure of the different
compounds.
Nevertheless some drugs or their active metabolites succeed in going over, undamaged,
the degradation’s processes that take place in dejections, in soil and in waters (drag
effect of surface waters) so the most resistant drugs might as well be traceable both in
river waters and in river sediments.
This means these drugs are only partially degraded during manure maturation process,
they can be detected in this matrix for long after their faecal and urinary elimination.
For these reasons the studies about the degradation of veterinary drugs during manure
storage are also very useful with regard the analysis of environmental risk, most of all in
respect of those active principles of which degradation speed is not known yet.
8

NATIONAL RESIDUES PROJECT(PIANO NAZIONALE RESIDUI)
Since 1988 in order to protect the public health and the wholesomeness of foods with
animal origin the National Residues Project has been carried out from year to year in
Italy; it provides for the surveillance and the monitoring of chemical substances’
residues in foods with animal origin.
Up to 2006 the National Residues Project was the expression of the Legislative Decree
336 of the 4th of August 1999, law that acknowledged two EU directives 96/22/EC e
96/23/EC. Nowadays the National Residues Project is the expression of the Legislative
Decree 158 of the 16th of March 2006, law that acknowledges the EU directive
2003/74/EC (that modifies and supplements the directive 96/22/EC).
The searched molecules belong to two precise categories. The first one, called A
category, includes products with an anabolic effect and substances forbidden in cattle
intended for consumption and so employed fraudfully to improve the animals
performances. The second category, called B category, comprehends three families of
substances. The first two families regard veterinary drugs allowed in cattle treatment,
for which substances the European Union has defined a maximum residual level (MRL)
that can not be overcome. The third family regards the environmental contaminants as
the organic chlorinated compounds, heavy metals and substances that, absorbed by
environment and entered in food chain, can be detected in edible animal parts, in
particular cases in high dosages too.
The analyses for the research of A and B category substances must be carried out using
validated methods according to EU directive 2002/657/EC. Moreover the procedures for
the official sampling and the management of the samples are discussed in EU directive
98/179/EC of the 23rd of Februry 1998.
The organization and the execution of National Residues Project is a result of the
cooperation of different institutions with different and specific roles and competences.
The Health Department General Direction of Veterinary Health and Foods is
responsible for the coordination of all the activities concerning the predisposition and
9

the fulfillment of the Project and it represents its competent administrative Authority
with regard to the European Union.
The Health Superior Institute (Istituto Superiore di Sanità) performs the role of
coordination as regards the technical scientific aspects, as Reference National
Laboratory for residues.
In practice, the Department drafts the National Residues Project, according to the
European Directive or some specific EU demands after new health problems rising, and
sends it out to regions.
On a regional scale, the REGIONAL RESIDUES PROJECT (Piano Regionale Residui)
is defined according to the characteristics of the different areas, the extent of the zoo
technical property, the number of slaughters, the handlings of drugs and feedstuffs; this
project is sent out to Territorial Veterinary Services and in it the number and the method
of implementation of samples to be carried out from year to year are defined.
The coordination of the activity, the collection of obtained data and their six-monthly
mailing to Health Department are implemented always on a regional scale.
The samplings are made both in breedings (primary production) and in first
transformation factories, like slaughterhouses or milk collection centres.
At first, only in the breeding phase there were precise rules, regarding: the prohibition to
give banned substances and products, the duty to record the implemented
pharmacological treatments as well as the declarations when animals are sent to
slaughter. The responsibles of the first transformation factories have been also involved
in ”residues problem” entirely for several years; so they have to adopt a self-control
corporate programme. In fact the duty to market foodstuff products, coming from
animals not illegally treated and, in case of veterinary drugs treatment, the expected
suspension time having been respected, falls on the responsibles themselves of the
factories.
The collected samples are analyzed in Experimental Zooprophylactic Institutes
laboratories (Istituti Zooprofilattici Sperimentali). On the grounds of the analytical
results, if banned substances residues are found out or the content of residues of
authorized substances or environmental contaminants goes over the fixed limits,
adequate administrative and pecuniary sanctions as well as criminal or repressive
sanctions, in case of not consistent products markets, are activated, to preserve the
public health.
10
All the data concerning the samplings and the obtained analytical results are sent from
Regional Aldermanships to the Health Department, that collects and sends them yearly
to the European Commission , together with the new year planning.
11

PURPOSE OF THIS WORK
The analytical operations for the control of residues in farm animals are usually divided
in two main phases. The first phase, called qualitative or semi quantitative screening
phase, is useful to distinguish positivity or negativity of the samples to a certain banned
substance . This first phase is usually executed with immunoenzymatic systems. These
systems present the merit to have a low price and a reasonable execution speed, as well
as they don’t provide a wide specific knowledge, if employed according to the
indications of the different producers. So they can be used on a very big number of
animals, thanks to these characteristics. However the immunoenzymatic methods have
the defect to interact with other substances (cross reaction), producing a certain number
of false positives; moreover they have a high matrix effect, that can influence the
detection limit. Besides, as before mentioned, these techniques, without the right
precautions (like the dilution of the sample), are not suitable for a quantitative analysis.
That’s why a second phase exists, called analytical confirmation phase, to which
samples, positive to the screening phase, are subjected. The second phase is usually
executed through chromatography in mass spectrometry, in liquid chromatography or in
gas chromatography, both of them coupled to mass spectrometry. These techniques
guarantee high precision and reliability to identify the analyzed substances , as well as
good capability to evaluate the concentration in sample. However these methods can not
be employed from the beginning on to search for residues, because of: their high prices,
in terms of purchase, working and maintenance of the instruments; the long time
required for every single analysis; the wider qualification and training of the operators.
The main goal we wanted to reach in this work, that is still in a preliminary phase, can
be summarized into four points:
to improve efficacy and efficiency of the activities of surveillance of veterinary
services with regard to pharmacosurveillance;
to implement the possibilities to search for banned substances through new
inspection methodologies, alternative or in addition to those ones still used;
to simplify the control methodologies, identifying where it is possible new
simple, effective and efficient screening methods, to be used on matrixes
12

different from those usually adopted (blood and urines), that provide a sampling
for single animal;
to evaluate the persistence of banned drugs in animal dejections to deepen the
knowledge of their possible environmental dispersion.
The study that we have carried out, still ongoing, does not want to modify the two steps,
already well consolidated, or rather the screening analyses followed by confirmatory
analyses for positive subjects. What we want to verify if it is possible to apply this
analytical methodology to a different matrix, like manure.
To obtain that, some substances have been considered, paying particolar attention to the
A category of the National Residues Project:
stanozolol
zeranol
nitrofurans
clenbuterol
diethylstilbestrol and dienestrol
isoxsuprine
2 thiouracil
trenbolone
chloramphenicol
corticosteroids
boldenone and metabolites
The analysis of manure samples, instead that of blood or urine of every single animal,
can represent in a indirect way all the illegal treatments the animals have undergone on
the whole. The need to sample every subject would be overcome, with a considerable
time and money saving, resources that could be used to increase the number of controls.
Afterwards the inspections on single animals could be made only in case of positive
check in manure, to be able to quantify and qualify the extent of subjects positive to
banned drugs.
Besides, since animal manure needs a certain time to maturate, it is assumable it
remains near the farm for some time; hence to know the degradation kinetics of the
searched compounds or their metabolites becomes fundamental, once they are
eliminated by animals through their dejections. The control analyses for residues, except
for those with a high degradation speed, could be evaluated in historic terms, to be able
to identify illegal treatments carried out some time before the samplings. Therefore to 13

judge the efficacy of a pharmacosurveillance inspection it is important also to evaluate
the persistency of residues in manure matrix. In fact the remarkable bacterial component
present in manure, as well as abiotic degradation phenomena, could quickly degrade the
searched chemical compounds, making the matrix unsuitable for the research of
residues. Clearly manure represents a much more complex matrix than blood or urines.
In fact the chemical composition is considerably varied and mainly it is function of the
diet of the animals and of the environment (temperature and moisture) where they are
kept. In fact in manure different chemical food substances can be present (lipids,
proteins, pigments etcetera), as well as portions of bedstead used for the stalling of
cattle, bacteria and moulds. Therefore it is fundamental to improve an analysis system
(screening and confirmatory methods), that reduces to a minimum the interference
generated by all these strange components, that is a system that does not suffer or a little
the so called matrix effect.
In particular, for screening analyses it is important to consider the immunoenzymatic
ELISA methods have been developed to search for residues in urines, in blood, in
foodstuff and in tissues. So it is fundamental to evaluate if the new matrix manure can
interfere in terms of specificity (false positivities) or detection limits. With regard to the
chromatographic analyses, the interferences of the new matrix could condition the
extraction yields, the instrumental answers (like the ionic suppression in mass
spectrometry) and the detection limits.
Besides it is suitable to evaluate the quantity of dry substance present in sample, so to
understand the dispersion of a possible banned drug in taken manure. Such a dispersion,
function of the diet of the animals, their wholesomeness and the quantity of water used
to clean the cattleshed, could remarkably influence the real concentration of the
searched analytes.
14
EXPERIMENTAL PHASE
15

PRELIMINARY OBSERVATIONS ABOUT THIS EXPERIMENTATION
In the following chapters it s possible to find, for every substance considered in this
work, a little overview about its respective chemical and biological characteristics, as
well as the methodology and the results obtained by us improving the analysis systems
in ELISA and HPLC MS-MS using manure as matrix. Moreover at the end of each
chapter it is possible to find the obtained results as regards the persistence tests of the
different compounds in manure, employing the analytical techniques refined so far.
Instead below some useful information to understand how this experimental work has
been developed are reported.
Animals
The experimentation has been carried out in cooperation with a farm of cattle-breeding
(white calves) in the province of Vercelli, that has supplied the raw matter for the
analyses (manure) and the main indications about the feeding, the stalling and the
(legal) health treatments the animals were subjected to.
The animals were males, belonging to the Holstein-Friesian race, 18 weeks; they were
kept in multiple boxes, with cement grill flooring (4-5 calves similar in weight in every
box). The corrals were supplied of autocapturing traps and individual pails. Moreover,
every paddock was provided with a multiple manger, used to supply the fibrous food.
To guarantee a correct farm management and the respect of the regulations concerning
the animals welfare, the farmer checked the hematic parameters of every single subject
(the lowest acceptable value of hematic haemoglobin equal to 4.5mmol.l-1 or 7.25 g.dl-
1). The animals below such a threshold have been treated giving them iron with an
intramuscular injection.
The sanitary treatments the animals had been subjected to (a lot of weeks before the
manure samplings) were: a sanitary treatment against endo- and ecto-parasites
administering ivermectin by intramuscular injection (100 μg.kg-1) and a a pour on
treatment against ectoparasites (Foxim® 0.5 g.l-1), made after each shearing.
16

The feeding of the calves was similar to the real conditions that can be found in a
typical farm. The food project consisted in a liquid diet with reconstituted milk and
supplemented with lipids of animal or vegetable origin, administered in two daily feeds
(about 6 litres each meal) and in a fibrous food (about 200 g).
Manure
Manure used for our trials has been taken with samplings every time to a different depth
directly from the manure maturation tank. A sample has been taken to a few centimetres
from the surface, another one at a intermediate depth and the last one near the bottom of
the tank.
The consistency of manure was quite liquid.
At the beginning of the experimentation the percentage of dried substance in manure
has been evaluated, to obtain an indication how much the sample could be diluted ( the
biggest source of dilution was certainly the water used to clean boxes). The percentage
obtained (about 7-8% dried substance) agrees on other evaluations made during
previous experimentations.
Afterwards, the gathered manure has been at once brought to our laboratory to carry out
the tests to refine analysis methods (ELISA and HPLC MS-MS).
ELISA tests
Small quantities of manure were sufficient to improve ELISA methods, so to carry them
to our laboratory has been easy, using small disposable containers (big plastic test tubes
with screw plug). The manure specimens (the sampling methodology has been
previously described) were “fresh”, every test has been made with manure taken that
same day or at most the day before.
The reading of all the ELISA plates has been employed with an automatic reader with a
measuring range from 340nm to 750nm, model: ELISA MICROPLATE READER
DIAREADER ELX800 UV from Dialab GmbH, (IZ-NO Sud Hondastrasse Objekt M55
A-2351, Wr.Neudorf, Austria). All the ELISA plates have been read at a wave length of
405 nm and the experimental results have been given in terms of absorbance.
17

The ELISA analysis system has been developed for:
stanozolol
zeranol
nitrofurans
clenbuterol
diethylstilbestrol
trenbolone
chloramphenicol
corticosteroids
HPLC MS-MS tests
As for ELISA tests, the improvement of HPLC MS-MS methodologies has needed
small quantities of manure, brought to our laboratory in the same way described above.
Also in this case samples manure could be considered “fresh”.
The HPLC MS-MS analysis system has been developed for:
stanozolol
zeranol
nitrofurans
clenbuterol
dienestrol
isoxsuprine
2 thiouracil
trenbolone
chloramphenicol
corticosteroids
boldenone and metabolites
18
Persistence tests
For organizing reasons persistence tests have been carried out directly in the breeding,
while the analyses of the samples concerning this part of the experimentation have been
made in our laboratory as regards both the ELISA and the HPLC MS-MS analyses.
0.3m3 manure, taken as previously described, has been put in cube-shaped cement
containers and manure has been mixed with a mechanical mixer (it was a drill, to its end
a spatula to mix paints was connected). These containers, intentionally built, had an
overall volume of 0.4m3 and were placed in a small shed, temporarily not used, next to
the shed. The environmental conditions (ventilation, lighting and temperature) of the
shed were similar to those of an empty shed. Clearly rainwater couldn’t percolate inside
the cement containers and, since the experimentation lasted 4 months on the whole
(from July to the first days of October 2008), manure, that tended to decrease because of
the effect of the evaporation of the water component, has been maintained by us to the
initial volume. This procedure was employed adding water without chlorine while the
material in the cement containers was mixed.
The intention was to keep constant the quantity of dried substance and the dilution of
the sample and so to have samples as similar as possible one to each other.
A test has been prepared for every active principle, or class of active principles, and so
every cement container was dedicated to study only one active principle (or class of
active principles).
At the beginning of the experimentation a sampling of the manure has been made to
verify possible presences of the studied analytes.
Manure was fortified with 500 ng.ml-1 for each considered substance (one container for
each substance or class of substances, en plus, another one not fortified) and then the
content was mixed again. A sampling was immediately made (day 0). The following
samplings were made at the days 3, 6, 12, 20, 36, 52, 66, 80, 100 and 120 (11 samplings
on the whole).
To obtain an analysis as representative as possible, for each sampling 3 specimens have
been taken in different positions in the container. Every specimen was obtained taking
small quantities of manure from the surface, the middle and the bottom of the container
and mixing them. In fact the results of this part of experimentation are an average of the
3 specimens for each sampling day and are expressed as relative concentration, or rather
referring the effective concentration of every substance at the time zero to the
concentration found at the sampling time.
19

The persistence tests have been done on all the considered substances during the
improvement of HPLC MS-MS techniques (except for boldedone and its metabolites
where only αBOL and ADD have been subjected to persistence tests).
The results concerning chloramphenicol, 2-thiouracil, corticosteroids will not be shown,
in fact it was not possible to detect them already at time zero. These substances are the
object of a new experimentation with similar characteristics (results are not still
available).
20
REAGENTS AND CHEMICALS
In this work, the following pure reagents and chemicals have been used:
Standard:
2 Thiouracil ( ≥99%, T7750 Sigma, SIGMA-ALDRICH);
AMOZ (VETRANAL®, 33349 Fluka, SIGMA-ALDRICH);
Androstenedione ( ≥98% A9630 Sigma, SIGMA-ALDRICH);
Androstadienedione ( A7505 Sigma, SIGMA-ALDRICH);
AOZ (VETRANAL®, 33347 Fluka, SIGMA-ALDRICH);
Betamethasone (VETRANAL®, 34166 Fluka, SIGMA-ALDRICH);
Chloramphenicol (≥99.0% 23275 Fluka, SIGMA-ALDRICH);
Clenbuterol (≥95% C5423 Sigma, SIGMA-ALDRICH);
Cortisol (≥98% H4001 Sigma, SIGMA-ALDRICH);
Cortisone (≥98% C2755 Sigma, SIGMA-ALDRICH);
Dexamethasone (≥98% D1756 Sigma, SIGMA-ALDRICH);
Dienestrol (VETRANAL®, 46190 Fluka, SIGMA-ALDRICH);
Diethylstilbestrol (≥99% D4628 Sigma, SIGMA-ALDRICH);
Epitestosterone (E5878 Sigma, SIGMA-ALDRICH);
Flumethasone (F9507 Sigma, SIGMA-ALDRICH);
Isoxsuprine (I0880 Fluka, SIGMA-ALDRICH);
Methylprednisolone (VETRANAL®, 46436 Fluka, SIGMA-ALDRICH);
Prednisolone (VETRANAL®, 46656 Fluka, SIGMA-ALDRICH);
Prednisone (≥98% P6254 Sigma, SIGMA-ALDRICH);
Stanozolol (S7132 Fluka, SIGMA-ALDRICH);
Terbutaline (T2528 Sigma, SIGMA-ALDRICH);
Testosterone (≥99% 86500 Sigma, SIGMA-ALDRICH);
Trenbolone (≥95% T3925 Sigma, SIGMA-ALDRICH);
α Zearalanol (~97% Z0292 Sigma, SIGMA-ALDRICH);
β Boldenone (≥99% 46431 Fluka, SIGMA-ALDRICH);
β Zearalanol (~98% Z0417 Sigma, SIGMA-ALDRICH);
Solvents and reagents:21

2-nitrobenzaldehyde (97% N10802 Aldrich, SIGMA-ALDRICH);
3-iodo benzyl bromide (95% 427691 Aldrich, SIGMA-ALDRICH);
Acetic acid (ACS reagent, ≥99.7% 695092 SIGMA-ALDRICH);
Dimethyl sulfoxide (≥99.5% D4540 Sigma, SIGMA-ALDRICH);
Disodium phosphate (≥99.5% 30412, SIGMA-ALDRICH);
Ethyl acetate (≥99.7% 34972 Fluka, SIGMA-ALDRICH);
Hexane (≥99.5% 208752, SIGMA-ALDRICH);
Hydrogen chloride (≥99.7% 26616 Fluka, SIGMA-ALDRICH);
Methanol ( ≥99.9% 34966 Fluka, SIGMA-ALDRICH);
Monopotassium phosphate (1.0 M, P8709 Sigma-Aldrich, SIGMA-ALDRICH);
Phosphate Buffered Saline (PBS1 Sigma, SIGMA-ALDRICH);
Sodium hydroxide (≥98%, pellets S5881 Sigma-Aldrich, SIGMA-ALDRICH);
Tert-butyl-methyl-ether (99.9%, 650560 Sigma-Aldrich, SIGMA-ALDRICH);
Water (39253 Fluka, SIGMA-ALDRICH);
22

STANOZOLOL
23

OVERVIEWSTANOZOLOL
Stanozolol, or 5α-androstane-17α-methyl-17β-ol [3,2-c] pyrazole, is a synthetic
heterocycling anabolic androgenic steroid (Rogozkin 1991). Its structure differs from
other steroid hormones due to pyrazole ring fused to the androstane ring sistem
(Figure 2).
Figure 2: stanozolol and the most resemblant methyltestosterone: instead of 3-ketogroup there is a condensed pyrazole ring.
Stanozolol is a steroidal synthesis hormone. Its pharmacology action is androgenic. It is
used as growth promoter in livestock growth. Use of stanozolol is forbidden in EU.
Both this molecule and its main metabolite, 16 β OH stanozolol, are searched in urine to
find treated animals with stanozolol. The National Residues Project fixes the analytical
limit equal to 2 ppb for both bovines and pigs.
Stanozolol, commonly sold under the name Winstrol® (oral) and Winstrol Depot® (intra-
muscular), was synthesized by Clinton in 1959 (Clinton et al. 1959) and developed by
Winthrop Laboratories in 1962.
Stanozolol is used medically for high anabolic potential and minimized androgenic
activity to treat protein-wasting disorder or debilitation, to stimulate erythropoiesis in
some anemias and in the treatment of hypogonadal status, osteoporosis, endometriosis,
and hereditary angioedema (Catlin et al. 1995). 24

Besides its use in the treatment of several diseases, the most important use is as growth
promoter in athletes and bodybuilders; in fact stanozolol misuse is usually considered a
safer choice for female bodybuilders in that it rewards a great amount of anabolism for a
small androgenic effect. However virilization and masculinization are still very
common, even at low doses and a lot of people like it, due to the fact it causes strength
increase without excessive weight-gain, it promotes increases in vascularity and it does
not convert to estrogen.
Moreover, stanozolol abuse is well documented in animals and it has been found on a
large scale in animal husbandry due to skill to increase the nitrogen balance and to
antagonize the catabolic effect of glucocorticoids in order to obtain better performance.
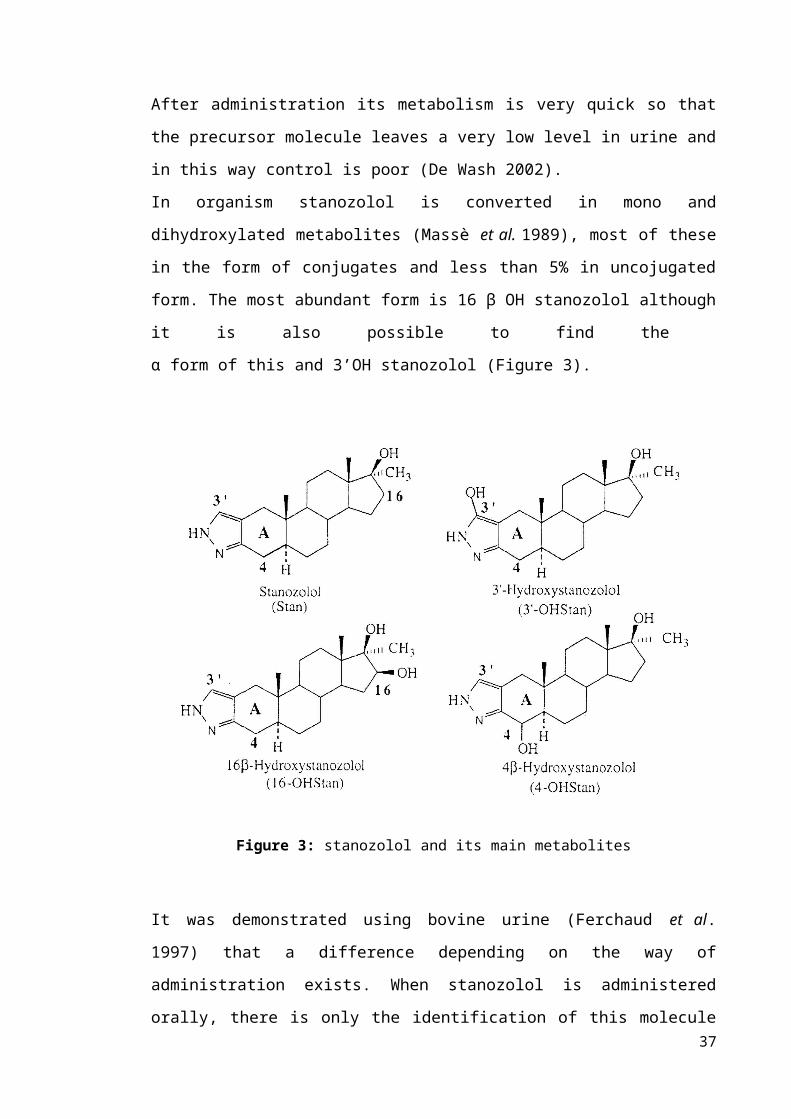
After administration its metabolism is very quick so that the precursor molecule leaves a
very low level in urine and in this way control is poor (De Wash 2002).
In organism stanozolol is converted in mono and dihydroxylated metabolites (Massè et
al. 1989), most of these in the form of conjugates and less than 5% in uncojugated form.
The most abundant form is 16 β OH stanozolol although it is also possible to find the
α form of this and 3’OH stanozolol (Figure 3).
Figure 3: stanozolol and its main metabolites
25

It was demonstrated using bovine urine (Ferchaud et al. 1997) that a difference
depending on the way of administration exists. When stanozolol is administered orally,
there is only the identification of this molecule and the metabolite 16 OH stanozolol,
while two hydroxymetabolites, 16 OH stanozolol and 4,16 diOH stanozolol, are found
after subcutaneous injection. However the major metabolite in veal calf urine is
16 β OH stanozolol.
Clinically, several liver disorders have been reported associated with 17 α alkyl
anabolic-androgenic steroids consumption like stanozolol, such as jaundice, cholestasis,
peilosis, hepatitis and liver tumors (Lenders et al. 1988; Haupt and Rovere 1984) and
the effects are well documented (Handelsman 1995). Some authors have recognized that
the orally treatment with stanozolol is much more hepatotoxic than their injectable
analogues (Wilson and Griffin 1980). So it could be no alteration at the enzymatic level
referred to liver activity such as ALT and AST, in fact this alteration is infrequent in
sportsmen self-abusing high doses (Saborido et al. 1991, 1993). However the 17 α
alkylated forms are considered non-genotoxic hepatic tumour promoters, due to
stimulation of DNA and cell proliferation leading to hyperplastic growth (Yager et al.
1994), and these steroids share the property of inducing liver growth at non-hepatotoxic
doses, acting in a dose-dependent manner (Mayol et al. 1992). Stanozolol could be a
liver promoter in two ways: either exerting a cytotoxic effect that induces a regenerative
response, or inducing an adaptative response in liver cells with cellular hypertrophy and
proliferation of hepatocytes (Boada et al. 1999). These authors showed that stanozolol is
capable of altering the liver metabolizing power and inducing cell proliferation in rat
liver; moreover this drug presents a potential hepatocarcinogenic effect in strong doses,
especially adenomas and carcinomas (Johnson et al. 1972; Goldfarb 1976; Ishak et al.
1979; Creagh et al. 1988).
M.J. Groot (RIKILT, Holland 2002) carried out a study on livers of 37 bovines, that
came out to be positive to stanozolol during urinary inspections; the livers showed
evident signs of chronic hepatitis, cholestasis and necrosis but no hepatic tumours were
found. According the author the animals were treated with stanozolol only for a few
months before having been slauthered, a too little period of time to develop a tumour.
26

ELISA testsSTANOZOLOL
Different ELISA kits have been tested in order to find the best suitable one to analyze
stanozolol in manure matrix.
The best ELISA kit to search for stanozolol has been that one from Neogen Corporation
“Enhanced Kit 16 β OH stanozolol” (cod n°103510 - Neogen Corporation, 944 Nandino
Boulevard, Lexington, KY 40511 USA) bought by Diessechem s.r.l., Via Meucci 61/b,
Milano.
This kit is marked to analyze stanozolol and its corresponding hydroxide
(16 β OH Stanozolol) for their research in different matrixes: urines, plasma or serum in
the dog or in the horse. In table 1 the sensitivities stated by the producer for different
matrixes in various animals are reported.
stanozolol
ng.ml-1
16 β OH stanozolol
ng.ml-1
Diluted horse urines 1:19 15.9 13.0
Diluted dog urines 1:5 10.5 15.2
Diluted horse plasma 1:5 20.6 20.5
Diluted horse serum 1:5 21.1 15.5
Table 1: sensitivities declared in ng.ml-1
The cross reaction reported by the producer is equal to 121% for stanozolol and 100%
for 16 β hydroxy stanozolol. Among other substances, androgen steroids show the
highest cross reaction, anyway less than 0.5% (Androstenedione).
27

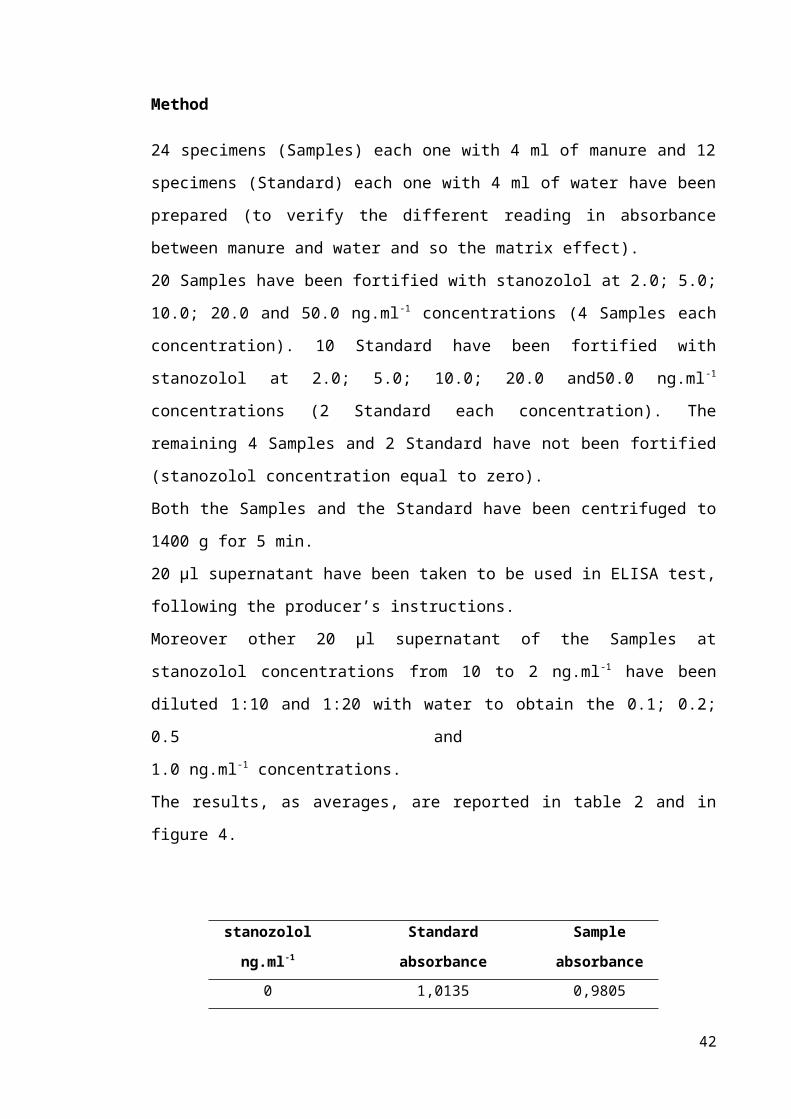
Method
24 specimens (Samples) each one with 4 ml of manure and 12 specimens (Standard)
each one with 4 ml of water have been prepared (to verify the different reading in
absorbance between manure and water and so the matrix effect).
20 Samples have been fortified with stanozolol at 2.0; 5.0; 10.0; 20.0 and 50.0 ng.ml-1
concentrations (4 Samples each concentration). 10 Standard have been fortified with
stanozolol at 2.0; 5.0; 10.0; 20.0 and50.0 ng.ml-1 concentrations (2 Standard each
concentration). The remaining 4 Samples and 2 Standard have not been fortified
(stanozolol concentration equal to zero).
Both the Samples and the Standard have been centrifuged to 1400 g for 5 min.
20 µl supernatant have been taken to be used in ELISA test, following the producer’s
instructions.
Moreover other 20 µl supernatant of the Samples at stanozolol concentrations from 10
to 2 ng.ml-1 have been diluted 1:10 and 1:20 with water to obtain the 0.1; 0.2; 0.5 and
1.0 ng.ml-1 concentrations.
The results, as averages, are reported in table 2 and in figure 4.
stanozolol
ng.ml-1
Standard
absorbance
Sample
absorbance
0 1,0135 0,9805
0.1 / 0,6072
0.2 / 0,4281
0.5 / 0,3935
1 / 0,3705
2 0,9534 0,3245
5 0,8255 0,3125
10 0,7605 0,2863
20 0,6155 0,2685
50 0,3925 0,2810
Table 2: average absorbance of Samples and Standard according to stanozolol concentration
28

0 5 10 15 20 25 30 35 40 45 500
0.2
0.4
0.6
0.8
1
1.2
StandardSample
concentration (ng.ml-1)
abso
rban
ce
Figure 4: average absorbance of Samples and Standard according to stanozolol concentration
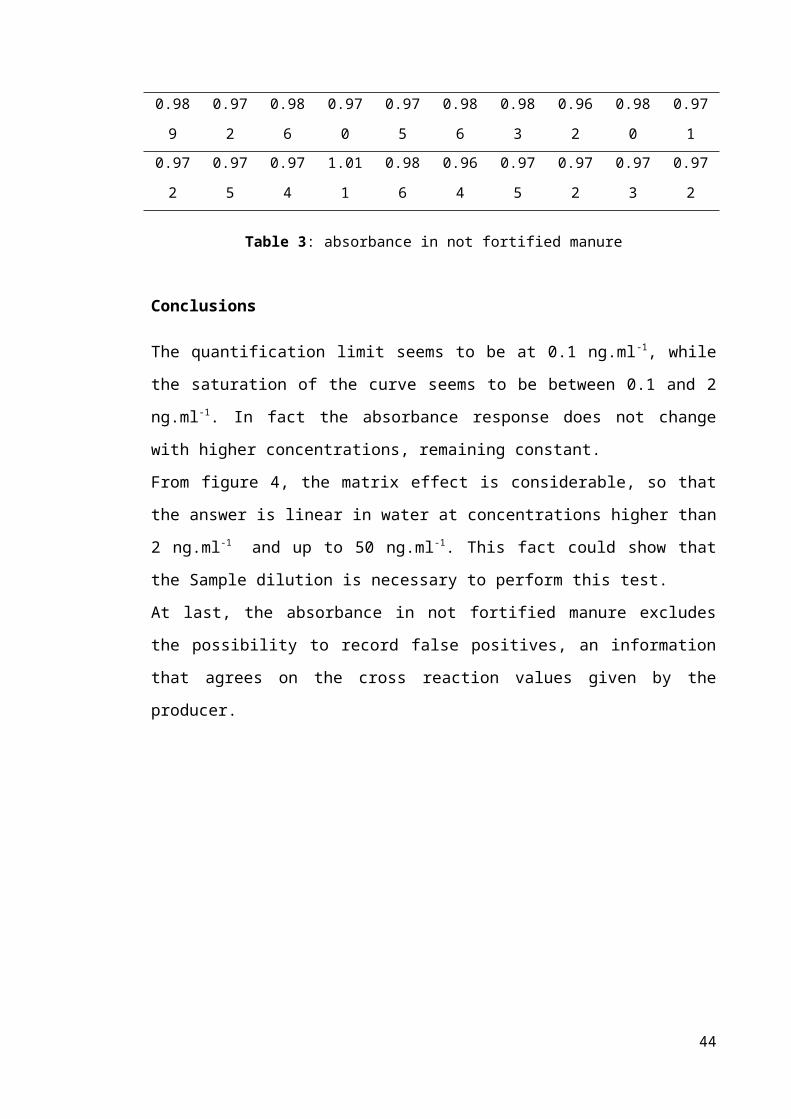
20 specimens of not fortified manure (blanks) have been analyzed to verify the absence
of false positives. The results in terms of absorbance are reported in table 3.
absorbance
0.989 0.972 0.986 0.970 0.975 0.986 0.983 0.962 0.980 0.971
0.972 0.975 0.974 1.011 0.986 0.964 0.975 0.972 0.973 0.972
Table 3: absorbance in not fortified manure
Conclusions
The quantification limit seems to be at 0.1 ng.ml-1, while the saturation of the curve
seems to be between 0.1 and 2 ng.ml-1. In fact the absorbance response does not change
with higher concentrations, remaining constant.
From figure 4, the matrix effect is considerable, so that the answer is linear in water at
concentrations higher than 2 ng.ml-1 and up to 50 ng.ml-1. This fact could show that the
Sample dilution is necessary to perform this test.
At last, the absorbance in not fortified manure excludes the possibility to record false
positives, an information that agrees on the cross reaction values given by the producer.
29

HPLC MS-MS testsSTANOZOLOL
The method has been improved for 16 β OH stanozolol, the main metabolite of
stanozolol.
Extraction
2 ml manure have been put in a plastic test tube, with a capacity of 15 ml and screw
plug, and 3 ml of water and 1 ml NaOH 1N have been added. After shaking in Vortex
for 30 seconds, 4 ml tert-butyl-methyl-ether (TBME) have been added. The test tubes
have been shaken in a rotative mixer for 20 min and then centrifuged to 2000 g for 15
min. Afterwards the supernatant has been taken (ether phase) and, after move to a glass
test tube with a capacity of 10 ml and the conic bottom, it has been dried in centrifugal
evaporator at 55 °C. The residue, diluted in 200 µl of a blend methanol/water
(50:50 v/v), has been put for the analysis in a plastic autosampler vial, with a capacity of
250 µl and the conic bottom.
Analysis
An ion trap mass spectrometer LCQDecaXPMax, equipped with a source ESI
(electrospray ionization) and linked with an autosampler AS Surveyor and a pump MS
Surveyor (all the components: Thermo Fisher, San Jose´,CA, USA), has been used for
the analysis.
The chromatography has been employed at 30°C, in isocratic conditions, using a
column GraceSmart Rp 18 5 µm (150 x 2.1 mm) preceded by a precolumn (C12,4 x
2mm.; Phenomenex).
The mobile phase was water (20%) with 0.1% acetic acid and methanol (80%), flow
rate 250 µl.min-1. The injection volume was 20 µl; the analysis time was equal to 6 min.
The mass spectrometer was operated in positive ESI mode with source voltage 5kV,
capillary temperature 275°C and sheath and auxiliary gas (nitrogen) flow rates of 35 and
10 arbitrary units, respectively.
30

The acquisition occurred in MS/MS in SRM mode (Selected reaction monitoring);
helium was used for collision-induced dissociation. Parent and product ions were
characterized by the following mass to charge ratios: 345.0 → 107, 121, 159, 173, 227,
309, 327 (figure 5).with the collision energy setting at 40%.
Figure 5: LC-MS/MS chromatogram and corresponding SRM spectrum of a blank sample fortified with 20.0 ng.ml-1 of 16 β OH stanozolol
Validation of the method
The calibration curve has been constructed using faeces with 5 fortification levels: 1.0;
2.0; 5.0; 10.0; 20.0 ng.ml-1 (3 points each concentration); moreover 20 not fortified
manure specimens have been analyzed to measure the background noise, necessary to
31

determine the sensitivity parameters. The method has been evaluated in terms of
decision limit (CCα), detection capability (CCβ), linearity of the calibration gap (R2)
and yield, according to the guide lines of the Decision of the Committee n° C (2002)
3044 of the 12th of August 2002 that accomplishes the directive 96/23/CE, regarding the
yield of the analytical methods and the interpretation of the results, reported below.
16 β OH stanozolol
CCα (ng.ml-1) 0.42
CCβ (ng.ml-1) 0.58
R2 0.99
Yield 88%
32

PERSISTENCE testsSTANOZOLOL
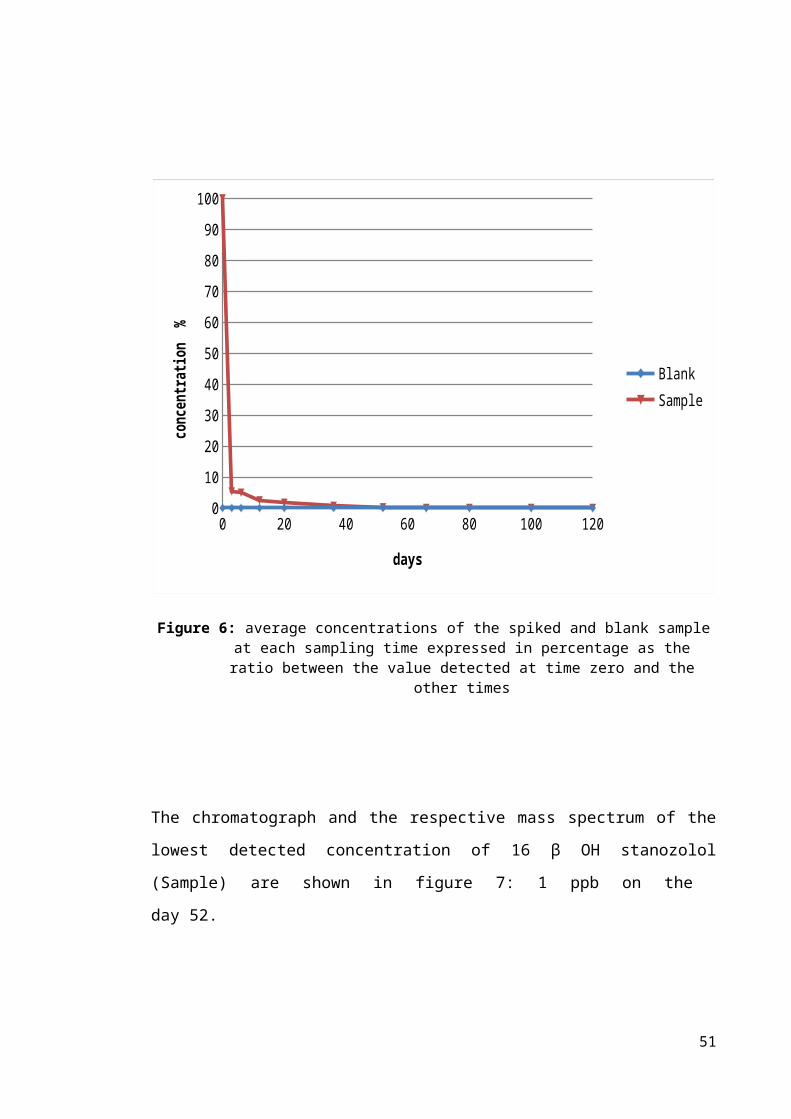
The average results in HPLC MS-MS, obtained at the different sampling times (average
of three samples every day) fortifying 0.3m3 manure with 500 ng.l-1 of 16 β OH
stanozolol (Sample) and expressed in percentage as the ratio between the value detected
at time zero and the other times , together with the results obtained with the not fortified
specimen (Blank), are shown in figure 6 and in table 4.
Day Blank (%) Sample (%)
0 n.d. 100.00
3 n.d 5.34
6 n.d 4.94
12 n.d. 2.46
20 n.d. 1.69
36 n.d 0.70
52 n.d 0.26
66 n.d. n.d.
80 n.d n.d
100 n.d n.d
120 n.d. n.d.
Table 4: average concentrations of the spiked and blank sample at each sampling time expressed in percentage as the ratio between the value detected at time zero
and the other times
33

0 20 40 60 80 100 1200
10
20
30
40
50
60
70
80
90
100
BlankSample
days
conc
entra
tion
%
Figure 6: average concentrations of the spiked and blank sample at each sampling time expressed in percentage as the ratio between the value detected at time zero and the
other times
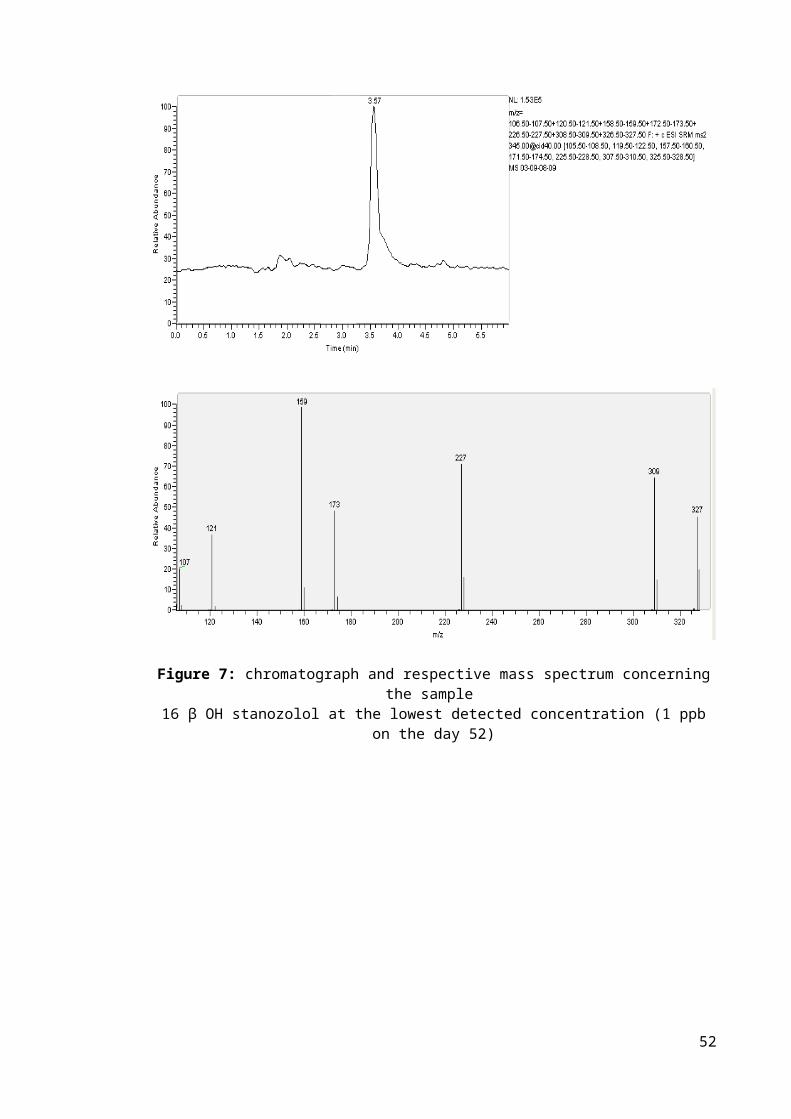
The chromatograph and the respective mass spectrum of the lowest detected
concentration of 16 β OH stanozolol (Sample) are shown in figure 7: 1 ppb on the
day 52.
34

Figure 7: chromatograph and respective mass spectrum concerning the sample 16 β OH stanozolol at the lowest detected concentration (1 ppb on the day 52)
35

ZERANOL
36
OVERVIEWZERANOL
Zeranol (α zearalanol or [6-6,10 dihydroxyundecy1-ß resorcylic acid lactone]) is a
resorcyclic acid lactone (figure 8) and it is a nonsteroidal molecule with estrogenic
activity. The isomeric β zearalanol is called taleranol.
Figure 8: chemical structure of zeranol
It can be obtained by synthesis by mycoestrogen zearalenone, produced by Fusarium
moulds but it is also present as a natural contaminant in food as a result of grain
infection by Fusarium moulds (Olsen et al. 1981).
Among all resorcyclic acid lactnones (figure 9), only zeranol is used (or misused) as
anabolic growth promoter which increases live-weight gain in food animals.
In USA zeranol has been used since 1969 as growth promoter to improve the fattening
rates of cattle. Food and Drug Administration approved zeranol for use in cattle as a
36mg dose for subcutaneous ear implantation, with 65-day withdrawal period, and for
use in feed lot lambs as 12 mg implant, with a 40 day withdrawal period (Metzler
1989).
However, the use of zeranol as an anabolic growth promoter is prohibited by Council
Directive 1996a in many other countries, including all member states of the EU, and
member states are required to monitor food-producing animals for possible abuse
(Council Directive 1996b).
37

Figure 9: the "zeranol family"
A few authors generally considered the maximum safe daily intake of zeranol to be
0.16 mg.day-1 and the tolerance level for tissue residue of zeranol has been calculated as
315 ppb (Leffers H. et al. 2001).
People may intake zeranol via meat products in three ways: from livestock that has been
treated with zeranol or fed mould-infected grains, or directly via Fusarium-
contaminated grains.
So it is necessary to distinguish between a misuse of zeranol as growth promoter and a
naturally occurring mycotoxin; in fact, finding zeranol in an animal could, on its own,
be an insufficient proof that malicious abuse of zeranol has occurred. Zearalenone, a
precursor of zeranol, could naturally occur in urine and in bile in sheep and in cattle
38

which can contaminate animal feedstuffs (Erasmuson et al. 1994; Miles et al. 1986;
Kennedy et al. 1998).
In order to clarify, an European project called “Natural Zeranol” was estabilished to
improve the knowledge about zeranol as an anabolic agent in food and to find a
correlation between mycotoxin levels and levels of zeranol and taleranol, to determinate
a criterion to distinguish zeranol abuse from natural contamination with Fusarium spp.
toxins.
In fact most European laboratories use immunoassay kits to screen the presence of
zeranol, but these kits show cross-reactivity with the Fusarium spp. Toxins (Cooper et
al. 2003), so a method using fluoro-immunoassay has been developed and validated for
the screening of zeranol itself without interference with Fusarium spp. toxins (Tuomola
et al. 2002). Another part of this European project was dedicated to improve two
confirmatory methods, one based on gas chromatography in tandem with mass
spectrometry and another one based on liquid chromatography in tandem with mass
spectrometry (Launay et al. 2004).
Zeranol and zearalenone bind to the estrogens receptors; zeranol has greater estrogenic
potency than zearalenone (Leffers et al. 2001; LeGuevel et al. 2001), so in estrogens
target organs it acts as an estrogenic substance and it can have strong endocrine
disrupting effects. During a study it was showed that zeranol, administrated to female
rats or mice at prepubertal stage, causes phenomena such as early vaginal opening,
oestrous cycle irregularity and anovulatory ovaries, ovaries without newly formed
corpora lutea (Yuri et al. 2004; Nikaido et al. 2005).
In fact zearalenone and its derivatives have been associated with reproductive disorder
in farm animal feed with mould infected grain (Skrinjar et al. 1995; Mejer et al. 1997).
Zearalenone was found in cattle feed at concentrations between 140 and 960 µg.kg-1
(Skrinjar et al. 1995) and, in pigs with reproductive problems, zearalenone and α
zearalenol glucuronide conjugates were found in bile at concentrations of up to 40 and
66 µg.l-1. By comparison, in animals treated with α zearalanol as growth promoter (in
the countries where this is possible), the maximum accepted residue limit for α
zearalanol in edible tissue is 2µg.kg-1 in muscle and 10 µg.kg-1 in liver. In a study
developed in France the human endometrial carcinoma Ishikawa cell line was found to
be highly sensitive to oestrogenic mycotoxins (LeGuevel et al. 2001). The EC50 (the
efficacious concentration given 50% of the maximal response) in this cells were 5.8*10 -
11mol.l-1 for zearalenone, 6.6*10-12mol l-1 for α-zearalenol and 3*10-11mol l-1 for α
39

zearalanol. These concentrations were calculated to be equivalent to 20.2 and 10 ng.l -1
respectively. These concentrations are below the concentrations found in mycotoxin-
contaminated animal feeds and below the maximum residue limit in edible tissue of
animals treated with α zearalanol. So there is some concern about the threshold level for
these chemicals and a possible risk for reproductive function in humjhans.
In addition estrogens are implicated in the development of the mammary gland and they
have been found to give rise to and to promote the growth of estrogens-dependent breast
cancer cells via the regulation of cell cycle progression (Doisneau and Sixou 2003).
40

ELISA testsZERANOL
The kit used to search for α and β zeranol has been the “Zaranol ELISA Kit” (cod n°
B424 11) produced by Euroclone S.p.A. (Via Figino 20/22, 20016 Pero, Milano) and
bought by CELBIO (Via Figino, 20/22, 20016 Pero, Milano).
This kit has been developed for the analysis in different biological matrixes, like
serums, urines and bovine tissues and, according to the producer, the detection limit for
α zeranol is 0.3 ppb.
The cross reaction is:
zeranol (α zearalanol) 100 %
α zearalenol 87 %
taleranol (β zearalanol) 100 %
β zearalenol 9.0 %
zearalanone 6.3 %
zearalenone<0.1%
Method
16 specimens (Samples) each one with 4 ml of manure and 14 specimens (Standard)
each one with 4 ml of water have been prepared (to verify the different reading in
absorbance between manure and water and so the matrix effect).
14 Samples have been fortified with zeranol at 0.15; 0.30; 0.67; 1.25; 2.5; 5.0 and
10.0 ng.ml-1 concentrations (2 Samples each concentration). 12 Standard have been
fortified with zeranol at 0.3, 1.25, 1.85, 2.5, 5.0, 10.0 ng.ml -1 concentrations (2 Standard
each concentration). The remaining 2 Samples and 2 Standard have not been fortified
(Zeranol concentration equal to zero).
Both the Samples and the Standard have been centrifuged to 1400 g for 5 min. and 20 µl
supernatant have been taken to be used in ELISA test, following the producer’s
instructions.
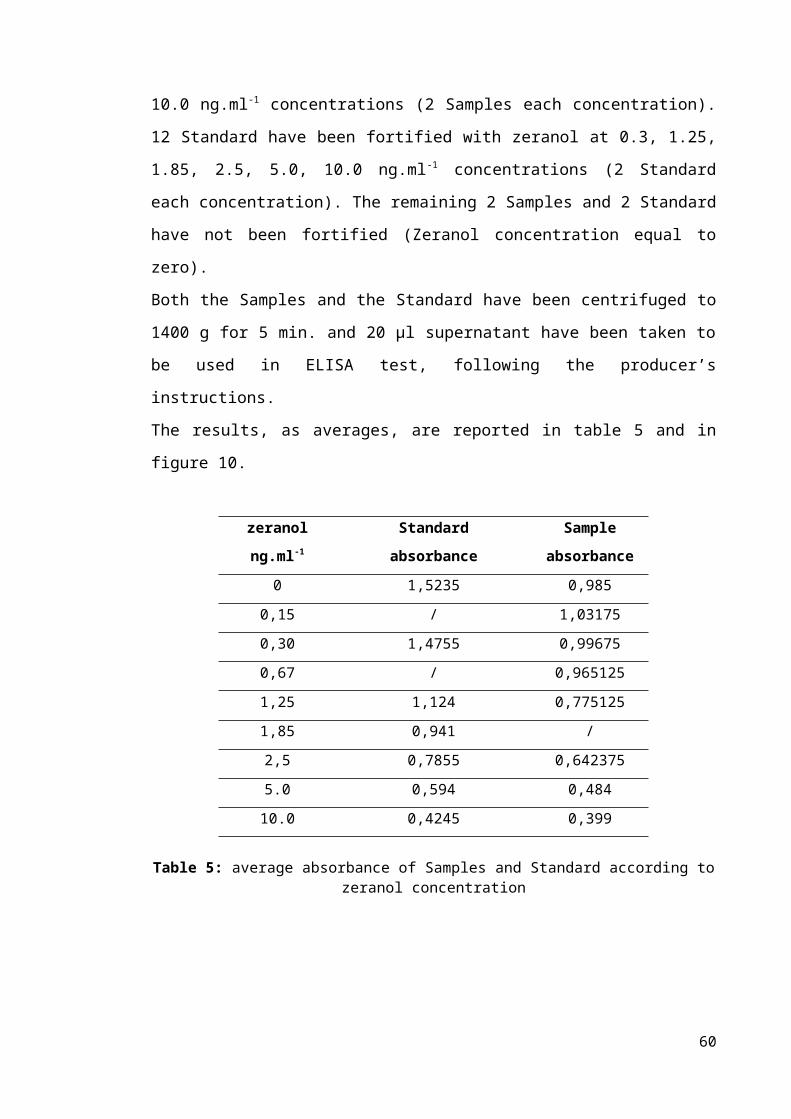
The results, as averages, are reported in table 5 and in figure 10.
41
zeranol Standard Sample
ng.ml-1 absorbance absorbance
0 1,5235 0,985
0,15 / 1,03175
0,30 1,4755 0,99675
0,67 / 0,965125
1,25 1,124 0,775125
1,85 0,941 /
2,5 0,7855 0,642375
5.0 0,594 0,484
10.0 0,4245 0,399
Table 5: average absorbance of Samples and Standard according to zeranol concentration
0 1 2 3 4 5 6 7 8 9 100
0.2
0.4
0.6
0.8
1
1.2
1.4
1.6
StandardSample
concentration ng.ml-1
abso
rban
ce
Figure 10: average absorbance of Samples and Standard according to zeranol concentration
42

Conclusions
From figure 10, the matrix effect is considerable, so that below 0.67 ng.ml -1 it is not
possible to distinguish the zeranol concentration present in the faecal matrix, while a
good discrimination exists up to the lowest concentration tested in water (0.3 ng.ml -1).
Instead the matrix does not influence the highest tested concentration, that is about
10 ng.ml-1.
43
HPLC MS-MS testsZERANOL
Extraction
2 ml manure have been put in a plastic test tube, with a capacity of 15 ml and screw
plug, and 3 ml of water and 1 ml NaOH 1N have been added. After shaking in Vortex
for 30 seconds, 4 ml ethyl acetate have been added. The test tubes have been shaken in a
rotative mixer for 20 min and then centrifuged to 2000 g for 15 min. Afterwards the
supernatant has been taken and, after move to a glass test tube with a capacity of 10 ml
and the conic bottom, it has been dried in centrifugal evaporator at 55 °C. The residue,
diluted in 200 µl of a blend methanol/water (50:50 v/v), has been put for the analysis in
a plastic autosampler vial, with a capacity of 250 µl and the conic bottom.
Analysis
An ion trap mass spectrometer LCQDecaXPMax, equipped with a source ESI
(electrospray ionization) and linked with an autosampler AS Surveyor and a pump MS
Surveyor (all the components: Thermo Fisher, San Jose´,CA, USA), has been used for
the analysis.
The chromatography has been employed at 30°C, in isocratic conditions, using a
column GraceSmart Rp 18 5 µm (150 x 2.1 mm) preceded by a precolumn (C12,4 x
2mm.; Phenomenex).
The mobile phase was water (30%) with 0.1% acetic acid and methanol (70%), flow
rate 250 µl.min-1. The injection volume was 20 µl; the analysis time was equal to 7 min.
The mass spectrometer was operated in negative ESI mode with source voltage 5kV,
capillary temperature 275°C and sheath and auxiliary gas (nitrogen) flow rates of 35 and
10 arbitrary units, respectively. The acquisition occurred in MS/MS in SRM mode
(Selected reaction monitoring); helium was used for collision-induced dissociation.
Parent and product ions, for both α and β Zearalanol, were characterized by the
following mass to charge ratios: 321.0 → 277, 303 (Figure 11) with the collision energy
setting at 35%.
44
Figure 10: LC-MS/MS chromatogram and corresponding SRM spectrum of a blank sample fortified with 20.0 ng.ml-1 β zearalanol and α zearalanol
Validation of the method
The calibration curve has been constructed using faeces with 5 fortification levels: 1.0;
2.0; 5.0; 10.0; 20.0 ng.ml-1 (3 points each concentration); moreover 20 not fortified
manure specimens have been analyzed to measure the background noise, necessary to
determine the sensitivity parameters. The method has been evaluated in terms of
45
β-zearalanol
β-zearalanol
α-zearalanol
α-zearalanol

decision limit (CCα), detection capability (CCβ), linearity of the calibration gap (R2)
and yield, according to the guide lines of the Decision of the Committee n° C (2002)
3044 of the 12th of August 2002 that accomplishes the directive 96/23/CE, regarding the
yield of the analytical methods and the interpretation of the results (see below).
α zearalanol β zearalanol
CCα (ng.ml-1) 0.25 0.45
CCβ (ng.ml-1) 0.45 0.90
R2 0.99 0.99
Yield 113% 138%
46

PERSISTENCE testsZERANOL
The average results, obtained at the different sampling times (average of three samples
every day) fortifying 0.3m3 manure with 500 ng.l-1 of α and 500 ng.l-1 of β Zearalanol
(Sample) and expressed in percentage as the ratio between the value detected at time
zero and the other times , together with the results obtained with the not fortified
specimen (Blank), are shown in table 6 and in figures 11 and 12.
α zearalanol β zearalanol
Day Blank (%) Sample (%) Blank (%) Sample (%)
0 n.d. 100.00 n.d. 100.00
3 n.d 8.84 n.d 17.24
6 n.d 6.13 n.d 5.20
12 n.d. 5.03 n.d. 4.75
20 n.d. 4.52 n.d. 4.22
36 n.d 2.14 n.d 2.88
52 n.d 0.85 n.d 1.96
66 n.d. 0.75 n.d. 0.47
80 n.d 0.73 n.d 0.35
100 n.d 0.36 n.d ‹0.19
120 n.d. 0.61 n.d.
Table 6: average concentrations of the spiked and blank samples at each sampling time expressed in percentage as the ratio between the value detected at time zero
and the other times
47

0 20 40 60 80 100 1200
10
20
30
40
50
60
70
80
90
100
α zeralanol
BlankSample
Days
conc
entr
ation
%
Figure 11: average concentrations of the spiked (α zearalanol) and blank samples at each sampling time expressed in percentage as the ratio between the value detected at
time zero and the other times
0 20 40 60 80 100 1200
10
20
30
40
50
60
70
80
90
100
β zearalanol
BlankSample
Days
conc
entr
ation
%
Figura 12: average concentrations of the spiked (β zearalanol) and blank samples at each sampling time expressed in percentage as the ratio between the value detected at
time zero and the other times
48

The chromatograph and the respective mass spectrum of the lowest detected
concentration of α zearalanol (Sample) are shown in figure 13 (3 ng.ml-1 on the
day 120).
Figura 13: chromatograph and respective mass spectrum concerning the sample α zearalanol at the lowest detected concentration (3 ng.ml-1 on the day 120)
The chromatograph and the respective mass spectrum of the lowest detected
concentration of β zearalanol (Sample) are shown in figure 14 (2 ng.ml-1 on the day 80).
To detect β zearalanol has been possible also during the sampling carried out on the day
100, but its concentration was less than CCβ.
49

Figure 14: chromatograph and respective mass spectrum concerning the sample β zearalanol at the lowest detected concentration (2 ng.ml-1 on the day 80)
50
NITROFURANS
51
OVERVIEWNITROFURANS
Nitrofurans are synthetic chemotherapeutic agents with a broad antimicrobial spectrum;
they are active against both gram-positive and gram-negative bacteria, including
Salmonella and Giardia spp, trichomonads, amebae and some coccidial species.
However, if compared with other antimicrobial chemotherapeutic agents, their potency
is not particularly great. The nitrofurans appear to inhibit a certain number of microbial
enzyme systems, including those involved in carbohydrate metabolism, and they also
block the initiation of translation (Gleckman 1979).
Their basic mechanism of action has not yet been clarified. Their primary action is
bacteriostatic, but they are also bactericidal at high doses. They are much more active in
acidic environments. Resistant mutants are rare and clinical resistance emerges slowly.
Among themselves, nitrofurans show complete cross-resistance, but there is no cross-
resistance with any other antibacterial agents. Because of very slight water solubility,
nitrofurans are used either PO or topically. No nitrofuran is effective systemically. They
are either not absorbed at all from the GI tract or they are so rapidly eliminated that they
reach inhibitory concentrations only in urine (Chamberlain 1979).
Main nitrofurans are (figure 15):
Nitrofurantoin
Nitrofurantoin is used to treat urinary tract infections caused by susceptible
bacteria, such as Escherichia coli, Staphylococcus aureus, Streptococcus
pyogenes and Aerobacter aerogenes. Proteus spp, Pseudomonas aeruginosa and
Streptococcus faecalis are usually resistant. After administration PO,
nitrofurantoin is rapidly and completely absorbed (the macrocrystal form takes
longer) and is swiftly eliminated by kidneys.
Nitrofurazone
Nitrofurazone is only slightly soluble in water but, in general, corresponds to
nitrofurantoin in terms of its mechanism of action, antimicrobial spectrum,
potency and physicochemical characteristics. Its main indications include the
52

treatment of bovine mastitis, bovine metritis and wounds. However pus, blood
and milk reduce the antibacterial activity.
Furazolidone
This is a nitrofuran with a wide range of antimicrobial activity that includes
Clostridium, Salmonella, Shigella, Staphylococcus and Streptococcus spp and E
coli. It is also active against Eimeria and Histomonas spp. It is usually
administered PO to treat intestinal infections but it may also be applied topically.
Figure 15: main nitrofurans and their metabolites
Before having been forbidden in European countries, nitrofurans were employed as
veterinary drugs or as feed additives for growth promotion; they were also mainly used
with livestock in prophylactic and therapeutic treatment of bacterial and protozoan
infection. (Draisci et al. 1997; Mccalla 1983).
53

From 1995 its use in livestock production has been completely banned (Commission
Regulation 1995) for the carcinogenicity of drugs residues and their potential harmful
effect on human health (Mccalla et al. 1983; Vroomen et al. 1990; Van Koten
Vermeulen et al. 1993). So food imported into the European countries should be free of
nitrofurans’ residues. Their use is also prohibited in other counties, such as USA,
Australia, Philippines, Thailand and Brazil (Khong et al. 2004).
However nitrofurans are still available for pets and human therapy; in fact,
nitrofurantoin is commonly used to treat infections to the urinary tract (Guay 2008),
furazolidone is available for the oral treatment of cholera (Roychowdhury et al. 2008),
bacterial diarrhoea and giardiasis (Petri et al. 2005) and nitrofurazone is used for topical
applications on infected burns and skin infections.
The metabolism of nitrofurans has been not well cleared; an hypothesis suggest the
cleavage of nitrofuran ring, leaving the specific group bound to tissue (Leitner et al.
2001).
Due to this instability and short in vivo half-life of the parent drugs, effective
monitoring of their illegal use is difficult (Nouws and Laurensen 1990). But their
metabolites of which:
AOZ, 3-amino-2-oxazolidinone
AMOZ, 3-amino-5-morpholinomethyl-1,3-oxazolidinone
AHD, 1-aminohydantoin
SEM, semicarbazide
bind to tissue proteins in the body and are removed by urine only after a long time after
treatment, making them more practical for monitoring public compliance of the
European Union ban (Hoogenboom et al. 1991; Cooper et al. 2005).
Potential effect of nitrofurans has been revealed in bacterial and mammalian cells
during mutagenicity studies in the 1970’s and 1980’s. In E.coli it was observed that
endogenous nitro-reductase was responsible to reduction of nitrofurans and then leading
to the formation of cellular DNA lesions in the stationary phase of bacterial growth
(Bryant and Mccalla 1980). The formation of DNA adducts after bacterial replication
causes the induction of error prone DNA repair processes, indicating the mutagenic
potency of the drug (Wentzell and Mccalla, 1980; Mccalla 1983).
The human health danger of these compounds is increased by the stability during
storage and cooking of meat, as recently demonstrated (Cooper et al. 2007). In fact the
54

authors determined that between 67% and 100% of the residues remained present in
tissues after cooking, frying, grilling, roasting and microwaving.
For these reasons nitrofurans have been included in Annex IV of Commision
Regulation 1442/95EC as compounds that are not permitted for use in the livestock
industry. The EU has established a minimum required performance limit (MRPL) of
1 μg.kg-1, for edible tissues of animal origin (Commission Decision, 2003). The illegal
use of nitrofurans is controlled by official inspection and analytical services provided by
laboratories following the recommendations specified by Council Directive 96/23/EC.
According to this document, the EU Member States are required to set up monitoring
plans and sampling procedures for given substances in live animals and their respective
food products.
However the method is only required to be able to quantify concentration values up to
1 μg.kg-1, but the lowest concentration of analyte which should be quantifiable is not
specified. This value is referred to as the decision limit, CCα (detection capability), and
it is determined by many laboratories using validation guidelines provided by the EU.
55

ELISA testsNITROFURANS
Two ELISA kit have been used: the “Ridascreen® AMOZ” (cod n°R3711) to search for
AMOZ, furaltadone metabolite, and the “Ridascreen® AOZ” (cod n°R3701) to search
for AOZ, furazolidone metabolite, both of them produced by R-BioPharm and bought
by R-BioPharm Italia S.r.l. Via dell’Artigianato, 13, 20070 Cerro al Lambro, Milano.
The producer of “Ridascreen® AMOZ” kit indicates a sensitivity equal to 200 ppt to
search for AMOZ in shrimps, fish, meat, liver, egg and a cross reaction <0.05%
towards AOZ and other nitrofurans metabolites.
The sensitivity given by the producer of “Ridascreen® AOZ” kit to search for AOZ is
equal to 50 ppt if matrixes like shrimps, fish, milk are used; instead it is equal to 100 ppt
if the research is performed in meat, liver, egg. In this case the cross section is <0.01%
for AMOZ and other nitrofurans metabolites.
Method
The methods to determine AMOZ and AOZ are the same, therefore later on we will
speak about Metabolite instead of AMOZ and AOZ.
40 specimens (Samples) each one with 4 ml of manure and 12 specimens (Standard)
each one with 4 ml of water have been prepared (to verify the different reading in
absorbance between manure and water and so the matrix effect).
36 Samples have been fortified with the Metabolite at 0,1; 0,2; 0,5; 1; 2; 5; 10; 20 and
50 ng.ml-1 concentrations (4 Samples each concentration). 10 Standard have been
fortified with the Metabolite at 2; 5; 10; 20 and 50 ng.ml-1 concentrations (2 Standard
each concentration). The remaining 4 Samples and 2 Standard have not been fortified
(metabolite concentration equal to zero).
Derivatization
0,5 ml HCl 1M and 100µl 2-nitrobenzaldehyde 10 mM in DMSO (dimethyl sulfoxide)
have been added to each specimen of Sample and Standard. Afterwards an incubation at
37°C overnight has been performed. Then 5 ml KH2PO4, 0,1 ml NaOH 1M and 5 ml 56

ethyl acetate have been added. They have been shaken in Vortex for 30 seconds,
sonicated for 5 minutes and centrifuged to 2000 g for 5 minutes.
Extraction
At the end 2.5 ml supernatant have been taken and dried using an evaporator
centrifuge. The residues have been dissolved in PBS buffer and hexane (1ml+1ml).
Then a centrifugation has been performed to 2000 g for 5 minutes and 50 µl supernatant
have been taken from below to be used in ELISA test, following the producer’s
instructions.
The results, as averages, are reported in table 7 and figure 16 for AMOZ and for AOZ in
table 9 and figure 18.
To search for AMOZ the kit has been tested without extraction too (table 8 and
figure 17).
AMOZ Standard Sample
ng.ml-1 absorbance absorbance
0 0,5651 0,4005
0,1 / 0,4405
0,2 / 0,3841
0,5 / 0,3375
1 / 0,2795
2 0,1352 0,2295
5 0,0832 0,1843
10 0,0425 0,1765
20 0,0413 0,1645
50 0,0408 0,159
Table 7: average absorbance of Samples and Standard according to AMOZ concentration (method with extraction)
57

0 5 10 15 20 25 30 35 40 45 500
0.1
0.2
0.3
0.4
0.5
0.6
Standard
concentration ng.ml-1
abso
rban
ce
Figure 16: average absorbance of Sample and Standard according to AMOZ concentration (method with extraction)
AMOZ Standard Sample
ng.ml-1 absorbance absorbance
0 0,5705 0,4215
0,1 / 0,2195
0,2 / 0,1787
0,5 / 0,1644
1 / 0,1328
2 0,2275 0,1165
5 0,1961 0,0955
10 0,1855 0,0885
20 0,1645 0,0812
50 0,1395 0,0815
Table 8: average absorbance of Samples and Standard according to AMOZ concentration (method without extraction)
58

0 5 10 15 20 25 30 35 40 45 500
0.1
0.2
0.3
0.4
0.5
0.6
StandardSample
concentration ng.ml-1
abso
rban
ce
Figure 17: average absorbance of Samples and Standard according to AMOZ concentration (method without extraction)
AOZ Standard Sample
ng.ml-1 absorbance absorbance
0 0,6115 0,3565
0,1 / 0,3467
0,2 / 0,3172
0,5 / 0,2735
1 / 0,2474
2 0,2672 0,2027
5 0,2025 0,1877
10 0,1302 0,1412
20 0,1152 0,1132
50 0,1077 0,1112
Table 9: average absorbance of Samples and Standard according to AOZ concentration
59
0 5 10 15 20 25 30 35 40 45 500
0.1
0.2
0.3
0.4
0.5
0.6
0.7
StandardSample
concentration ng.ml-1
abso
rban
ce
Figure 18: average absorbance of Samples and Standard according to AOZ concentration
Conclusions
An evident matrix effect does not seem to exist for AOZ, while it is not the same for
AMOZ. If extraction is performed, and therefore the matrix is cleaner, the difference
between the absorbances at 10 ng.ml-1 and at 0 ng.ml-1 is higher in Standard than in
Sample, while, without extraction, such a difference does not exist, suggesting the
matrix effect to be negligible. Considering these results, it is anyway recommendable to
extract the Sample also regarding the better discrimination of AMOZ with extraction
among the 0.2-2 ng.ml-1 concentrations.
The sensitivities of the two metabolites seem to be in the order of 0.2 ng.ml -1 and the
biggest quantifiable doses are between 10 and 20 ng.ml-1.
60

HPLC MS-MS testsNITROFURANS
Derivatization
Before extraction, the derivatization of the samples containing the two searched
metabolites (that are AOZ, furaltadone metabolite, and AMOZ, furazolidone
metabolite) has been carried out. 2 ml manure have been put in a plastic test tube, with a
capacity of 15 ml and screw plug, and 3 ml of water, 500 µl HCl 1N and 150 µl
2-nitrobenzaldehyde 50 mM (189 mg in 25 ml methanol) have been added. The blend
has then been kept in the dark at 60°C for 2 hours. At the end of the incubation 1.5 ml
NaOH 1 N have been added.
Extraction
4ml ethyl acetate have been added to each sample, after shaking in Vortex for 30
seconds. Then the test tubes have been shaken in a rotative mixer for 20 min and then
centrifuged to 2000 g for 15 min. Afterwards the supernatant has been taken and, after
move to a glass test tube with a capacity of 10 ml and the conic bottom, it has been
dried in centrifugal evaporator at 55 °C. The residue, diluted in 200 µl of a blend
methanol/water (50:50 v/v), has been put for the analysis in a plastic autosampler vial,
with a capacity of 250 µl and the conic bottom.
Analysis
An ion trap mass spectrometer LCQDecaXPMax, equipped with a source ESI
(electrospray ionization) and linked with an autosampler AS Surveyor and a pump MS
Surveyor (all the components: Thermo Fisher, San Jose´,CA, USA), has been used for
the analysis.
The chromatography has been employed at 30°C, with a concentration gradient
(Figure 19), using a column GraceSmart Rp 18 5 µm (150 x 2.1 mm) preceded by a
precolumn (C12,4 x 2mm.; Phenomenex).
61

The mobile phase was water with 0.1% acetic acid and methanol, flow rate
250 µl.min-1. The injection volume was 20 µl; the analysis time was equal to 8 minutes.
0 1 2 3 4 5 6 7 80
10
20
30
40
50
60
70
80
90
100
acetic acid 0.1%
methanol
time (minutes)
conc
entr
ation
(%)
Figure 19: concentration gradient for the chromatographic analysis of AOZ and AMOZ
The mass spectrometer was operated in negative ESI mode with source voltage 5kV,
capillary temperature 260°C and sheath and auxiliary gas (nitrogen) flow rates of 56 and
3 arbitrary units, respectively.
The acquisition occurred in MS/MS in SRM mode (Selected reaction monitoring);
helium was used for collision-induced dissociation. Parent and product ions were
characterized by the following mass to charge ratios: AMOZ : 335.0 → 262, 291; AOZ:
236.0 → 104, 134, 236 with the collision energy settings at 38% and 50%, respectively
(Figure 20).
62

Figure 20: LC-MS/MS chromatogram and corresponding SRM spectrum of a blank sample fortified with 20.0 ng.ml-1 of AMOZ and AOZ
Validation of the method
The calibration curve has been constructed using faeces with 5 fortification levels: 1.0;
2.0; 5.0; 10.0; 20.0 ng.ml-1 (3 points each concentration); moreover 20 not fortified
manure specimens have been analyzed to measure the background noise, necessary to
determine the sensitivity parameters. The method has been evaluated in terms of
decision limit (CCα), detection capability (CCβ), linearity of the calibration gap (R2)
and yield, according to the guide lines of the Decision of the Committee n° C (2002) 63

3044 of the 12th of August 2002 that accomplishes the directive 96/23/CE, regarding the
yield of the analytical methods and the interpretation of the results, reported below.
AMOZ AOZ
CCα (ng.ml-1) 0.20 0.45
CCβ (ng.ml-1) 0.30 1.30
R2 0.97 0.97
Yield 47% 37%
64
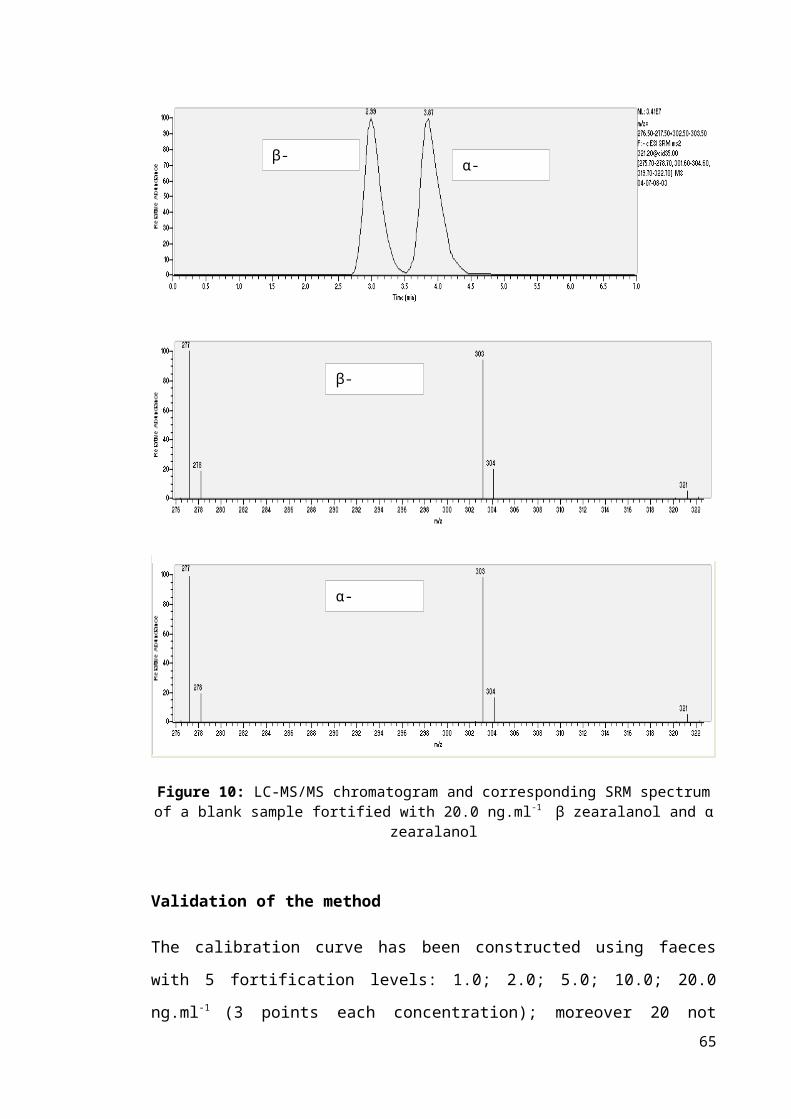
PERSISTENCE testsNITROFURANS
The average results in HPLC MS-MS, obtained at the different sampling times (average
of three samples every day) fortifying 0.3m3 manure with 500 ng.ml-1 of AMOZ and
500 ng.ml-1 of AOZ (Sample) and expressed in percentage as the ratio between the
value detected at time zero and the other times , together with the results obtained with
the not fortified specimen (Blank), are shown in figure 21and 22 and in table 10.
AMOZ AOZ
Day Blank (%) Sample (%) Blank (%) Sample (%)
0 n.d. 100.00 n.d. 100.00
3 n.d 8.86 n.d 8.91
6 n.d 6.21 n.d 6.29
12 n.d. 5.06 n.d. 1.28
20 n.d. 4.51 n.d. 1.32
36 n.d 3.91 n.d 1.37
52 n.d 1.66 n.d 1.26
66 n.d. 0.34 n.d. 1.13
80 n.d 0.09 n.d 0.85
100 n.d ‹O.06 n.d 0.62
120 n.d. ‹0.06 n.d. 0.29
Table 10: average concentrations of the spiked and blank sample at each sampling time, expressed in percentage as the ratio between the value detected at
time zero and the other times
65

0 20 40 60 80 100 1200
10
20
30
40
50
60
70
80
90
100
AMOZ
BlankSample
Days
Conc
entr
ation
%
Figure 21: average concentrations of the spiked and blank sample at each sampling time, expressed in percentage as the ratio between the value
detected at time zero and the other times
0 20 40 60 80 100 1200
10
20
30
40
50
60
70
80
90
100
AOZ
BlankSample
Days
Conc
entr
ation
%
Figure 22: average concentrations of the spiked and blank sample at each sampling time, expressed in percentage as the ratio between the value
detected at time zero and the other times
66

The chromatograph and the respective mass spectrum of the lowest detected
concentration of AMOZ and AOZ are shown in figure 23 (0.45 ng.ml-1 on the day 80 for
AMOZ and 1.5ng.ml-1 on the day 120 for AOZ), even if the AMOZ concentration was
less than CCβ.
Figure 23: chromatograph and respective mass spectrum concerning the sample AOZ and AMOZ at the lowest detected concentration (0.45 ng.ml-1 on the day 80 for AMOZ and
1.5ng.ml-1 on the day 120 for AOZ)
67

CLENBUTEROL
68

OVERVIEWCLENBUTEROL
[4-amino-(t-butylamino)methyl-3,5-dichlorobenzyl-alcohol-hydrochloride]
or Clenbuterol is a β2 adrenergic agonist licensed in European Country for several
diseases: it can be prescribed to breathing disorders sufferers as a decongestant and a
bronchodilator especially in COPD , asthma and allergic respiratory diseases (Prezelj
et al 2003).
Clenbuterol belongs to the phenethanolamine β-adrenergic agonists family as shown in
figure 24. In the aromatic ring the substitution in –A and –C (meta position) or –B (para
position) could be an alcoholic group, a methanolic group or an halogen atom, therefore
the phenethanolamines are usually divided into two main sub-classes, that are phenol-
like and aniline-like compounds and clenbuterol belongs to the latter group. Adjacent to
the aliphatic nitrogen, R substitution is often a large group and it could be a t-butyl
group, a isopropyl group, an alkylphenyl or an alkylphenol.
Figure24: common stucture of phenethanolamine β-adrenergic agonists and main substitution patterns
Not all phenethanolamines are β-agonists: some are β-antagonists, some activate
α-receptors and some are specific for subclasses within each of the α- and β- receptor
subfamilies. In fact the substitutions are very important for biological activity (Baker
and Kiernan, 1983; Kruger et al. 1984; Anderson et al. 1987) and they influence the
longevity of the β-agonists and the compounds’ efficacy at the receptor. Moreover
clenbuterol has got halogen atoms in meta- position of the aromatic ring (figure 25), so
69

the chlorine atoms do not inhibit binding to the receptor and they prevent the rapid
metabolic deactivation that occurs with hydroxylated group (Morgan 1990). The
aromatic substituent present on clenbuterol, called dichloroaniline, increases the
lipophilicity because it has a log P value, the octanol/water partition coefficient
(Wallis 1993).
Figure25: comparison between clenbuterol and terbutaline
Clenbuterol is an authorized β-agonist for specific therapeutic uses only in the EU
(horses and cows) (Off. J. Eur. Union, L 170 of 9.7.1996, 8-10), USA (horses)
(http://www.fda.gov) and Canada. In Australia, some β-agonists, including clenbuterol,
are authorized in livestock animals but their MRLs have been established. But some β-
agonists can be used or abused as growth promoters. In fact at doses several times
higher than therapeutic ones, they induce muscular hypertrophy by decreasing muscular
degradation and fat synthesis. As a result, the ratio of muscle to fat is modified (the
proportion of muscle in the carcass is increased), with an overall improvement in
growth performance (AgEdLibrary.com 2006).
The European Union (Council Directive 96/22/EC) banned the use of growth
promoters; moreover placing β-agonists on the market to use in farm animals intended
for human consumption is forbidden in the EU and the Directive also prohibits the
importation from third countries of farm animals to which β-agonists have been
administered. Despite the fact that its use is forbidden, there have been several cases of
intoxication due to ingestion of meat or liver poisoned by clenbuterol in Spain
(Martìnez-Navarro 1990; Garay et al. 1997), in France (Pulce et al.. 1991), in Italy
(Maistro et al. 1995; Brambilla et al. 1997, 2000) and in China (Shiu and Chong 2001).
Some people with an acute intoxication reported nausea, diarrhoea, fever, distal tremors,
70
Clenbuterol
Terbutaline
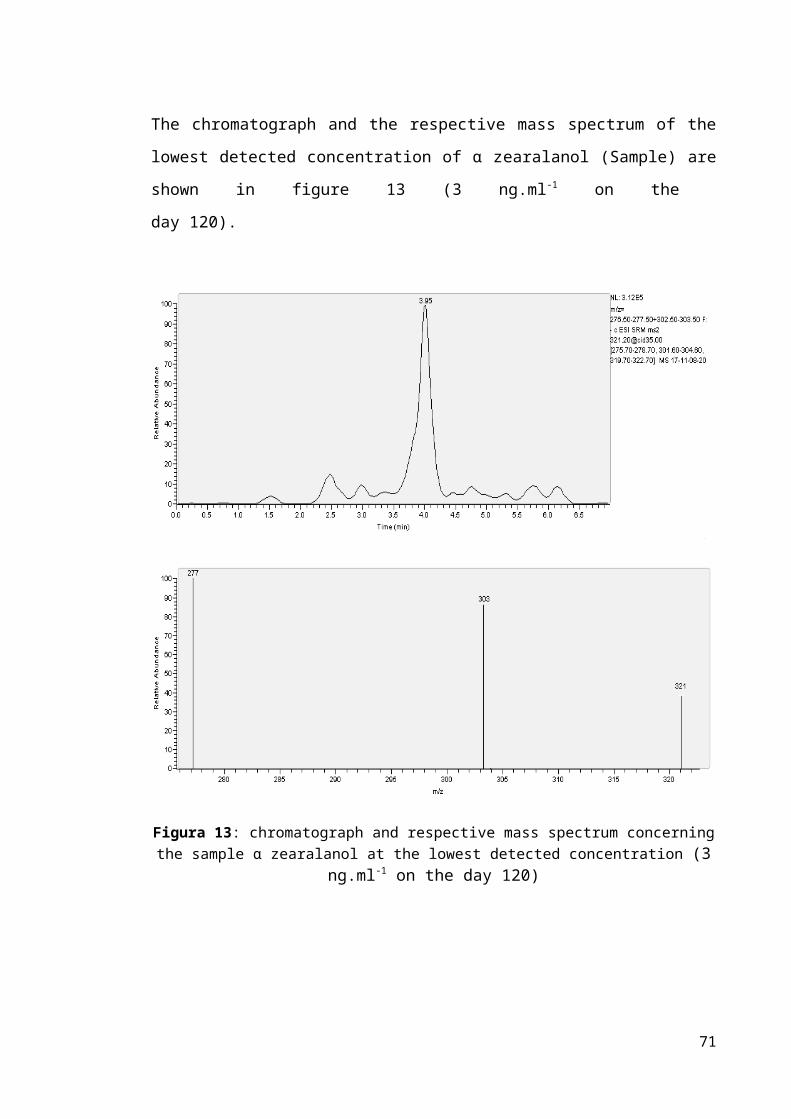
myalgias, hypertension and asthenia. The electrocardiograms of some patients showed
sinus tachycardia (120–150 bpm), supraventricular and ventricular ectopics and even
atrial fibrillation (Spangler 1989).
Moreover, if clebuterol and other β-agonists are taken by patients with pre-existing
cardiac diseases and hypoxemia, these substances could cause more serious cardiac
events (Suissa et al. 1996). Although the effect of repeated exposures to clenbuterol on
heart is uncertain, in the rat it has been shown to induce left ventricular hypertrophy
with normal functional, morphological, and molecular hypertrophy (Wong 1998).
The concentrations of clenbuterol that some authors found in liver and in meat samples
were very high, full pharmacological effects may be expected in humans after
consuming 100-200g of product (Kuiper et al. 1998); this is more or less equivalent to
five times the therapeutic dosage (Sporano et al. 1998).
Presence of Clenbuterol in edible tissues of livestock represents a high risk to consumer
because, in contrast with other β-agonists, clenbuterol has a high oral potency, it is well
absorbed after ingestion with a bioavailability of 70-80% (Smith DJ 1998) and it has a
long elimination half –time (25-39 hours). In addition it was demonstrated that toxicity
is independent of the way the contaminated food is cooked, in fact clenbuterol is very
stable to heat, it lasts up to five minutes in cooking oil at 260°C (Rose et al. 1995).
The Italian situation shows a decrease in positive match to β2-agonists from 1996 to
1998, 5% and 0.2% of positive cases respectively (Italian Minister of Health 1995-1998,
1999), perhaps because new organic compounds have been developed with similar
impact on the production of lean meat (Gallo et al. 2007).
71

ELISA tests (1)CLENBUTEROL
The “Enhanced Kit Clenbuterol” (cod n°101210) has been used to search for
clenbuterol; this kit is produced by Neogen Corporation (944 N andino Boulevard,
Lexington, KY 40511 USA) and is bought by Diessechem s.r.l., Via Meucci 61/b,
Milano.
The producer of the kit, that is developed for the analysis of urines, plasma or serum,
reports the following sensitivities in ng.ml-1:
Clenbuterol
ng.ml-1
Diluted equine urines 1:1 0.72
Diluted dog urines 1:1 0.35
Equine plasma 0.52
Equine serum 1.01
The reported cross reaction, assumed that one of clenbuterol equal to 100%, is equal to:
60 % for hydroxiclenbuterol , 1.85% for tulobuterol and below 0.5% for the other β
agonists.
Method
24 specimens (Samples) each one with 4 ml of manure and 12 specimens (Standard)
each one with 4 ml of water have been prepared (to verify the different reading in
absorbance between manure and water and so the matrix effect).
20 Samples have been fortified with clenbuterol at 2.0; 5.0; 10.0; 20.0 and 50.0 ng.ml-1
concentrations (4 Samples each concentration). 10 Standard have been fortified with
clenbuterol at 2.0; 5.0; 10.0; 20.0; and 50 ng.ml-1 concentrations (2 Standard each
concentration). The remaining 4 Samples and 2 Standard have not been fortified
(Clenbuterol concentration equal to zero).
72

Both the Samples and the Standard have been centrifuged to 1400 g for 5 minutes.
20 µl supernatant have been taken to be used in ELISA test, following the producer’s
instructions.
Moreover other 20 µl supernatant of the Samples at clenbuterol concentrations from 10
to 2 ng.ml-1 have been diluted 1:10 with water to obtain the 0.1; 0.2; 0.5 and 1.0 ng.ml-1
concentrations.
The results, as averages, are reported in table 11 and figure 26
clenbuterol
ng.ml-1
Standard
absorbance
Sample
absorbance
0 0,8561 0,6941
0.1 / 0,6503
0.2 / 0,6045
0.5 / 0,5141
1.0 / 0,3014
2.0 0,2655 0,2195
5.0 0,1465 0,1276
10.0 0,0932 0,0935
20.0 0,0746 0,0708
50.0 0,0645 0,0661
Table 11: average absorbance of Samples and Standard according to clenbuterol concentration
73

0 5 10 15 20 25 30 35 40 45 500
0.1
0.2
0.3
0.4
0.5
0.6
0.7
0.8
0.9
StandardSample
concentration ng.ml-1
abso
rban
ce
Figure 26: average absorbance of Samples and Standard according to clenbuterol concentration
Conclusions
The detection limit seems to be between 0.1 and 0.2 ng.ml-1, while the saturation of the
system occurs at about 10 ng.ml-1. In fact the absorbance response does not change with
higher concentrations, remaining constant.
From figure 26, the matrix effect seems to be negligible.
74
ELISA tests (2)BRONCHODILATORS (clenbuterol)
The “Enhanced Kit Bronchodilator group” (cod n°100310) has been used; it is
produced by Neogen Corporation (944 Nandino Boulevard, Lexington, KY 40511
USA) and bought by Diessechem s.r.l., Via Meucci 61/b, Milano.
The kit producer reports the sensitivities to β agonists in urines, plasma or pig, equine,
dog serum to be between 0.6 ng.ml-1 for terbutaline (that anyway results the most
detectable molecule) and 9 ng.ml-1 for metaproterenol, in equine plasma.
The reported cross reaction, assumed that one of terbutaline equal to 100%, is equal to:
65 % for clenbuterol, 35% for salbutamol and albuterol and decreasing for the other β
agonists.
Method
The kit has been tested on both the terbutalin and on clenbuterol and on a blend of the
two β agonists mixed in equal parts.
Terbutaline
16 specimens (Samples) each one with 4 ml of manure and 16 specimens (Standard)
each one with 4 ml of water have been prepared (to verify the different reading in
absorbance between manure and water and so the matrix effect).
14 Samples have been fortified with terbutalin at 0.5; 1.0; 2.0; 5.0; 10.0; 20.0 and
50.0 ng.ml-1 concentrations (2 Samples each concentration). 14 Standard have been
fortified with terbutalin at 0.5; 1.0; 2.0; 5.0; 10.0; 20.0; 50.0 ng.ml-1 concentrations
(2 Standard each concentration). The remaining 2 Samples and 2 Standard have not
been fortified (Terbutaline concentration equal to zero).
Both the Samples and the Standard have been centrifuged to 1400 g for 5 minutes.
20 µl supernatant have been taken to be used in ELISA test, following the producer’s
instructions.
75
Clenbuterol
16 specimens (Samples) each one with 4 ml of manure and 16 specimens (Standard)
each one with 4 ml of water have been prepared (to verify the different reading in
absorbance between manure and water and so the matrix effect).
14 Samples have been fortified with clenbuterol at 0.5; 1.5; 2.0; 5.0; 10.0; 20.0; and
50.0 ng.ml-1 concentrations (2 Samples each concentration). 14 Standard have been
fortified with clenbuterol at 0.5; 1.5; 2.0; 5.0; 10.0; 20.0; and 50.0 ng.ml-1concentrations
(2 Standard each concentration). The remaining 2 Samples and 2 Standard have not
been fortified (Clenbuterol concentration equal to zero).
Both the Samples and the Standard have been centrifuged to 1400 g for 5 minutes.
20 µl supernatant have been taken to be used in ELISA test, following the producer’s
instructions.
Terbutaline+Clenbuterol
14 specimens (Samples) each one with 4 ml of manure and 14 specimens (Standard)
each one with 4 ml of water have been prepared (to verify the different reading in
absorbance between manure and water and so the matrix effect).
12 Samples have been fortified with terbutaline+clenbuterol at 0.5; 2.0; 5.0; 10.0; 20.0
and 50 ng.ml-1 concentrations (2 Samples each concentration; the concentration has to
be interpreted as the sum of the concentrations of the two β agonists in equal parts: for
example 0.5=0.25+0.25). 12 Standard have been fortified with terbutalin+clenbuterol at
0.5; 2.0; 5.0; 10.0; 20.0; 50.0 ng.ml-1 concentrations (2 Standard each concentration).
The remaining 2 Samples and 2 Standard have not been fortified
(terbutaline+Clenbuterol concentration equal to zero).
Both the Samples and the Standard have been centrifuged to 1400 g for 5 minutes.
20 µl supernatant have been taken to be used in ELISA test, following the producer’s
instructions.
The results of the different implemented tests, as averages, are reported in the table 12
and figure 27 for terbutaline; in table 13 and figure 28 for clenbuterol; in table 14 and
figure 29 for terbutaline + cenbuterol.
76

terbutaline
ng.ml-1
Standard
absorbance
Sample
absorbance
0 0,5925 0,52
0,5 0,4389 0,417
1 0,3384 0,2745
2 0,2915 0,2585
5 0,1935 0,2225
10 0,1585 0,179
20 0,118 0,1335
Table 12: average absorbance of Samples and Standard according to terbutaline concentration
0 5 10 15 20 25 30 35 40 45 50
-0.0999999999999991
9.15933995315754E-16
0.100000000000001
0.200000000000001
0.300000000000001
0.400000000000001
0.500000000000001
0.600000000000001
StandardSample
concentration ng.ml-1
abso
rban
ce
Figure 27: average absorbance of Samples and Standard according to terbutaline concentration
77
Clenbuterol
ng.ml-1
Standard
absorbance
Sample
absorbance
0 0,562 0,6135
0,5 0,4378 0,3875
1,5 0,3358 0,2945
2 0,331 0,2733
5 0,2645 0,2348
10 0,209 0,2275
20 0,1925 0,1815
50 0,1545 0,1445
Table 13: average absorbance of Samples and Standard according to clenbuterol concentration
0 5 10 15 20 25 30 35 40 45 500
0.1
0.2
0.3
0.4
0.5
0.6
0.7
StandardSample
concentration ng.ml-1
abso
rban
ce
Figure 28: average absorbance of Samples and Standard according to clenbuterol concentration
78

Terbutaline+clenbuterol
ng.ml-1
Standard
absorbance
Sample
absorbance
0 0,7325 0,623
0,5 0,5286 0,4185
2 0,3065 0,2865
5 0,1785 0,218
10 0,138 0,1812
20 0,128 0,1685
50 0,1187 0,147
Table 14: average absorbance of Samples and Standard according to the concentration of terbutaline together with clenbuterol
0 5 10 15 20 25 30 35 40 45 500
0.1
0.2
0.3
0.4
0.5
0.6
0.7
0.8
StandardSample
concentration ng.ml-1
abso
rban
ce
Figure 29: average absorbance of Samples and Standard according to the concentration of
terbutaline together with clenbuterol
79

Conclusions
Terbutaline
The detection limit seems to be less than 0.5 ng.ml-1, while the saturation of the system
takes place at about 20 ng.ml-1. From figure 27, a matrix effect does not seem to exist.
Clenbuterol
The detection limit seems to be less than 0.5 ng.ml-1, while the saturation of the system
takes place between 10 and 20 ng.ml-1. From figure 28, a matrix effect does not seem to
exist.
Terbutaline+Clenbuterol
The detection limit seems to be less than 0.5 ng.ml-1, while the saturation of the system
takes place at about 10 ng.ml-1. From figure 29, a matrix effect seems to be negligible.
80

HPLC MS-MS testsCLENBUTEROL
Extraction
2 ml manure have been put in a plastic test tube, with a capacity of 15 ml and screw
plug, and 10 ng.ml-1 noretandrolone have been added as Internal Standard. Then 3 ml of
water and 1 ml NaOH 1N have been added. After shaking in Vortex for 30 seconds, 4
ml tert-butyl-methyl-ether (TBME) have been added. The test tubes have been shaken
in a rotative mixer for 20 min and then centrifuged to 2000 g for 15 minutes. Afterwards
the supernatant has been taken and, after move to a glass test tube with a capacity of 10
ml and the conic bottom, it has been dried in centrifugal evaporator at 55 °C. The
residue, diluted in 200 µl of a blend methanol/water (50:50 v/v), has been put for the
analysis in a plastic autosampler vial, with a capacity of 250 µl and the conic bottom.
Analysis
An ion trap mass spectrometer LCQDecaXPMax, equipped with a source APCI
(Atmospheric pressure chemical ionization) and linked with an autosampler AS
Surveyor and a pump MS Surveyor (all the components: Thermo Fisher, San Jose´,CA,
USA), has been used for the analysis.
The chromatography has been employed at 30°C, with a concentration gradient
(figure 30), using a column GraceSmart Rp 18 5 µm (150 x 2.1 mm) preceded by a
precolumn (C12,4 x 2mm.; Phenomenex).
The mobile phase was water with 0.1% acetic acid and methanol, flow rate
250 µl.min-1. The injection volume was 20 µl; the analysis time was equal to 18
minutes.
The mass spectrometer was operated in positive APCI mode with source voltage 6kV,
vaporizer temperature 290°C, capillary temperature 150°C and sheath and auxiliary gas
(nitrogen) flow rates of 20 and 10 arbitrary units, respectively. The acquisition occurred
in MS/MS in SRM mode (Selected reaction monitoring); helium was used for collision-
induced dissociation. Parent and product ions were characterized by the following mass
81

to charge ratios: clenbuterol : 277.0 → 203, 259; noretandrolone: 303.0 → 215, 227,
267, 285 (figure 31) with the collision energy settings at 28% and 32%, respectively.
0 2 4 6 8 10 12 14 16 180
10
20
30
40
50
60
70
80
90
100
Acid acetic 0.1% methanol
time (min)
conc
entr
ation
(%)
Figure 30: concentration gradient for the chromatographic analysis of clenbuterol
Validation of the method
The calibration curve has been constructed using faeces with 4 fortification levels: 0.1;
1.0; 5.0; 10.0 ng.ml-1 (3 points each concentration); moreover 20 not fortified manure
specimens have been analyzed to measure the background noise, necessary to determine
the sensitivity parameters. The method has been evaluated in terms of decision limit
(CCα), detection capability (CCβ), linearity of the calibration gap (R2) and yield,
according to the guide lines of the Decision of the Committee n° C (2002) 3044 of the
12th of August 2002 that accomplishes the directive 96/23/CE, regarding the yield of the
analytical methods and the interpretation of the results (see below).
Clenbuterol
CCα (ng.ml-1) 0.14
CCβ (ng.ml-1) 0.22
R2 0.99
Yield 60%
82
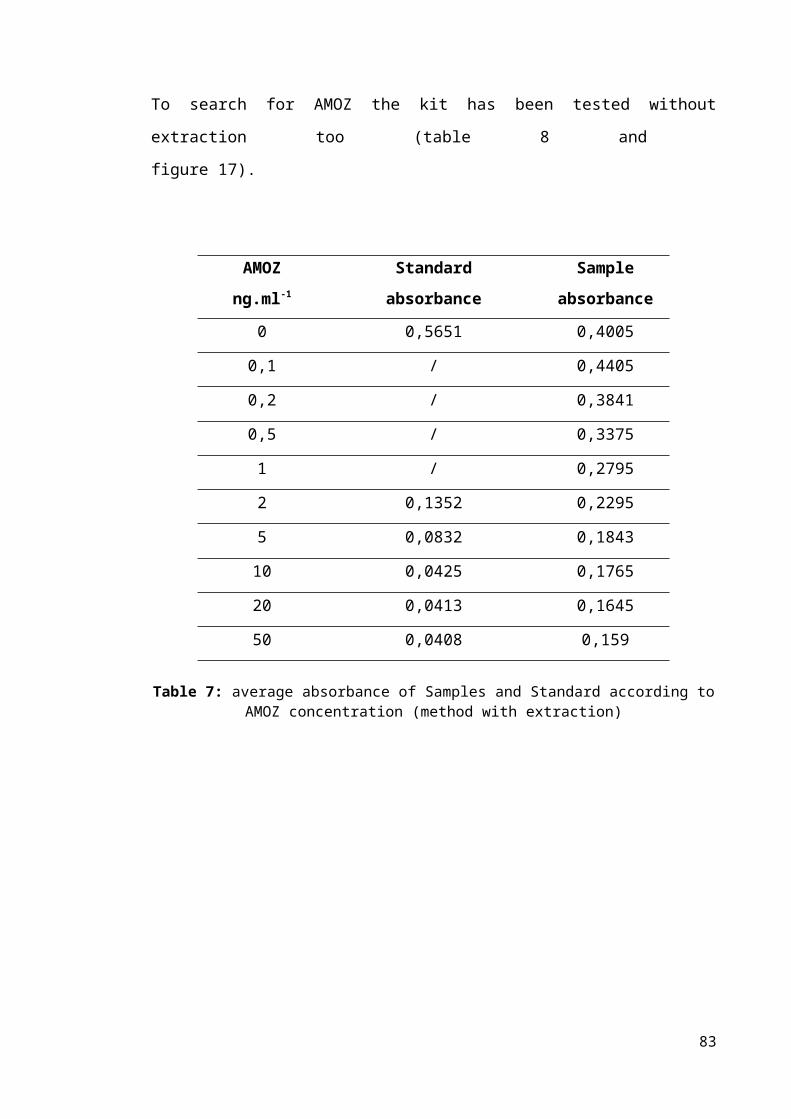
Figure 31: LC-MS/MS chromatogram and corresponding SRM spectrum of a blank sample
fortified with 10.0 ng.ml-1 of clenbuterol
83
clenbuterol
noretandrolone
clenbuterol

PERSISTENCE testsCLENBUTEROL
The average results in HPLC MS-MS, obtained at the different sampling times (average
of three samples every day) fortifying 0.3m3 manure with 500 ng.ml-1 clenbuterol
(Sample) and expressed in percentage as the ratio between the value detected at time
zero and the other times , together with the results obtained with the not fortified
samples (Blank), are shown in figure 32 and in table 15.
Day Blank (%) Sample (%)
0 n.d. 100.00
3 n.d 82.16
6 n.d 57.00
12 n.d. 37.44
20 n.d. 35.83
36 n.d 32.12
52 n.d 28.11
66 n.d. 19.54
80 n.d 16.87
100 n.d 12.86
120 n.d. 8.00
Table 15: average concentrations of the sample and blank at each sampling time expressed in percentage as the ratio between the value detected at time zero and the other
times
84
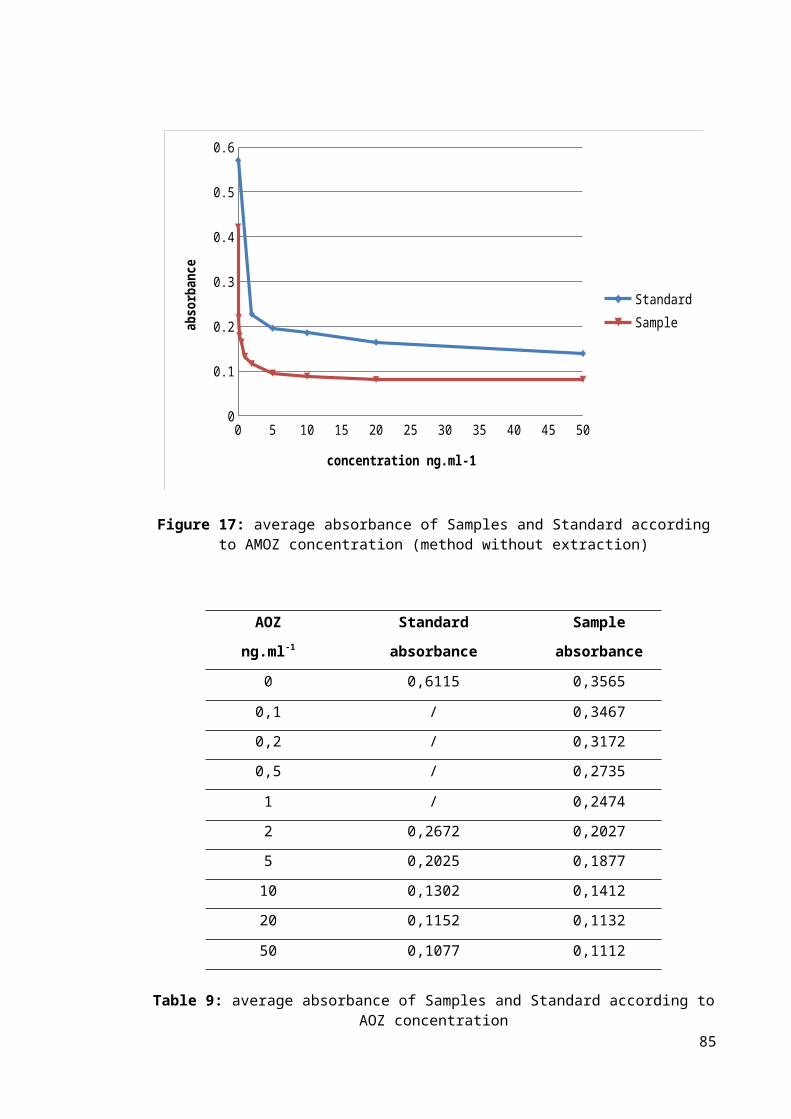
0 20 40 60 80 100 1200
10
20
30
40
50
60
70
80
90
100
BlankSample
Days
Conc
entr
ation
%
Figure 32: average concentrations of the Sample and Blank at each sampling time expressed in percentage as the ratio between the value detected at time zero and the other times
The chromatograph and the respective mass spectrum of the lowest detected
concentration of clenbuterol are shown in figure 33 (40ng.ml-1 on the day 120).
Figure 33: Chromatograph and respective mass spectrum concerning the sample clenbuterol at
the lowest detected concentration (40ng.ml-1 on the day 120)
85

DES and DIENESTROL
86

OVERVIEWDIETHYLSTILBESTROL
Diethylstilbestrol (Figure 34) or DES or 4-[4-(4-hydroxyphenyl)hex-3-en-3-yl]phenol is
an orally active synthetic nonsteroidal oestrogen, derivate from stilbene, that was first
synthesized in 1938 by Leon Golberg and a report of its synthesis was published in
Nature on February 5, 1938 (Dodds et al. 1938).
Diethylstilbestrol was prescribed to a large population of pregnant women, to prevent
miscarriage and other pregnancy complications. Subsequently, it was shown that the
cohort of women exposed to DES in utero exhibited a wide range of reproductive tract
abnormalities, including a low, but significantly increased, incidence of vaginal
adenocarcinoma (Herbst et al. 1981). Likewise, it was reported that men exposed to
DES in utero experienced a variety of reproductive tract problems, including reduced
fertility and retained testicles (Herbst et al. 1981).
Figure34:structure of diethylstilbestrol
Diethylstilbestrol and other stilbenoids compounds with an estrogenic effect (for
example esestrol) were available as growth promoters in some extra-european countries,
for example diethylstilbestrol was legally used in zootechnical field in USA up to 1979
(Gandhi and Snedeker 2000).
The anabolic action of estrogens is more pronounced in subjects with a more reduced
endogenous production (calves, lambs, young heifers and castrated males) even though 87

in illegal activity these compounds are also employed in old dairy cows before
slaughtering. In fact the direct auxinic effect is strictly linked with the presence and the
concentration of estrogens’ receptors (Meyer HHD and Rapp 1985). This parameter
does not seem to show big differences between males and females , but it seems to vary
in relation to the nature of the considered muscular group. In bovine it has been
evaluated that the medium content of estrogens’ receptors in muscles of hind legs is
more or less double respect to the abdomen’s muscles, in agreement with the different
content of allometric growth, that is depending on estrogens (Sauerwein and Meyer
HHD1989). An indirect auxinic effect also exists; it performs stimulating the increase of
the growth hormone (GH) and determining both the over regulation of receptors of liver
GH and the increase of hematic levels of IGF1 (factor of insulin-like growth). The
effects are evident in all the tissues, included rumen and intestine, with a clear increase
of protein anabolism and of minerals’ retention (Meyer HHD 2007). The differences in
anabolic action of the various molecules with an estrogenic action mainly depend on the
different capability to link with estrogenic receptors (ER) as well as on the intensity of
the phenomena of first passing and on the elimination’s speed. Some in vitro studies,
carried out in yeasts where receptors for human estrogens were expressed, have shown
more relationship with synthesis estrogens like diethylstilbestrol and
17α etinilestriadiol.
Since the extent of the effect of first passing is poor for diethylstilbestrol, in the
countries where this substance was recorded, both oral and parenteral preparations
existed to use with bovines.
Diethylstilbestrol and almost all the synthesis estrogen-like compounds are usually
refractory to oxidations, in fact they are expelled as glucuronides trough bile and urine
(Rico 1983).
The effects of diethylstilbestrol in human and in animal experiments have been
summarized in several reviews (e.g. Newbold 1995; Newbold and McLachlan 1996;
Golden et al 1998).
Diethylstilbestrol exposure has been associated with several health effects, including
cancer, reproductive abnormalities, immune dysfunction and alteration of psychosexual
development (Giusti et al 1995). These associations are reviewed in table 16.
88

Table 16: Summary of Known and Suspected Health Effects of Diethylstilbestrol Exposure (Giusti, R. M. et. al., Ann. Intern. Med. 1995; 122:778-788)
It is well known that diethylstilbestrol has caused an otherwise rare tumor in young
women (clear cell carcinoma of the vagina) who had been exposed during critical
phases of development. The risk of cancer was estimated to be small (in the order of
1 per 1000) in daughters of women who had received diethylstilbestrol during
pregnancy, but also other non-malignant genital tract abnormalities have been
frequently observed in these so-called diethylstilbestrol-daughters (Herbst 1981). In
males exposed in utero to diethylstilbestrol (diethylstilbestrol-sons), urogenital tract
abnormalities (e.g. epidydimal cysts, cryptorchidism, hypospadias, hypoplastic testicles)
have been found more frequently than in non-exposed controls (about 30%, compared
to 8%). The sperm quality of “diethylstilbestrol-sons” was clearly inferior, which has
been attributed to higher incidence of hypoplastic testicles (Gill et al. 1979).
The mechanism or mechanisms through which diethylstilbestrol exerts its carcinogenic
and other toxic effects remain unclear. Diethylstilbestrol is not mutagenic in the Ames
test. However, investigators have observed increased chromosomal aberrations in
neonatal mice that were exposed to diethylstilbestrol in vivo and increased sister
chromatid exchange in cultured human fibroblasts induced by diethylstilbestrol
(Marselos and Tomatis 1981). The formation of abnormal or arrested mitotic spindles
caused by the disruption of microtubules in embryonic hamster cells has also been seen.
Reactive intermediates of the oxidative metabolism bind covalently to DNA may
contribute to diethylstilbestrol toxicity (Metzler 1981; Marselos and Tomatis 1981).
89

ELISA TESTSDIETHYLSTYLBESTROL
The “Ridascreen® DES” (cod n° R2701) kit has been used; it is produced by
R-BioPharm and bought by R-BioPharm Italia S.r.l. Via dell’Artigianato, 13, 20070
Cerro al Lambro, Milano.
The producer of the kit reports the sensitivity only in urines, that is equal to 200 ppt,
even though the kit has been tested, besides urines, in bile, muscles and faeces.
The reported cross reaction, assumed that one of diethylbestrol equal to 100%, is equal
to: 68 % for metabolite glucuronate, 22% for esestrol and <0.01% for the other
estrogens.
Method
28 specimens (Samples) each one with 4 ml of manure and 14 specimens (Standard)
each one with 4 ml of water have been prepared (to verify the different reading in
absorbance between manure and water and so the matrix effect).
24 Samples have been fortified with diethylbestrol at 12.5; 25.0; 50.0; 100.0; 200.0;
400.0 pg.g-1 concentrations (4 Samples each concentration). 12 Standard have been
fortified with diethylbestrol at 12.5; 25.0; 50.0; 100.0; 200.0; 400.0 pg.g-1
concentrations (2 Standard each concentration). The remaining 4 Samples and 2
Standard have not been fortified (Diethylbestrol concentration equal to zero).
Both the Samples and the Standard have been centrifuged to 1400 g for 5 min. 20 µl
supernatant have been taken to be used in ELISA test, following the producer’s
instructions.
The results, as averages, are reported in table 17 and figure 35.
90

diethylbestrol Standard Sample
pg.ml-1 absorbance absorbance
0 0,5415 0,5534
12,5 0,5297 0,5345
25 0,4725 0,4731
50 0,399 0,4192
100 0,2967 0,3195
200 0,2205 0,2195
400 0,1731 0,1823
Table 17: average absorbance of Samples and Standard according to diethylbestrol
concentration
0 50 100 150 200 250 300 350 4000
0.1
0.2
0.3
0.4
0.5
0.6
StandardSample
concentration pg.ml-1
abso
rban
ce
Figure 35: average absorbance of Samples and Standard according to diethylbestrol
concentration
Conclusions
The detection limit seems to be between 25 and 12.5 pg.ml-1, while the saturation of the
system occurs after the tested 400 pg.ml-1. Moreover the matrix effect does not seem to
exist.
91
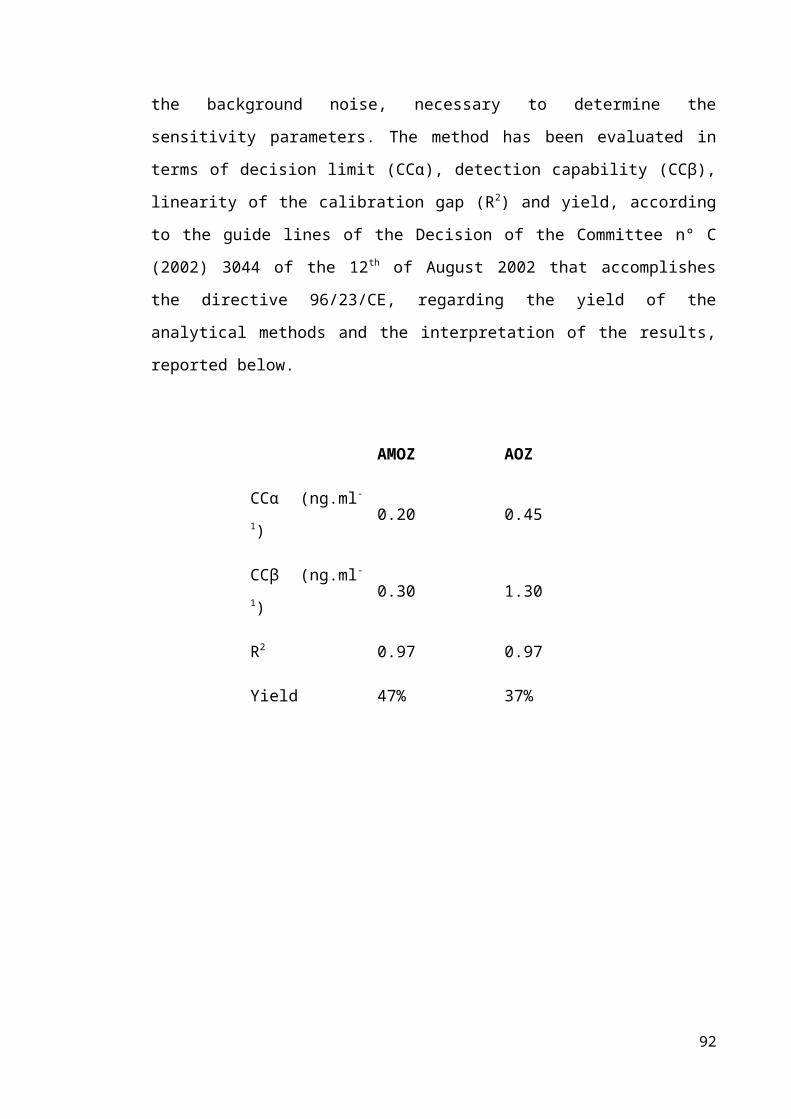
HPLC MS-MS testsDIENESTROL
Extraction
2 ml manure have been put in a plastic test tube, with a capacity of 15 ml and screw
plug, and 10 ng.ml-1 noretandrolone have been added as Internal Standard. Then 3 ml of
water and 1 ml NaOH 1N have been added. After shaking in Vortex for 30 seconds,
4 ml ethyl acetate have been added. The test tubes have been shaken in a rotative mixer
for 20 min and then centrifuged to 2000 g for 15 minutes. Afterwards the supernatant
has been taken and, after move to a glass test tube with a capacity of 10 ml and the
conic bottom, it has been dried in centrifugal evaporator at 55 °C. The residue, diluted
in 200 µl of a blend methanol/water (50:50 v/v), has been put for the analysis in a
plastic autosampler vial, with a capacity of 250 µl and the conic bottom.
Analysis
An ion trap mass spectrometer LCQDecaXPMax, equipped with a source APCI
(Atmospheric pressure chemical ionization) and linked with an autosampler AS
Surveyor and a pump MS Surveyor (all the components: Thermo Fisher, San Jose´,CA,
USA), has been used for the analysis.
The chromatography has been employed at 30°C, with a concentration gradient
(figure 36), using a column GraceSmart Rp 18 5 µm (150 x 2.1 mm) preceded by a
precolumn (C12,4 x 2mm.; Phenomenex).
The mobile phase was water with 0.1% acetic acid and methanol, flow rate
250 µl.min-1. The injection volume was 20 µl; the analysis time was equal to 10 min.
The mass spectrometer was operated in positive APCI mode with source voltage 4.5
kV, vaporizer temperature 350°C, capillary temperature 210°C and sheath and auxiliary
gas (nitrogen) flow rates of 23 and 5 arbitrary units, respectively. The acquisition
occurred in MS/MS in SRM mode (Selected reaction monitoring); helium was used for
collision-induced dissociation. Parent and product ions were characterized by the
following mass to charge ratios: dienestrol : 267.0 → 107, 121, 135, 173;
92

noretandrolone: 303.0 → 215, 227, 267, 285 (Figure 37) with the collision energy
settings at 30% and 32%, respectively.
0 1 2 3 4 5 6 7 8 9 100
10
20
3040
50
6070
80
90100
acid acetic 0.1% methanol
time (minutes)
conc
entr
ation
(%)
Figure 36: concentration gradient for the chromatographic analysis of dienestrol
Validation of the method
The calibration curve has been constructed using faeces with 4 fortification levels: 0,1;
1.0; 5.0; 10.0 ng.ml-1 (3 points each concentration); moreover 20 not fortified manure
specimens have been analyzed to measure the background noise, necessary to determine
the sensitivity parameters. The method has been evaluated in terms of decision limit
(CCα), detection capability (CCβ), linearity of the calibration gap (R2) and yield,
according to the guide lines of the Decision of the Committee n° C (2002) 3044 of the
12th of August 2002 that accomplishes the directive 96/23/CE, regarding the yield of the
analytical methods and the interpretation of the results, reported below.
CCα (ng.ml-1) CCβ (ng.ml-1) R2 Yield
dienestrol 0.41 0.86 0.99 77%
93

Figure 37: LC-MS/MS chromatogram and corresponding SRM spectrum of a blank sample
fortified with 10.0 ng.ml-1 of dienestrol
94
dienetrol
noretandrolone
dienetrol

PERSISTENCE testsDIENESTROL
The average results, obtained at the different sampling times (average of three samples
every day) fortifying 0.3m3 manure with 500 ng.ml-1 of dienestrol (Sample) and
expressed in percentage as the ratio between the value detected at time zero and the
other times , together with the results obtained with the not fortified samples (Blank),
are shown in figure 38 and in table 18.
Day Blank (%) Sample (%)
0 n.d. 100.00
3 n.d 70.29
6 n.d 69.25
12 n.d. 63.25
20 n.d. 57.13
36 n.d 49.13
52 n.d 38.54
66 n.d. 22.87
80 n.d 10.03
100 n.d 10.00
120 n.d. 10.68
Table 18: average concentrations of the fortified and blank sample at each sampling time expressed in percentage as the ratio between the value detected at time zero and the other times
The chromatograph and the respective mass spectrum of the lowest detected
concentration of dienestrol, in Sample, are shown in figure 39 (53 ng.ml-1 on the
day 120).
95

0 20 40 60 80 100 1200
10
20
30
40
50
60
70
80
90
100
BlankSample
Days
Conc
entr
ation
%
Figure 38: average concentrations of the fortified and blank sample at each sampling time expressed in percentage as the ratio between the value detected at time zero and the other times
Figure 39: chromatograph and respective mass spectrum concerning the sample of dienestrol at the lowest detected concentration (53 ng.ml-1 on the day 120).
96

ISOXSUPRINE
97

OVERVIEWISOXSUPRINE
1-(4-Hydroxyphenyl)-2-(1-methyl-2-phenoxyethylamino)propan-1-ol or isoxsuprine is
a member of the β phenylethylamine group of epinephrine-like compounds. Synthesized
by Moed and Van Dijk in 1956, its molecular structure (Figure 40) apparently shares
structural similarities with adrenaline and papaverine. These relations explain
isoxsuprine's mode of action believed to be dominantly sympathomimetic, with an
additional direct papaverine-like or spasmolytic effect 40 times that of papaverine
(Hendricks et al. 1961). In fact it is considered a β adrenoreceptor agonist with
antagonist activity at α-adrenoreceptors.
Figure 40: chemical structure of isoxsuprine
Isoxsuprine is vasodilatory (Samuels and Shaftel 1959; Baxter et al. 1989; Belloli et al.
2000), it decreases blood viscosity and it inhibits platelet aggregation and it is used in
veterinary and human medicine as a vasodilator and a relaxant of smooth muscle (Suda
et al. 1981). In veterinary medicine, isoxsuprine can be used as a peripheral vasodilator
in horse (laminitis and the treatment of navicular disease) and as an uterine muscle
relaxant as a tocolytic agent for the inhibition of premature labour in horses, cows, pigs,
sheep and goats (Brumbaugh et al. 1999; Rose et al. 1983).
When isoxsuprine is administrated, it is rapidly absorbed and distributed and plasma
concentrations of free isoxsuprine decline rapidly in horse (Matthews et al. 1986). Oral
bioavailability in horses was determined to be only 2.2%, whereas oral isoxsuprine is
98

rapidly and completely absorbed from the gastrointestinal tract in humans (Samuels and
Shaftel 1959). Rapid conjugation of isoxsuprine to its conjugated metabolite by the liver
may explain the low bioavailability.
Isoxsuprine is almost completely conjugated into its glucuronidate and sulphate
conjugates, these are reportedly excreted within the first 12 hours following an intra
venous administration and they can still be detected in urine 6 weeks after ceasing oral
dosing (JoujouSisic et al. 1996). This slow excretion may be linked to an affinity for
melanin and keratin (Torneke et al. 2000).
In human being, the most relevant pharmacological side effects are detected on the
cardiovascular system with tachycardia, hypotension and pulmonary oedema (Nimrod
et al. 1984).
In dogs, a NOEL of 0.2mg.kg-1 bw was found, based on effects on heart rate. However,
human patients are less susceptible to the cardiovascular effects than dogs at oral
treatment with isoxsuprine hydrochloride. In fact, in human, vasodilation in the
extremities is found at lower doses than cardiovascular effects: in patients with
peripheral circulatory problems the LOEL for peripheral vasodilatory effects is
0.5mg.kg-1 bw to day (EMEA 1996).
Based on the NOEL of 0.2mg.kg-1 bw for effects on heart rate in dogs and applying a
safety factor of 100, a pharmacological ADI of 0.002mg.kg-1 bw to day (equivalent to
0.2 mg.day-1 for a 60 kg person) has been established for isoxsuprine. This ADI
provides a 250-fold safety margin to the LOEL of 0.5 mg.kg-1 bw to day for peripheral
vasodilation in human patients with peripheral circulatory problems (EMEA 1996).
Mutagenicity tests in vitro have not shown evidence for any gene mutations in the Ames
test and mouse lymphoma assay. Isoxsuprine induced a dose dependent increase in
chromosomal aberrations in CHO cells in vitro, but in vivo tests indicated that the
clastogenic potential was not expressed. So, isoxsuprine is not considered to be
mutagenic (EMEA 1996).
Furthermore, as member of the β2-agonist family, isoxsuprine may act as a
repartitioning drug, resulting in an increased body weight, leaner carcasses and an
enhanced feed conversion if administered to meat producing cattle. However, due to the
general ban on β-agonists (Council Directive 97/23/EU), the use of isoxsuprine as
growth promoting agent is illegal
.
99

HPLC MS-MS testsISOXSUPRINE
Extraction
2 ml manure have been put in a plastic test tube, with a capacity of 15 ml and screw
plug, and 3 ml of water and 1 ml NaOH 1N have been added. After shaking in Vortex
for 30 seconds, 4 ml ethyl acetate have been added to each specimen.
The test tubes have been shaken in a rotative mixer for 20 min and then centrifuged to
2000 g for 15 minutes. Afterwards the supernatant has been taken and, after move to a
glass test tube with a capacity of 10 ml and the conic bottom, it has been dried in
centrifugal evaporator at 55 °C.
The residue, diluted in 200 µl of a blend methanol/water (50:50 v/v), has been put for
the analysis in a plastic autosampler vial, with a capacity of 250 µl and the conic
bottom.
Analysis
An ion trap mass spectrometer LCQDecaXPMax, equipped with a source ESI
(electrospray ionization) and linked with an autosampler AS Surveyor and a pump MS
Surveyor (all the components: Thermo Fisher, San Jose´,CA, USA), has been used for
the analysis.
The chromatography has been employed at 30°C, in isocratic conditions, using a
column GraceSmart Rp 18 5 µm (150 x 2.1 mm) preceded by a precolumn (C12,4 x
2mm.; Phenomenex).
The mobile phase was water (50%) with 0.1% acetic acid and methanol (50%), flow
rate 250 µl.min-1.
The injection volume was 20 µl; the analysis time was equal to 5 min.
The mass spectrometer was operated in positive ESI mode with source voltage 5 kV,
capillary temperature 260°C and sheath and auxiliary gas (nitrogen) flow rates of 46 and
3 arbitrary units, respectively.
100

The acquisition occurred in MS/MS in SRM mode (Selected reaction monitoring);
helium was used for collision-induced dissociation. Parent and product ions were
characterized by the following mass to charge ratios: 302 → 284 → 107, 135, 150, 190
(Figure 41).with the collision energy settings at 26 and 36%, respectively.
Figure 41: HPLC MS-MS chromatogram and corresponding SRM spectrum of a blank sample
fortified with 10.0 ng.ml-1 of isoxsuprine
Validation of the method
The calibration curve has been constructed using faeces with 4 fortification levels: 0,1;
1.0; 5.0; 10.0 ng.ml-1 (3 points each concentration); moreover 20 not fortified manure
specimens have been analyzed to measure the background noise, necessary to determine
the sensitivity parameters. The method has been evaluated in terms of decision limit
101

(CCα), detection capability (CCβ), linearity of the calibration gap (R2) and yield,
according to the guide lines of the Decision of the Committee n° C (2002) 3044 of the
12th of August 2002 that accomplishes the directive 96/23/CE, regarding the yield of the
analytical methods and the interpretation of the results, reported below.
isoxsuprine
CCα (ng.ml-1) 0.24
CCβ (ng.ml-1) 0.36
R2 0.98
Yield 65%
102

PERSISTENCE testsISOXSUPRINE
The average results, obtained at the different sampling times (average of three samples
every day) fortifying 0.3m3 manure with 500 ng.ml-1 of isoxsuprine (Sample) and
expressed in percentage as the ratio between the value detected at time zero and the
other times, together with the results obtained with the not fortified samples (Blank), are
shown in figure 42 and in table 19.
Day Blank (%) Sample (%)
0 n.d. 100.00
3 n.d 47.73
6 n.d 31.20
12 n.d. 31.53
20 n.d. 32.93
36 n.d 28.87
52 n.d 26.89
66 n.d. 24.86
80 n.d 23.54
100 n.d 20.78
120 n.d. 18.49
Table 19: average concentrations of the spiked and blank sample at each sampling time expressed in percentage as the ratio between the value detected at time zero and the other times
The chromatograph and the respective mass spectrum of the lowest detected
concentration of isoxsuprine, in Sample, are shown in figure 43 (92 ng.ml -1 on the
day 120).
103

0 20 40 60 80 100 1200
10
20
30
40
50
60
70
80
90
100
BlankSample
Days
Conc
entr
ation
%
Figure 42: average concentrations of the fortified and blank sample at each sampling time expressed in percentage as the ratio between the value detected at time zero and the other times
Figure 43: chromatograph and respective mass spectrum concerning the sample of isoxsuprine at the lowest detected concentration (92 ng.ml-1 on the day 120)
104

2-THIOURACIL
105

OVERVIEW2 THIOURACIL
2-thiouracil (figure 44) or 2-thioxo-1H-pyrimidin-4-one belongs to the thyreostats
family, one of the first classes of molecules to be used (or abused) with auxinic purpose,
most of all in bovines. In fact the most common thyreostats come from 2-thiouracil and
they are: methylthiouracil, propilthiouracil and phenylthiouracil, while another
thyreostats family is represented by imidazol, e.g. methimazole (Vanden Bussche
et al. 2008).
Figure 44: structure of 2-thiouracil
The anti-thyroid activity is due to the presence of the radical –SCN, that forbids the
thyroid peroxidase, responsible for the oxidation of iodide to molecular iodine; this is
the only form that can be used by the organism and it is able to join the biosynthesis of
the thyroid hormones T3 and T4. The reduction of molecular iodine available for
organism causes a lower T3 and T4 biosynthesis (Vanden Bussche et al. 2008).
Thiouracil and its derivatives present a high absorption on enteric level if given orally
and they are partly metabolized by the liver, where they undergo glucuronide reactions
most of all, while the rest of them is excreted unmodified by urine (Heeremans
et al. 1998). Thiouracil molecules are able to penetrate in milk and, if given for long (3-
106

4 weeks), they present a quite long biphasic elimination kinetics, with half times in
plasma and in urine equal to 10 days for the first phase and 12 days for the second one.
2-thiouracil, as all thyreostats, accumulate much more in thyroid than in muscles and in
the rest of organism, even though thiouracil has a longer depletion time in muscles than
in thyroid. So it is necessary to presume suspension times in muscles longer than in
thyroid (Vanden Bussche et al. 2008).
The action of thyreostats as growth promoters has to be found in capability to reduce the
basal metabolism producing a state of hypothyroidism, that causes a decrease of oxygen
in tissues and an increase of water in muscles. Moreover thyreostats are able to slow
down pre-stomaches activity, with reduced emptying and consequent accumulation of
foodstuff (Derblom et al. 1963); in this way slaughterinr yield is artfully
enhanced(Vanden Bussche et al. 2008) .
The administration of thyreostats has confirmations on clinical level of difficult
evidence; they are a reduction of food assumption and a slight reduction of reflexes
readiness. On the contrary anatomical and histological lesions of thyroid are quite
evident. In fact the pronounced negative action on biosynthesis of thyroid hormones
causes a constant stimulus to produce the thyroid stimulating hormone TSH, with
compensative aim. If the hormonal production continues to be stopped, follicular
thyroid cells head for hypertrophy at first and hyperplasia afterwards, till follicular
proliferative cells invade follicular cavity and the gland assumes a parenchymatous like
aspect (goitre). Such these modifications are always followed by an increase in weigh
of thyroid (Debenedetti et al.).
Using thyreostats and therefore also 2-thiouracil and its derivatives is a trading trick,
due to water retention; moreover the consumer is also exposed to health risks. In fact an
Italian Law (15/1/69, n.281) has prevented farmers from holding and using molecules
able to “modify the natural development of the physiological functions” from 1963 and
thyreostats have been officially included on that list with ministerial decree 15/1/69. In
1981 the European community has compared antihormonal substances like thyreostats
with hormonal ones, from a danger point of view. In Italy the acknowledgement of
such directives has produced the ministerial memorandum (n.12, 8/2/88) of Department
of Health, regarding the first project to control hormonal anabolic steroid and anti-
hormonal substances in animals and in meat, and the following directives such as
legislative decree 118/2, then substituted by that one n.158 16/3/2006. In practice, it is
forbidden: to give thyreostats to farm animals, to bring onto the market or to slaughter
107

and to transform treated animals, as well as to hold thyreostats in farms where
production animals are bred.
All these prohibitions come from the importance of thyroid hormones in the correct
development of various physiological processes, very important in increasing animals.
Concerning this, we underline thyreostats are excreted trough women milk and to
maintain the thyroid functionality is fundamental for the correct development of fetus
encephalon. Methylthiouracil is classified by IARC in 2B group, that is possible
cancerogenic (IARC Monographs vol. 79).
108

HPLC MS-MS tests2 THIOURACIL
Derivatization
The derivatization of 2-thiouracil to thiouracil-3-iodinebenzylbromide has been carried
out before extraction, to be able to analyze 2-thiouracil.
2 ml manure have been put in a plastic test tube, with a capacity of 15 ml and screw
plug, and 5 ml of phosphate buffered saline at pH 8 (containing 94.5 ml Na2HPO4 0.2 M
and 5.5 ml KH2PO4 0.2M) and 100 µl of solution 3-iodinebenzylbromide in methanol at
2 mg.ml-1 concentration have been added.
The specimen has been covered with an aluminium film to keep the sample in the dark;
afterwards it has been treated with ultrasonic generator for 10 minutes and maintained at
40°C for 1 hour in thermostatic bath.
Extraction
100 µl HCl at 37% have been added for the extraction and, after shaking in Vortex for
30 seconds, 4ml tert-butyl-methyl-ether (TBME) have been added. Then the test tubes
have been shaken in a rotative mixer for 20 minutes and then centrifuged to 2000 g for
15 minutes. Afterwards the supernatant has been taken and, after move to a glass test
tube with a capacity of 10 ml and the conic bottom, it has been dried in centrifugal
evaporator at 55 °C. The dry residue, diluted in 200 µl of a blend methanol/water (50:50
v/v), has been put for the analysis in a plastic autosampler vial, with a capacity of 250 µl
and the conic bottom.
Analysis
An ion trap mass spectrometer LCQDecaXPMax, equipped with a source ESI
(electrospray ionization) and linked with an autosampler AS Surveyor and a pump MS
Surveyor (all the components: Thermo Fisher, San Jose´,CA, USA), has been used for
the analysis.
109

The chromatography has been employed at 30°C, in isocratic conditions, using a
column GraceSmart Rp 18 5 µm (150 x 2.1 mm) preceded by a precolumn (C12,4 x
2mm.; Phenomenex).
The mobile phase was water (60%) with 0.1% acetic acid and methanol (40%), flow
rate 250 µl.min-1. The injection volume was 20 µl and the analysis time was equal to
12 minutes.
The mass spectrometer was operated in negative ESI mode with source voltage 4.6 kV,
capillary temperature 260°C and sheath and auxiliary gas (nitrogen) flow rates of 56 and
3 arbitrary units, respectively. The acquisition occurred in MS/MS in SRM mode
(Selected reaction monitoring); helium was used for collision-induced dissociation.
Parent and product ions were characterized by the following mass to charge ratios:
343.0 → 95, 127, 215, 283, 309 (figure 45).with the collision energy setting at 37%.
Figure45: LC-MS/MS chromatogram and corresponding SRM spectrum of a blank sample fortified with 10.0 ng.ml-1 of 2 thiouracil
110

Validation of the method
The calibration curve has been constructed using manure with 5 fortification levels: 1.0;
2.0; 5.0; 10.0; 20.0 ng.ml-1 (3 points each concentration); moreover 20 not fortified
manure specimens have been analyzed to measure the background noise, necessary to
determine the sensitivity parameters. The method has been evaluated in terms of
decision limit (CCα), detection capability (CCβ), linearity of the calibration gap (R2)
and yield, according to the guide lines of the Decision of the Committee n° C (2002)
3044 of the 12th of August 2002 that accomplishes the directive 96/23/CE, regarding the
yield of the analytical methods and the interpretation of the results (see below).
2 thiouracil
CCα (ng.ml-1) 0.34
CCβ (ng.ml-1) 0.49
R2 0.99
Yield 84%
111

TRENBOLONE
112

OVERVIEWTRENBOLONE
17β-trenbolone (trenbolone or 17β-hydroxy-estra-4,9,11-trien-3-one-17-acetate) is a
synthetic androgen licensed as growth promoter for farm animals in several
meat-exporting countries. It is licensed by Food and Drugs Administration and it is
extensively utilized in the United States and Canada as an anabolic steroid for beef
production (www.fda.gov).
In these countries it is administered to cattle in the form of its ester, 17β-trenbolone
acetate, via controlled-release implants as a subcutaneous implant either alone
(e.g. Finaplix-S®) or in combination with an estrogenic compound as 17β-estradiol
(e.g. Revalor®) or 17β-estradiol benzoate (e.g. Synovex®).
The anabolic effect of 17β-trenbolone acetate, which is 8–10 times stronger than that of
testosterone propionate (Neumann F. 1976), is based on androgenic and
antiglucocorticoid activity (Danhaive et al.1986).
It is considered to act on skeletal muscle, either through androgen receptors to increase
protein synthesis or through glucocorticoid receptors to reduce the catabolic effects of
glucocorticoids. Trenbolone acetate decreases the rate of both protein synthesis and
degradation, and when the rate of degradation is less than the rate of synthesis, muscle
protein rate increases.
It also has the secondary effects of stimulating appetite, reducing the amount of fat
being deposited in the body, and decreasing the rate of catabolism. Trenbolone has
become popular with anabolic steroid users as it is not metabolised by aromatase or
5α-reductase into estrogenic compounds such as estradiol, or into DHT
(dihydroxytestosterone). This means that it also does not cause any water retention or
other tough side effects normally associated with highly androgenic steroidal
compounds like testosterone or methandrostenolone (Beg et al. 2007)
From subcutaneous implant, just after coming in the blood, 17β-trenbolone acetate is
hydrolyzed to 17β-trenbolone, a potent agonist of the mammalian androgen receptor. It
has an approximately equivalent binding affinity to this receptor respect to DHT
(Neumann F. et al. 1976; Wilson et al.2002) and also to the progesterone receptor, with
an affinity that exceeds that one of progesterone itself (Bauer et al.2000). After, in
113

cattle, 17β-trenbolone is epimerized to 17α-trenbolone through an oxidized state, called
trendione (figure 46). The epimerization strongly decreases the compound’s biologic
efficacy of about 5% respect to 17β-trenbolone (Pottier J et al.1981), since
17α-trenbolone has a binding affinity for mammalian androgen receptor about tenfold
lower than 17β-trenbolone (Pottier et al.1981; Bauer et al. 2000).
Figure 46: trenbolone acetate, trenbolone and its metabolism in cattle
A study by Schiffer et al. in 2001 demonstrated that when trenbolone acetate is dosed to
cattle, both stereoisomers, 17α-trenbolone and 17β-trenbolone, are eliminated in faeces
and in urine but the α form comprises about 95% of the excreted product (in cows the
biliary excretion predominates). The study of these authors also demonstrated that it is
possible to detected 17α-trenbolone and 17β-trenbolone in liquid manure for a long
time, their half-lives were of 267 and 257 days for the 17α-isomer and the 17β-isomer,
respectively. Further, in soil samples to which the manure had been applied, trenbolone
residues were detectable for up to eight weeks. This suggests the potential danger to
expose organism to trenbolone via runoff from feeds and fields fertilized with manure
(Schiffer et al. 2001), even if other studies on the stability of trenbolone in bovine urine
showed that storage of urine samples in direct sunlight led to decreased trenbolone
concentrations and that storage of faeces samples at room temperature in some cases
caused partial or complete loss of the 17α-trenbolone content.
In some works the toxicity of trenbolone has been demonstrated. Maternal trenbolone
administration in rats shows to induce abnormalities in the foetuses similar to the effects
of testosterone propionate (Wilson et al. 2002). Exposed female pups had significantly
114

increased anogenital distance and a reduced number of nipples and areolas consistent
with masculinisation. Instead no gross malformations were noted in the male pups
(Wilson et al, 2002). In another experiment it was observed that Japanese 4 days quail
embryos subjected to trenbolone resulted in delayed onset of puberty in males and
reduced male reproductive behaviour, alterations in the copulatory behaviour of adult
quail males (Quinn et al., 2007a) and alterations in the immune system (Quinn et al.,
2007b).
Moreover, reports regarding the misuse of trenbolone as an anabolic agent in sports
people describe multiple adverse effects, including liver cell injury with an increase in
liver-specific enzymes in serum,cholestatic jaundice, peliosis hepatitis and various
neoplastic lesions. In addition decreased endogenous testosterone production and
spermatogenesis, oligospermia and testicular atrophy may be associated with the
repeated use of trenbolone as anabolic (Bahrke and Yesalis, 2004; Maravelias
et al. 2005).
115

ELISA testsTRENBOLONE
The “Ridascreen® Trenbolone” (cod n° R2601) kit, produced by R-BioPharm, has been
used; it is bought by R-BioPharm Italia S.r.l. Via dell’Artigianato, 13, 20070 Cerro al
Lambro, Milano.
The producer of the kit, that is developed for the analysis of urines, bile, meat, liver and
faeces, reports the following sensitivities:
Trenbolone
ppt
urines 100
Meat and liver 50
feces 25
bile 1
The cross reaction reported by the producer, assumed that one of trenbolone equal to
100%, is equal to: 82 % for trenbolone glucuronide, 7% for α-trenbolone glucuronide
and less than 0.1% for the other androgen steroids.
Method
40 specimens (Samples) each one with 4 ml of manure and 12 specimens (Standard)
each one with 4 ml of water have been prepared (to verify the different reading in
absorbance between manure and water and so the matrix effect).
36 Samples have been fortified with trenbolone at 0.1; 0.2; 0.5; 1.0; 2.0; 5.0; 10.0; 20.0
and 50.0 ng.ml-1 concentrations (4 Samples each concentration). 10 Standard have been
fortified with trenbolone at 2.0; 5.0; 10.0; 20.0 and 50.0 ng.ml-1 concentrations
(2 Standard each concentration). The remaining 4 Samples and 2 Standard have not
been fortified (Trenbolone concentration equal to zero).
Both the Samples and the Standard have been centrifuged to 1400 g for 5 minutes.
20 µl supernatant have been taken to be used in ELISA test, following the producer’s
instructions.
The results, as averages, are reported in table 20 and in figure 47.
116

trenbolone Standard Sample
ng.g-1 absorbance absorbance
0 1,0105 0,9745
0,1 / 0,9605
0,2 / 0,9523
0,5 / 0,9555
1.0 / 0,9365
2.0 1,0023 0,8794
5.0 0,6261 0,5842
10.0 0,4285 0,0935
20.0 0,1212 0,0952
50.0 0,0945 0,1105
Table 20: average absorbance of Samples and Standard according to trenbolone concentration
0 5 10 15 20 25 30 35 40 45 500
0.2
0.4
0.6
0.8
1
1.2
StandardSample
concentration ng.ml-1
abso
rban
ce
Figure 47: average absorbance of Samples and Standard according to trenbolone concentration
Conclusions
The quantification limit seems to be at 2ng.ml-1, while the saturation of the system
occurs at 10 ng.ml-1.
117

HPLC MS-MS testsTRENBOLONE
Extraction
2 ml manure have been put in a plastic test tube, with a capacity of 15 ml and screw
plug, and 10 ng.ml-1 noretandrolone have been added as Internal Standard. Then 3 ml of
water and 1 ml NaOH 1N have been added.
After shaking in Vortex for 30 seconds, 4 ml tert-butyl-methyl-ether (TBME) have been
added.
The test tubes have been shaken in a rotative mixer for 20 minutes and then centrifuged
to 2000 g for 15 minutes. Afterwards the supernatant (ether phase) has been taken and,
after move to a glass test tube with a capacity of 10 ml and the conic bottom, it has been
dried in centrifugal evaporator at 55 °C.
The residue, diluted in 200 µl of a blend methanol/water (50:50 v/v), has been put for
the analysis in a plastic autosampler vial, with a capacity of 250 µl and the conic
bottom.
Analysis
An ion trap mass spectrometer LCQDecaXPMax, equipped with a source APCI
(Atmospheric pressure chemical ionization) and linked with an autosampler AS
Surveyor and a pump MS Surveyor (all the components: Thermo Fisher, San Jose´,CA,
USA), has been used for the analysis.
The chromatography has been employed at 30°C, in isocratic conditions, using a
column GraceSmart Rp 18 5 µm (150 x 2.1 mm) preceded by a precolumn (C12,4 x
2mm.; Phenomenex).
The mobile phase was water (42%) with 0.1% acetic acid and methanol (58%), flow
rate 250 µl.min-1.
The injection volume was 20 µl; the analysis time was equal to 20 minutes.
118
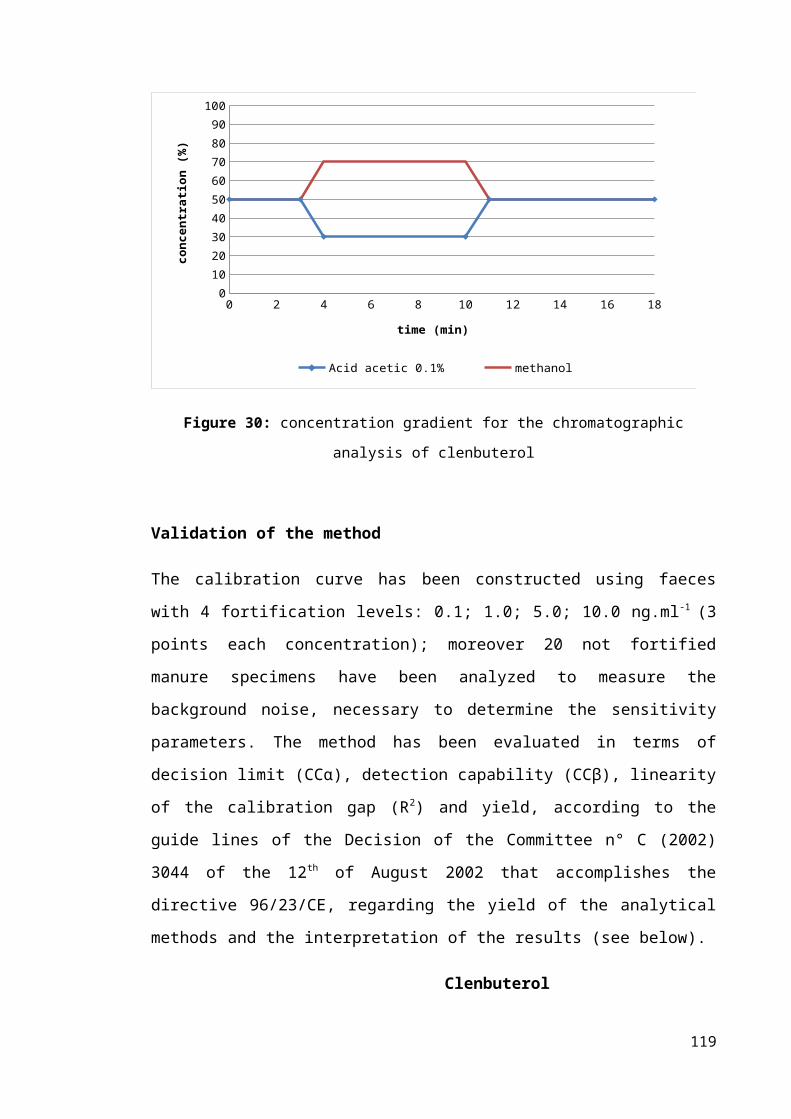
The mass spectrometer was operated in positive APCI mode with source voltage
4.5 kV, vaporizer temperature 350°C, capillary temperature 210°C and sheath and
auxiliary gas (nitrogen) flow rates of 23 and 5 arbitrary units, respectively.
The acquisition occurred in MS/MS in SRM mode (Selected reaction monitoring);
helium was used for collision-induced dissociation.
Parent and product ions were characterized by the following mass to charge ratios:
trenbolone : 271.0 → 197, 211, 225, 235 and 253; noretandrolone: 303.0 → 215, 227,
267 and 285 (figure 48) with the collision energy settings at 28% and 32%, respectively.
Figure48: LC-MS/MS chromatogram and corresponding SRM spectrum of a blank sample fortied with 100.0 ng.ml-1 of trenbolone
119

Validation of the method
The calibration curve has been constructed using faeces with 6 fortification levels: 1.0;
2.0; 5.0; 10.0; 50.0 and 100.0 ng.ml-1 (3 points each concentration); moreover 20 not
fortified manure specimens have been analyzed to measure the background noise,
necessary to determine the sensitivity parameters. The method has been evaluated in
terms of decision limit (CCα), detection capability (CCβ), linearity of the calibration
gap (R2) and yield, according to the guide lines of the Decision of the Committee
n° C (2002) 3044 of the 12th of August 2002 that accomplishes the directive 96/23/CE,
regarding the yield of the analytical methods and the interpretation of the results are
show below.
trenbolone
CCα (ng.ml-1) 0.80
CCβ (ng.ml-1) 1.10
R2 0.99
Yield 99%
120

PERSISTENCE testsTRENBOLONE
The average results in HPLC MS-MS, obtained at the different sampling times (average
of three samples every day) fortifying 0.3m3 manure with 500 ng.ml-1 of trenbolone
(Sample) and expressed in percentage as the ratio between the value detected at time
zero and the other times , together with the results obtained with the not fortified
samples (Blank), are shown in figure 49 and in table 21
Day Blank (%) Sample (%)
0 n.d. 100.00
3 n.d 52.82
6 n.d 28.89
12 n.d. 25.81
20 n.d. 23.52
36 n.d 9.87
52 n.d n.d
66 n.d. n.d.
80 n.d n.d
100 n.d n.d
120 n.d. n.d.
Table 21: average concentrations of the spiked and blank sample at each sampling time expressed in percentage as the ratio between the value detected at time zero and the other times
The chromatograph and the respective mass spectrum of the lowest detected
concentration of trenbolone (40ng.ml-1 on the day 36) are shown in figure 50.
121
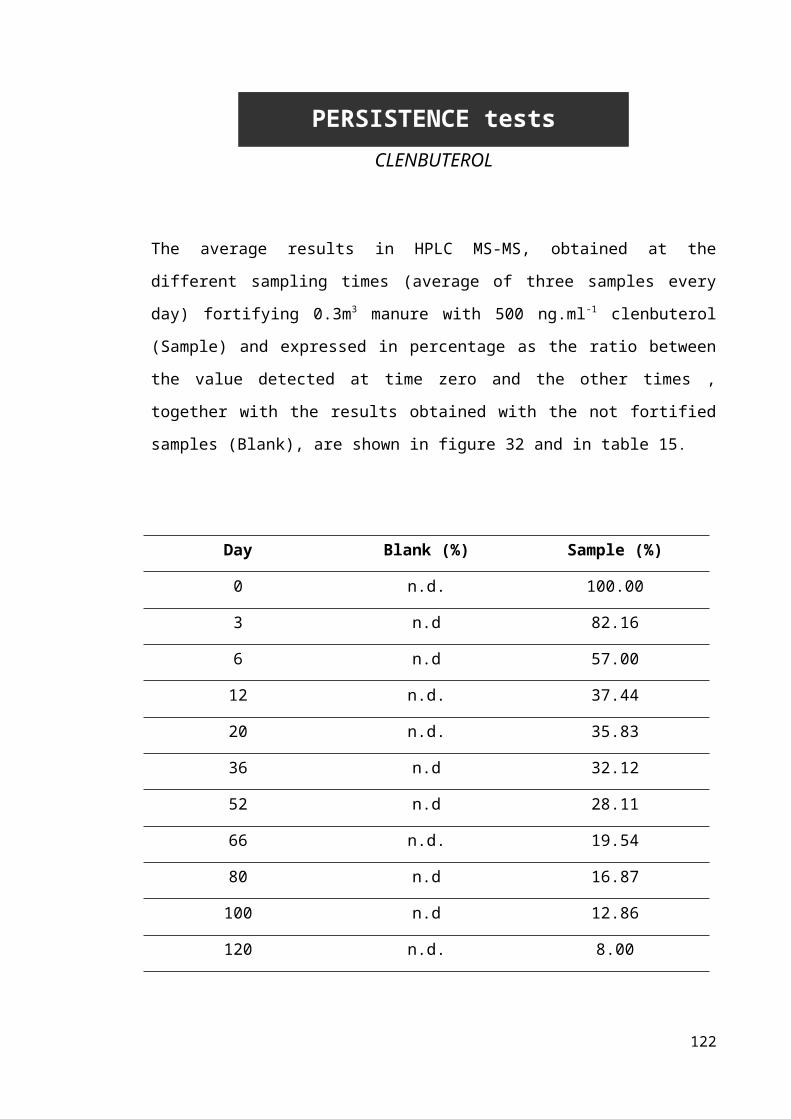
0 20 40 60 80 100 1200
10
20
30
40
50
60
70
80
90
100
BlankSample
Days
Conc
entr
ation
%
Figure 49: average concentrations of the spiked and blank sample at each sampling time expressed in percentage as the ratio between the value detected at time zero and the other times
Figure 50: chromatograph and respective mass spectrum concerning the Sample of trenbolone at the lowest detected concentration (40ng.ml-1 on the day 36)
122
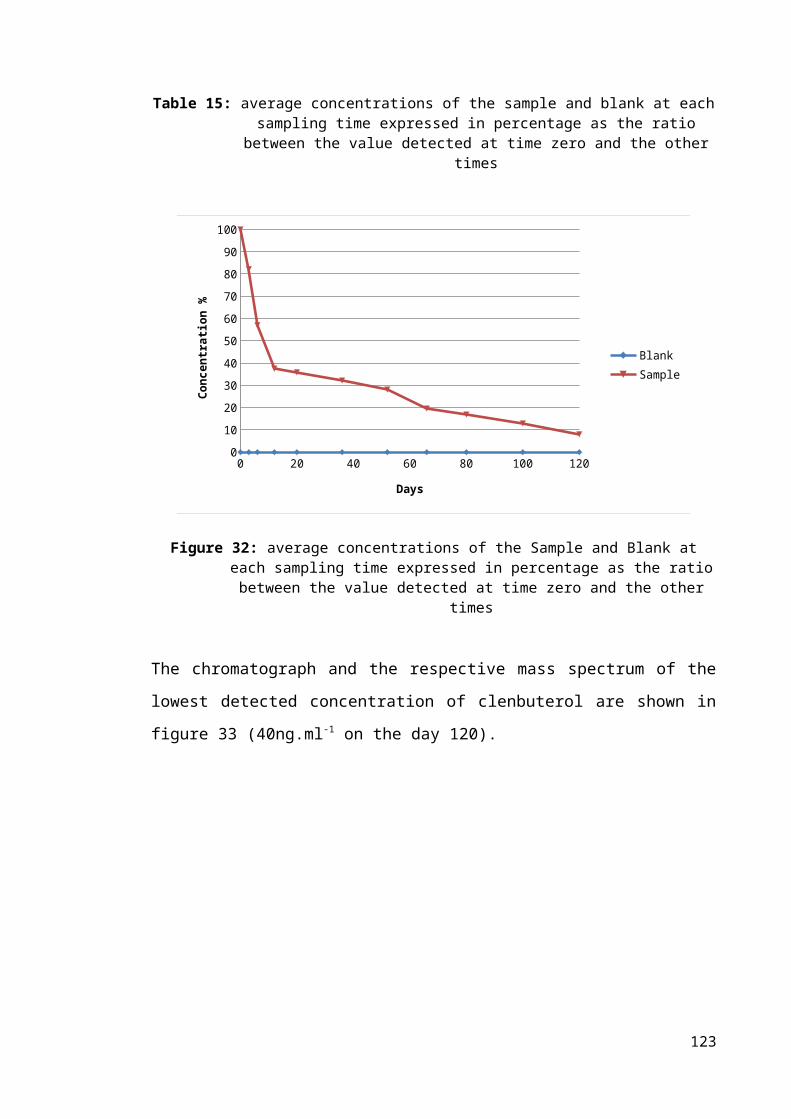
CHLORAMPHENICOL
123

OVERVIEWCHLORAMPHENICOL
2,2-dichloro-N- [(aR,bR)-b-hydroxy-a-hydroxymethyl-4-nitrophenethyl] acetamide or
Chloramphenicol (figure 51) is an antimicrobial, originally derived from the bacterium
Streptomyces venezuelae, isolated by David Gottlieb and introduced into clinical
practice in 1949. It is now produced by chemical synthesis, followed by a step to isolate
stereoisomers. It was the first antibiotic to be manufactured synthetically on a large
scale.
Among the four possible stereoisomers of chloramphenicol only the α-R, β-R
(or D-threo) form is active (IARC 1990). It works by inhibiting peptidyl transferase
activity of the bacterial ribosome, binding to 23S rRNA of the 50S ribosomal subunit,
preventing peptide bond formation. Chloramphenicol and the macrolides have slightly
different mechanisms, while chloramphenicol directly interferes with substrate binding,
macrolides sterically block the progression of the growing peptide (Yunis 1988).
Chloramphenicol is bacteriostatic (it stops bacterial growth) and bactericidal and it is
effective against a wide variety of microorganisms, by inhibiting bacterial protein
synthesis (Rahal and Simberkoff 1979). It has a very broad spectrum of activity: it is
active against gram-positive bacteria (including most strains of MRSA), gram-negative
bacteria, both of them aerobic and anaerobic, and it can also be used against gram-
positive cocci and bacilli.
Figure 51: structure of chloraphenicol
124

It is still used very widely in low income countries because it is exceedingly
inexpensive, but it has fallen out of favour in the West Countries due to a very rare but
very serious side effect. However, due to its excellent cerebrospinal fluid penetration
(far superior to any of the cephalosporins), chloramphenicol remains the first choice
treatment for staphylococcal brain abscesses and in meningitis, when due to mixed
organisms or when the causative organism is not known. (Duke et al. 2003)
In fact, in most body fluids chloramphenicol is well distributed after treatment and it
reaches high levels in brain, possibly because of its lipid solubility. When meninges are
not inflamed its concentration in cerebrospinal fluid is 30 to 50% of serum levels, much
higher than for most antibiotics (Howard 2004). In organism chloramphenicol has a
half-life of 4.1 hours, if it is administered by intravenous infusion, and it is metabolized
primarily by the liver, here it is conjugated with glucuronic acid and it is excreted in this
inactive form by the kidney for approximately 90% and only 15% is excreted as the
parent compound (Howard 2004).
Chloramphenicol causes some serious adverse effects:
Aplastic anemia; it commonly occurs weeks to months after completion of
therapy, it is generally fatal and it is not dose related (Wallerstein et al. 1969).
Bone marrow suppression; as manifested by anaemia, leukopenia or
throbocytopienia it is common during treatment with chloramphenicol. It is dose
related and reversible (Scott et al. 1965).
Gray baby syndrome; it is a potentially fatal adverse reaction in newborns as
manifested by progressive cyanosis, flaccidity and circulatory collapse (Feder et
al. 1981). This syndrome is dose related.
Other adverse effects are: optic neuritis, peripheral neuritis, headache,
depression and mental confusion.
The most worrying adverse effect about chloramphenicol is its danger as carcinogen.
This characteristic has been reasonably anticipated in the first listed items during the
First Annual Report on Carcinogens, in 1980.
Several case reports have shown leukaemia to occur after medical treatment for
chloramphenicol-induced aplastic anemia (IARC 1990). Only to example: in a case-
control study in 1987 it was observed that the risks of childhood leukaemia increased
with the number of days chloramphenicol was taken (Shu et al ,1988) and another study
reports an association between chloramphenicol use and increased risk of soft-tissue
125

sarcoma (Zahm et al. 1989). Considered together, the many cases reports implicating
chloramphenicol as a cause of aplastic anemia, the evidence of a link between aplastic
anemia and leukemia and the increased risk of leukemia found in some case-control
studies support the conclusion that chloramphenicol exposure is associated with an
increased cancer risk in humans.
As already seen, chloramphenicol blocks protein synthesis in bacteria by binding to the
50S subunit of the 70S ribosome. Ribosomes in the mitochondria of mammalian cells
are also affected, which accounts for the sensitivity of proliferating tissues, such as
those that promote the formation of blood cells. Several studies about
dehydrochloramphenicol, a chloramphenicol metabolite produced by intestinal bacteria,
retain that this metabolite could be responsible for DNA damage and carcinogenicity
(Jimenez et al. 1990) So in the bone marrow dehydrochloramphenicol can undergo
nitro-reduction and it causes DNA single-strand breaks. In fact, mitochondrial
abnormalities induced by chloramphenicol are similar to those observed in pre-
leukemia, suggesting that mitochondrial DNA is involved in the pathogenesis of
leukemia. So chloramphenicol appears to be a genotoxin, it is identified by IARC as
probably carcinogenic and it is labelled in 2A class.
Chloramphenicol has been also used in veterinary medicine as a highly effective and
well-tolerated broad spectrum antibiotic. Because of its tendency to cause blood
dyscrasia in humans (fatal aplastic anemia), many countries prohibit its use in the
treatment of food-producing animals.
Just in 1969 the FAO/WHO Expert Committee for antibiotics suggested zero tolerance
for chloramphenicol residues. So this drug has never been registered for use in food-
producing animals by Food and Drug Administration in the USA but it continues to be
used to treat both systemic and local infections in cats, dogs, and horses. In the EU,
chloramphenicol has been prohibited for the respective use since 1994 by Directive
1430/94 (EC 1994), when a zero tolerance limit has been established for
chloramphenicol in food so detection level of analytical methods was as low as possible.
Now, European Commission defines a minimum required performance limit for the
quantification of chloramphenicol in food. This limit is based on the performance of
modern analytical instrumentation and methodology and it is currently set at 0.3 mg.kg-
1. (2002/657/EC Commission Decision)
In environment chloramphenicol may be isolated from Streptomyces venezuelae in the
soil but above all it may be released by waste stream of livestock because of its abuse as 126

low cost veterinary drugs (HDBS). If released into water, chloramphenicol will be
essentially nonvolatile. Adsorption to sediment and bioconcentration in aquatic
organisms are not expected to be important processes, but into soil chloramphenicol is
expected to have high soil mobility and it is not expected to evaporate from either dry or
wet soils (HDBS).
127

ELISA testsCHLORANPHENICOL
The “screen CAP” (cod n° AB630) kit has been used; it is produced by Tecna S.r.l. and
it is bought by Tecna S.r.l. Area Science Park Padriciano 99, Trieste. The producer of
the kit, developed to analyze honey, eggs, urines, milk, plasma, meat and fish, reports
the sensitivity with meat and fish equal to 0.1 ppb. The cross reaction is equal to 70 %
for chloranphenicol glucuronate.
Method
32 specimens (Samples) each one with 4 ml of manure and 16 specimens (Standard)
each one with 4 ml of water have been prepared (to verify the different reading in
absorbance between manure and water and so the matrix effect).
28 Samples have been fortified with chloranphenicol at 0.1; 0.2; 0.5; 1.0; 2.0; 10.0 and
50 ng.ml-1 concentrations (4 Samples each concentration). 14 Standard have been
fortified with chloranphenicol at 0.1; 0.2; 0.5; 1.0; 2.0; 10.0 and 50 ng.ml-1
concentrations (2 Standard each concentration). The remaining 4 Samples and 2
Standard have not been fortified (chloranphenicol concentration equal to zero).
Both the Samples and the Standard have been centrifuged to 1400 g for 5 minutes.
20 µl supernatant have been taken to be used in ELISA test, following the producer’s
instructions. The results, as averages, are reported in table 22 and in figure 52.
chloranphenicol Standard Sample
ng.ml-1 absorbance absorbance
0 2,7362 2,4136
0,1 2,6121 2,3655
0,2 2,4917 2,1937
0,5 2,0657 1,9887
1.0 1,7637 1,6997
2.0 1,2552 1,3707
10.0 0,5257 0,4532
50.0 0,1817 0,3085
Table 22: average absorbance of Samples and Standard according to chloranphenicol
concentration
128

0 5 10 15 20 25 30 35 40 45 500
0.5
1
1.5
2
2.5
3
StandardSample
concentration ng.ml-1
abso
rban
ce
Figure 52: average absorbance of Samples and Standard according to chloranphenicol concentration
Conclusions
The detection limit seems to be between 0.2 and 0.5 ng.ml-1, while the saturation of the
system occurs at 10 ng.ml-1. Noteworthy differences between Standard and Sample are
not detectable.
129

HPLC MS-MS testsCHLORANPHENICOL
Extraction
2 ml manure have been put in a plastic test tube, with a capacity of 15 ml and screw
plug, and 3 ml of water and 1 ml NaOH 1N have been added. After shaking in Vortex
for 30 seconds, 4 ml of ethyl acetate have been added. The test tubes have been shaken
in a rotative mixer for 20 min and then centrifuged to 2000 g for 15 minutes. Afterwards
the supernatant has been taken and, after move to a glass test tube with a capacity of
10 ml and the conic bottom, it has been dried in centrifugal evaporator at 55 °C.
The residue, diluted in 200 µl of a blend methanol/water (50:50 v/v), has been put for
the analysis in a plastic autosampler vial, with a capacity of 250 µl and the conic
bottom.
Analysis
An ion trap mass spectrometer LCQDecaXPMax, equipped with a source ESI
(electrospray ionization) and linked with an autosampler AS Surveyor and a pump MS
Surveyor (all the components: Thermo Fisher, San Jose´,CA, USA), has been used for
the analysis.
The chromatography has been employed at 30°C, in isocratic conditions, using a
column Allure Biphenyl 3µm (100 x 2.1 mm; Restek) preceded by a precolumn (C12,4
x 2mm.; Phenomenex).
The mobile phase was water (50%) with 0.1% acetic acid and methanol (50%), flow
rate 250 µl.min-1. The injection volume was 20 µl; the analysis time was equal
to 10 minutes.
The mass spectrometer was operated in negative ESI mode with source voltage 4.6 kV,
capillary temperature 260°C and sheath and auxiliary gas (nitrogen) flow rates of 35 and
5 arbitrary units, respectively. The acquisition occurred in MS/MS in Full Scan mode;
helium was used for collision-induced dissociation. Parent and product ions were
characterized by the following mass to charge ratios: 321.0 → 152, 176, 194, 237, 249,
257 (Figure 53) with the collision energy setting at 25.5%.
130

Figure 53: LC-MS/MS chromatogram and corresponding SRM spectrum of a blank sample fortified with 20.0 ng.ml-1 chloranphenicol
Validation of the method
The calibration curve has been constructed using faeces with 4 fortification levels: 0.1;
1.0; 10.0 and 20.0 ng.ml-1 (3 points each concentration); moreover 20 not fortified
manure specimens have been analyzed to measure the background noise, necessary to
determine the sensitivity parameters. The method has been evaluated in terms of
decision limit (CCα), detection capability (CCβ), linearity of the calibration gap (R2)
and yield, according to the guide lines of the Decision of the Committee n° C (2002)
3044 of the 12th of August 2002 that accomplishes the directive 96/23/CE, regarding the
yield of the analytical methods and the interpretation of the results are reported below.
CCα (ng.ml-1) CCβ (ng.ml-1) R2 Yield
chloranphenicol 0.32 1.07 0.95 111%
131

CORTICOSTEROIDS
132

OVERVIEWCORTICOSTEROIDS
In technical terms, corticosteroid refers to both glucocorticoids and mineralocorticoids
(as both are mimics of hormones produced by the adrenal cortex), but it is often used as
a synonym for glucocorticoid. Corticosteroids are a class of molecules produced by the
organism, in particular by the adrenal cortex, under the control of the
adrenocorticotropic hormone ACTH, that is in turn controlled by the hypothalamic
peptide, corticotropin releasing hormone CRH. Corticosteroids have to maintain
homeostasis in reply to the different life conditions the animal is subjected to (Werner
2005). Corticosteroids are synthesized beginning from cholesterol and they have a
chemical structure that is referable to that one of cortisol (figure 54).
Figure 54: Cortisol or (11β)-11,17,21-trihydroxypregn-4-ene-3,20-dione
Synthetic drugs with corticosteroid-like effect are used in a variety of conditions, in
human and veterinary medicine (figure 55) (Barragry 1994). They present some
differences compared with cortisol, this aspect causes the presence of favorable
characteristics to a pharmacological use. The most important ones are:
- the presence of a double bond between C1 and C2 that causes a more intense
activity as glucocorticoid;
- the presence of an halogen in -9 position and of a group CH3 in -16 position
that, together with the double bond between C1 and C2, considerably extends
the plasmatic half life time;
133

- the esterification (and its tipology) of C21 that influences the relationship
between the hydrosolubility and the liposolubility of the different compounds
(Antignac et al. 2004).
Figure55: the major synthetic corticosteroids
Corticosteroids are usually quickly absorbed: orally the hematic peak occurs after about
2 hours, with an intramuscular injection the absorption is even quicker, unless the
different used molecules are bonded to esters that slow down their release In the
circulation corticosteroids are carried by a specific globulin, called transcortine.
Synthesis compounds usually show a lower bond affinity towards this globulin if
134

compared with natural corticosteroids, this is why synthesis corticosteroids aim more to
move to tissues and so they present a quicker pharmacological action.
Moreover corticosteroids undergo oxidative reactions, catalyzed mainly by cytochrome
P450 and conjugation reactions, that produce glucuronides and sulphates excreted by
urines and bile.
Glicocorticoids have different pharmacological activities (Barragry 1994), the most
important one, both in human and in veterinary medicine, is the anti-inflammatory
activity, that is effective both in the acute phase of the inflammatory process and in the
chronic one. Glicocorticoids have also other important effects: on the circulating blood
elements, on the immune answer with a reduction of the circulating lymphocytes and of
eosinophyles as well as they produce an inhibition of the synthesis of antibodies and of
interferon. With regard to the cardiovascular apparatus, these substances determine an
increase in the contraction strength and in the heart yield and so an increase in the
perfusion. With regard to the central nervous system, they induce an increase in the
neuronal excitability, that translates itself in an euphoric state and in a general wellbeing
sensation (Lupien and McEwen 1997). With regard to the electrolytic equilibrium,
glicocorticoids act causing Na+ retention and K+ and H+ elimination; this facts cause
water retention and an increase in extracell fluids volume; moreover if the administering
is extended, an increase in the Ca++ elimination can occur (Werner 2005). The different
pharmacological activities, like the anti-inflammatory activity and that one on the
electrolytic equilibrium, are tightly linked with the chemical nature of the different
molecules. In fact the natural hormone cortisol performs both the activities in a similar
way, instead synthesis glicocorticoids with a long time action (dexamethasone,
betamethasone, flumethasone) show more anti-inflammatory activity and less Na+
retention.
Other important effects carry out on the protein metabolism: corticosteroids in fact
cause protein catabolism increase and amino acids mobilization, because of an increased
synthesis of proteolytic enzymes. With regard to glucide metabolism, they produce a
decrease of peripheral use of glucides and their increased production beginning from the
amino acids, with hepatic store of glycogen. With regard to lipidic metabolism, they
produce greases catabolism increase and their redistribution in organism (Corah
et al 1995).
Considering all the above information, corticosteroids cannot be considered real
“anabolic steroids”, in fact they produce a protein catabolism increase with various
135

mechanisms. Nevertheless , if used in lower doses than that ones used in therapy,
corticosteroids can cause an improvement of the overall characteristics of the carcasses
and a meaningful increase of the area of some muscular groups (Tarantola et al. 2004).
Synthesis corticosteroids can be used fraudulently alone or with other banned growth
promoters, like the steroidal hormones or β agonists. In fact dexamethasone, one of the
most studied corticosteroids, is able to reduce the down-regulation of β -adrenergic
receptors, that occurs in animals exposed to β agonists. Such a down-regulation is
responsible for the partial reduction of the efficiency of β agonists as repartition agents
after some time their administering. This phenomenon can be explained with the
capability of dexamethasone, in low concentrations, to increase β -adrenergic receptors
populations. The association of corticosteroids with β agonist compounds is also
justified by the enhancement of the lipolytic effect and by the attenuation of some
negative effects on muscle and of the intense glycogenolytic produced by β agonists in
liver. Moreover corticosteroids, because of polyuria phenomena, are able to reduce
urinary concentration of some β agonists and of other drugs, so possibilities to control
are made fruitless (Abraham et al. 2004).
Corticosteroids are usually quickly drained by muscles even though, in case of
intramuscular administering, high concentrations can be found in implant sites.
Moreover, since synthesis compounds have a very much bigger pharmacological
activity than that one of natural endogen compounds, consumers can be exposed to
health risks. In fact, besides the immunodepressive action, the effects on glucide
metabolism are not negligible at all, with an increase in glycemia and in resistance to
the insulin action (Barseghian et al. 1982). Also the luteolytic activity typical of
corticosteroids, that causes a reduction of hematic ratios of progesterone, can represent a
danger: if enough estrogens levels are present, such an effect can make pregnant uterus
sensitive to the action of oxytocin and it can cause abortion in the last part of pregnancy
(Hansen et al. 1999). Moreover corticosteroids are able to go beyond both the mammary
barrier and the placentary one, with the possible exposition of fetus to corticosteroids
taken by the mother. This fact can produce a reduction of the fetus weight and changes
of the cardio-respiratory dynamics; in the case of dexamethasone, its terotogen effects
have been documented.
The regulation (CE) n°2377/90 has provided very low LMR for edible organs and milk,
in particular for dexamethasone and betamethasone (0.75µg.kg-1 for muscle and kidney,
136

2µg.kg-1 for liver and 0.3µg.kg-1 for milk), limits that are based on an acceptable daily
intake equal to 0.9µg in the whole.
The National Residues Project provides systematic investigations both in breeding and
in slaughter and it puts corticosteroids in A category (substances with an anabolic effect
and banned substances). This attention towards corticosteroids is also remembered in
ministerial memorandum 29/9/2004 n°14, that represents the guide lines for the
application of D.Lgs of the 4th of August 1999 n°336.
137

ELISA testsCORTICOSTEROIDS
The “Enhanced Kit Dexamethasone” (cod n°101510) has been used; it is produced by
Neogen Corporation (944 Nandino Boulevard, Lexington, KY 40511 USA) and bought
by Diessechem s.r.l., Via Meucci 61/b, Milano.
The producer of the kit, developed to analyze urines, plasma or serum, reports the
following sensitivities in ng.ml-1:
Dexamethasone Flumethasone
Equine urines 0.33 2.83
Dog urines 0.45 1.34
Equine plasma 0.22 1.07
Equine serum 0.25 0.45
The reported cross reaction, assumed that one of dexamethasone equal to 100%, is equal
to: 49 % for flumethasone, 1.5% for betamethasone and below 1% for the other
corticosteroids.
Method
24 specimens (Samples) each one with 4 ml of manure and 12 specimens (Standard)
each one with 4 ml of water have been prepared (to verify the different reading in
absorbance between manure and water and so the matrix effect).
20 Samples have been fortified with dexamethasone at 0.5; 1.0; 5.0 10.0 and
20.0 ng.ml-1 concentrations (4 Samples each concentration). 10 Standard have been
fortified with dexamethasone at 0.5; 1.0; 5.0 10.0 and 20.0 ng.ml-1concentrations
(2 Standard each concentration). The remaining 4 Samples and 2 Standard have not
been fortified (Dexamethasone concentration equal to zero).
Both the Samples and the Standard have been centrifuged to 1400 g for 5 minutes.
20 µl supernatant have been taken to be used in ELISA test, following the producer’s
instructions.138

Results and Conclusions
Among the different specimens, only the 20 ng.ml-1 concentration has not shown the
“matrix effect”. The low sensitivity of the kit exhibited in this test does not make it
suitable to detect corticosteroids in manure at concentrations in the order of magnitude
of ppb (ng.ml-1).
The results are not shown because they are not very meaningful.
139

HPLC MS-MS testsCORTICOSTEROIDS
Extraction
2 ml manure have been put in a plastic test tube, with a capacity of 15 ml and screw
plug, and 10 ng.ml-1 flumethasone have been added as Internal Standard. Then 3 ml of
water and 1 ml NaOH 1N have been added. After shaking in Vortex for 30 seconds,
4 ml tert-butyl-methyl-ether (TBME) have been added. The test tubes have been shaken
in a rotative mixer for 20 minutes and then centrifuged to 2000 g for 15 minutes.
Afterwards the supernatant (ether phase) has been taken and, after move to a glass test
tube with a capacity of 10 ml and the conic bottom, it has been dried in centrifugal
evaporator at 55 °C. The residue, diluted in 200 µl of a blend methanol/water
(50:50 v/v), has been put for the analysis in a plastic autosampler vial, with a capacity of
250 µl and the conic bottom.
Analysis
An ion trap mass spectrometer LCQDecaXPMax, equipped with a source ESI
(electrospray ionization) and linked with an autosampler AS Surveyor and a pump MS
Surveyor (all the components: Thermo Fisher, San Jose´,CA, USA), has been used for
the analysis.
The chromatography has been employed at 30°C, in isocratic conditions, using a
column Allure Biphenyl 3µm (100 x 2.1 mm; Restek) preceded by a precolumn (C12,4
x 2mm.; Phenomenex). The mobile phase was water (42%) with 0.1% acetic acid and
methanol (58%), flow rate 200 µl.min-1. The injection volume was 20 µl; the analysis
time was equal to 43 minutes.
The mass spectrometer was operated in positive ESI mode with source voltage 6 kV,
capillary temperature 245°C and sheath and auxiliary gas (nitrogen) flow rates of 35 and
15 arbitrary units, respectively. The acquisition occurred in MS/MS in SRM mode
(Selected reaction monitoring); helium was used for collision-induced dissociation.
Parent and product ions were characterized by the mass to charge ratios reported in the
figure 56, and also together with the collision energy settings in table 23.
140

Collision
Energy setting
Parent ion
(m/z)
Product ions
(m/z)
Prednisolone 46% 361 147, 249, 279, 289, 307, 325
Prednisone 46% 359 267, 295, 305, 313, 323
Cortisol 30% 363 267, 281, 291, 297, 309, 327
Cortisone 30% 361 163, 283, 299, 307, 325
Betamethasone
Dexamethasone35% 393 280, 319, 337, 355, 373
Methylprednisolone 35% 375 293, 303, 321, 339, 357
Flumethasone 40% 411 253, 317, 335, 371
Table 23: collision energy settings and mass to charge ratios of parent and product ions belonging to the Corticosteroids family
Validation of the method
The calibration curve has been constructed using faeces with 4 fortification levels: 1.0;
5.0; 10.0; 50.0 ng.ml-1 (3 points each concentration); moreover 20 not fortified manure
specimens have been analyzed to measure the background noise, necessary to determine
the sensitivity parameters. The method has been evaluated in terms of decision limit
(CCα), detection capability (CCβ), linearity of the calibration gap (R2) and yield,
according to the guide lines of the Decision of the Committee n° C (2002) 3044 of the
12th of August 2002 that accomplishes the directive 96/23/CE, regarding the yield of the
analytical methods and the interpretation of the results (table 24).
CCα
(ng.ml-1)
CCβ
(ng.ml-1)R2 Yield
Prednisolone 0.60 0.75 0.93 30%
Prednisone 0.20 0.35 0.98 42%
Cortisol 0.10 0.30 0.97 51%
Cortisone 0.20 0.35 0.99 74%
Betamethasone 0.20 0.30 0.72 97%
Dexamethasone 0.10 0.15 0.90 49%
Methylprednisolon
e0.35 0.40 0.99 90%
Table24: CCα, CCβ, R2 and yield obtained for some substances from the corticosteroids family
141

Figure 56: LC-MS/MS chromatograms and corresponding SRM spectrums of a blank sample manure fortified at 50.0 ng.ml-1 with all corticosteroids considered
142
Cortisol
Betamethasone
Dexamethasone
Methylprednisolone
Flumethasone (Internal STD

BOLDENONE and METABOLITES
143
OVERVIEWBOLDENONE and METABOLITES
Anabolic steroids, or anabolic androgen steroids (AAS), are a class of steroid hormones
related to the hormone testosterone. They increase protein synthesis within cells, which
results in the buildup of cellular tissue (anabolism), especially in muscles. Anabolic
steroids also have androgenic and virilizing properties, including the development and
maintenance of masculine characteristics.
Both in human and in zootechnical field, among the different steroidal compounds with
an anabolic androgenic effect, particular interest has been raised by boldenone or
1,4-androstadien-17β-ol-3-one. From the chemical structure point of view boldenone is
very similar to testosterone (figure 57).
Even though this similarity, boldenone has a biological activity considerably different
from testosterone. In fact boldenone has a reduced tendency, compared with
testosterone, to be converted into estrogens (about 50% less).
This metabolic aspect is certainly interesting from a physiological and pharmacological
point of view, because, if boldenone is administered, its low conversion to estrogens
(17 β-estradiol first of all), implies a reduction of the undesirable estrogenic effects, like
ginecomastiy, subcutaneous water retention and weight increase in consequence of
more lipodeposition (House et al. 2001) .
Figure 57: comparison between β-boldenone and testosterone
In the veterinary field of farm animals, in recent years signals of a possible illegal use of
boldenone for anabolic purpose have been occurred, in order to obtain an increase of
protein anabolism with a positive nitrogen balance, or as growth promoter, even if
144

specific studies date back only to 1996 (Arts et al. 1996). Nevertheless during these
years the presence of traces of β-boldenone and its different metabolites in urines and
faeces coming from certainly not treated animals has raised a remarkable interest in
scientific field regarding the origin, natural or endogenic, of boldenone.
Boldenone presents itself in two different spatial conformations: α or β, depending on
whether the ketone group in C17 position is above or below the molecule plane. The
two forms have a different behaviour in organism, β form is more active biologically,
while α form has a scarce meaning from a biological point of view. This fact is very
probably due to the reduced capacity of α form to link to hormonal receptors of
androgens, that are in this way less stimulated.
Nevertheless, since α form is more slowly metabolized, it can be usefully adopted as
indicator of a possible illegal treatment (Attucci et al. 2003). A lot of studies in fact
have demonstrated that 17β-boldenone, administered to cattle with an intramuscular
injection, can turn into α form, with levels of such residues in urines definitely higher
than β form.
In every case the origin of α-boldenone is not clear; in literature it is stated that in
human field, with the aim to distinguish between endogenic and exogenic origin of
nandrolone and metabolites in urines, it has been suggested to search for its conjugated
forms, that likely have an endogenic origin, as product of liver second phase
metabolism. The same principle could be applied to search for boldenone, its both α and
β form (as sulphate or glucuronconjugate) would be expression of ephatic metabolism
and so of a possible treatment, differently from the free form (Nielen
et al. 2004).
Steroids very similar to boldenone from a chemical and metabolic point of view are:
androsta-1,4-diene-3,17-dione (ADD) and androsta-4-ene-3,17-dione (AED), two
substances considered precursors of β-boldenone and β-testosterone and considered also
their metabolites, according to some authors (Nielen et al. 2004). This is why in almost
all the studies carried out, ADD, AED and α-boldenone are searched together with 17β-
boldenone (figure 58).
Different problems raise in the research of boldenone in animals residues: the first one
concerns which starting substratum to be used for the analysis and which method to be
adopted to collect samples data, since, depending on the used substratum and the
collection method, different and sometimes contradictory results have been obtained.
145

The first studies date back to 1983 (Drumasia et al. 1983): after intramuscular
administering of marked β-boldenone to castrated horses, the urinary elimination of
boldenone metabolites radioactively marked has been demonstrated.
Following studies on human beings (Schanzer and Donike 1993) have shown the
elimination, subsequent the oral administering of β-boldenone, occurs most of all by
urines, disguised as conjugated β-boldenone and related metabolites.
Figure 58: chemical structure of ADD and AED.
The first study concerning the presence of boldenone in bovine urines has been carried
out by Arts et al. in 1996 (Arts et al. 1996), in cooperation with the European Reference
Laboratory of Biltoven (RIVM) and the obtained results have demonstrated that α-
boldenone can be detected in certainly not treated bovines urines up to 3 ng/ml; so
finding α-boldenone in urines cannot be considered as a proof of illegal treatment. With
regard to β-boldenone, never detected in urines in concentrations higher than 0,1 ng/ml,
the Authors don’t exclude its presence also in certainly not treated bovines.
Other researches (Van Puymbroeck et al. 1998) have demonstrated in vitro, using
hepatic microsomes and hepatic cellular monolayers from bovines treated with β-
boldenone, the main metabolites are ADD and the hydroxilated forms of β-boldenone
and ADD (6-OH-17β-boldenone and 6-OH-ADD). The behaviour of boldenone in vivo
in bovine treated, with an intramuscular injection, with its ester (β-boldenone
undecanoato) has been studied too; it has been demonstrated main metabolites in urines
are α-boldenone and β-boldenone, while ADD and some metabolites in the hydroxilated
form are present in definitely lower amounts. Instead neither β-boldenone nor AED
have been found in faeces samples, but α-boldenone and ADD were present in high
concentrations. The analysis started before the treatment with β-boldenone, resulted 146

negative to all the considered steroids, carried the authors, in constrast with the
considerations made by Arts, to conclude that the “natural” formation of boldenone and
its metabolites is not possible, formation that could explain its presence in certainly not
treated animals.
Afterwards, in a study conducted by Nielen at al in 2003 from the RIKILT Institute of
Food Safety (Nielen et al. 2004), with the aim to verify an illegal treatment or a possible
natural presence of boldenone in bovines, different substratums have been considered:
urines, rectal faeces and skin pads obtained from 46 calves, with an age of about 27
weeks and certainly not treated with boldenone and other anabolic substances. The
samples, subjected to enzymatic deconjugation with extract of Helix Pomatia, extracted
in SPE and analyzed in HPLC MS-MS, have given the following results:
urines and rectal feaces show similar results for α and β-boldenone;
the skin pads steadily show traces of α-boldenone and ADD;
dried faeces show an high concentration of α-boldenone, ADD and β-boldenone,
if compared to the corresponding not dried samples; this fact can be only
partially explained with a “concentration effect”, due to the dehydration of the
sample.
To explain these results, the hypothesis that steroid substances , different from those
ones considered up to now, can undergo a conversion in boldenone and in some its
metabolites only in certain conditions (dried faeces or skin) has been put forward.
To sustain this hypothesis, the Authors consider a study (Song et al 2004) from Y.S.
Song, carried out on rats. In this study a microbiological conversion of ADD into AED
is supposed to occur in faeces, after oral administering of phytosterols. Such metabolites
have never been observed in rat at an hepatic microsomial level and so the conversion
couldn’t be imputable to an endogen metabolic phenomenon but to processes that occur
outside the animal or, at least, in the last intestine tract.
In fact Smith at al in 1989 (Smith et al. 1989) demonstrated that some microorganisms
are able to dehydrogenate steroids, as highlighted in a study of 1996 (Barthakur
et al. 1996), about the capability of a bacterium (Mycobacterium NRRL B-3683) to turn
a natural phytosterol, β-sitosterolo, in ADD, through an enzyme produced by the
microbacterium itself.
To clarify the possible origin of β-boldenone and to obtain a certain analysis reliability,
when we have searched for β-boldenone, at the same time and in the same analysis we
have searched also for α-boldenone, ADD, AED, testosterone and epitestosterone
147
(epimere of testosterone, that it is draft in figure 59), as well as the Internal Standard
(noretandrolone).
Figure 59: chemical structure of epitestosterone
148

HPLC MS-MS testsBOLDENONE and METABOLITES
Extraction
2 ml manure have been put in a plastic test tube, with a capacity of 15 ml and screw
plug, and 10 ng/ml noretandrolone have been added as Internal Standard. Then 3 ml of
water and 1 ml NaOH 1N have been added. After shaking in Vortex for 30 seconds,
4 ml tert-butyl-methyl-ether (TBME) have been added. The test tubes have been shaken
in a rotative mixer for 20 minutes and then centrifuged to 2000 g for 15 minutes.
Afterwards the supernatant (ether phase) has been taken and, after move to a glass test
tube with a capacity of 10 ml and the conic bottom, it has been dried in centrifugal
evaporator at 55 °C. The residue, diluted in 200 µl of a blend methanol/water (50:50
v/v), has been put for the analysis in a plastic autosampler vial, with a capacity of 250 µl
and the conic bottom.
Analysis
An ion trap mass spectrometer LCQDecaXPMax, equipped with a source APCI
(Atmospheric pressure chemical ionization) and linked with an autosampler AS
Surveyor and a pump MS Surveyor (all the components: Thermo Fisher, San Jose´,CA,
USA), has been used for the analysis.
The chromatography has been employed at 30°C, in isocratic conditions, using a
column ODS Hypersil (150 x 2.1 mm 5µm-Thermo Fisher) preceded by a precolumn
(C12,4 x 2mm.; Phenomenex).
The mobile phase was water (42%) with 0.1% acetic acid and methanol (58%), flow
rate 300 µl/min. The injection volume was 20 µl; the analysis time was equal to 20 min.
The mass spectrometer was operated in positive APCI mode with source voltage 4.5
kV, vaporizer temperature 350°C ,capillary temperature 210°C and sheath and auxiliary
gas (nitrogen) flow rates of 23 and 5 arbitrary units, respectively. The acquisition
occurred in MS/MS in SRM mode (Selected reaction monitoring); helium was used for
collision-induced dissociation. Parent and product ions were characterized by the mass
149

to charge ratios reported in the following table 25 together with the collision energy
settings and in figure 60.
Collision
Energy
Parent ion
(m/z)
Product ions
(m/z)
Androstadienedione (ADD) 30% 285 121, 147, 151
α and β Boldenone (Bol) 42% 287 121, 135, 147, 173
Androstenedione (AED) 30% 287 97, 109, 251
Testosterone (T)/Epitestosterone(ET) 32% 289 97, 109, 171, 253,
271
Noretandrolone (NETA) 32% 303 215, 227, 267, 285,
Table 25: collision energy settings and mass to charge ratios of parent and product ions belonging to the androgen steroids family
Validation of the method
The calibration curve has been constructed using faeces with 6 fortification levels: 0.5;
1.0; 5.0; 10.0; 20.0 and 50.0 ng.ml-1 (3 points each concentration); moreover 20 not
fortified manure specimens have been analyzed to measure the background noise,
necessary to determine the sensitivity parameters. The method has been evaluated in
terms of decision limit (CCα), detection capability (CCβ), linearity of the calibration
gap (R2) and yield, according to the guide lines of the Decision of the Committee
n° C (2002) 3044 of the 12th of August 2002 that accomplishes the directive 96/23/CE,
regarding the yield of the analytical methods and the interpretation of the results
(Table 26).
CCα
(ng.ml-1)
CCβ
(ng.ml-1)R2 Yield
Antrostadienedione 0.25 0.75 0.99 111%
α-Boldenone 0.80 2.50 0.95 105%
β-Boldenone 0.20 0.80 0.99 124%
Androstenedione 0.20 0.90 0.98 105%
Testosterone 0.20 0.40 0.99 98%
Epitestosterone 2.05 9.45 0.97 128%
Table 26: CCα, CCβ, R2 and yield obtained for some substances from the androgen steroids family
150

Figura 60: LC-MS/MS chromatograms and corresponding SRM spectrums of a blank sample of manure fortified with 50.0 ng.ml-1 of ofboldenone and its major metabolites
(20ng.ml-1)
151

PERSISTENCE testsBOLDENONE and METABOLITES
The average results in HPLC MS-MS, obtained at the different sampling times (average
of three samples every day) fortifying 0.3m3 manure with 500 ng.ml-1 of ADD and 500
ng.ml-1 of
α-BOL, and expressed in percentage as the ratio between the value detected at time zero
and the other times , together with the results obtained with the not fortified samples,
are shown in figures 61 (ADD) and 62 (α-BOL), and in table 27.
ADD α BOL
Day Blank (%) Sample (%) Blank (%) Sample (%)
0 n.d. 100.00 n.d. 100.00
3 n.d n.d n.d n.d
6 n.d n.d n.d n.d
12 n.d. n.d. n.d. n.d.
20 n.d. n.d. n.d. n.d.
36 n.d n.d n.d n.d
52 n.d n.d n.d n.d
66 n.d. 1.16 n.d. 20.28
80 n.d n.d n.d n.d
100 n.d n.d n.d n.d
120 n.d. n.d. n.d. n.d.
Table 27: average concentrations of the fortified and not fortified sample (Sample and Blank, respectly) at each sampling time expressed in percentage as the ratio
between the value detected at time zero and the other times
The two steroids were not present anymore in manure already on day 3. Even if they
have been detected in quantifiable concentrations during the sampling of the day 66.
152

0 20 40 60 80 100 1200
10
20
30
40
50
60
70
80
90
100
ADD
BlankSample
Days
Conc
entr
ation
%
Figure 61: average concentrations of ADD in the fortified Sample and Blank sample at each sampling time expressed in percentage as the ratio between the value detected at
time zero and the other times
0 20 40 60 80 100 1200
1020
30
40
50
60
70
8090
100
α BOL
BlankSample
Days
Conc
entr
ation
%
Figure 62: average concentrations of the spiked and blank sample at each sampling time expressed in percentage as the ratio between the value detected at time zero and
the other times
153

Figure: 63: Chromatograph and respective mass spectrum concerning the sample ADD and α Boldenone at the lowest detected concentration (1.16 ng.ml-1 and 20.28 ng.ml-1 respectively on
the day 66)
We want to highlight that during all the experimentation AED has been found in
Sample (fortified with ADD + α Boldenone) and, in the first two samplings, also in the
not fortified one. (figure 64 and table 28). The concentrations are reported in ng.ml-1.
0 20 40 60 80 100 1200
50
100
150
200
250
AED
BlankSample
Days
Conc
entr
ation
ng.
ml-1
Figure 64: concentration expressed in ng.ml-1 at each sampling time, of AED in Blank (not fortified) and in Sample (fortified with ADD and α-boldenone)
154

Day Blank (ng.ml-1) Sample(ng.ml-1)
0 71,0 87.4
3 105.1 239.9
6 n.d 149.2
12 n.d. 120.4
20 n.d. 70.8
36 n.d 51.8
52 n.d 43.3
66 n.d. 43.3
80 n.d 28.7
100 n.d 17.6
120 n.d. 15.8
Table 28: concentration expressed in ng.ml-1 at each sampling time, of AED in Blank (not fortified) and in Sample (fortified with ADD and α-boldenone)
155
CONCLUSIONS
ELISA tests
The results previously displayed are, for every considered substance, a careful
evaluation of the different ELISA kits on the market. A special attention has been put in
the choice of the most suitable kit that most fitted our requirements. In fact, despite
most of the used ELISA kits had been developed and produced to be employed on
different matrixes from manure or faeces, thanks to the improving of adequate
analytical methodologies, to obtain various good results has been possible.
The detection limit, in manure, for all the substances tested with ELISA kits, was less
than 1 ng/ml, except for trenbolone that can be traced only if present in concentrations
higher than 2 ng.ml-1.
The most sensitive test has shown itself the one for diethilstylbestrol, whose
concentrations in manure were quantifiable up to values between 12.5 and 25 pg.ml-1.
The useful interval to quantify a substance (the ratio between the maximum quantifiable
concentration and the minimum concentration) was very changeable among the
different tests, from almost null values of stanozolol up to definitely larger ranges, as
those found analyzing clenbuterol or chloranfenicol.
The matrix effect on some tests (stanazolol, zeranol, corticosteroids and trenbolone) has
been remarkable, this could indicate that manure, because of its varied chemical
composition, is not a suitable matrix to be used with immunoenzymatic methods for
these substances. It would be necessary to repeat these trials using serial dilutions of the
samples or to implement a new samples preparation methodology, that provides for an
extraction and/or a purification step. However this last hypothesis partially invalidates
the purpose of the research of the different substances in manure, or rather the
simplicity and the cheapness, in favour of longer and more complex methodologies
(fundamental concept most of all for screening analyses). As regards AMOZ, a
methodology providing for the extraction of the sample has been tested, to obtain a
better discrimination among the different concentrations, even if in this case the matrix
effect has been more substantial.
156

HPLC tests
Original methodologies of extraction and quantitative determination in liquid
chromatography coupled with mass spectrometry have been improved, suitable to make
the confirmatory analyses of the different substances in manure studied in this part of
our work.
Above all, it is important to highlight the instrument used for the mass analysis
(LCQDeca XP MAX, Thermo Fischer) is an ion trap spectrometer. In practical terms,
this means that , if compared with a triple quadrupole, allows more versatility in the
analysis of different classes of substances and so it is a very good instrument for the
qualitative analysis, but it can not be considered the best instrument for quantitative
analysis. In fact the variability of the instrumental answer, according to the
specifications supplied by the producer, is equal to 30% even if the experience of our
laboratory brings us to believe that it could be even more.
The calibration curves, for the different considered substances, were quite linear. The
lowest values have been found in betamethasone (R2 equal to 0.72), in chloramphenicol
and in αboldenone (both of them: R2 equal to 0.95).
Anyway for all the considered substances the detection capability (CCβ) was between
0.15 (dexamethasone) and 2.50 ng.ml-1 (α boldenone), except for the value obtained
with epitestosterone equal to 9.15 ng.ml-1.
Epitestosterone in fact showed CCα and CCβ values definitely higher than the other
analytes (2.05 and 9.45 ng.ml-1 respectively). These data related to epitestosterone could
have been caused by a low but inevitable presence of this steroid in manure that was
instead considered blank sample.
So, excluding CCα values (decision limit) relating epitestosterone and αboldenone, CCα
resulted to be comprised between 0.14 ng.ml-1 of clenbuterol and 0.80 ng.ml-1 of
trenbolone.
The yield of the different analytical methodologies was not always satisfactory, in
particular with the nitrofurans and corticosteroids metabolites. While in some cases
yields higher than 100% have been registered, this fact can be explained with the above
considerations concerning the variability of the instrumental answer.
157

The chromatographic separation has been done, when possible, with single
multianalytes runnings, for every class of compounds, trying to optimize both the
resolution and the time necessary for the separation of the analytes. Some problems
have been met in the optimization of the chromatographic methodology to separate
corticosteroids. In particular, the separation between dexamethasone and betamethasone
has not been satisfactory despite the analysis time was 43 minutes.
Persistence tests
The results of the persistence tests on illegal drugs in manure show that the slowest
degradation compounds, detectable up to 120 day, that is up to the end of the
experimentation, were clenbuterol, dienestrol isoxsuprine, AOZ, AMOZ and α
zearalanol.
β zearanol was still detectable up to 100 days, while 16 β OH stanazolol up to 52 days
and trenbolone up to 32 days.
All these substances, because of the long persistence after a possible treatment
(compared to what happens in urines and blood), could be detected in all probability by
a pharmacosurveillance inspection.
The results concerning persistence test of chloranphenicol, 2-tiouracil and
corticosteorids have not been reported in this work, they were practically absent already
in the first sampling (time zero, occurred just after the manure fortification). Since the
methodologies of extraction and analysis HPLC MS-MS towards these substances have
revealed themselves suitable to detect them in manure, this phenomenon could be
justified by their quick degradation, even if different explanations are being still
evaluated in our laboratory.
With regard to the anabolic steroids, in agreement with previous experiences carried out
in our laboratory, they have demonstrated that the steroidal structure can be easily
attacked by the faecal bacterial component and all the forms β OH in 17 position (the
most effective from a pharmachological point of view) are destined to a fast metabolism
(some hours). So manure is no more a material suitable to detect this family of anabolic
158

steroids. Nevertheless investigations to evaluate the persistency in manure of oxidized
metabolytes of methyl testosterone and nandrolone are ongoing, since they could
represent treatment markers with these anabolic steroids.
Prosecution
The results obtained up to now, that are the first part of the experimentation of an
ongoing project, developed in cooperation with the region Lombardia, represent the
starting point of the second experimental phase. This work will be organized in two
main topics:
Evaluation in vivo of the extent of the faecal and urinary excretion of the
selected active principles on small groups of animals (n. 10-15) (It twill be done
in Lodi: Veterinary Hospital and Experimental Zootechnical didactic Centre).
Planning of the systems to collect manure for the inspections (check wells for
the collection of samples).
159

REFERENCES
Abraham G, Gottschalk J, Ungemach FR. (2004) Possible role of dexamethasone in sensitizing the beta-2-adrenergic receptor system in vivo in calves during concomitant treatment with clenbuterol. Pharmacology. 72 (3); 196-204.
AgEdLibrary.com (2006) E-unit: Growth Promoters in Animal Production. Available on line: http://www.centerville.k12.ia.us/chs/doc_lib_chs/ag/AniGroProAg1.pdf
Anderson DB, Schmiegel K, Veenhuizen EL. (1987) Growth promotion. U.S. Patent. 4,690,951.
Antignac JP, De Wasch K, Assie S. (2004) Elimination Kinetics of dexamethasone in bovine, urine, hair and faeces after administration of phosphate and acetate esters. Proceedings of EuroResidueV. Noordwikerout The Netherlands
Arts CJM, Schilt R, Schreurs M, Van Ginkel LA. (1996) in Proceedings of the Euroresidue III Conference, Veldhoven, ed. N. Haagama, Ruiter A., University of Utrecht. 808.
Attucci A, Rabbia G, Platti G, Meaglia C, Vincenti M, Pazzi M, Mattaglia G. (2003) Rilevazione dell’eventuale produzione fisiologica di boldenone nel vitello a carne bianca. Large Animals Review. 5; 23-32.
Bahrke MS, Yesalis CE. (2004) Abuse of anabolic androgenic steroids and related substances in sport and exercise. Curr Opin Pharmacol. 4 (6); 614-20.
Baker PK and Kiernan JA. (1983) Phenylethanolamine derivatives and acid addition salts thereof for enhancing the growth rate of meat producing animals and improving the efficiency of feed utilization thereby. U.S. Patent. 4,404,222.
Barragry TB. (1994) In: Veterinary Drug Therapy. Lea & Febirger, Philadelphia USA.
Barseghian G, Levine R, Epps P. (1982) Direct effect of cortisol and cortisone on insulin and glucagon secretion. Endocrinology. 111 (5); 1648-51.
Barthakur S, Roy MK, Bera SK, Ghosh AC. (1996) Steroid transformation by mutants of Mycobacterium species with altered response to antibiotics. J Basic Microbiol. 36; 383-7.
Bauer ER, Daxenberger A, Petri T, Sauerwein H, Meyer HH. (2000) Characterisation of the affinity of different anabolics and synthetic hormones to the human androgen receptor, human sex hormone binding globulin and to the bovine progestin receptor. APMIS. 108 (12); 838-46.
160

Baxter GM, Tackett RL, Moore JN. (1989) Reactivity of equine palmar digital arteries and veins to vasodilating agents. Vet Surg. 18 (3); 221-6.
Beg T, Siddique YH, Afzal M. (2007) Chromosomal damage by androgenic steroids, stanozolol and trenbolone, in human lymphocytes. Advances Enviromental Biology 1 (1); 39-43.
Belloli C, Carcano R, Arioli F, Beretta C. (2000) Affinity of isoxsuprine for adrenoreceptors in equine digital artery and implications for vasodilatory action. Equine Vet J. 32 (2); 119-24.
Boada LD, Zumbado M, Torres S, López A, Díaz-Chico BN, Cabrera JJ, Luzardo OP. (1989) Evaluation of acute and chronic hepatotoxic effects exerted by anabolic-androgenic steroid stanozolol in adult male rats. Arch Toxicol. 73 (8-9); 465-72.
Brambilla G, Cenci T, Franconi F, Galarini R, Macry´ A, Rondoni F, Strozzi M, Loizzo A. (2000) Clinical and pharmacological profile in a clenbuterol epidemic poisoning of contaminated beef meat in Italy. Toxicol Lett. 114; 47-53.
Brambilla G, Loizzo A, Fontana L, Strozzi M, Guarino A, Soprano V. (1997). Food poisoning following consumption of clenbuterol-treated veal in Italy. JAMA. 278; 635.
Brumbaugh GW, Sumano López H, Hoyas Sepúlveda ML. (1999) The pharmacologic basis for the treatment of developmental and acute laminitis. Vet Clin North Am Equine Pract. 15 (2); 345-62.
Bryant DW, Mccalla DR. (1980) Nitrofuran induced mutagenesis and error prone repair in Escherichia-Coli. Chem Biol Interact. 31; 151-66.
Catlin DH, Fitch KD, Ljungqvist A. (2008) Medicine and science in the fight against doping in sport. J Intern Med 264 (2); 99-114.
Chamberlain RE (1976) Chemotherapeutic properties of prominent nitrofurans. J Antimicrob Chemother. 2; 325-36.
Clinton RO, Manson AJ, Stanner AL, Beyer GO, Potts GO, Arnold A. (1959) J. Am. Chem. Soc. 81; 1513-1514.
Commission Decision (2003) 2003/181/EC amending Decision 2002/657/EC as regards the setting of minimum required performance limits (MRPLs) for certain residues in food of animal origin. Official Journal of the European Communities. L71, 17–18.
Commission Decision 2002/657/EC (2002) Implementing Council Directive 96/23/EC concerning the performance of analytical methods and the interpretation of results. Official Journal of the European Communities. L221; 8–36.
161
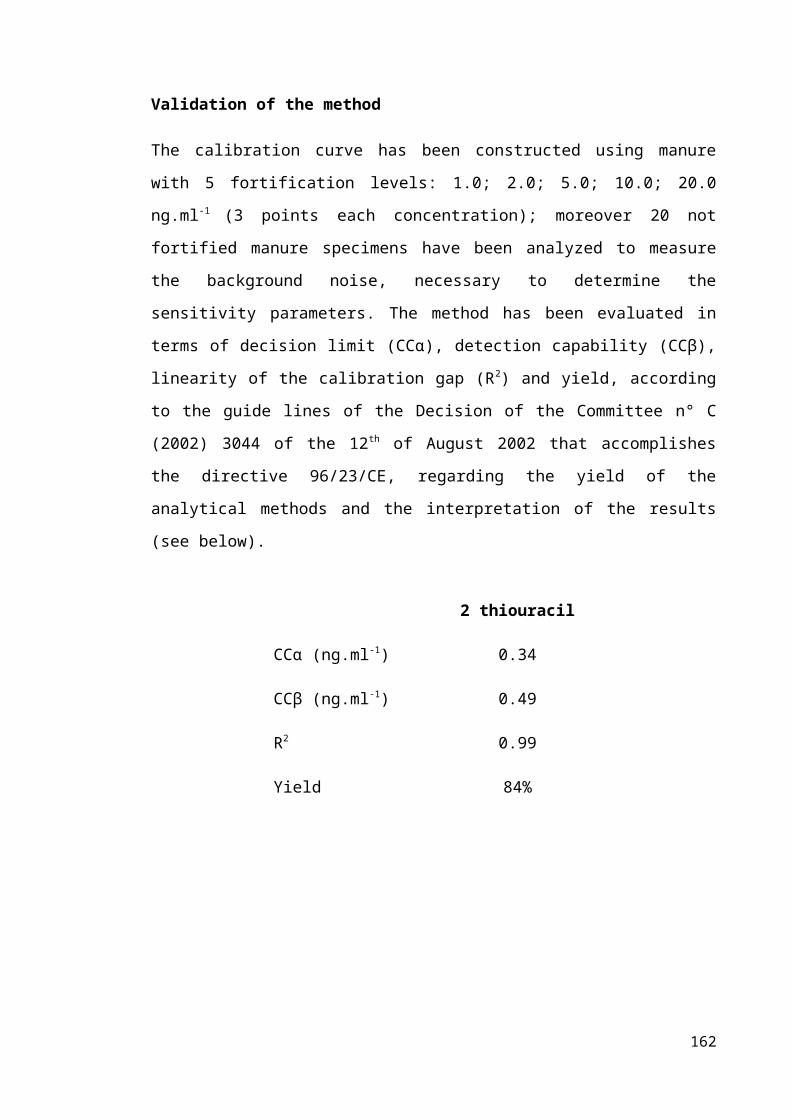
Commission Regulation (1995) EC 1442/95 amending Annexes I, II, III and IV of Regulation (ECC) No 2377/90 laying down a Community Procedure for the establishment of maximum residue limits of veterinary medicinal products in foodstuffs of animal origin. Official Journal of the European Communities. L143; 26-30.
Cooper KM, Kennedy DG. (2005) Nitrofuran antibiotic metabolites detected at parts per million concentrations in retina of pigs - a new matrix for enhanced monitoring of nitrofuran abuse. Analyst. 130; 466-8.
Cooper KM, Ribeiro L, Alves P, Vozikis V, Tsitsamis S, Alfredsson G, Lövgren T, Tuomola M, Takalo H, Iitia A, Sterk SS, Blokland M, Kennedy DG. (2003) Interlaboratory ring test of time-resolved fluoroimmunoassays for zeranol and α-zearalenol and comparison with zeranol test kits. Food Addit Contam. 20 (9); 804-12.
Cooper KM, Samsonova JV, Plumpton L, Elliott CT, Kennedy DG. (2007) Enzyme immunoassay for semicarbazide - the nitrofuran metabolite and food contaminant. Anal Chim Acta. 592; 64-71.
Corah TJ, Tatum JD, Morgan JD. (1995) Effects of a dexamethasone implant on deposition of intramuscular fat in genetically identical cattle. J Anim Sci. 73; 3310-16.
Council Directive 96/22/EC (1996a) Concerning the prohibition of use in stock farming of certain substances having a hormonal or thyrostatic action and of β-agonists. Official Journal of the European Communities. L125; 3–9.
Council Directive 96/23/EC (1996b) On measures to monitor certain substances and residues thereof in live animals and animal products. Official Journal of the European Communities. L125; 10–32.
Creagh TM, Rubin A, Evans DJ. (1988) Hepatic tumours induced by anabolic steroids in an athlete. J Clin Pathol. 41 (4); 441-3.
Danhaive PA, Rousseau GG. (1986) Binding of glucocorticoid antagonists to androgen and glucocorticoid hormone receptors in rat skeletal muscle. J Steroid Biochem. 24 (2); 481-7.
De Wash K, Ph.D. (2002) thesis, Ghent University, Belgium.
Debenedetti A, Todini L. In: Fisiologia degli animali domestici con elementi di etologia 2nd edition. Aguggini G, Beghelli V. Giulio LF. UTET
Derblom H, Johansson H, Nylander G. (1963) Thyroid hormone activity and gastrointestinal function. An experimental in the rat. Acta Chir Scand S307; 1-47.
Dodds EC, Goldberg L, Lawson W, Robinson R. (1938) Oestrogenic activity of certain synthetic compounds. Nature. 141; 247-8.
162

Doisneau-Sixou SF, Sergio CM, Carroll JS, Hui R, Musgrove EA, Sutherland RL. (2003) Estrogen and antiestrogen regulation of cell cycle progression in breast cancer cells. Endocr Relat Cancer. 10 (2); 179-86.
Draisci R, Giannetti L, Lucentini L, Palleschi L, Brambilla G, Serpe L, Gallo P. (1997) Determination of nitrofuran residues in avian eggs by liquid chromatography UV photodiode array detection and confirmation by liquid chromatography ionspray mass spectrometry. J Chromatogr A. 777; 201-11.
Duke T, Michael A, Mokela D, Wal T, Reeder J. (2003) Chloramphenicol or ceftriaxone, or both, as treatment for meningitis in developing countries? Arch Dis Child. 88; 536-9.
Dumasia MC, Houghton E, Branley CV, Williams DH. (1983) Studies related to the metabolism of anabolic steroids in the horse-the metabolism of 1-dehydrotestosterone and the use of fast atom bombardment mass spectrometry in the identification of steroid conyugates. Biomed Mass Spectrom. 10; 434-40.
Erasmuson AF, Scahill BG, WestDM. (1994) Natural zeranol (α-zearalanol) in the urine of pasture-fed animals. J Agric Food Chem. 42 (12); 2721-5.
Falk H, Thomas LB, Popper H, Ishak KG. (1979) Hepatic angiosarcoma associated with androgenic-anabolic steroids. Lancet. 2; 1120-3.
Feder HM Jr, Osier C, Maderazo EG.(1981) Chloramphenicol: A review of its use in clinical practice. Rev Infect Dis. 3(3); 479-91.
Ferchaud V, Le Bizec B, Montrade MP, Maume D, Monteau F, André F. (1997) Gas chromatographic-mass spectrometric identification of main metabolites of stanozolol in cattle after oral and subcutaneous administration. J Chromatogr B Biomed Sci Appl 695(2); 269-77.
Gallo P, Brambilla G, Neri B, Fiori M, Testa C, Serpe L. (2007) Purification of clenbuterol-like beta2-agonist drugs of new generation from bovine urine and hair by alpha1-acid glycoprotein affinity chromatography and determination by gas chromatography-mass spectrometry. Anal Chim Acta. 587 (1); 67-74.
Gandhi R, Snedeker S. (2000) Consumer Concerns About Hormones in Food. Cornell University Program on Breast Cancer and Environmental Risk Factors. 37; 2.
Garay JB, Jimenez JFH, Jimenez ML, Sebastian MV, Matesanz JP, Moreno PM, Galiana JR. (1997) Intoxicacion por clenbuterol: Datos clinicos y analiticos de un brote epidemico en Mostoles. Madrid. Rev Clin Esp. 197; 92-95.
Gill WB, Schumacher GF, Bibbo M, Straus FH 2nd, Schoenberg HW. (1979) Association of diethylstilbestrol exposure in utero with cryptorchidism, testicular hypoplasia and semen abnormalities. J Urol. 122 (1); 36-9.
163

Giusti RM, Iwamoto K, Hatch EE. (1995) Diethylstilbestrol revisited: a review of the long-term health effects. Ann Intern Med. 122 (10); 778-88.
Gleckman R, Alvarez S, Joubert DW. (1979) Drug therapy reviews: nitrofurantoin. Am J Hosp Pharm. 36 (3) 342-51.
Golden RJ, Noller KL, Titus-Ernstoff L, Kaufman RH, Mittendorf R, Stillman R, Reese EA. (1998) Environmental endocrine modulators and human health: an assessment of the biological evidence. Crit Rev Toxicol. 28 (2);109-227.
Goldfarb S. (1976) Sex hormones and hepatic neoplasia. Cancer Res. 36; 2584-8.
Groot MJ. (2002) Hepatitis in Growth Promoter Treated Cows. J Vet Med A. 49 (9); 466 – 9.
Guay DR (2008) Contempory management of uncomplicated urinary tract infections. Drugs. 68; 1169-205.
Handelsman DJ (1995) Testosterone and other androgens: physiology, pharmacology and therapeutic use. In: De Groot L. J.(ed) Endocrinology. Saunders & Co., Philadelphia.
Hansen DK, LaBorde JB, Wall KS, Holson RR, Young JF. (1999) Pharmacokinetic considerations of dexamethasone-induced developmental toxicity in rats. Toxicol Sci. 48 (2); 230-9.
Haupt HA, Rovere GD. (1984) Anabolic steroids: a review of the literature. Am J Sports Med. 12 (6);469-84.
HDBS Hazardous Sustances Data Base. National Library of Medicine http://toxnet.nlm.nih.gov
Heeremans A, Ermens A, De Wasch KK, Van Peteghem C, De Brabander HF. (1998) Elimination profile of methylthiouracil in cows after oral administration. Analyst. 123 (12); 2629-32.
Hendricks CH, Cibils LA, Pose SV, Eskes TK. (1961) The pharmacologic control of excessive uterine activity with isoxsuprine. Am J Obstet Gynecol. 82; 1064-78.
Herbst AL, Ulfelder H, Poskanzer DC. (1971) Adenocarcinoma of the vagina: association of maternal stilbestrol therapy with tumor appearance in young women.
N Engl J Med. 284; 878-81.
Herbst AL. (1981) Clear cell adenocarcinoma and the current status of DES-exposed females. Cancer. 48 S2; 484-8.
Hoogenboom LAP, vanBruchem GD, Sonne K, Enninga IC, vanRhijn JA, Heskamp H, Huveneers-Oorsprong MBM, van der Hoeven JCM, Kuiper HA. (2002);
164
Absorption of a mutagenic metabolite released from protein-bound residues of furazolidone. Environ Toxicol Pharmacol. 11; 273-87.
House A, Road D. Gill R, Dawson RT.(2001) Drugs in sport – the role of the physician J Endocrinol. 170; 55-61.
Howard J. (2004) Chloramphenicol A Review. Pediatr Rev. 25:284-8.
Jimenez JJ, Jimenez JG, Daghistani D, Yunis AA. (1990) Interaction of chloramphenicol and metabolites with colony stimulating factors: possible role in chloramphenicol-induced bone marrow injury. Am J Med Sci.300 (6); 350-3.
Johnson FL, Lerner KG, Siegel M, Feagler JR, Majerus PW, Hartmann JR, Thomas ED. (1972) Association of androgenic-anabolic steroid therapy with development of hepatocellular carcinoma. Lancet. 16; 1273-6.
Joujou-Sisic K, Andren PE, Bondesson U. (1996) A pharmacokinetic study of isoxsuprine in the horse. In Proceeding of the 11th International Conference of Racing Analyst and Veterinarians. R&W Pubblications, UK.
Kennedy DG, Hewitt SA, McEvoy JD, Currie JW, Cannavan A, Blanchflower WJ, Elliot CT. (1988) Zeranol is formed from Fusarium spp. toxins in cattle in vivo. Food Addit Contam. 15 (4); 393-400.
Khong SP, Gremaud E, Richoz J, Delatour T, Guy PA, Stadler RH, Mottier P. (2004) Analysis of matrixbound nitrofuran residues in worldwide-originated honeys by isotope dilution high-performance liquid chromatography-tandem mass spectrometry. J Agric Food Chem. 52; 5309-15.
Kruger G, Keck J, Noll K, Pieper H. (1984) Synthesis of further amino-halogen-substituted phenyl-aminoethanois. Arzneim Forsch. 34; 1612-24.
Kuiper HA, Noordam MY, van Dooren-Flipsen MM, Schilt R, Roos AH. (1998) Illegal use of beta-adrenergic agonists: European Community. J Anim Sci. 76 (1); 195-207.
Launay FM, Young PB, Sterk SS, Blokland MH, Kennedy DG. (2004) Confirmatory assay for zeranol, taleranol and the Fusarium spp. toxins in bovine urine using liquid chromatography-tandem mass spectrometry. Food Addit Contam. 21 (1); 52-62.
Leffers H, Naesby M, Vendelbo B, Skakkebaek NE, Jørgensen M. (2001) Oestrogenic potencies of Zeranol, oestradiol, diethylstilboestrol, Bisphenol-A and genistein: implications for exposure assessment of potential endocrine disrupters. Hum Reprod. 16 (5); 1037-45.
LeGuevel R, Pakdel F. (2001) Assesment of oestrogenic potency of chemicals used as growth promoter by in vitro methods. Hum Reprod 16; 1030-6.
165

Leitner A, Zollner P, Lindner W. (2001) Determination of the metabolites of nitrofuran antibiotics in animal tissue by high-performance liquid chromatography-tandem mass spectrometry. J Chromatogr A. 939; 49–58.
Lenders JW, Demacker PN, Vos JA, Jansen PL, Hoitsma AJ, van 't Laar A, Thien T. (1988) Deleterious effects of anabolic steroids on serum lipoproteins, blood pressure, and liver function in amateur body builders. Int J Sports Med. 9 (1);19-23.
Lupien SJ, McEwen BS. (1997) The acute effects of corticosteroids on cognition: integration of animal and human model studies. Brain Res Rev. 24 (1); 1-27.
Maistro S, Chiesa E, Angeletti R, Brambilla G. (1995) Beta blockers to prevent clenbuterol poisoning. Lancet. 346; 180.
Maravelias C, Dona A, Stefanidou M, Spiliopoulou C. (2005) Adverse effects of anabolic steroids in athletes. A constant threat. Toxicol Lett. 158 (3); 167-75.
Marselos M, Tomatis L (1993) Diethylstilbestrol: II, pharmacology, toxicology and carcinogenicyt in experimental animals. Eur J Cancer. 29A; 149-55.
Martinez-Navarro JF (1990) Food poisoning related to consumption of illicit β-agonists. Eur J Pharmacol. 117; 127-9.
Massé R, Ayotte C, Bi HG, Dugal R. (1989) Studies on anabolic steroids. III. Detection and characterization of stanozolol urinary metabolites in humans by gas chromatography-mass spectrometry. J Chromatogr. 497;17-37.
Matthews NS, Gleed RD, Short CE, Burrows K. (1986) Cardiovascular and pharmacokinetic effects of isoxsuprine in the horse. Am J Vet Res. 47 (10); 2130-3.
Mayol X, Neal GE, Davies R, Romero A, Domingo J. (1992) Ethinyl estradiol-induced cell proliferation in rat liver. Involvement of specific populations of hepatocytes. Carcinogenesis. 13 (12); 2381-8.
Mccalla D.R. (1983) Mutagenicity of nitrofuran derivatives - Review. Environmental Mutagenesis. 5; 745-65.
Metzler M. (1981) The metabolism of diethylstilbestrol. Crit Rev Biochem. 10; 171-212.
Metzler M. (1989) Metabolism of some anabolic agents: toxicological and analytical aspects. J Chromatogr. 489 (1); 11-21.
Meyer HHD and Rapp M.(1985) Estrogen Receptor in Bovine Skeletal Muscle. J Anim Sci. 60; 294-300.
166

Meyer HHD. (2007) Biochemistry and physiology of anabolic hormones used for improvement of meat production. Acta Pathol Microbiol Immunol Scand. 109 (1); 1-8.
Meyer K, Usleber E, Martlbauer E, Bauer J (1997) Demonstration of zearalenone metabolites in bile of breeding sows with fertility disturbances. Berl Munch Tierarztl Wochensch 110; 281-3.
Miles CO, Erasmuson AF, Wilkinsa AL, Towers NR, Smith BL, Garthwaite I, Scahill BG, Hansen R. (1996) Ovine metabolism of zearalenone to α-zearalanol (zeranol). J Agric Food Chem. 44 (10); 3244-50.
Morgan DJ. (1990) Clinical pharmacokinetics of beta-agonists. Clin Pharmacokinet. 18 (4); 270-94.
Neumann F. (1976) Pharmacological and endocrinological studies on anabolic agents. Environ Qual Saf. S5; 253-64.
Newbold R, McLachlan JA. (1996) Transplacental hormonal carcinogenesis: diethylstilbestrol as an example. Prog Clin Biol Res. 394; 131-47.
Newbold R. (1995) Cellular and molecular effects of developmental exposure to diethylstilbestrol: implications for other environmental estrogens. Environ Health Perspect.103 S7; 83-7.
Nielen MWF, Rutgers P, van Bennekom EO, Lasaroms JJP, van Rhijn JAH. (2004) Confirmatory analysis of 17β-boldenone, 17α-boldenone and androsta-1,4-diene-3,17-dione in bovine urine, faeces, feed and skin swab samples by liquid chromatography-electrospray ionisation tandem mass spectromery. J Chrom B. 801; 273-83.
Nikaido Y, Danbara N, Tsujita-Kyutoku M, Yuri T, Uehara N, Tsubura A. (2005) Effects of prepubertal exposure to xenoestrogen on development of estrogen target organs in female CD-1 mice. In Vivo 19 (3); 487-94.
Nimrod C, Rambihar V, Fallen E, Effer S, Cairns J. (1984) Pulmonary edema associated with isoxsuprine therapy. Am J Obstet Gynecol. 148 (5); 625-9.
Nouws JFM, Laurensen J. (1990) Postmortal degradation of furazolidone and furaltadone in edible tissues of calves. Vet Q. 12; 56-59.
Olsen M, Pettersson H, Kiessling KH. (1981) Reduction of zearalenone to zearalenol in female rat liver by 3 alpha-hydroxysteroid dehydrogenase. Acta Pharmacol Toxicol. 48 (2); 157-61.
Petri W (2005) Treatment of giardiasis. Current Treatment Options Gastroenterology. 8; 13-17.
167
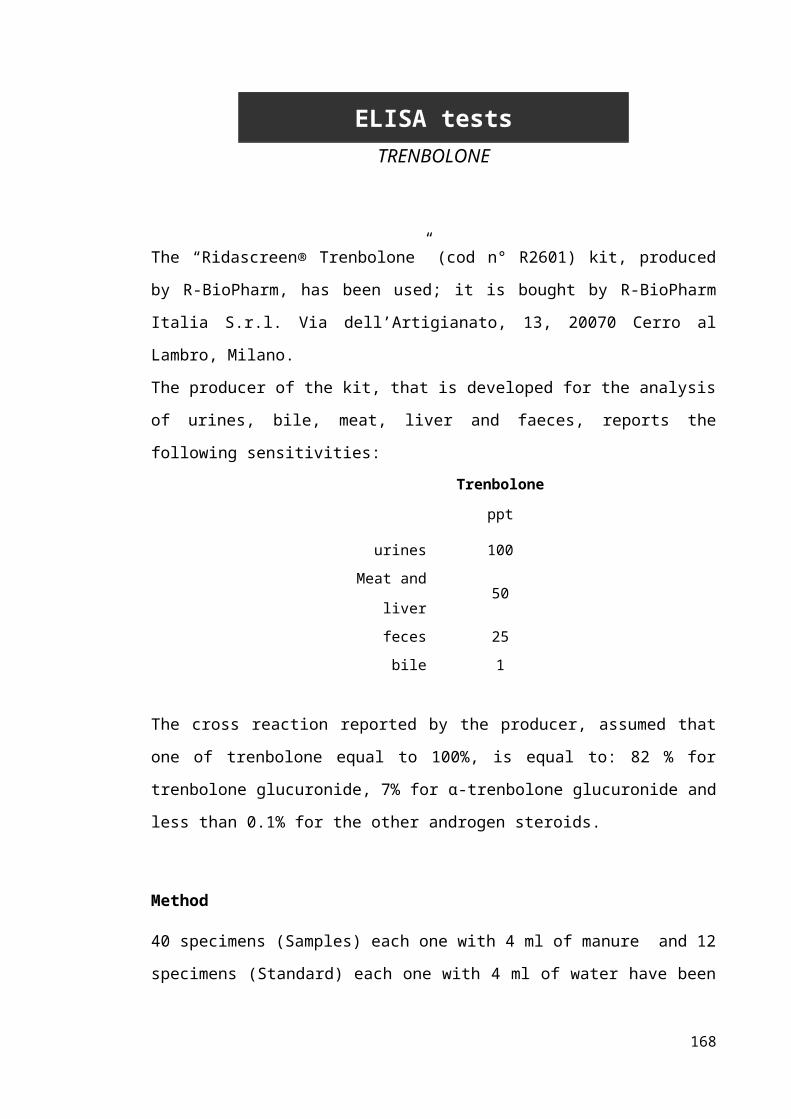
Pottier J, Cousty C, Heitzman RJ, Reynolds IP. (1981) Differences in the biotransformation of a 17 beta-hydroxylated steroid, trenbolone acetate, in rat and cow. Xenobiotica. 11 (7); 489-500.
Prezelj A, Obreza A, Pecar S. (2003) Abuse of clenbuterol and its detection. Curr Med Chem. 10 (4); 281-90.
Pulce C, Lamaison D, Keck G, Bostvironnois C, Nicolas J, Descotes J. (1991) Collective human food poisoning by clenbuterol residues in veal liver. Vet Hum Toxicol. 33;480-1.
Quinn MJ Jr, McKernan M, Lavoie ET, Ottinger MA. (2007b) Immunotoxicity of trenbolone acetate in Japanese quail. J Toxicol Environ Health A. 70 (1); 88-93.
Quinn MJ, Lavoie ET, Ottinger MA.(2007a) Reproductive toxicity of trenbolone acetate in embryonically exposed Japanese quail. Chemosphere. 66 (7); 1191-6.
Rahal JJ Jr, Simberkoff MS. (1979) Bactericidal and bacteriostatic action of chloramphenicol against memingeal pathogens. Antimicrob Agents Chemother. 16 (1);13-18.
Rico AD. (1983) Metabolism of Endogenous and Exogenous Anabolic Agents in Cattle. J Anim Sci. 57; 226-32.
Rogozkin VA. (1991). Anabolic androgenic steroids (AAS): structure, nomenclature and classification, biological properties. In: Metabolism of ASS. CRC Press, Boca Raton. Florida.
Rose MD, Shearer G, Farrington WH. (1995) The effect of cooking on veterinary drug residues in food: 1. Clenbuterol. Food Addit Contam. 12 (1); 67-76.
Rose RJ, Allen JR, Hodgson DR, Kohnke JR. (1983) Studies on isoxsuprine hydrochloride for the treatment of navicular disease. Equine Vet J. 15 (3); 238-43.
Roychowdhury A, Pan A, Dutta D, Mukhopadhyay AK, Ramamurthy T, Nandy RK, Bhattacharya SK, Bhattacharya MK. (2008) Emergence of tetracycline-resistant Vibrio cholerae O1 serotype Inaba, in Kolkata, India. Jpn J Infect Dis. 61; 128-9.
Saborido A, Molano F, Megías A. (1993) Effect of training and anabolic-androgenic steroids on drug metabolism in rat liver. Med Sci Sports Exerc. 25 (7); 815-22.
Saborido A, Vila J, Molano F, Megías A. (1991) Effect of anabolic steroids on mitochondria and sarcotubular system of skeletal muscle. J Appl Physiol. 70 (3); 1038-43.
Samuels SS, Shaftel HE. (1959) Use of a new vasodilator agent in management of peripheral arterial insufficiency. J Am Med Assoc. 171; 142-5.
168

Sauerwein H and Meyer HHD. (1989) Androgen and Estrogen Receptors in Bovine Skeletal Muscle: Relation to Steroid-Induced Allometric Muscle Growth. J Anim Sci. 67; 206-12.
Schanzer W, Donike M.(1993) Metabolism of anabolic steroids in man: synthesis and use of reference substances for identication of anabolic steroids metabolites. Anal Chim Acta. 275; 23-48.
Schiffer B, Daxenberger A, Meyer K, Meyer HH. (2001) The fate of trenbolone acetate and melengestrol acetate after application as growth promoters in cattle: environmental studies. Environ Health Perspect. 109 (11); 1145-51.
ScottJL, Finegold SM, Belkin GA, Lawrence JS. (1965) A controlled doucle-blind study of the hematologic toxicity of chloramphenicol. N Engl J Med. 272; 1137-42.
Shiu TC, Chong WH. (2001). A cluster of clenbuterol poisoning associated with pork and pig offal in Hong Kong. Public Health Epidemiology Bull. 10; 14-17.
Shu XO, Gao YT, Brinton LA, Linet MS, Tu JT, Zheng W, Fraumeni JF Jr. (1988) A population-based case-control study of childhood leukemia in Shanghai. Cancer. 62 (3); 635-44.
Skrinjar M, Stubblefield RD, Stojanović E, Dimić G. (1995) Occurrence of Fusarium species and zearalenone in dairy cattle feeds in Vojvodina. Acta Vet Hung.43 (2-3); 259-67.
Smith DJ. (1998) The pharmacokinetics, metabolism, and tissue residues of beta-adrenergic agonists in livestock. J Anim Sci.76 (1);173-94.
Smith K, Latif S, Kirk DN, White KN. (1989) Microbical transformation of steroids vl. 6,7-dehydrogenation: a new class of fungal steroid transformation product. J Steroid Biochem. 33; 271-6.
Song YS, Jin C, Park EH. (2000) Identification of metabolites of phytosterolis in rat feces using GC/MS. Archives of Pharmacological Research. 23; 599-604.
Spangler DL. (1989) Review of side effects associated with beta agonists. Ann Allergy. 62 (1); 59-62.
Sporano V, Grasso L, Esposito M, Oliviero G, Brambilla G, Loizzo A. (1998) Clenbuterol residues in non-liver containing meat as a cause of collective food poisoning. Vet Hum Toxicol. 40 (3); 141-3.
Suda T, Shimizu D, Maeda N, Shiga T. (1981) Decreased viscosity of human erythrocyte suspension induced by chlorpromazine and isoxsuprine. Biochem Pharmacol. 30 (15); 2057-64.
Suissa S, Hemmelgarn B, Blais L, Ernst P. (1996) Bronchodilators and acute cardiac death. Am J Respir Crit Care Med. 154 (6); 1598-602.
169
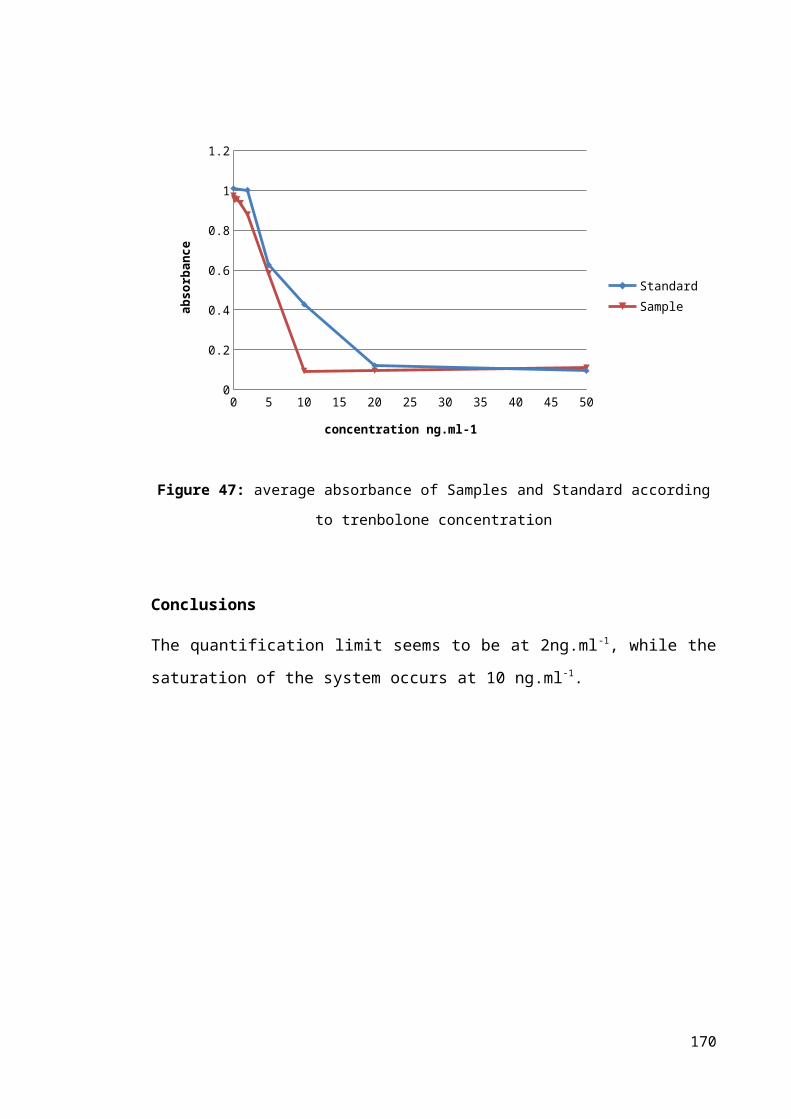
Tarantola M, Schiavone A, Preziuso G, Russo C, Biolatti B, Bergero D. (2004) Effects of low doses of dexamethasone on productive traits and meat quality of veal calves. Animal Science 79; 93-98.
Torneke K, Larsson CI, Appelgren LE. Melanin affinity: a possible explanation of isoxsuprine retention in the horse. Equine Vet J. 32 (2); 114-8.
Tuomola M, Cooper KM, Lahdenperä S, Baxter GA, Elliott CT, Kennedy DG, Lövgren T. (2002) A specificity-enhanced time-resolved fluoroimmunoassay for zeranol employing the dry reagent all-in-one-well principle. Analyst. 127 (1); 83-6.
Van Koten-Vermeulen JEM (1993) Report of the 40th Meeting of the Joint FAO/WHO Expert Committee On Food Additives (JECFA) WHO Geneva.
Van Puymbroeck M, Kuilman EM, Maas RF, Witkamp R, Leyssens L, Vanderzande D, Gelan J, RausJ. (1998) Identification of important metabolites of boldenone in urine and feces of cattle by gas chromatography-mass spectrometry. The Analyst. 123; 2681-6.
Vanden Bussche J, Noppea H, Verheydena K, Willea K, Pinelb G, Le Bizecb B, De Brabandera HF. Analysis of thyreostats: A history of 35 years. Anal Chim Acta. Article in Press, Corrected Proof. Available online 29 August 2008.
Vroomen LH, van Bladeren PJ, Groten JP, Wissink CJ, Kuiper HA, Berghmans MC (1990) In vivo and in vitro metabolic studies of furazolidone: a risk evaluation. Drug Metabol Rev. 22; 663-76.
Wallerstein RO, Condit PK, Kasper CK, Brown JW, Morrison FR. (1969) Statewide study of chloramphenicol therapy and fatal aplastic anemia. JAMA. 208 (11); 2045-50.
Wallis CJ. (1993) Salbutamol, salmeterol-A chemist’s perspective. Actual Chim Ther. 20; 265-91.
Wentzell B, Mccalla DR. (1980) Formation and excision of nitrofuran-dna adducts in Escherichia-Coli. Chem Biol Interact. 31; 133-50.
Werner R. (2005)In: A massage therapist’s guide to Pathology. 3rd edition. Lippincott William & Wilkins, Pennsylvania USA.
Wilson JD, Griffin JE. (1980) The use and misuse of androgens. Metabolism. 29 (12); 1278-95.
Wilson VS, Lambright C, Ostby J, Gray LE. (2002) In vitro and in vivo effects of 17beta-trenbolone: a feedlot effluent contaminant. Toxicol Sci. 70 (2); 202-11.
Wong K, Boheler KR, Bishop J, Petrou M, Yacoub MH. (1998) Clenbuterol induces cardiac hypertrophy with normal functional, morphological and molecular features. Cardiovasc Res. 37 (1); 115-22.
170

Yager JD, Zurlo J, Sewall CH, Lucier GW, He H. (1994) Growth stimulation followed by growth inhibition in livers of female rats treated with ethinyl estradiol. Carcinogenesis. 15 (10); 2117-23.
Yunis A. (1988) Chloramphenicol: Relation of Structure to Activity and Toxicity. Annu Rev Pharmacol Toxicol. 28; 83-100.
Yuri T, Nikaido Y, Shimano N, Uehara N, Shikata N, Tsubura A. (2004) Effects of prepubertal zeranol exposure on estrogen target organs and N-methyl-N-nitrosourea-induced mammary tumorigenesis in female Sprague-Dawley rats. In Vivo. 18 (6);755-61.
Zahm SH, Blair A, Holmes FF, Boysen CD, Robel RJ, Fraumeni JF. (1989) A case-control study of soft-tissue sarcoma. Am J Epidemiol. 130 (4); 665-74.
171