air–sea interaction over the eastern pacific warm pool:...
TRANSCRIPT

VOL. 18, NO. 1 1 JANUARY 2005J O U R N A L O F C L I M A T E
q 2005 American Meteorological Society 5
Air–Sea Interaction over the Eastern Pacific Warm Pool: Gap Winds,Thermocline Dome, and Atmospheric Convection*
SHANG-PING XIE
International Pacific Research Center and Department of Meteorology, University of Hawaii at Manoa, Honolulu, Hawaii
HAIMING XU
International Pacific Research Center, University of Hawaii at Manoa, Honolulu, Hawaii
WILLIAM S. KESSLER
NOAA/Pacific Marine Environmental Laboratory, Seattle, Washington
MASAMI NONAKA
Frontier Research Center for Global Change, Yokohama, Japan
(Manuscript received 2 April 2004, in final form 5 July 2004)
ABSTRACT
High-resolution satellite observations are used to investigate air–sea interaction over the eastern Pacific warmpool. In winter, strong wind jets develop over the Gulfs of Tehuantepec, Papagayo, and Panama, accelerated bythe pressure gradients between the Atlantic and Pacific across narrow passes of Central American cordillera.Patches of cold sea surface temperatures (SSTs) and high chlorophyll develop under these wind jets as a resultof increased turbulent heat flux from the ocean and enhanced mixing across the base of the ocean mixed layer.Despite a large decrease in SST (exceeding 38C in seasonal means), the cold patches associated with theTehuantepec and Papagayo jets do not have an obvious effect on local atmospheric convection in winter sincethe intertropical convergence zone (ITCZ) is located farther south. The cold patch of the Panama jet to thesouth, on the other hand, cuts through the winter ITCZ and breaks it into two parts.
A pronounced thermocline dome develops west of the Gulf of Papagayo, with the 208C isotherm only 30 mdeep throughout the year. In summer when the Panama jet disappears and the other two wind jets weaken, SSTis 0.58C lower over this Costa Rica Dome than the background. This cold spot reduces local precipitation byhalf, punching a hole of 500 km in diameter in the summer ITCZ. The dome underlies a patch of open-oceanhigh chlorophyll. This thermocline dome is an ocean dynamic response to the positive wind curls south of thePapagayo jet, which is optimally oriented to excite ocean Rossby waves that remotely affect the ocean to thewest. The meridionally oriented Tehuantepec and Panama jets, by contrast, only influence the local thermoclinedepth with few remote effects on SST and the atmosphere. The orographical-triggered air–sea interaction de-scribed here is a good benchmark for testing high-resolution climate models now under development.
1. Introduction
The ocean–atmosphere system over the eastern trop-ical Pacific displays large north–south asymmetry withrespect to the equator. While surface water on and south
* International Pacific Research Contribution Number 288, Schoolof Ocean and Earth Science and Technology Contribution Number6453, and Pacific Marine Environmental Laboratory ContributionNumber 2677.
Corresponding author address: Shang-Ping Xie, International Pa-cific Research Center, SOEST, University of Hawaii at Manoa, Hon-olulu, HI 96822.E-mail: [email protected]
of the equator remains below 268C year-round, sea sur-face temperature (SST) to the north off the coast ofCentral America is mostly above 278C, a region wehereafter refer to as the eastern Pacific warm pool. Thewarm pool is bounded on the south by a sharp SST frontslightly north of the equator that separates the equatorialcold tongue from the warm water to the north. Deepatmospheric convection with heavy precipitation is gen-erally confined to the north of this equatorial front, withdry conditions prevailing on and south of the equator.This region of strong atmospheric convection is calledthe intertropical convergence zone (ITCZ), onto whichthe southeast and northeast trades converge. This cli-matic asymmetry between north and south of the equatorresults from air–sea interaction triggered by latitudinal

6 VOLUME 18J O U R N A L O F C L I M A T E
FIG. 1. (a) Wind jets over the Gulfs of Tehuantepec (T), Papagayo (PP), and Panama (PN) in the QuikSCAT surface wind velocity (ms21) climatology for Jan. (b) Longitude–time section of wind velocity (u, y) and scalar speed (contours; shade . 7 m s21) at 118N (Papagayogap). Latitude–time sections of wind velocity and scalar speed (contours; shade . 7 m s21) (c) at 958W (Tehuantepec gap), and (d) at 818W(Panama gap). In (a) the light and dark shades denote topography greater than 500 and 1000 m, respectively.
asymmetries in continental geometry (see Xie 2004a fora recent review). The eastern Pacific warm pool is cli-matically important, supporting one of the major con-vection centers of the global atmosphere (Mitchell andWallace 1992; Wang and Enfield 2003). Hurricanes thatoriginate there travel northwestward, some reaching Ha-waii, 6000 km away.
The continents on the eastern boundary of the Pacificare also highly asymmetrical. The steep and high Andesseparate the Pacific lower troposphere from that of theSouth American continent and the Atlantic while amountain range runs through the narrow Central Amer-ican land bridge as an extension of the Sierra MadreOccidental from North America. This Central Americancordillera is about 1 km high on average, blocking low-level airflow from the Caribbean Sea. Three major gapspenetrate this mountain range: at the isthmus of Te-
huantepec, over Lake Nicaragua, and at Panama (Fig.1a). In boreal winter, sea level pressure is often higherover the Caribbean and Gulf of Mexico than on thePacific side, forcing strong wind jets through these gapsand over the eastern Pacific warm pool. On synoptictime scales, these gap wind events may occur in se-quence or independently (Chelton et al. 2000). Therehave been many studies on the wind jet over the Gulfof Tehuantepec during the boreal winter. Steenburgh etal.’s (1998) model simulation shows that during thesehigh-wind events, strong pressure gradients between theAtlantic and Pacific accelerate the winds to high speedsalong the narrow mountain passes. After leaving thecoast, air trajectories tend to follow anticyclonic arcs,which Clarke (1988) suggests are inertial flow nearlyfree of pressure gradient force. In Steenburgh et al.’s(1998) model, the Atlantic air mass, with cold temper-

1 JANUARY 2005 7X I E E T A L .
atures and high sea level pressure, penetrates a few hun-dred kilometers over the Gulf of Tehuantepec, and thesepressure anomalies significantly modify the trajectoriesand cause them to deviate from the inertial circle. Acloud arc sometimes forms along the cold front andadvances offshore with the cold surge over the Gulf ofTehuantepec (Schultz et al. 1997), perhaps due to theupward motion associated with gravity currents.
Figure 1a shows the January surface wind velocityaveraged for 2000–03. The Tehuantepec jet is clearlyvisible in this climatological wind map, and so are twoother wind jets to the south (the Papagayo and Panamajets hereafter). Wind speeds are typically 10 m s21 inthese climatological wind jets while winds lee of themountain range are one order of magnitude weaker. Thewind jets extend a few hundred kilometers offshore,with the Tehuantepec and Papagayo jets eventuallymerging into the Pacific northeast trades. The Tehuan-tepec and Panama jets are oriented roughly in the north–south direction while the Papagayo jet takes a nearlyzonal orientation. As will become clear, this differencein the jet orientation results in distinct subsurface oceanresponse to these wind jets.
These wind jets are strongest during boreal winter,and exert a strong influence on the surface ocean, asreadily seen from satellite infrared observations (Clarke1988; Legeckis 1988; Barton et al. 1993). It is quitecommon for SST near these wind jets to drop by severaldegrees during a strong wind surge event, due to inten-sified surface turbulent heat flux and entrainment. Overthe eastern Pacific warm pool east of 958W, the ther-mocline is less than 50 m deep. Strong wind stirringtogether with surface heat flux cooling is thus very ef-fective in entraining cold thermocline water into thesurface mixed layer. Besides the SST decreases, en-hanced entrainment also gives rise to increased biolog-ical activity beneath these wind jets in winter (Fiedler2002 and references therein).
Strong wind curl associated with the wind jets createrich structures in the thermocline over the eastern Pacificwarm pool, which have been attributed to several dy-namical mechanisms (Hofmann et al. 1981; McCrearyet al. 1989; Umatani and Yamagata 1991; Kessler 2002).In particular, the Costa Rica Dome in the thermoclineis a permanent cyclonic eddy, which is centered at 98N,908W and expands seasonally to the west in boreal sum-mer. In the Costa Rica Dome, the 208C isotherm is veryclose to the sea surface, only 30 m deep on long-termmean. The upwelling and mixing in this thermoclinedome make it rich in nutrients, supporting a rich fisheryand attracting marine mammals such as blue whales andcommon dolphins (Fiedler 2002). Kessler (2002) esti-mates a 3.5 Sv (1 Sv [ 106 m3 s21) mean upwellingin the Costa Rica Dome and suggests that it is an im-portant element of the Pacific intermediate-water cir-culation. McCreary et al. (2002) argue based on oceanmodel experiments that this upwelling drives an east-ward subsurface jet north of the equator—the Tsuchiya
jet—that is associated with a strong potential vorticityfront in the thermocline. See Kessler (2004, hereafterKES) for a recent review of eastern Pacific Ocean cir-culation.
The present study investigates the climatic effects ofthese Central American gap winds. These winds imprinton winter SST as cold patches over the otherwise warmwater from 58–158N. Kessler (2002) further notes an‘‘isolated cool spot near 98N, 908W’’ (e.g., Fig. 4) inannual-mean SST that ‘‘marks the surface expression ofthe Costa Rica Dome.’’ It is unclear, however, whetherthis cold spot results exclusively from the gap windeffect in winter or if such an SST expression of theDome is seen in other seasons as well. While there areseveral studies of the gap wind effect on the ocean, toour knowledge, the feedback of gap wind–induced SSTchanges on the atmosphere has not been discussed inthe literature. Given high background SSTs over theeastern Pacific warm pool that exceed the convectivethreshold (;278C), cold spots induced by gap windswould conceivably suppress local convection. Thecoarse spatial resolution of rainfall estimates based onspaceborne infrared remote sensing makes it difficult todetect such signatures. For example, the widely usedClimate Prediction Center (CPC) Merged Analysis ofPrecipitation (CMAP) product (Xie and Arkin 1996) hasa resolution of 2.58, the same scale as the cold spots inthe eastern Pacific warm pool.
The present study takes advantage of recent obser-vations by spaceborne microwave instruments to ex-amine the gap wind–induced air–sea interaction overthe eastern Pacific warm pool, including the ocean-to-atmospheric feedback. These microwave observationsallow a more direct inference of rainfall and at higherresolution than infrared sensing, and measure SST near-ly free of clouds. Unlike many previous studies on syn-optic wind events, our focus is on monthly and seasonaltime scales. Specific questions we would like to addressare: How do these winds force variations in SST andthe subsurface ocean? Does the shallow thermocline ofthe Costa Rica Dome have a significant effect on SST?Do these SST signatures of gap winds influence at-mospheric convection and does this influence vary withseason? The first question has been considered to somedegree in previous studies, but new satellite observa-tions of the ocean and atmosphere now allow us tosynthesize various aspects and gain a physically con-sistent picture of this air–sea interaction. Our analysisshows that in boreal summer when the gap winds areweak, the shallow thermocline of the Costa Rica Domemaintains a cold spot, which in turn suppresses localatmospheric convection. Somewhat surprisingly, theocean-to-atmospheric feedback is less clear in borealwinter despite strong gap winds at that time.
The rest of the paper is organized as follows. Section2 describes the datasets. Section 3 presents the results,and section 4 is a summary.

8 VOLUME 18J O U R N A L O F C L I M A T E
2. Data
This study analyzes a suite of satellite observationsof SST, sea surface height (SSH), sea surface wind, andchlorophyll by several different sensors on differentplatforms. These new satellite observations offer a viewof the oceans and the overlying atmosphere in detailnever possible before, stimulating a recent flurry of air–sea interaction studies (see Xie 2004b for a recent re-view, and references therein).
The Tropical Rainfall Measuring Mission (TRMM)satellite’s Microwave Imager (TMI) can measure SSTnearly through clouds over the global Tropics within388N/S. This microwave remote sensing substantiallyimproves the sampling of SST over cloudy regions likethe eastern Pacific warm pool. TMI also measures rainrate. We use a monthly TMI product available fromJanuary 1998 to December 2003 on a 0.258 grid (Wentzet al. 2000). There are considerable uncertainties inquantitative rainfall estimates using satellite observa-tions. Here we limit ourselves to a qualitative discussionof spatial variations in rainfall in response to gap windsand solar seasonal cycle. We will compare this TMIproduct with other independent measurements of rainfallon board TRMM. On a 0.58 grid, the 3A25G2 productis based on the precipitation radar (PR) observations.The PR makes the best estimate of precipitation but itsnarrow swath introduces larger sampling errors for cli-matological averages. On a 18 grid, the 3B43 productcombines infrared observations by TRMM and geosta-tionary satellites and rain gauges, which is an indirectinference of rainfall over the ocean but enjoys goodsampling and coverage. The PR and infrared productsprovide rainfall over both land and ocean while the TMIproduct is limited to the open ocean.
The microwave scatterometer on the National Aero-nautics and Space Administration’s Quick Scatterometer(QuikSCAT) satellite measures daily surface wind ve-locity over the world ocean (Liu et al. 2000). QuikSCATobservations have revealed rich wind structures on shortspatial scales around the world (Chelton et al. 2004).We use a monthly product for wind velocity for August1999–December 2003 on a 0.258 grid. Pseudo–windstress is constructed from the QuikSCAT daily neutralwind velocity product.
The Sea-viewing Wide Field-of-view Sensor(SeaWiFS) satellite measures ocean color and chloro-phyll concentration from October 1997 to November2003, which are often a good indicator of ocean up-welling. We use monthly averages on a 0.258 grid.
The upper-thermocline depth, when shallow, can haveimportant effects on SST. We use the 208C isothermdepth based on a monthly ocean temperature climatol-ogy on a 18 3 18 grid, which is derived from historicalexpendable bathythermograph (XBT) observations.Most temperature profiles were during 1979 through1992, and a smaller number of profiles after that dateare also used in constructing the climatology. This XBT
climatology compares quite well with independent SSTobservations. See Kessler (2002) for a detailed descrip-tion of this dataset.
Altimeters on the European Remote Sensing (ERS)and TOPEX/Poseidon (T/P) satellites measure SSH de-viations from its long-term mean at their nadir. Thereis a trade-off between spatial and temporal resolution:T/P has a 10-day repeat orbit with a wide zonal spacingbetween ground tracks, while ERS has a 35-day repeatorbit with a small track spacing. We use a merged SSHdataset that takes advantage of both T/P’s high temporaland ERS’s high spatial resolutions (Ducet et al. 2000),available from October 1992 to July 2001 on a 0.258grid. We use this merged SSH dataset to infer the sea-sonal cycle in thermocline depth.
Monthly climatologies are constructed for TRMMSST and rainfall, QuikSCAT surface wind velocity/stress, merged ERS–T/P SSH, and SeaWiFS chlorophyllfor periods these observations are available. The dis-cussion that follows is limited to these multiyear cli-matologies, while submonthly and interannual variabil-ity is beyond the scope of this study. See Wang andEnfield (2003) and Chiang et al. (2000) for recent stud-ies of interannual variability over the region and itseffect on the Atlantic. In general, signals to be discussedhere are well above measurements errors. We refer torelevant references earlier for satellite-data error anal-ysis. For our analysis, we use several independent mea-surements, which turn out to yield mutually corrobo-rating and physically consistent results. Such physicalconsistency gives us confidence in the results.
3. Results
a. Wind jets
In the paper, we discuss the Central American windjets based on the monthly mean climatology, althoughthere is considerable variability on the synoptic timescales (Chelton et al. 2000). Our use of monthly cli-matology is based on the linear assumption that the low-frequency forcing drives the low-frequency ocean cir-culation (KES). During winter, all three jets are welldeveloped on the Pacific side of the major mountainpasses (Fig. 1). By contrast, winds are generally low inthe lee of the Central American mountains with ele-vations above 1 km.
While previous studies have focused principally onthe winter jets, Fig. 1 shows the full seasonal cycle ofthese wind jets along the longitude or latitude wheretheir axes leave the coast. The Tehuantepec jet is stron-gest during October–February, but a weaker northerlywind jet remains visible in summer over the Gulf ofTehuantepec. The Papagayo and Panama jets displayslightly different seasonality, peaking in December–April. While the Panama jet ceases to occur after April,the Tehuantepec and Papagayo jets persist in othermonths with reduced speeds. The Papagayo jet disap-

1 JANUARY 2005 9X I E E T A L .
FIG. 2. Time–latitude section of climatological SST (black contoursin 8C); surface wind vectors (m s21), based on COADS; and CMAPprecipitation (white contours at 5 mm day21 intervals; shade . 2.5mm day21), all zonally averaged in 1208–1158W.
pears altogether only in September, the time the Te-huantepec jet is also at its minimum. Both the Tehuan-tepec and Papagayo jets show a secondary peak duringJuly–August, which may be associated with the mid-summer drought over southern Mexico and CentralAmerica (Fig. 8 of Magana et al. 1999).
In the following, we will display several figures in acommon format for easy comparison among various ob-servations. Each figure has three parts for annual, Jan-uary–April, and July–October means, respectively. Jan-uary–April are months when the ITCZ is close to theequator (Fig. 2) and all three wind jets are reasonablystrong. The ITCZ moves to its northernmost latitudesduring July–October. Figure 2 includes surface windvectors based on the Comprehensive Ocean–Atmo-sphere Dataset (COADS).
Figure 3 shows the wind stress vectors and Ekmanpumping velocity, we 5 curl(t/ fr), where t is the windstress vector, f the Coriolis parameter and r the waterdensity. While winds are easterly to northeasterly year-round over the Caribbean, large seasonal variations inwinds are seen over the eastern Pacific warm pool.There, the northeast trades prevail, converging onto theITCZ at 58N in winter, but vector winds are weak northof 108N under the ITCZ in summer. The seasonal shiftsin winds are particularly large between 58–108N, re-versing from northeasterly in winter to southwesterly insummer as the ITCZ migrates with the sun. (The zonalband of upward Ekman pumping is generally collocatedwith the ITCZ that maintains positive vorticity of thesurface flow.) As shown in Fig. 3, the Tehuantepec andPapagayo jets remain clearly visible in summer, al-though considerably weaker in both speed and offshoreextent than in winter. In summer, there is no evidence
for climatological gap winds off Panama; instead, windsconverge onto the warm continent from the ocean onboth sides.
b. Effect on thermocline depth
A dipole wind-curl pattern is associated with each ofthe gap wind jets (Fig. 3). While the speed of the Pa-pagayo jet decreases by half from winter to summer,surprisingly, the Ekman upwelling west of Papagayo isstrong year-round. This occurs because the shear re-mains strong in summer between the weak Papagayojet and the southwesterlies to the south that convergetoward the Central American land bridge. As a result,the strongest annual-mean upwelling over the entireeastern Pacific warm pool is found south of the Papa-gayo gap rather than over the Gulf of Tehuantepec. Kes-sler’s (2002) calculations show that the observed ther-mocline topography is consistent with forcing by Ekmanpumping according to linear Sverdrup dynamics. In-deed, the Ekman upwelling band southeast of the Pa-pagayo jet axis forces a zonal band of shallow ther-mocline extending west along 68–128N (Fig. 4a). At thecenter of this Costa Rica Dome, the 208C isotherm isonly 30 m deep. The 208C isotherm tracks the tightlypacked thermocline quite well in this region (Fig. 5).In the zonal direction, this thermocline dome is highlyasymmetric. The thermocline shoals rapidly from theCentral American coast to 908W under the strong Ekmanpumping associated with the Papagayo wind jet, anddeepens slowly to the west where the Ekman pumpingnearly vanishes. In the meridional direction, the 208Cisotherm is equally shallow at the Costa Rica Dome asin the equatorial upwelling zone.
The thermocline topography and Ekman pumping arerelated by the Sverdrup relation:
x2fh 2 h 5 2 w dx, (1)E E eg9Hb xE
where h is the thermocline depth deviation from its meanvalue H, the subscript E denotes values at the easternboundary, g9 is the reduced gravity, b the meridionalderivative of the Coriolis parameter, and x is the lon-gitudinal coordinate (positive eastward). Here we haveused a 1.5-layer model [Kessler (2002) discusses thelimitations of such a model for the eastern tropical Pa-cific]. For a zonally oriented band of Ekman upwellinglike the one associated with the Papagayo jet, its effectaccumulates in the zonal integral and produces a largeresponse in the thermocline depth to the west (Fig. 4).This is the main mechanism for the generation of theCosta Rica Dome (Kessler 2002).
The orientation of a wind jet is very important for itseffect on thermocline topography. In contrast to the zon-ally oriented Papagayo jet, consider a meridional windjet that is symmetric about its axis (i.e., ignore the an-ticyclonic inertial turning). In this case, the zonal in-tegral in Eq. (1) sums the contributions across both sides

10 VOLUME 18J O U R N A L O F C L I M A T E
FIG. 3. QuikSCAT pseudo–wind stress (vectors in m2 s22) and Ekman pumping velocity (shade in 1026 m s21)climatology: (a) annual mean, (b) Jan–Apr, and (c) Jul–Oct. Land orography (km) is plotted in color shading.
of the meridionally oriented wind-curl dipole, so its neteffect on the thermocline cancels at longitudes suffi-ciently far from the wind jet. Physically, this representsthe westward propagation of Rossby waves across forc-ing regions of opposite signs. Thus, the thermocline
depth decrease produced by the Tehuantepec upwellingon the eastern flank of the jet is visible but highly lo-calized, not fully developed in strength and spatial ex-tent because of the opposing forcing by the negativevorticity on the western flank of the jet. A close in-

1 JANUARY 2005 11X I E E T A L .
FIG. 4. Climatology of SST (contours at intervals of 0.58C) and the 208C isotherm depth(color in m): (a) Annual mean, (b) Jan–Apr, and (c) Jul–Oct.
spection indicates that the Tehuantepec jet curl becomesasymmetric as it extends southward: the Ekman down-welling on the west becomes greater than the upwellingto the east (Figs. 3a,b), likely an effect of earth rotationon the jet (Clarke 1988; Steenburgh et al. 1998). This
stronger downwelling of the Tehuantepec jet, helped bythe downwelling of the background (especially in win-ter), forces a thermocline bowl centered at 138N, 1078W(Fig. 4b; KES). It is unclear what determines the ori-entation of a wind jet, but the geometry of the mountain

12 VOLUME 18J O U R N A L O F C L I M A T E
FIG. 5. Mean ocean temperature (8C) along (a) 8.58N and(b) 908W.
FIG. 6. Jan–Mar climatology: QuikSCAT pseudo–wind stress (vec-tors; m2 s22): (top) TMI SST (8C) and (bottom) SeaWiFS chlorophyllin natural logarithm (mg m23).
pass seems to be an important factor. While the passnorth of Tehuantepec favors a northerly wind jet, thePapagayo pass allows winds to accelerate only in thezonal direction, leading to a strong thermocline responsethat extends well to the west.
c. Effect on SST
In winter, intense cooling induced by the wind jetsleaves marked signatures on the SST field. Under eachof these wind jets is a band of cold water with SST wellbelow 278C (Fig. 6a) due to increased surface heat fluxand vertical mixing. This wind-induced decrease is sostrong that the minimum SST is less than 258C in thismultiseason-average map, against background SSTs of288C or above in the warm pool. The SST minima areroughly aligned with the axes of wind jets, trailing themountain passes over a long distance. The thermoclinetopography appears to also be an important factor forthe SST decrease, and although a quantitative heat bal-ance is beyond the scope of this paper, some conclusionsabout the importance of surface heat fluxes versus stir-ring from the shallow thermocline can be drawn. Notethat the Papagayo cold patch is roughly collocated withthe thermocline ridge and extends 1000 km offshorewhile the Tehuantepec cold patch extends only half asfar because its upwelled thermocline is confined closerto the coast (Fig. 4b). Also, the coldest SST appears tobe found slightly offshore (Fig. 4), as the thermoclineshoals (Fig. 5a), not precisely under the strongest winds
at the coast. The strong entrainment made possible bystrong winds and a shallow thermocline is further man-ifested in a tongue of high chlorophyll concentrationsas observed by the SeaWiFS satellite over each of theTehuantepec, Papagayo, and Panama jets (Fig. 6b). Inwinter, the shallow thermocline in the Costa Rica Domeand off the coast of South America, which is itself aresponse to the vorticity forcing by the Papagayo andPanama jets, aids the wind-induced cooling. The SSTminimum and the thermocline depth minimum areroughly collocated over these two cold patches (Fig.4b), allowing them to extend far offshore.
While the cold patches in the annual-mean SST mapare dominated by the winter cooling, there are also sig-nificant features in summer SST. The summer SST dis-tribution in the warm pool is very different from thatin winter (Fig. 4). SST contours are zonally orientedsouth of 108N and become somewhat parallel to thecoast near Central America. A weak cold wedge de-velops offshore of the Gulfs of Tehuantepec and Pa-pagayo. The cooling over the Gulf of Tehuantepec seemsa weaker echo of its stronger counterpart in winter, butthe cooling off Papagayo extends much farther offshorethan the wind jet (Fig. 3c), suggesting the importanceof the shallow thermocline and resulting entrainment,rather than the effect of surface heat flux, for the open-ocean cooling in summer. At and south of 108N, summer

1 JANUARY 2005 13X I E E T A L .
FIG. 7. SeaWiFS chlorophyll in natural logarithm (shade; mg m23) and 208C isothermal depth(contours; m) climatology for Jul–Oct.
cooling is located at the peak of the Costa Rica Dome(Fig. 4c), where the ocean mixed layer is only about 10m deep (Fig. 5) and the 208C isotherm is shallower than30 m. The doming thermocline there allows cold waterto be upwelled or easily entrained into the mixed layer.Further west, the thermocline deepens and summer SSTcan warm (Fig. 4c). However, high chlorophyll activityin summer is organized into a zonal patch centered at98N extending 108 in longitude and 58 in latitude, closelycollocated within the 40-m depth contour of the 208Cisotherm (Fig. 7). The difference between the patternsof SST and chlorophyll suggests that the high chloro-phyll in the western Costa Rica Dome is due to bio-logical activity below the surface mixed layer, which isshallow enough to receive sufficient sunlight for pho-tosynthesis, but too deep to easily entrain cool water tothe surface. In situ observations are necessary to testthis hypothesis.
d. SST feedback on atmosphere
With the wind jets strongest and the SST featuresmost sharply defined in winter (Fig. 6a), one might ex-pect that their effects on atmospheric convectionthrough the cold SST patches would also be strongestin winter. This is true for the Panama jet; the cold patchit induced suppresses atmospheric convection, givingrise to a band of local minimum in precipitation (Fig.8b). However, the Tehuantepec and Papagayo jets andassociated cold patches have little effect on winter pre-cipitation because they are located in a dry region northof the ITCZ. West of about 1108W, the winter ITCZ isroughly collocated with the high SST band, but furthereast it is kept south of 78N and consistently displaced
to the southern boundary of the eastern Pacific warmpool1 (Fig. 8b).
In boreal summer, the ITCZ takes a more northerlyposition, occupying a large latitudinal band between 78and 158N that includes the cold patch over the CostaRica Dome (Fig. 8c). Within this broad ITCZ, there isa hole of precipitation deficit over the cold spot on topof the Costa Rica Dome. This hole in the ITCZ is over500 km in diameter with a 50% drop in precipitation(5 mm day21 in the hole versus 10 mm day21 for thebackground). Below the dry hole, SST reaches a min-imum in the zonal direction, suggesting that the coldspot forces the rainfall deficit. If we assume that cloud-iness is roughly proportional to precipitation in this re-gion of deep convection, the increased solar radiationunder the dry hole is a negative feedback that acts todampen the cold spot in SST, further supporting thenotion that the thermocline dome maintains both thecold spot and hole in the ITCZ.
The weak summer jet off Tehuantepec leaves smallbut visible signatures in both SST and chlorophyll, butapparently not in precipitation. Probably this is becausethe SST remains above 28.58C under the weak summerjet (Fig. 8b). Neither the Tehuantepec nor Panama jetshave much effect on the thermocline depth in summer.The Costa Rica Dome, by contrast, is strong year-round.This permanent thermocline dome is a result of up-welling curl associated in winter with the Papagayo jet,
1 In winter, as the prevailing easterly trades impinge on the CentralAmerican mountains, orographic downdraft suppresses convectionoff the Pacific coast, displacing the ITCZ away from the bulk of thewarm pool. Numerical experiments using the model described in theappendix indicate that this effect of the broad mountain range con-ceals the effect of shorter-scale gap winds on convection off Te-huantepec and Papagayo in winter (Xu et al. 2004b, manuscript sub-mitted to J. Climate).

14 VOLUME 18J O U R N A L O F C L I M A T E
FIG. 8. TMI SST (contours; 8C) and precipitation (shade; mm day21) climatology: (a) annualmean, (b) Jan–Apr, and (c) Jul–Oct. In (c), note the different color scale for summer.
helped by its orientation that efficiently excites the ther-mocline response, and in summer, additionally by thepositive curl of the ITCZ. As a result, SST over theCosta Rica Dome remains below 28.58C throughout theseasonal cycle (Fig. 8), which inhibits atmospheric con-vection when the ITCZ moves overhead in summer.Although the winter Papagayo jet does not have a directeffect on winter atmospheric convection, its curl makesan important contribution to maintaining the robust ther-mocline dome that persists throughout the year. If notfor the winter jet, the Ekman upwelling would be onlya result of the ITCZ, and thus would be in phase with
the precipitation, as it is west of 908W (Figs. 12a,c);cool SST due to entrainment would lag precipitation by908 and have only a small, delayed effect. Thus, thecold spot and the collocated rainfall deficit in summermay be viewed as partly resulting from the winter forc-ing through the ocean memory in the form of the CostaRica Dome.
In September, the climatological Papagayo jet dis-appears altogether, with winds directed onshore insteadof offshore (Figs. 9a and 12a show that the onshorewinds last only about 1 month). The curl, however, re-mains weakly positive (Fig. 12a). Thus the September
1 JANUARY 2005 15X I E E T A L .
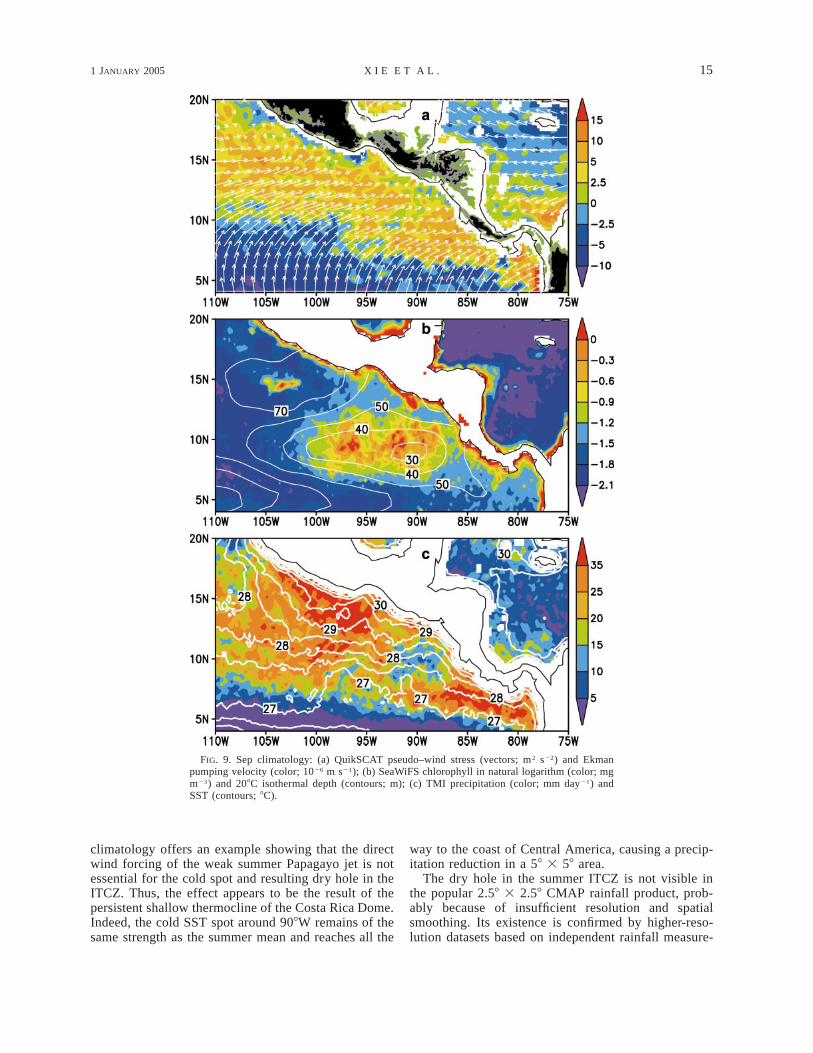
FIG. 9. Sep climatology: (a) QuikSCAT pseudo–wind stress (vectors; m2 s22) and Ekmanpumping velocity (color; 1026 m s21); (b) SeaWiFS chlorophyll in natural logarithm (color; mgm23) and 208C isothermal depth (contours; m); (c) TMI precipitation (color; mm day21) andSST (contours; 8C).
climatology offers an example showing that the directwind forcing of the weak summer Papagayo jet is notessential for the cold spot and resulting dry hole in theITCZ. Thus, the effect appears to be the result of thepersistent shallow thermocline of the Costa Rica Dome.Indeed, the cold SST spot around 908W remains of thesame strength as the summer mean and reaches all the
way to the coast of Central America, causing a precip-itation reduction in a 58 3 58 area.
The dry hole in the summer ITCZ is not visible inthe popular 2.58 3 2.58 CMAP rainfall product, prob-ably because of insufficient resolution and spatialsmoothing. Its existence is confirmed by higher-reso-lution datasets based on independent rainfall measure-

16 VOLUME 18J O U R N A L O F C L I M A T E
FIG. 10. Jul–Oct precipitation (mm month21) based on the (top) TRMM PR (3A25G2) and (bottom)infrared (3B43) measurements.
FIG. 11. Precipitation (mm day21) in a regional atmospheric model,averaged for Aug 1999.
ments by the TRMM PR and infrared (IR) instrumentson the TRMM and geostationary satellites (Fig. 10).While noisy, the PR observations show increased rain-fall on the coast, suggesting that direct orographic originof this dry hole over the open ocean is unlikely. De-graded in spatial resolution but with excellent sampling,IR measurements reaffirm that this hole of rainfall deficitis found offshore roughly collocated with the Costa Rica
Dome. Rainfall maxima near the coast of Central andnorthwestern South America may be influenced by thediurnal land/sea breeze, in which orography plays a role(e.g., Mapes et al. 2003).
To test the effect of orography, we carried out a high-resolution simulation with a regional atmospheric modelbriefly described in the appendix. Figure 11 shows thesimulated rainfall for August 1999. While the simulatedITCZ is too thick in its meridional width west of 1058W,the model captures the salient features of the observedsummer rainfall pattern. In particular, pronounced rain-fall deficits are found over the open ocean near the CostaRica Dome. This hole of rainfall deficit remains in anadditional experiment in which the land orography onCentral American is removed and set uniformly at 0.5m above the sea level. Thus, the dry hole in the ITCZmust be due to the cold spot maintained by the persistentshallow thermocline of the Costa Rica Dome.
The ITCZ is twice as strong in summer as in winterin terms of precipitation over the eastern Pacific (notethe difference in color scale between Figs. 8a,b and 8c).As a result, the annual-mean rainfall distribution bearsa strong resemblance to the summer distribution (Fig.8a). The annual-mean ITCZ is broad west of 958W, oc-cupying a latitudinal band of 58–138N. East of 958W, it

1 JANUARY 2005 17X I E E T A L .
FIG. 12. Longitude–time sections averaged between 98 and 118N: (a) wind velocity (m s21) and Ekman pumping velocity (shade; 1026 ms21); (b) chlorophyll in natural logarithm (color; mg m23) and merged sea level height (contours; cm); (c) TMI precipitation (shade; mmday21) and SST (contours; 8C).
narrows with the axis trending south into the Gulf ofPanama (Fig. 8a). The summer Costa Rica Dome effectleaves a clear mark in the annual-mean field that appearsas a region of minimum rainfall off Papagayo. In con-trast to the strong summer effect on annual-mean rain-fall, the annual-mean SST resembles the winter fieldfeaturing all three cool patches off Tehuantepec, Pa-pagayo, and Panama. This difference in seasonal weightbetween SST and precipitation illustrates the importanceof analysis at seasonal or finer resolution in time—onthe annual mean map. (Fig. 8a), cold patches do notalways lead to suppressed convection over the easternPacific warm pool.
e. Seasonal cycle
Having discussed seasonal-mean climate in summerand winter, we now describe the full seasonal cyclealong 108N (Fig. 12), a latitude that cuts through theCosta Rica Dome. SSH and thermocline depth are re-lated by SSH 5 g9h/g in a 1.5-layer model (g is thegravity at the earth’s surface), and we will use terms ofSSH and thermocline depth interchangeably here. Weuse SSH to describe thermocline depth variations be-cause it is better sampled with satellite observations.The 208C isotherm shows a similar seasonal cycle, albeitsmoother in space and time (not shown).
The positive curls off Papagayo are strong nearlyyear-round and are responsible for the permanent ther-mocline dome to the west. The gap winds vanish inSeptember and October (Fig. 12a) when the AtlanticITCZ takes its northernmost position, relaxing the pres-sure gradient across Central America. The seasonal cy-cle in thermocline depth behaves differently east and
west of 908W, which is where SSH variance is at itszonal minimum. East of 908W, the strong wind jet andits curl force the thermocline to shoal in winter; thenthe near-shore thermocline deepens in summer as thegap winds weaken. Wind curls display a seasonal cycleof an opposite phase west of 908W, negative in winterwhen the ITCZ is to the south and positive in summerwhen the ITCZ is overhead. The latent heat release byITCZ convection generates positive vorticity in the low-er troposphere, which in turn forces an Ekman suctionthat lifts the thermocline. While the Ekman pumpingvariation is more or less stationary in space, the ther-mocline response displays a clear westward propagationindicative of Rossby waves (Fig. 12b). West of 908W,the thermocline deepens during the first half of the yearand shoals during the second half. Because of the op-posite phasing in Ekman pumping variations to its eastand west, the center of the Costa Rica Dome at 908Wexperiences little seasonal variations. A 1.5-layer linearreduced-gravity model simulates this observed annualcycle in SSH rather well (not shown), suggesting thatthese simple wave dynamics dominate the seasonal timescale (KES).
In winter, the cold patch induced directly by the strongPapagayo jet cuts through 108N at 888W. This cold patchstarts to develop in October, reaches a maximum inFebruary, and persists through April (Fig. 12c). In May,the summer regime begins to take over, with SST reach-ing its seasonal maximum and the ITCZ covering thislatitude, but SST over the dome is still cooler than eitherto the east or west (Fig. 12c). During the summer, thereis a weak but persistent minimum in SST around 908W,the center of the Costa Rica Dome. A region of reduced

18 VOLUME 18J O U R N A L O F C L I M A T E
rainfall is roughly collocated with the region of SSTminimum during May–October. The rainfall deficit overthe Costa Rica Dome is especially large in July andAugust, with values less than half of that at 1008W. Overthe dome, precipitation reaches a local minimum in timeduring July–August, suggesting that the shoaling ther-mocline and its cooling effect may play a role in creatingthe midsummer drought reported in Magana et al.(1999).
The seasonal variations in chlorophyll are quite com-plicated but generally follow the thermocline depth var-iations with a lag of 0–2 months (Fig. 12b). At the centerof the Costa Rica Dome (908W) SeaWiFS chlorophyllreaches a seasonal maximum in May when SSH reachesa minimum. Further to the west, chlorophyll reaches aseasonal minimum during May–June 2 months after theSSH maximum. SSH’s control over chlorophyll varia-tions is further corroborated by their westward copro-pagation. The seasonal cycle of chlorophyll seems tobe induced not by the local Ekman pumping—the twoare roughly in quadrature in phase west of 958W. In-stead, the chlorophyll cycle is consistent with an equi-librium response to thermocline depth.
4. Summary
We have used a suite of new satellite observations tostudy air–sea interaction over the eastern Pacific warmpool. The use of these satellite observations allows usto map the covarying ocean–atmospheric structure indetail not possible before. Our analysis confirms theexistence of strong atmospheric dynamic and thermo-dynamic forcing of the ocean in winter and also revealsthat patterns of SST induced by ocean dynamics forcethe atmosphere on short spatial scales in boreal summer.In winter as the pressure difference between the tropicalnorthwestern Atlantic and northeastern Pacific buildsup, the mountains of Central America funnel strongwinds through three major passes: Tehuantepec, Papa-gayo, and Panama. The Papagayo pass, in particular,directs a westward wind jet over the Pacific. The positivewind stress curl south of this wind jet is strongest inwinter but exists almost year-round, forcing a thermo-cline dome centered about 200 km offshore (the CostaRica Dome). The thermocline depth at the center of thisdome is shallow all year, with an ocean mixed layeronly about 10 m deep. This thermocline dome allowscold water to be easily mixed into the mixed layer, giv-ing rise to a cold spot in summer SST and a collocatedpatch of high chlorophyll activity. This surface coolingat the top of the Costa Rica Dome suppresses atmo-spheric convection, opening a large hole of reduced rain-fall in the ITCZ southwest of Papagayo.
The Tehuantepec, Papagayo, and Panama wind jetsand their cooling effect on the winter SST are a well-known phenomenon. Although all three jets have pro-nounced (38C) effects on winter SST, we have shownthat the effect on precipitation is different among the
three jets, depending on their latitude with respect tothe ITCZ and its annual march, the orientation of thejets, and their correlation with upwelling curl in theITCZ itself. The Panama jet produces a gap in the winterITCZ, which is at its southernmost position when thejet is strong. The Tehuantepec jet has little effect onITCZ precipitation at any time of year because it is farto the north of the ITCZ when the jet is strong in winter,and its summer SST signature is small. The Papagayojet makes a hole in the ITCZ in summer, because per-sistent upwelling curl, combined with Rossby wave ra-diation from the strong zonally oriented winter jet,shoals the thermocline throughout the year and main-tains cool SST even in summer.
Thermocline domes are observed in other parts of theWorld Ocean, and their importance for marine biologyis well known because of their supply of nutrients. Theclimatic effect of these domes has just begun to be rec-ognized. Over these domes, cool thermocline water caneasily come into contact with the sea surface either byEkman pumping or by turbulent mixing. As a result, thethermocline depth and its variations exert a strong in-fluence in SST above the domes. In the South IndianOcean dome, for example, interannual Rossby wavesmodulate the thermocline dome at 58–108S, producingstrong variations in SST, atmospheric convection, andtropical cyclones (Xie et al. 2002; Yamagata et al. 2004;Annamalai and Murtugudde 2004). The present studyof the Costa Rica Dome provides another example ofenhanced air–sea interaction over thermocline domes.The eastern Pacific warm pool is also an important re-gion for cyclogenesis (e.g., Maloney and Hartmann2000), so the surface cooling due to the Costa RicaDome may influence the formation or pathways of east-ern Pacific hurricanes, an effect that would be worthfurther study using regional atmospheric models.
Mountains perturb airflow and commonly leave dis-tinct marks on surface winds over coastal waters or nearislands (Chelton et al. 2004). If mountains are config-ured so that orographical-induced wind-curl patches arenearly zonally oriented, ocean Rossby waves are opti-mally excited. Because the ocean adjustment is slowand subject to weak dissipation, orographical-triggeredair–sea interaction may have long-lasting effects in boththe ocean and atmosphere. The Costa Rica Dome andits effect on summer convection revealed in this study,and the long wake of the Hawaiian Islands in variousocean–atmospheric fields (Xie et al. 2001) are such ex-amples. The full extent of orographical-triggered air–sea interaction has just begun to be unraveled by satelliteobservations which have brought unprecedented spatialresolution and temporal coverage. With increasing com-puting power, global models will eventually reach suf-ficient resolutions to resolve orographic features suchas the mountain ranges of Hawaii and Central America.When they do, orographic-induced air–sea coupled phe-nomena documented here and elsewhere will serve asa benchmark for these models to reproduce. Toward this

1 JANUARY 2005 19X I E E T A L .
direction, a high-resolution coupled ocean–atmospheremodel run on Japan’s Earth Simulator is producing en-couraging results showing signs of the ocean–atmo-sphere wake of Hawaii (Sakamoto et al. 2004) and theCosta Rica Dome.
Acknowledgments. This study was initiated during thefirst author’s visit to Hokkaido University, Japan. Hewishes to thank Y. Tanimoto, H. Tokinaga, faculty andstudents at Division of Ocean and Atmospheric Sciencefor their hospitality, and J. Hafner for data processing.TMI and QuikSCAT products are obtained from RemoteSensing Systems, chlorophyll from Goddard DAAC,TRMM 3A25G2 and 3B43 products from EORC/JAXA,Japan, and SSH from the Collecte Localisation Satel-lites, France. Supported by NASA, NOAA, NSF, JapanSociety for the Promotion of Science, and Japan Agencyfor Marine–Earth Science and Technology.
APPENDIX
Atmospheric Model
A regional atmospheric model developed at the In-ternational Pacific Research Center of the University ofHawaii is used. It is a primitive equation model solvedon a longitude–latitude grid with sigma as the verticalcoordinate. Its comprehensive physical package in-cludes an E 2 « closure scheme for turbulence, cloudmicrophysics for grid-scale clouds and precipitation, amass-flux cumulus parameterization for subgrid-scaleconvection, a cloud-interactive radiation scheme, and aland surface model. See Wang et al. (2004) and Xu etal. (2004a) for a detailed description of the model andits performance over the eastern Pacific.
Here the model resolution is set at 0.258 in the hor-izontal and 28 levels in the vertical. The initial andlateral boundary conditions are constructed based on theNational Centers for Environmental Prediction–Nation-al Center for Atmospheric Research (NCEP–NCAR) re-analysis dataset (Kalnay et al. 1996). The lateral bound-ary conditions are updated 4 times daily. The surfaceboundary conditions are the weekly 18 3 18 Reynoldsand Smith (1994) SST product. The model domain cov-ers a region of 108S–27.58N, 1258–758W. Land topog-raphy is based on the United States Geological Survey(USGS) earth topography ETOPO dataset. The modelis initialized on 25 June 1999 and integrated for 3months.
REFERENCES
Annamalai, H., and R. Murtugudde, 2004: Role of the Indian Oceanin regional climate variability. Ocean–Atmosphere Interactionand Climate Variability, Geophys. Monogr., No. 147, Amer.Geophys. Union, 213–246.
Barton, W. D., and Coauthors, 1993: Supersquirt: Dynamics of theGulf of Tehuantepec, Mexico. Oceanography, 6, 23–30.
Chelton, D. B., M. H. Freilich, and S. N. Esbensen, 2000: Satelliteobservations of the wind jets off the Pacific coast of Central
America. Part I: Case studies and statistical characteristics. Mon.Wea. Rev., 128, 1993–2018.
——, M. G. Schlax, M. H. Freilich, and R. F. Milliff, 2004: Satellitemeasurements reveal persistent small-scale features in oceanwinds. Science, 303, 978–983.
Chiang, J. C. H., Y. Kushnir, and S. E. Zebiak, 2000: Interdecadalchanges in eastern Pacific ITCZ variability and its influence onthe Atlantic ITCZ. Geophys. Res. Lett., 27, 3687–3690.
Clarke, A. J., 1988: Inertial wind path and sea surface temperaturepatterns near the Gulf of Tehuantepec and the Gulf of Papagayo.J. Geophys. Res., 93, 15 491–15 501.
Ducet, N., P. Y. Le Traon, and G. Reverdin, 2000: Global high-res-olution mapping of ocean circulation from TOPEX/Poseidon andERS-1 and -2. J. Geophys. Res., 105, 19 477–19 498.
Fiedler, P. C., 2002: The annual cycle and biological effects of theCosta Rica Dome. Deep-Sea Res., 49A, 321–338.
Hofmann, E. E., A. J. Busalacchi, and J. J. O’Brien, 1981: Windgeneration of the Costa Rica Dome. Science, 214, 552–554.
Kalnay, E., and Coauthors, 1996: The NCEP/NCAR 40-Year Re-analysis Project. Bull. Amer. Meteor. Soc., 77, 437–471.
Kessler, W. S., 2002: Mean three-dimensional circulation in the north-east tropical Pacific. J. Phys. Oceanogr., 32, 2457–2471.
——, 2004: The circulation of the eastern tropical Pacific: A review.Progress in Oceanography, Pergamon, in press.
Legeckis, R., 1988: Upwelling off the Gulfs of Panama and Papagayoin the tropical Pacific during March 1985. J. Geophys. Res., 93,15 485–15 489.
Liu, W. T., X. Xie, P. S. Polito, S.-P. Xie, and H. Hashizume, 2000:Atmospheric manifestation of tropical instability waves observedby QuikSCAT and Tropical Rainfall Measuring Mission. Geo-phys. Res. Lett., 27, 2545–2548.
Magana, V., J. A. Amador, and S. Medina, 1999: The midsummerdrought over Mexico and Central America. J. Climate, 12, 1577–1588.
Maloney, E. D., and D. L. Hartmann, 2000: Modulation of easternNorth Pacific hurricanes by the Madden–Julian oscillation. J.Climate, 13, 1451–1460.
Mapes, B. E., T. T. Warner, and M. Xu, 2003: Diurnal patterns ofrainfall in northwestern South America. Part I: Background andcontext. Mon. Wea. Rev., 131, 799–812.
McCreary, J. P., H. S. Lee, and D. B. Enfield, 1989: Response of thecoastal ocean to strong offshore winds: With application to cir-culations in the Gulf of Tehuantepec and Papagayo. J. Mar. Res.,47, 81–109.
——, P. Lu, and Z. Yu, 2002: Dynamics of the Pacific subsurfacecountercurrents. J. Phys. Oceanogr., 32, 2379–2404.
Mitchell, T. P., and J. M. Wallace, 1992: The annual cycle in equatorialconvection and sea surface temperature. J. Climate, 5, 1140–1156.
Reynolds, R. W., and T. M. Smith, 1994: Improved global sea surfacetemperature analyses using optimal interpolation. J. Climate, 7,929–948.
Sakamoto, T., A. Sumi, S. Emori, T. Nishimura, H. Hasumi, T. Suzuki,and M. Kimoto, 2004: Far-reaching effects of the Hawaiian Is-lands in the CCSR/NIES/FRCGC high-resolution climate model.Geophys. Res. Lett., 31, L17212, doi:10.1029/2004GL020907.
Schultz, D. M., W. E. Bracken, L. F. Bosart, G. J. Hakim, M. A.Bedrick, M. J. Dickinson, and K. R. Tyle, 1997: The 1993 Su-perstorm cold surge: Frontal structure, gap flow, and tropicalimpact. Mon. Wea. Rev., 125, 5–39.
Steenburgh, W. J., D. M. Schultz, and B. A. Colle, 1998: The structureand evolution of gap outflow over the Gulf of Tehuantepec,Mexico. Mon. Wea. Rev., 126, 2673–2691.
Umatani, S., and T. Yamagata, 1991: Response of the eastern tropicalPacific to meridional migration of the ITCZ: The generation ofthe Costa Rica Dome. J. Phys. Oceanogr., 21, 346–363.
Wang, C., and D. B. Enfield, 2003: A further study of the tropicalWestern Hemisphere warm pool. J. Climate, 16, 1476–1493.
Wang, Y., S.-P. Xie, H. Xu, and B. Wang, 2004: Regional modelsimulations of marine boundary layer clouds over the Southeast

20 VOLUME 18J O U R N A L O F C L I M A T E
Pacific off South America. Part I: Control experiment. Mon. Wea.Rev., 132, 274–296.
Wentz, F. J., C. Gentemann, D. Smith, and D. Chelton, 2000: Satellitemeasurements of sea surface temperature through clouds. Sci-ence, 288, 847–850.
Xie, P., and P. A. Arkin, 1996: Analyses of global monthly precipi-tation using gauge observations, satellite estimates, and numer-ical model predictions. J. Climate, 9, 840–858.
Xie, S.-P., 2004a: The shape of continents, air–sea interaction, andthe rising branch of the Hadley circulation. The Hadley Circu-lation: Past, Present and Future, H. F. Diaz and R. S. Bradley,Eds., Springer–Kluwer Academic, in press.
——, 2004b: Satellite observations of cool ocean–atmosphere inter-action. Bull. Amer. Meteor. Soc., 85, 195–208.
——, W. T. Liu, Q. Liu, and M. Nonaka, 2001: Far-reaching effectsof the Hawaiian Islands on the Pacific Ocean-atmosphere. Sci-ence, 292, 2057–2060.
——, H. Annamalai, F. A. Schott, and J. P. McCreary Jr., 2002:Structure and mechanisms of South Indian Ocean climate var-iability. J. Climate, 15, 864–878.
Xu, H., Y. Wang, and S.-P. Xie, 2004a: Effects of the Andes on easternPacific climate: A regional atmospheric model study. J. Climate,17, 589–602.
Yamagata, T., S. K. Behera, J. J. Luo, S. Masson, M. R. Jury, andS. A. Rao, 2004: Coupled ocean–atmosphere variability in thetropical Indian Ocean. Ocean–Atmosphere Interaction and Cli-mate Variability, Geophys. Monogr., No. 147, Amer. Geophys.Union, 189–212.