airport veer-off risk assessment: an … they should be developed on the basis of risk-based...
TRANSCRIPT
VOL. 12, NO. 3, FEBRUARY 2017 ISSN 1819-6608
ARPN Journal of Engineering and Applied Sciences ©2006-2017 Asian Research Publishing Network (ARPN). All rights reserved.
www.arpnjournals.com
900
AIRPORT VEER-OFF RISK ASSESSMENT: AN ITALIAN CASE STUDY
L. Moretti1, G. Cantisani1 and S. Caro2 1Department of Civil, Constructional and Environmental Engineering, Sapienza, Università di Roma, Rome, Italy
2Department of Civil and Environmental Engineering, Universidad de Los Andes, Bogota, Colombia E-Mail: [email protected]
ABSTRACT
The objective of this paper is to assess the veer-off risk of an Italian airport that is characterized for having near 12,000 annual movements. The name of this airport is not disclosed for security purposes. The methodology used followed the principles of probabilistic risk analysis in order to characterize the events and assess the corresponding damages. The study used statistical data about accident reports and local conditions that were collected following the standards of the International Civil Aviation Organization (ICAO). The methodology used in this work complies with the guidelines for the adjustment of lateral runway strips, edited by the Italian Civil Aviation Authority (ENAC). Besides, data available in worldwide databases of airplane accidents were also gathered and included as part of the analysis. The method used to assess the veer-off risk of the airport is consistent with probability and damage quantification methods published in the literature. The main variables considered in the analysis were traffic information, wind conditions, the existence of land-side buildings adjacent to the runway, and the geotechnical conditions of the subgrade underneath the strip zones. For the assessment of the veer-off risk, the authors used primary data provided by the airport management body within the period 2013-2015 and secondary data available in the literature. The risk of veer-off was calculated in more than 1,500 points around the runway. Besides, the authors proposed maximum allowable risks in different locations, and these values were compared to the actual risk levels previously computed. The results of this comparison suggested that improvements in the soil capacity and/or in the airport management activities might contribute to achieve the proposed allowable risk. The results from this assessment showed that the two critical variables determining the risk of veer-off accidents in the airport under evaluation were wind conditions and the bearing capacity of the soil underneath the strip areas. Also, it was found that the highest veer-off risk level obtained within the Cleared and Graded Area (CGA, part of the runway strip cleared of all obstacles and graded) was 2 10-7, while the lowest level was 3 10-8, which are considered typical risk ranges in airport operations. In general, the results demonstrate that the adopted methodology is a useful tool to evaluate the veer-off risk of a specific airport. Besides, the method allows comparing the actual levels of risk with proposed target levels of safety. Consequently, the quantification of the veer-off risk levels offers the airport management body the possibility of implementing appropriate measurements in those cases where minimum safety requirements are not achieved. Keyword: airport, risk assessment, veer-off, strip, probability analysis. INTRODUCTION
Safety plays a central role in the design and operation of infrastructure systems. Thus, any system should comply with some pre-specified minimum requirements, which are usually defined by codes of practice or equipment specifications, in order to guarantee an acceptable level of safety. In transportation engineering, safety has to be addressed to control the potential impact of an accident on the physical elements or components of the system and on the users, staff members and other people that interact with those components (e.g. Cantisani et al., 2012).
Among the different modes of transportation, aviation is considered one of the safest (European Aviation Safety Agency, 2016). In fact, existing data demonstrate that on-board fatalities in aircrafts with a take-off mass above 5.7 Mg have been declining in the last decades (Boeing, 2016). Safety in flight operations aims at achieving the maximum protection of the people involved and at preserving the integrity of the resources involved in airport activities. In this context, Safety Management Systems are the tools defined by the International Civil Aviation Organization, ICAO, to improve safety standards in global aviation (ICAO, 2014). For these systems to be effective, they should be developed on the basis of risk-
based management principles. Distefano and Leonardi (2013), for example, have proposed a risk assessment methodology after considering aircraft accidents between 1980 and 2010. Besides, several other studies reported in the literature have presented risk assessment for various accident types (e.g., Attaccalite et al., 2012; Ayres et al., 2013; Feng & Chung, 2013; Loprencipe & Di Mascio, 2016). The results from these procedures are expected to provide accurate data on the actual level of safety of some airport-related operations that, if needed, could be used to make decisions in order to achieve minimum safety requirements.
In the specific case of veer-off accidents, there exist some specific methods to assess the probability and risk of these events (Airport Cooperative Research Program, 2014; Norwegian Civil Aviation Authority, 2001). A veer-off is an overrun accident in which the aircraft leaves the side of runway, stopping in the lateral areas; i.e., Cleared and Graded Area (CGA), runway strips or farther (Cardi et al., 2012). Depending on the length of the drift and on the structures adjacent to the runway, these accidents can have significant consequences. In some cases, they compromise both the airport system and the nearby airport areas. Veer-offs are produced during take-off or landing movements due to the misalignment in the
VOL. 12, NO. 3, FEBRUARY 2017 ISSN 1819-6608
ARPN Journal of Engineering and Applied Sciences ©2006-2017 Asian Research Publishing Network (ARPN). All rights reserved.
www.arpnjournals.com
901
header landing or the loss of direction while running on the track. The five main factors causing these events are: weather conditions, pilot’s behaviour, mechanical condition of the aircraft, functional and structural characteristics of the airport management system, and overall condition of the runway (Di Mascio et al., 2008). The type of movement (landing or take-off), the type of runway (instrument or non-instrument runway), and the type of flights (passenger aviation, cargo, training, military or agricultural flights) affect the probability of a veer-off event (Moretti et al., in press a). However, existing statistical data show that the accident rate of veer-offs for general aviation is 10% higher than that for commercial aviation.
In several cases, veer-off accidents cause serious mechanical damages to airplanes and significant health consequences in the people involved (i.e., passengers, crew members, operation staff, etc.). Existing data have demonstrated that in around 5% of veer-offs the aircraft stopped over the airport boundaries; therefore, the role of the strips located next to the runway are critical to control these lateral overruns. According to the ICAO Annex 14 (2013a), the strip aims to “reduce the risk of damage to aircraft running off a runway” by means of specific requirements of subgrade bearing capacity and longitudinal and transversal slope of the CGA and the strips. Also, the ICAO regulations state that the CGA should be “(…) constructed as to minimize hazards arising from differences in load bearing capacity to aeroplanes which the runway is intended to serve in the event of an aeroplane running off the runway” (ICAO, 2013a).
Different national aeronautical authorities have implemented this requirement by defining a minimum value of a bearing capacity index of the soil underneath the CGA. For example, ENAC (2008) requires a minimum CBR (Californian Bearing Ratio) of 15% for the soil in these areas and a subsidence of the airplane gear less than 15 cm. If these values are not achieved, the agency should evaluate the necessity of conducting specific veer-off risk assessments (ENAC, 2008). The strength of the soils in the CGA and strips areas should be engineered to minimize the hazards that could arise from airplanes running off the runway but also to allow the access of emergency vehicles. Consequently, the bearing capacity of the CGA should be designed based on two main criteria: 1) the load transmitted by the critical project airplane, which is defined as that having the higher Maximum Take-off Weight (MTOW), and 2) the heavier aid that could be supplied to the fire brigade operating in the airport. Given the relevance of this factor, the improvement of the geotechnical conditions in these areas constitutes the instrument proposed by the Civil Aviation Authority to mitigate potential damage and consequences in case of veer-off events.
This paper presents a case study of veer-off risk assessment for an Italian airport, which name is not disclosed due to security reasons. The study was carried out using the methodology proposed by Moretti et al. (in press a, in press b) in which available data on the probability of veer-offs and average damage levels were
analysed against specific data of the examined airport. The value of applying this technique in the veer-off risk assessment of a specific airport, like the one analysed in this work, is the possibility of identifying the critical factors related to potential accidents. This, in turn, provides the information required by the airport management body to design a strategy to guarantee a minimum safety condition. The methodology adopted by the authors allows for an objective assessing of the risk level at the airport of interest and the results of the analysis are values comparable to a target level of risk to be defined during the analysis. METHODOLOGY
According to the guidelines published by ENAC (2008), the risk analysis of veer-off accidents should include the frequency and effects of the events. The consequences of veer-offs should consider both mechanical damages generated on the aircraft and health effects caused on the people involved (i.e., on board or outside the aircraft).
Because these are rare events, the risk analysis cannot be limited to the data available for the considered airport. Instead, the study requires the combination of global data, and specific data related to the geographical and morphological features of the runway (RWY). The general approach to this risk analysis is empirical, and it is based on the analysis and interpretation of events described in existing reports. The authors considered over 3,500 veer-offs, which occurred between 1946 and 2015. The data were collected from the following international sources: the National Transport Safety Board (NTSB, 2014), the Australian Transport Safety Bureau (ATSB, 2015), and the Boeing Company (2013, 2014, 2015, 2016).
The analysis of this information has already permitted to obtain basic information regarding this type of accidents. Moretti et al., for example, found that for commercial flights with a MTOW over 30 Mg (ton) the frequency of occurrence of a veer-off accident within the period 1980-2015 was 1.44 10-7 (Moretti et al., in press a). Besides, it has been already stated that this type of accidents is more frequent during landing than during take-off movements. Indeed, 75 percent of the worldwide events occurred during landing (Norwegian Civil Aviation Authority, 2001). Finally, it has been also reported that the accident rate for general aviation is 10% higher than for commercial aviation (National Transportation Safety Board, 2016).
Another important aspect to consider when conducting veer-offs risk assessments is the path and final location of the aircraft. The final point of the drift path leads to determine the lateral probability distribution, which is the probability that at the end of a veer-off the aircraft travels beyond a certain distance from the centreline of the runway. The Norwegian Civil Aviation Authority (2001) has found that this probability could be defined through an exponential function, such as (Equation 1):
VOL. 12, NO. 3, FEBRUARY 2017 ISSN 1819-6608
ARPN Journal of Engineering and Applied Sciences ©2006-2017 Asian Research Publishing Network (ARPN). All rights reserved.
www.arpnjournals.com
902
)()(naxexp (1)
where p is the probability that the aircraft at the end of the veer-off is x meters away from the RWY centreline, while a and n are coefficients that depend on the conditions at the examined contour. The distance x is calculated with respect to centre of gravity of the aircraft.
For landings on instrument runways, Moretti et al. (in press b) showed that the specific equation is (Equation 2):
)0219.0( xlandings ep (2)
Similarly, for take-offs on instrument runways,
the corresponding equation is (Moretti et al., in press b) (Equation 3):
)0143.0( xoffstake ep
(3)
Equations 2 and 3 will be used in this work to
describe the lateral probability distribution in a veer-off accident in the analysis. This curves allow assessing the probability of veer-off according to a statistical approach which is not specific to this airport. These probability results will be combined with wind conditions and traffic information (composition and runway use) to compute the actual probability of a veer-off accident in the examined airport.
Regarding the damage quantification method, the guidance provided by the Aviation Authority of the United Kingdom (Civil Aviation Organization, 2014) was adopted
to assess the damage level related to this type of accidents. Thus, the consequences of a plane crash are associated with a numerical value that ranges between 1 and 5, where 1 corresponds to ‘low severity’ and 5 to ‘high severity’. The existence of land-side buildings adjacent to the runway and geotechnical conditions of the soil underneath the strip areas was considered to quantify the expected damage after a veer-off accident around the runway. The combination of the veer off probability and the corresponding damage in more than 1,500 points around the runway was then used to assess the actual risk levels of these events and to obtain iso-risk curves. INPUT INFORMATION FOR THE RISK ASSESSMENT
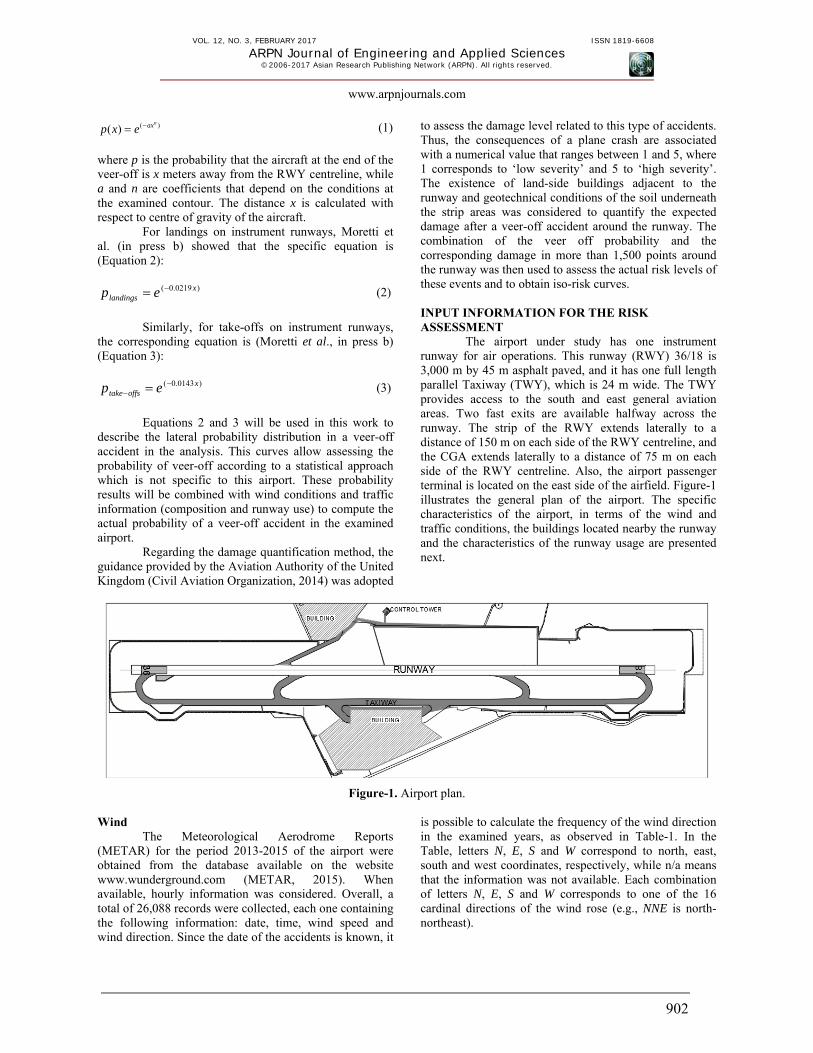
The airport under study has one instrument runway for air operations. This runway (RWY) 36/18 is 3,000 m by 45 m asphalt paved, and it has one full length parallel Taxiway (TWY), which is 24 m wide. The TWY provides access to the south and east general aviation areas. Two fast exits are available halfway across the runway. The strip of the RWY extends laterally to a distance of 150 m on each side of the RWY centreline, and the CGA extends laterally to a distance of 75 m on each side of the RWY centreline. Also, the airport passenger terminal is located on the east side of the airfield. Figure-1 illustrates the general plan of the airport. The specific characteristics of the airport, in terms of the wind and traffic conditions, the buildings located nearby the runway and the characteristics of the runway usage are presented next.
Figure-1. Airport plan. Wind
The Meteorological Aerodrome Reports (METAR) for the period 2013-2015 of the airport were obtained from the database available on the website www.wunderground.com (METAR, 2015). When available, hourly information was considered. Overall, a total of 26,088 records were collected, each one containing the following information: date, time, wind speed and wind direction. Since the date of the accidents is known, it
is possible to calculate the frequency of the wind direction in the examined years, as observed in Table-1. In the Table, letters N, E, S and W correspond to north, east, south and west coordinates, respectively, while n/a means that the information was not available. Each combination of letters N, E, S and W corresponds to one of the 16 cardinal directions of the wind rose (e.g., NNE is north-northeast).
VOL. 12, NO. 3, FEBRUARY 2017 ISSN 1819-6608
ARPN Journal of Engineering and Applied Sciences ©2006-2017 Asian Research Publishing Network (ARPN). All rights reserved.
www.arpnjournals.com
903
Table-1. Statistical data of wind direction (2013-2015 period).
Wind direction Heading (°) Number of hourly
registrations Frequency
(%)
variable - 5,002 19
Calm - 894 3
N 0 2,697 10
NNE 22,5 1,744 7
NE 45 815 3
ENE 67,5 731 3
E 90 252 1
ESE 112,5 213 1
SE 135 162 1
SSE 157,5 1,505 6
S 180 2,054 8
SSW 202,5 1,030 4
SW 225 746 3
WSW 247,5 2,328 9
W 270 2,385 9
WNW 292,5 911 3
NW 315 594 2
NNW 337,3 2,010 8
n/a - 12 0
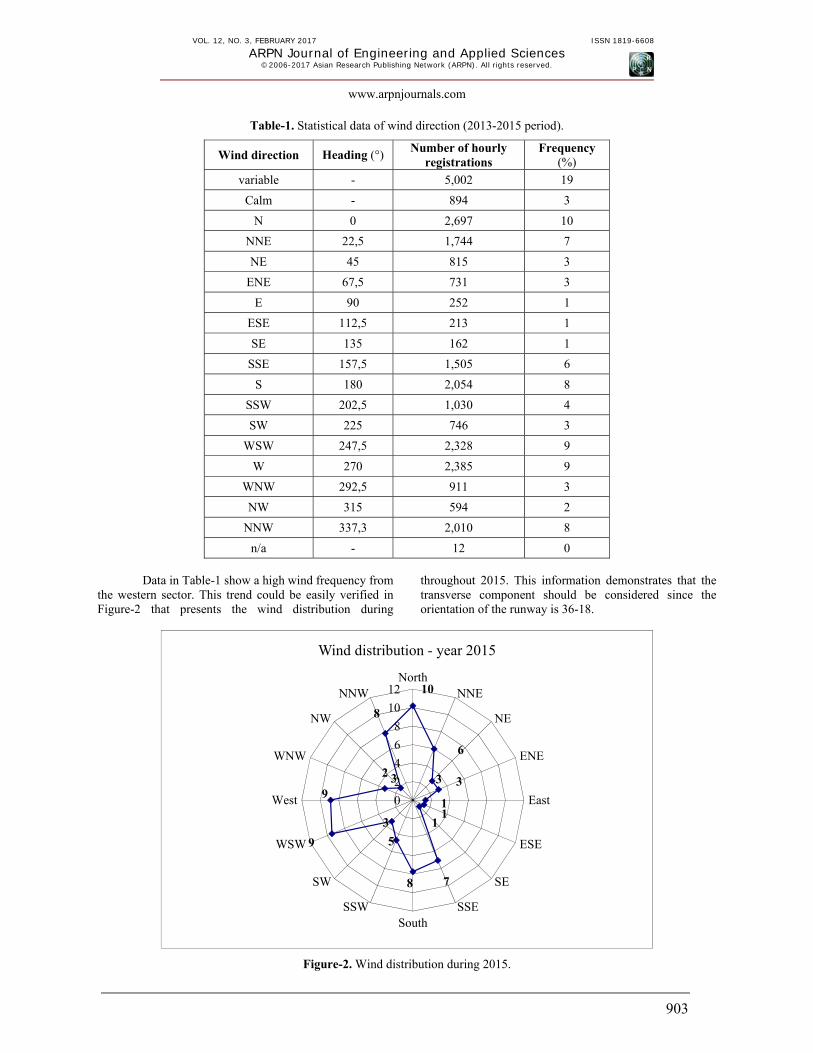
Data in Table-1 show a high wind frequency from
the western sector. This trend could be easily verified in Figure-2 that presents the wind distribution during
throughout 2015. This information demonstrates that the transverse component should be considered since the orientation of the runway is 36-18.
Figure-2. Wind distribution during 2015.
10
6
3 3
11
1
78
5
3
9
932
8
0
2
4
6
8
10
12North
NNE
NE
ENE
East
ESE
SE
SSESouth
SSW
SW
WSW
West
WNW
NW
NNW
Wind distribution - year 2015
VOL. 12, NO. 3, FEBRUARY 2017 ISSN 1819-6608
ARPN Journal of Engineering and Applied Sciences ©2006-2017 Asian Research Publishing Network (ARPN). All rights reserved.
www.arpnjournals.com
904
Despite this trend, the intensity of the crosswind component is limited: the wind coverage (WiCo), defined as the percentage of time that crosswinds are below an acceptable velocity, was more than 95% in the airport. This means the crosswind component is smaller than the maximum crosswind allowable component for the aircrafts moving in the airport during 95% of the time. Indeed, both ICAO and FAA (2012) standards prohibits the possibility of movements when the crosswind component is higher than the allowable value defined for the reference field length of each airplane (ICAO, 2013), as listed in Table-2.
Table-2. Allowable crosswind components (ICAO, 2013).
Allowable crosswind component (knots)
Reference field length (m)
10 < 1,200
13 1,200 – 1,500
20 > 1,500
Table-3 lists the collected data for the number of
crosswind reports that were found to be over the maximum allowable levels within the period 2013-2015. The wind reports collected by the authors highlight the need for considering more years in the meteorological studies because the variability of these data.
Table-3. Crosswind reports over ICAO limits (2013-2015 period).
Allowable crosswind component (knots)
Number of crosswind reports over the limit
Percentage of crosswind reports over the limit (%)
2013 2014 2015 2013 2014 2015
10 426 555 400 4.9 6.3 4.5
13 142 247 171 1.6 2.8 1.9
20 0 11 7 0 0.1 0
For the same period, Table-4 shows the average
percentages of crosswind reports that were below the allowable limit. They are grouped as a function of the three wind intensities defined by ICAO and listed in Table-2. Meteorological data confirmed the correct runway orientation with respect to the existing wind conditions.
Table-4. Average crosswind data (2013-2015 period).
Allowable crosswind component (knots)
WiCo(%)
10 95.0
13 97.8
20 99.9
Data listed in Table-4 show the WiCo of the
airport complies the ICAO limit, but the asymmetrical results graphed in Figure 2 require further consideration of the transverse components 270-90 (wind coming from the western sector) and 90-270 (wind coming from the eastern sector). Table 5 summarizes the wind frequency from the western and eastern sectors. Notice that the sum of the frequencies of the western and western crosswind sectors presented in this table corresponds to the complement of the WiCo values reported in Table-4.
Table-5. Crosswind frequency for sectors.
Allowable crosswind component (knots)
more than
Frequency of western
crosswind(%)
Frequency of eastern
crosswind (%)
10 4.2 0.8
13 1.8 0.3
20 0.06 7.6E-03
Table-5 shows that for the same boundary
conditions, windiness of the site causes higher veer-off risk into the eastern side of RWY 36: the frequency of western crosswind is much higher (about six times higher) than the frequency of the eastern crosswind. Also, the analysis of the data show that higher risk conditions exist for small airplanes, which have the lowest WiCo values and require less than 1,200 m aeroplane reference field length. Traffic composition
Table-6 lists the annual movements reported at the airport during the period 2013-2015. As observed, the annual average value is around 12,000.
Table-6. Annual movements at the airport.
Year Number of annual
movements
2013 11,738
2014 10,988
2015 13,804
VOL. 12, NO. 3, FEBRUARY 2017 ISSN 1819-6608
ARPN Journal of Engineering and Applied Sciences ©2006-2017 Asian Research Publishing Network (ARPN). All rights reserved.
www.arpnjournals.com
905
In this airport, commercial movements contribute to 90% the total number of movements, while general aviation contributes to the other 10% of the movements, which are non-instrumental. The ten most frequent
commercial movements for each examined year are summarized in Table-7. The codes in this table represent specific aircraft models.
Table-7. More frequent airplane models in the airport.
2013 2014 2015
Airplane model
Number of movements
Percentage of
movements (%)
Airplane model
Number of movements
Percentage of
movements (%)
Airplane model
Number of movements
Percentage of
movements (%)
B 737-800 3,272 27.9 B 737-800 3,310 30.1 B 737-800 4,418 32.0
B 737-700 3,050 26.0 B 737-700 2,562 23.3 B 737-400 3,004 21.8
B 737-400 2,212 18.8 B 737-400 2,500 22.8 B 737-700 2,428 17.6
B 737-300 634 5.4 B 737-300 462 4.2 A320 1,010 7.3
A 320 234 2.0 FK 100 410 3.7 B 737-300 492 3.6
BAE 182 1.6 A 320 208 1.9 73F 342 2.5
ATR 42 166 1.4 BAE 114 1.0 FK 100 286 2.1
F 100 150 1.3 B 737-200 100 0.9 A319 202 1.5
PA 28 98 0.8 PA 28 72 0.7 B 737-200 152 1.1
AS 350 94 0.8 MD 82 62 0.6 BAE 132 1.0
Total 10092 86 Total 9,800 89.2 - 12,466 90.5
For each airplane model, the authors calculated
the take-off and landing field length. For each of the three categories considered in Section 2.1, Table 8 lists the frequency of field length requested by all airplanes during the period 2013-2015. From these data, it is possible to conclude that only 11% of the average mixed traffic requires less than 1,200 m of aeroplane reference field length and, therefore, almost 90% of the average mixed traffic operates with higher WiCo values.
Table-8. Frequency of requested field length.
Requested field length (m)
Landing (%) Take-off
(%)
< 1,200 11.36 11.26
1,200 – 1,500 4.04 0
> 1,500 84.6 88.75
Runway use Runway 18 is used in 90% of the landing events,
while runway 36 is used in 90% of the total take-offs. Assuming that each airplane begins its movement at the runway threshold, it is then possible to assess the average annual number of movements at different points of the runway, after considering that the level of occupancy of any RWY is a function of the RWY length required for each type of aircraft.
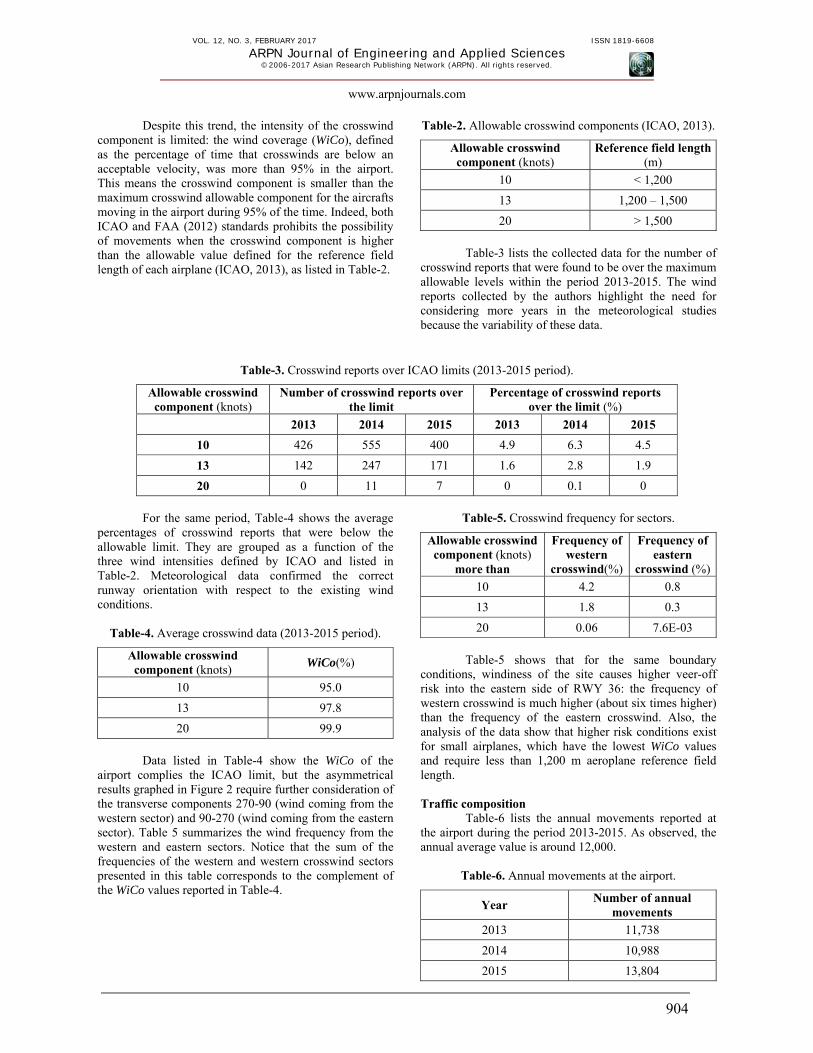
Figure-3 shows the distribution of the movements along the runway. The y-axis represents the distance measured on the RWY axis: the coordinate 0 m coincides with the RWY threshold 36 and consequently the progressive 3,000 m coincides with the RWY threshold 18. Each point with a,b coordinates of the curves in Figure 3 show the number (a) of movements (take-off, landings or total movements) which occur at the distance (b) from the RWY threshold 36.
VOL. 12, NO. 3, FEBRUARY 2017 ISSN 1819-6608
ARPN Journal of Engineering and Applied Sciences ©2006-2017 Asian Research Publishing Network (ARPN). All rights reserved.
www.arpnjournals.com
906
Figure-3. Distribution of the movements along the runway.
As represented by the green triangles in Figure-3, central and northern sectors of the RWY 36 had the maximum annual number of movements (about 85% of the total), whereas the minimum number of movements was in the southern sector of the same runway. In the latter, the total amount of movements was about half of the total annual number of movements (53% of the total). Buildings located on the side of the airport
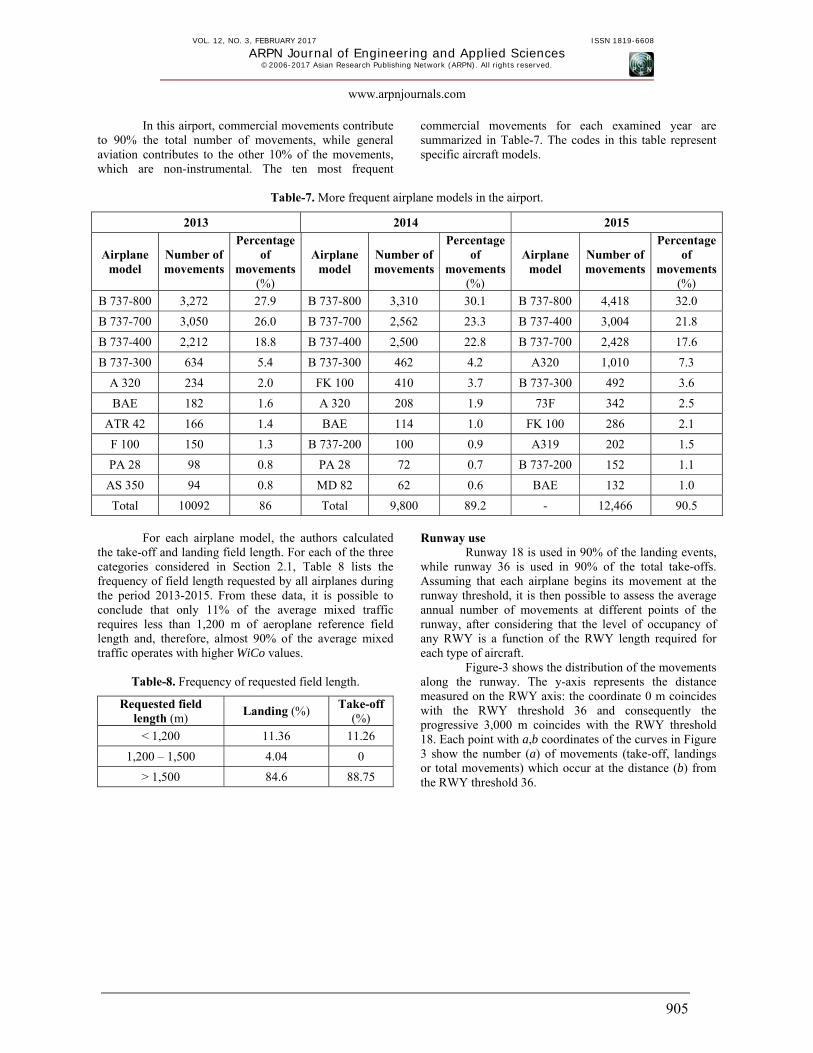
Next to the RWY, there are two main buildings with the offices for management operations and air traffic control. The first one is located in the western sector of the airport and it hosts the control tower and other buildings,
while the second is located in the eastern sector and it hosts land-side facilities and other infrastructure. A land base of an adjacent military airport is located on the west side, near the control tower but outside the airport boundaries. All structures are external to the RWY strip: the first one is located the farthest and it interferes with a limited portion of the RWY, while the second one lies between the point 1,000 m and 2,000 m (Figure-4). The most critical building area is along the RWY side in the direction where crosswind mainly blows (from western to eastern side). The most relevant interference areas in case of veer-off accidents are marked in the layout of the airport in Figure-4.
Figure-4. Potential interference areas in case of a veer-off event.
0
500
1000
1500
2000
2500
3000
0 1000 2000 3000 4000 5000 6000 7000 8000 9000 10000 11000 12000
Dis
tanc
e fr
om R
WY
thre
shol
d 36
(m
)
Number of movements
Distribution of movements along the RWY
take-offs
landings
Total movements
VOL. 12, NO. 3, FEBRUARY 2017 ISSN 1819-6608
ARPN Journal of Engineering and Applied Sciences ©2006-2017 Asian Research Publishing Network (ARPN). All rights reserved.
www.arpnjournals.com
907
Geotechnical characteristics of the strip areas Following the guidelines for the adaptation of
airport strips, published by ENAC (2005), 12 California Bearing Ratio (CBR) tests and 20 plate load tests were carried out by the airport management body.
Higher values of CBR, a quantity that is usually expressed in percentage, and of dynamic elastic modulus are related with higher mechanical properties of the soil. Therefore, these tests allow evaluating the bearing capacity of the subgrade. As observed in Table-9, the values obtained for both properties are highly variable (Table-9).
Table-9. Results of CBR and plate load tests.
Maximum CBR (%) 19
Minimum CBR (%) 1
Average CBR (%) 5.8
Standard deviation of CBR (%) 6.91
Coefficient of variation of CBR (%) 119
Maximum dynamic elastic modulus (MPa) 44
Minimum dynamic elastic modulus (MPa) 11
Average dynamic elastic modulus (MPa) 23.6
Standard dynamic deviation of elastic modulus (MPa)
23.62
Coefficient of variation of dynamic elastic modulus (%)
100
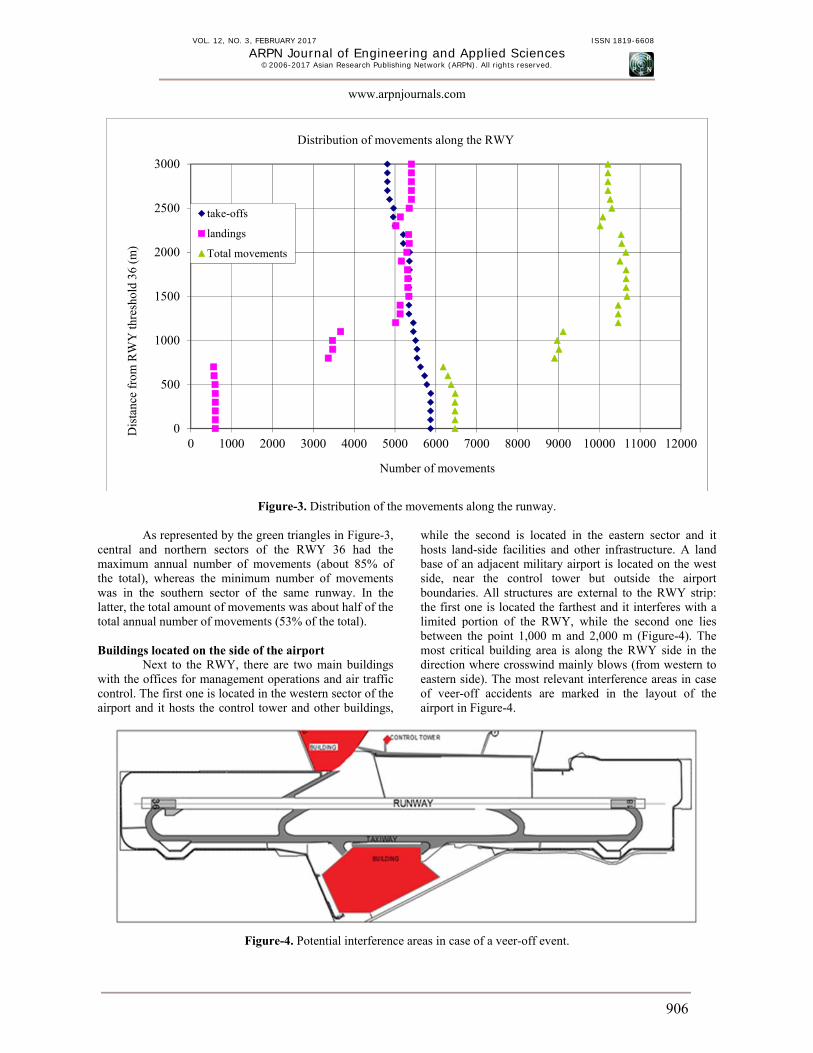
Coloured boxes in Figure-5 illustrate the
measured soil bearing capacity in terms of both properties (i.e., CBR and dynamic elastic modulus or Ed). These results show that in most strip areas the CBR values are below the minimum 15-20% range required by ENAC. In fact, only in northern area of the RWY, the CBR values are between the required range of 15 and 20%. However, these data have a high variability, as demonstrated in Table-9, since a northern point (in the area with higher geotechnical characteristics) presents a CBR of 1%.
Figure-5. CBR (%) and plate load results. RISK ASSESSMENT
The presented specific characteristics of the airport under evaluation, in terms of wind, characteristics of the runway usage, traffic composition, buildings located near the runway and soil bearing capacity, were used to assess the risk of veer-offs in this airport. Wind condition, runway usage and traffic composition affect the probability of an accident, whereas soil bearing capacity
and the presence of buildings affect the expected damage produced by an accident. Consequently, the risk assessment requires considering both the probability of occurrence of an event and the corresponding damage evaluation.
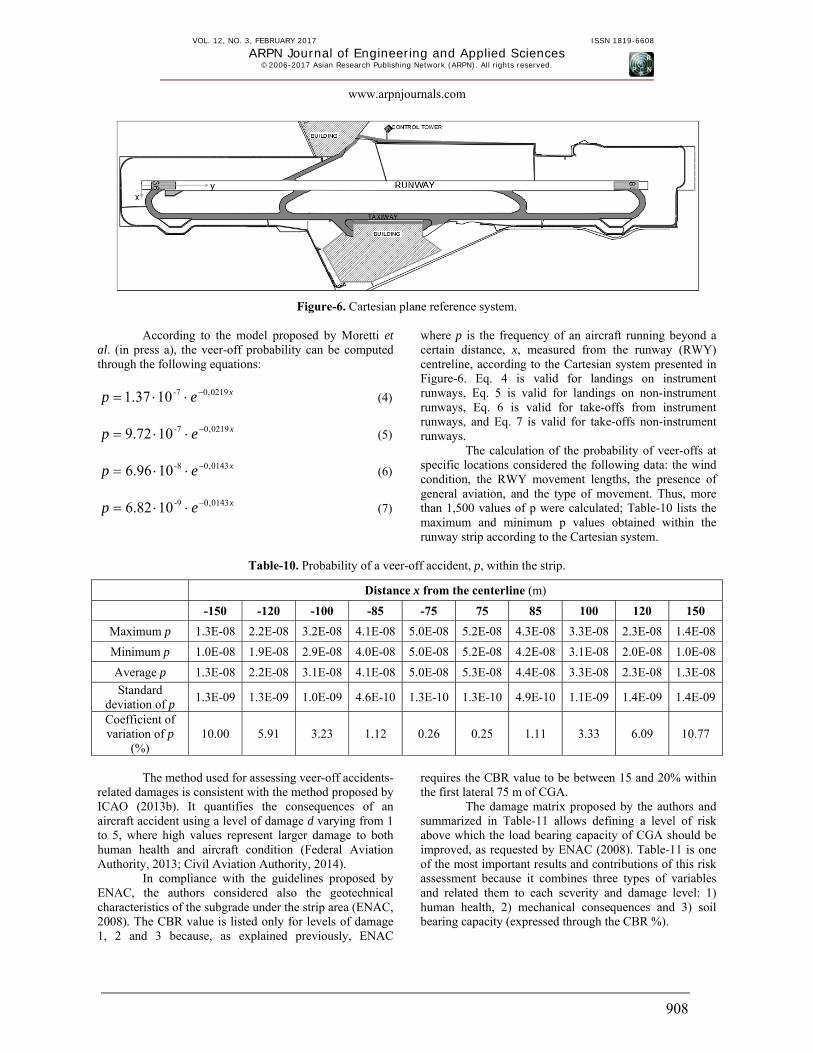
The models adopted in this analysis permit the assessment of veer-off risk at any specific location in the Cartesian plane reference system illustrated in Figure-6.
VOL. 12, NO. 3, FEBRUARY 2017 ISSN 1819-6608
ARPN Journal of Engineering and Applied Sciences ©2006-2017 Asian Research Publishing Network (ARPN). All rights reserved.
www.arpnjournals.com
908
Figure-6. Cartesian plane reference system.
According to the model proposed by Moretti et al. (in press a), the veer-off probability can be computed through the following equations:
xep 0219,0-7101.37 (4)
xep 0219,0-71072.9 (5)
xep 0143,0-81096.6 (6)
xep 0143,0-91082.6 (7)
where p is the frequency of an aircraft running beyond a certain distance, x, measured from the runway (RWY) centreline, according to the Cartesian system presented in Figure-6. Eq. 4 is valid for landings on instrument runways, Eq. 5 is valid for landings on non-instrument runways, Eq. 6 is valid for take-offs from instrument runways, and Eq. 7 is valid for take-offs non-instrument runways.
The calculation of the probability of veer-offs at specific locations considered the following data: the wind condition, the RWY movement lengths, the presence of general aviation, and the type of movement. Thus, more than 1,500 values of p were calculated; Table-10 lists the maximum and minimum p values obtained within the runway strip according to the Cartesian system.
Table-10. Probability of a veer-off accident, p, within the strip.
Distance x from the centerline (m)
-150 -120 -100 -85 -75 75 85 100 120 150
Maximum p 1.3E-08 2.2E-08 3.2E-08 4.1E-08 5.0E-08 5.2E-08 4.3E-08 3.3E-08 2.3E-08 1.4E-08
Minimum p 1.0E-08 1.9E-08 2.9E-08 4.0E-08 5.0E-08 5.2E-08 4.2E-08 3.1E-08 2.0E-08 1.0E-08
Average p 1.3E-08 2.2E-08 3.1E-08 4.1E-08 5.0E-08 5.3E-08 4.4E-08 3.3E-08 2.3E-08 1.3E-08
Standard deviation of p
1.3E-09 1.3E-09 1.0E-09 4.6E-10 1.3E-10 1.3E-10 4.9E-10 1.1E-09 1.4E-09 1.4E-09
Coefficient of variation of p
(%) 10.00 5.91 3.23 1.12 0.26 0.25 1.11 3.33 6.09 10.77
The method used for assessing veer-off accidents-
related damages is consistent with the method proposed by ICAO (2013b). It quantifies the consequences of an aircraft accident using a level of damage d varying from 1 to 5, where high values represent larger damage to both human health and aircraft condition (Federal Aviation Authority, 2013; Civil Aviation Authority, 2014).
In compliance with the guidelines proposed by ENAC, the authors considered also the geotechnical characteristics of the subgrade under the strip area (ENAC, 2008). The CBR value is listed only for levels of damage 1, 2 and 3 because, as explained previously, ENAC
requires the CBR value to be between 15 and 20% within the first lateral 75 m of CGA.
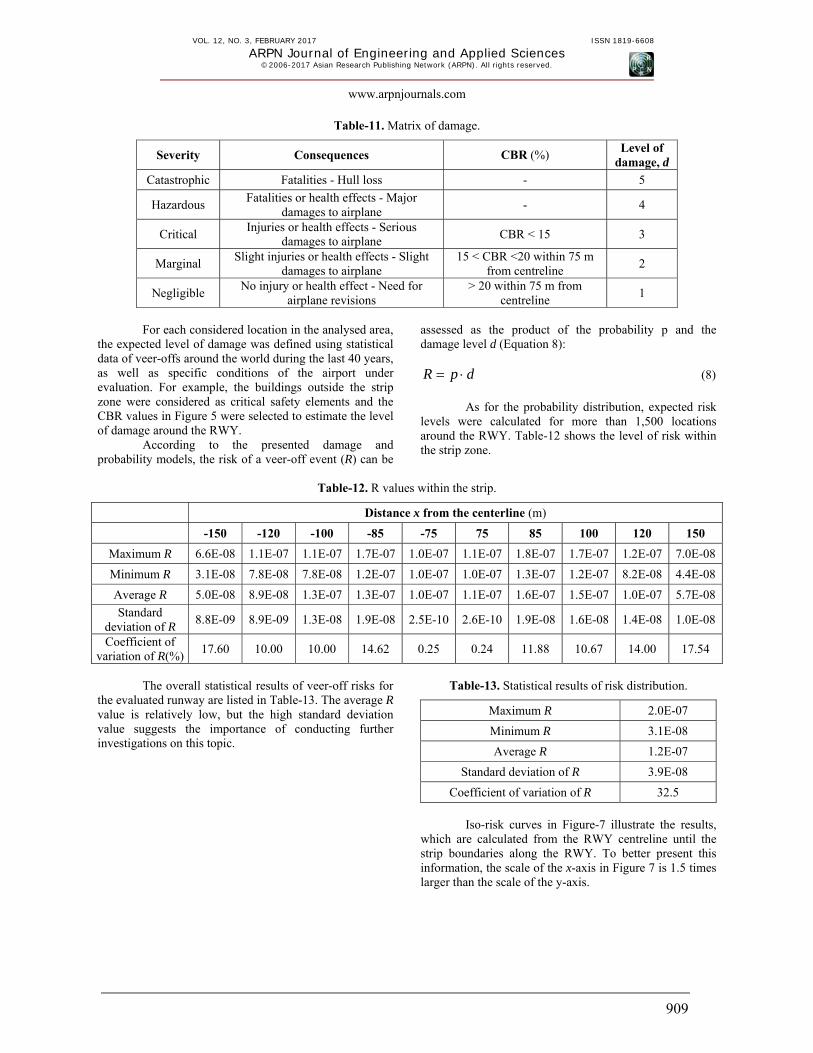
The damage matrix proposed by the authors and summarized in Table-11 allows defining a level of risk above which the load bearing capacity of CGA should be improved, as requested by ENAC (2008). Table-11 is one of the most important results and contributions of this risk assessment because it combines three types of variables and related them to each severity and damage level: 1) human health, 2) mechanical consequences and 3) soil bearing capacity (expressed through the CBR %).
VOL. 12, NO. 3, FEBRUARY 2017 ISSN 1819-6608
ARPN Journal of Engineering and Applied Sciences ©2006-2017 Asian Research Publishing Network (ARPN). All rights reserved.
www.arpnjournals.com
909
Table-11. Matrix of damage.
Severity Consequences CBR (%) Level of
damage, d
Catastrophic Fatalities - Hull loss - 5
Hazardous Fatalities or health effects - Major
damages to airplane- 4
Critical Injuries or health effects - Serious
damages to airplane CBR < 15 3
Marginal Slight injuries or health effects - Slight
damages to airplane 15 < CBR <20 within 75 m
from centreline 2
Negligible No injury or health effect - Need for
airplane revisions > 20 within 75 m from
centreline 1
For each considered location in the analysed area,
the expected level of damage was defined using statistical data of veer-offs around the world during the last 40 years, as well as specific conditions of the airport under evaluation. For example, the buildings outside the strip zone were considered as critical safety elements and the CBR values in Figure 5 were selected to estimate the level of damage around the RWY.
According to the presented damage and probability models, the risk of a veer-off event (R) can be
assessed as the product of the probability p and the damage level d (Equation 8):
dpR (8)
As for the probability distribution, expected risk
levels were calculated for more than 1,500 locations around the RWY. Table-12 shows the level of risk within the strip zone.
Table-12. R values within the strip.
Distance x from the centerline (m)
-150 -120 -100 -85 -75 75 85 100 120 150
Maximum R 6.6E-08 1.1E-07 1.1E-07 1.7E-07 1.0E-07 1.1E-07 1.8E-07 1.7E-07 1.2E-07 7.0E-08
Minimum R 3.1E-08 7.8E-08 7.8E-08 1.2E-07 1.0E-07 1.0E-07 1.3E-07 1.2E-07 8.2E-08 4.4E-08
Average R 5.0E-08 8.9E-08 1.3E-07 1.3E-07 1.0E-07 1.1E-07 1.6E-07 1.5E-07 1.0E-07 5.7E-08
Standard deviation of R
8.8E-09 8.9E-09 1.3E-08 1.9E-08 2.5E-10 2.6E-10 1.9E-08 1.6E-08 1.4E-08 1.0E-08
Coefficient of variation of R(%)
17.60 10.00 10.00 14.62 0.25 0.24 11.88 10.67 14.00 17.54
The overall statistical results of veer-off risks for
the evaluated runway are listed in Table-13. The average R value is relatively low, but the high standard deviation value suggests the importance of conducting further investigations on this topic.
Table-13. Statistical results of risk distribution.
Maximum R 2.0E-07
Minimum R 3.1E-08
Average R 1.2E-07
Standard deviation of R 3.9E-08
Coefficient of variation of R 32.5
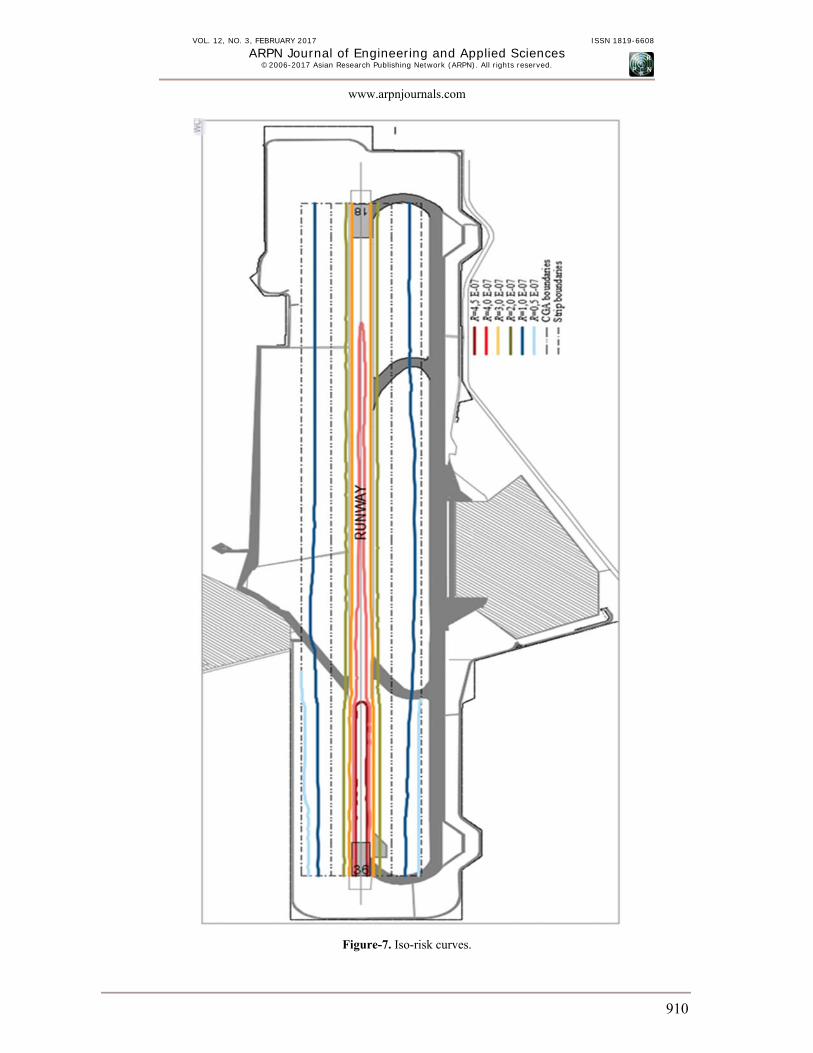
Iso-risk curves in Figure-7 illustrate the results,
which are calculated from the RWY centreline until the strip boundaries along the RWY. To better present this information, the scale of the x-axis in Figure 7 is 1.5 times larger than the scale of the y-axis.
VOL. 12, NO. 3, FEBRUARY 2017 ISSN 1819-6608
ARPN Journal of Engineering and Applied Sciences ©2006-2017 Asian Research Publishing Network (ARPN). All rights reserved.
www.arpnjournals.com
910
Figure-7. Iso-risk curves.
VOL. 12, NO. 3, FEBRUARY 2017 ISSN 1819-6608
ARPN Journal of Engineering and Applied Sciences ©2006-2017 Asian Research Publishing Network (ARPN). All rights reserved.
www.arpnjournals.com
911
The high variability observed and plotted in the risk levels results from the variability of the factors considered as part of the analysis (i.e., wind conditions, the field length required by airplanes, and the load bearing capacity of the subgrade). The authors used these results to propose maximum levels of risk tolerance at the boundaries of CGA as a function of the distance from the RWY threshold 36. These results are summarized in Table-14. The values correspond to the combination of the actual probability p of veer-offs and a damage level d equal to 1. According to the ENAC guidelines (2008), a geotechnical improvement is required to achieve a damage level of 1, as explained next.
Table-14. Maximum level of risk tolerable at the boundaries of CGA.
Distance from the RWY threshold
36 (m)
Distance from the centreline
- 75 m +75 m
Maximum level of risk tolerable
0-750 5.03 E-08 5.28 E-08
751-1,150 5.01 E-08 5.26 E-08
1,151-3,000 5.00 E-08 5.25 E-08
The actual values obtained from the analysis for
R values at 75 m from the centreline are higher than the proposed limits. Therefore, according to the ENAC Guidelines (2008), the load bearing capacity of the subgrade should be improved in the CGA area. Geological and geotechnical testing is then needed for the design of a soil stabilization treatment or a rehabilitation procedure, which has the objective of achieving a CBR of at least 15%. In the areas located more than 75 m away from the centreline, but included within the CGA, it is appropriate to further evaluate if any action is required, especially where d reaches the maximum value of 5 as a result of the buildings interference.
Alternatively, it would be also possible to evaluate a better distribution of the movements along the runway. The obtained data suggest that a more uniform use of the RWY, in which movements start not only from the RWY threshold, could reduce the risk in the central areas of the RWY. This option is feasible considering to the relatively large proportion of small airplanes in the traffic distribution of this airport. CONCLUSIONS
Although existing statistical data shows that the rate of airport accidents is decreasing, the International Civil Aviation Organization (ICAO) continues developing initiatives to improve safety performance. Several studies available in the literature present methodologies to assess the risk of airplane accidents. In the specific case of veer-off accidents, many national aeronautical authorities require specific risk assessments when the minimum value of the bearing capacity of the soil composing the CGA is
low. However, there is not any indication regarding allowable levels of risk for these areas.
This study focused on the implementation of a risk-based methodology to evaluate the level of veer-off risk in an Italian airport. The work involved the analysis of the specific causes that affect the frequency of occurrence of a veer-off accident. Weather and operational conditions of accidents occurred between 2013 and 2015 years were considered as part of the analysis, as well as the geotechnical and structural characteristics of the site.
The probability of veer-off sand veer-offs-related damage models were developed as part of the study, and they are considered valuable tools to assess specific values of risk at different locations within the runway and to propose minimum acceptable risk levels. One important contribution of this work is the innovative damage model proposed by the authors that properly combines and integrates human health, mechanical consequences and soil bearing capacity.
The results showed that the current average veer-off risk of this airport is equal to 1.2 10-7, while the statistical analysis suggested that there is high variability among results, which is mainly caused by the natural variability of the specific conditions of the examined airport (i.e., wind distribution, traffic composition, runway use and buildings on the land side and geotechnical characteristics of soil). The results also showed that the maximum level of risk within the strip boundary does not meet the allowable level of risk at the CGA boundaries that were proposed by the authors. Consequently, it is concluded that a geotechnical intervention, as required by ENAC, and/or a better distribution of movements along the runway could be performed to achieve the proposed risk threshold.
The importance of this study is that it provides guidance on how to evaluate specific levels of risk at airports through the assessment of the actual levels of risk and on specific proposed reference allowable risk values. This information provides the data required by management bodies and/or authorities to specify strategies, procedures of policies to guarantee minimum safety levels at airports. REFERENCES Airport Cooperative Research Program. 2014. Development of a Runway Veer-Off Location Distribution Risk Assessment and Reporting Template. Attaccalite L., Di Mascio P., Loprencipe G., Pandolfi C. 2012. Risk Assessment around Airport. In: SIIV - 5th International Congress - Sustainability of Road Infrastructures. Procedia: Social & Behavioral Sciences. 53: 852-861, 2012 Elsevier Ltd, ISSN: 1877-0428, Rome, Italy, 29-31 October 2012, http://dx.doi.org/10.1016/j.sbspro.2012.09.934. Australian Transport Safety Bureau. 2015. Available from www.atsb.gov.au.
VOL. 12, NO. 3, FEBRUARY 2017 ISSN 1819-6608
ARPN Journal of Engineering and Applied Sciences ©2006-2017 Asian Research Publishing Network (ARPN). All rights reserved.
www.arpnjournals.com
912
Ayres M.Jr., Shirazi H., Carvalho R., Hall J., Speir R., Arambula E., David R., Gadzinski J., Caves R., Wonge D., Pitfield D. 2012. Modelling the location and consequences of aircraft accidents. Safety Science 51, 178–186 Elsevier Ltd. http://dx.doi.org/10.1016/j.ssci.2012.05.012. Boeing. 2016. Statistical Summary of Commercial Jet Airplane Accidents-worldwide operations 1959-2015. Cardi A., Di Mascio P., M. Di Vito, C. Pandolfi. 2012. Distribution of Air Accidents around Runways. In: SIIV - 5th International Congress - Sustainability of Road Infrastructures. Procedia: Social & Behavioral Sciences, vol. 53, p. 862-871, 2012 Elsevier Ltd, ISSN: 1877-0428, Roma, Italy, 29-31 October 2012, http://dx.doi.org/10.1016/j.sbspro.2012.09.935. Cantisani, G., Loprencipe, G., & Primieri, F. (2012). The integrated design of urban road intersections: A case study. In ICSDC 2011: Integrating Sustainability Practices in the Construction Industry. pp. 722-728. Distefano N., Leonardi S. 2013. Risk assessment procedure for civil airport. International Journal for Traffic and Transport Engineering, 2014, 4(1), pp. 62-75. doi: http://dx.doi.org/10.7708/ijtte.2014.4(1).05. Di Mascio P., Moretti L. 2008. La valutazione del rischio di incidente per svio dalla pista di volo.Strade & Autostrade n. 3/2008. Di Mascio, P., Loprencipe, G. (2016) Risk analysis in the surrounding areas of one-runway airports: a methodology to preliminary calculus of PSZs dimensions. ARPN Journal of Engineering and Applied Sciences (ISSN 1819-6608), 13641-13649, 11, 23. ENAC. 2008. Linee guida per l’adeguamento delle strip aeroportuali. European Aviation Safety Agency. 2016. Annual Safety Review. Federal Aviation Administration. 2012. Advisory Circular 150/5300-13 part 2. Appendix 1. Federal Aviation Administration. 2013. Order 5200.11. Feng C-M., Chung C-C. 2013. Assessing the Risks of Airport Airside through the Fuzzy Logic-Based Failure Modes, Effect, and Criticality Analysis. Mathematical Problems in Engineering, Volume 2013, Article ID 239523, http://dx.doi.org/10.1155/2013/239523 ICAO. 2013 a. Annex 14, Volume I Aerodromes. ICAO. 2013 b. Annex 19 Safety Management. ICAO. 2014. Safety Management Manual.
METAR. 2015. Available from www.wunderground.com. Moretti L. 2007. Procedure di risk assessment per la valutazione della portanza della strip aeroportuale.Thesis of Master degree, Sapienza University of Rome. Moretti L., Cantisani G., Di Mascio P., Nichele S. (in press) a. A runway veer-off risk assessment based on frequency model: Part I. probability analysis. Proceedings at International Congress on Transport Infrastructure and Systems, April 10/12, Rome, Italy. Moretti L., Cantisani G., Di Mascio P., Nichele S. (in press) b. A runway veer-off risk assessment based on frequency model: Part II. Risk analysis. Proceedings at International Congress on Transport Infrastructure and Systems, April 10/12, Rome, Italy. National Transportation Safety Board. 2014. Available from www.ntsb.gov. National Transportation Safety Board. 2016. Aviation Accident Statistics: U.S. General Aviation. Norwegian Civil Aviation Authority. 2001. Final Report on the Risk Analysis in Support of Aerodrome Design Rules. Ranieri V., D’Auria D. 2007. Cleared and graded area (CGA): critical analysis and proposal of a criterion for grading its bearing capacity. 4th International SIIV congress 12-14 September 2007, Palermo. Wong D.K.Y., Pitfield D.E., Caves R.E., Appleyard A.J. 2008 b The development of a more risk-sensitive and flexible airport safety area strategy: Part I. The development of an improved accident frequency model. Safety Science. 47, 903-912, Elsevier Ltd. http://dx.doi.org/10.1016/j.ssci.2008.09.010. Wong D.K.Y., Pitfield D.E., Caves R.E., Appleyard A.J. 2008 a. The development of a more risk-sensitive and flexible airport safety area strategy: Part II. Accident location analysis and airport risk assessment case studies. Safety Science. 47, 913-924, Elsevier Ltd. http://dx.doi.org/10.1016/ j.ssci.2008.09.011.