airport noise management report year 2018
TRANSCRIPT

AIRPORT NOISE
MANAGEMENT REPORT
Year 2018

2
Airport Noise Management Report Year Quarter 2018
The Airport Noise Management Report provides the Year 2018 summary of St. Louis Lambert International Airport’s operations and noise complaints. The data in this report is from Harris, Inc. and not from FAA Air Traffic. This report is illustrative of trends and distribution and should not be construed as official traffic counts.
YEAR 2018
There were 45 noise complaints received in both 2018 and 2017. The 45 complaints were from 14 communi-ties. Residents complained about too many aircraft using Runway 29 and not using other runways to spread out the noise. Because of severe thunderstorms in May and June, ATCT turned aircraft sharply after depart-ing and residents complained about aircraft not following procedures. Complainants to the east of the Airport complained about aircraft disrupting and blocking TV signals in the morning. Another complainant had re-cently bought a house and wondered why there were so many aircraft now over his house. An anonymous resident complained about the helicopters that accompanied the President’s visit to St. Louis. Residents complained about military touch and goes and departures of squadrons waking children taking naps. Thirty nine complaints were about day time operations (7:00 a.m. to 10:00 p.m.) and six complaints were about night-time operations (10 p.m. to 7 a.m.). Landings and take-offs (operations) during the day time hours ac-counted for 86.7% of the operations while 13.3% of the operations occurred during the night time period. Chart below shows number of complaints by zip code.
N O I S E C O M P L A I N T S
Quarters Zip Calls Zip Calls Zip Calls Zip Calls Zip Calls Zip Calls Zip Calls
1st Quarter 63031 3 63112 2 63141 1 - - - - - - - -
2nd Quarter 63042 1 63044 3 63113 1 63114 1 63121 5 63130 1 63301 2
3rd Quarter 63033- 2 63043 2 63044 6 63109 1 63114 1 63121 3 63134 1
4th Quarter 63043 1 63044 4 63121 3 63146 1 - - - - - -
3
Airport Noise Management Annual 2018 Report
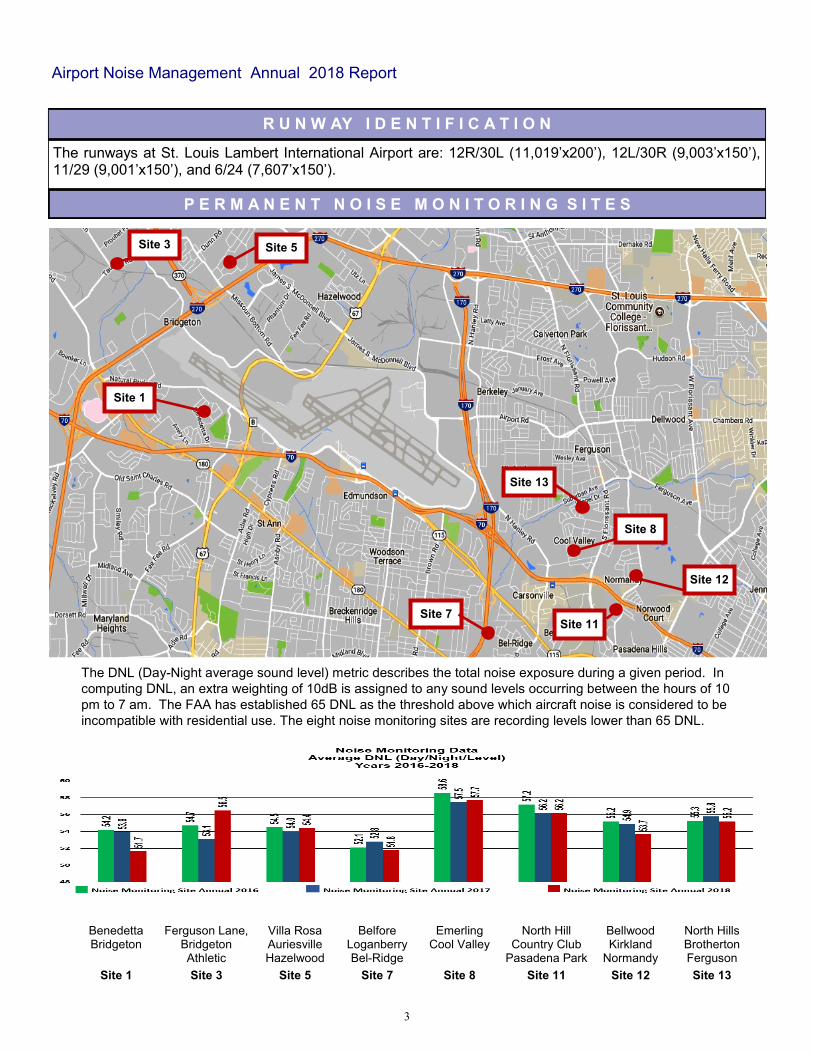
The runways at St. Louis Lambert International Airport are: 12R/30L (11,019’x200’), 12L/30R (9,003’x150’), 11/29 (9,001’x150’), and 6/24 (7,607’x150’).
R U N W AY I D E N T I F I C A T I O N
P E R M A N E N T N O I S E M O N I T O R I N G S I T E S
Site 5
Site 1
Site 13
Site 7
Site 8
Benedetta Bridgeton
5555
Site 1
Ferguson Lane, Bridgeton Athletic
Site 3
Villa Rosa Auriesville Hazelwood
Site 5
Belfore Loganberry Bel-Ridge
Site 7
Emerling Cool Valley
5555
Site 8
North Hill Country Club
Pasadena Park
Site 11
Bellwood Kirkland
Normandy
Site 12
North Hills Brotherton Ferguson
Site 13
The DNL (Day-Night average sound level) metric describes the total noise exposure during a given period. In
computing DNL, an extra weighting of 10dB is assigned to any sound levels occurring between the hours of 10
pm to 7 am. The FAA has established 65 DNL as the threshold above which aircraft noise is considered to be
incompatible with residential use. The eight noise monitoring sites are recording levels lower than 65 DNL.
Site 12
Site 3
Site 11

4
O P E R A T I O N S B Y R U N W A Y
Airport Noise Management Annual 2018 Report
There were 193,005 operations recorded in 2018 as compared to 194,432 operations in 2017, a decrease of –0.7% according to Harris data* . Runway 30R was the most utilized runway for arrivals in 2017 (21.9%) and in 2018 (21.3%). Runway 30L was the most utilized runway for known departures in 2018 (18.6%) and in 2017 (20.4%). In 2018, Runway 12L/30R was closed for a part of July and August due to runway recon-struction. In 2018, there were 192,009 (99.4%) operations in which the runway was identified and 996 opera-tions (0.6%) where the runways were not identified.
*The Harris Airport Noise and Operation Management System (ANOMS) collects FAA air traffic data from the National Airspace System (NAS) and permanent noise monitoring data and correlates flight tracks, noise monitoring events and noise complaints. The ANOMS provides illustrative trends and should not be construed as official traffic counts.
0 5000 10000 15000 20000 25000 30000 35000 40000 45000
30R ARR
30L DEP
12R DEP
12L ARR
12L DEP
29 DEP
12R ARR
11 ARR
30L ARR
30R DEP
24 ARR
29 ARR
UNK DEP
UNK ARR
24 DEP
6 DEP
6 ARR
11 DEP
Operations by Runway 2017-2018
2018 2017

5
Airport Noise Management Annual 2018 Report
O P E R A T I O N S B Y A I R L I N E
The 2018 top twenty airlines including major carriers, regional carriers, and general aviation business jet air-craft accounted for 89.7% of all operations. Shown in the chart below are the top 18 Part 121 airlines and the top two general aviation business jets (Gamma Jets and Netjets) for 2018 and 2017. The 2018 top twenty includes eleven regional commercial passenger jet airlines. Regional jets accounted for 18.4% of the opera-tions in 2018 and 21.2% of the operations in 2017. Southwest and Frontier at St Louis Lambert Airport are the only major airlines that are not partnered with the regional airlines.
There were 92 Part 121 and Part 135 airlines that utilized St. Louis Lambert International Airport during this period. Part 121 airlines are commercial scheduled airlines with more than 30 seats and Part 135 airlines are planes with less than 30 seats.
*The Harris Airport Noise and Operation Management System (ANOMS) collects FAA air traffic data from the National Airspace System (NAS) and permanent noise monitoring data and correlates flight tracks, noise monitoring events and noise complaints. The ANOMS provides illustrative trends and should not be construed as official traffic counts.
0 10000 20000 30000 40000 50000 60000 70000 80000 90000
Southwest
American
Cape Air
Delta
GoJet (1)
Trans States (2)
Republic (3)
Air Choice One
Sky West (4)
Endeavor (5)
ExpressJet (6)
Frontier
PSA Airlines (7)
Netjets
Envoy (8)
Air Georgian (9)
Commutair (10)
Mesa Airlines (11)
Gamma Charters
United Airlines
Operations by Airlines in 2017 and 2018
2018 2017
Regional partners in 2018 with: 1. United and Delta connection 2. American and United connection 3. American, United and Delta connection 4. Alaska, Delta, American and United connection 5. Delta connection 6. United connection 7. American connection 8. American connection 9. Air Canada Express connection 10. United connection 11. United and American connection

6
Airport Noise Management 2018 Annual Report
O P E R A T I O N S B Y C A T E G O R Y O F S E R V I C E
In 2018, commercial passenger narrow body operations increased +3.9% from 2017 operations. Commercial passenger regional jets increased +2.3% from 2017. The commercial passenger propeller operations de-creased –31.8% in 2018. Cargo wide body operations increased +29.8%. General aviation business jets were up +2.3 from 2017. Military operations are filtered so most operations are not reported. Overall, opera-tions in 2018, as reported in the Harris data* were down –0.7% from 2017.
*The Harris Airport Noise and Operation Management System (ANOMS) collects FAA air traffic data from the National Airspace System (NAS) and permanent noise monitoring data and correlates flight tracks, noise monitoring events and noise complaints. The ANOMS provides illustrative trends and should not be construed as official traffic counts.
21
104551
43088
27253
1291
1920
589
11229
2025
275
1096
1094
0
108638
44080
20672
1676
1557
508
11672
2502
150
554
996
0 20000 40000 60000 80000 100000 120000
COMMERCIAL PASSENGER WIDE BODY
COMMERCIAL PASSENGER NARROW BODY
COMMERCIAL PASSENGER REGIONAL JETS
COMMERCIAL PASSENGER PROPELLER
CARGO WIDE BODY
CARGO NARROW BODY
CARGO PROPELLER
GA BUSINESS JETS
GA PROPELLER
GA HELICOPTER
MILITARY
UNKNOWN
Operations by Category of Service2017 -2018
2018 (193,005) 2017 (194,432)

7
Airport Noise Management 2018 Annual Report
O P E R A T I O N S B Y T Y P E O F S E R V I C E
Commercial Passenger, Commercial Cargo, General Aviation, and Military are the four categories of opera-tions. The Harris data* also includes unknown operations category for aircraft that were not identified by ei-ther the airline or aircraft equipment type, or both. In 2018, the largest number of operations was Commercial Passengers with 89.8% as compared to 89.9% for 2017. General Aviation had 7.4% of reported operations in 2018 compared to the 7.0% in 2017. Commercial cargo 1.9% compared to 2.0% in 2017. Reported Mili-tary operations were at 0.3% in 2018, however, military operations are filtered and not all military operations are reported in the data.
*The Harris Airport Noise and Operation Management System (ANOMS) collects FAA air traffic data from the National Airspace System (NAS) and permanent noise monitoring data and correlates flight tracks, noise monitoring events and noise complaints. The ANOMS provides illustrative trends and should not be construed as official traffic counts
17
4,9
13
3,8
00 1
3,5
29
1,0
94
17
3,4
10
3,7
21 1
4,3
24
55
4
C OM M ERC I AL P A S S ENGER
C OM M ERC I AL C A RGO GENERA L A V I A TION M I L I TARY
C OMPAR IS ON OF 2017 AN D 2018 OP E R ATIONS
2017 2018

8
Airport Noise Management 2018 Annual Report
O P E R A T I O N S B Y A I R C R A F T
Shown below are top twenty aircraft operating at St. Louis Lambert Airport in 2018 and 2017. In 2018, the Boeing 737-700 operations increased by 16.7% and the Boeing 737-800 increased by 14.2% from 2017. In 2018, the Boeing 737-800M increased from 66 operations to 1,712, almost 2500%. Six of the top ten aircraft at the Airport are operated by regional carriers. There were 233 different types of aircraft that landed at St. Louis Lambert International Airport during this period according to Harris data*.
*The Harris Airport Noise and Operation Management System (ANOMS) collects FAA air traffic data from the National Airspace System (NAS) and permanent noise monitoring data and correlates flight tracks, noise monitoring events and noise complaints. The ANOMS provides illustrative trends and should not be construed as official traffic counts.
49459
21662
19121
11424
10109
5829
6310
8184
6805
3273
4033
2431
2145
2011
2956
2016
3026
2099
66
1259
57704
24732
14526
9138
8408
7564
7292
6790
6580
4058
3333
3015
2927
2756
2633
2433
2188
1984
1712
1640
0 10000 20000 30000 40000 50000 60000 70000
BOEING 737-700
BOEING 737-800
CESSNA 402 UTILINER
EMBRAER 145
CANADAIR RJ 700
CANADAIR RJ 900
EMBRAER75L
CESSNA 208 CARAVAN
AIRBUS 319
CANADAIR RJ 200
MCDONNELL DOUGLAS MD 83
EMBRAER 45X
EMBRAER 75S
MCDONNELL DOUGLAS MD 88
AIRBUS 321
BOEING 737-900
MCDONNELL DOUGLAS MD90
CESSNA CITATION EXCEL
BOEING 737-800M
AIRBUS 320
Operations by Aircraft 2017-2018
2018 2017

9
There were 193,005 operations recorded in 2018 compared to 194,432 operations in 2017, a decrease of 0.7%. Runway utilization for Runways 12L/30R and 12R/30L was impacted by ongoing taxiway construction on Taxiways Kilo and Sierra and the rehabilitation of Runway 12L-30R during the summer and fall months. The chart below shows the total percentages of use for known runways for this period. The most utilized run-way for departures was Runway 30L (18.8%). The most utilized runway for arrivals was Runway 30R (21.5%). The crosswind runway 6-24 was the least used runway for this period. The Distribution of Traffic (Eastbound vs. Westbound ) for 2018 was 45.5% eastbound and 54.5% westbound operations.
*The Harris Airport Noise and Operation Management System (ANOMS) collects FAA air traffic data from the National Airspace System (NAS) and permanent
noise monitoring data and correlates flight tracks, noise monitoring events and noise complaints. The ANOMS provides illustrative trends and should not be con-
strued as official traffic counts
D I S T R I B U T I O N OF T R A F F I C
Airport Noise Management 2018 Annual Report
10
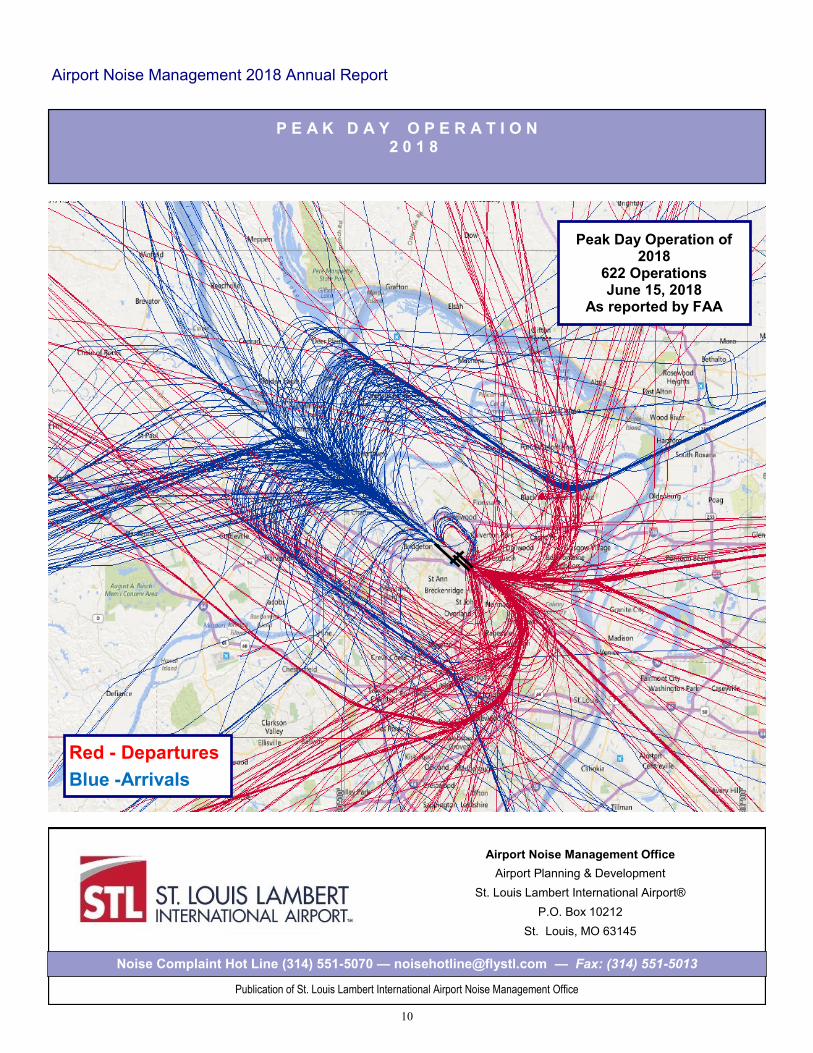
P E A K D A Y O P E R A T I O N 2 0 1 8
Airport Noise Management 2018 Annual Report
Airport Noise Management Office
Airport Planning & Development
St. Louis Lambert International Airport®
P.O. Box 10212
St. Louis, MO 63145
Noise Complaint Hot Line (314) 551-5070 — [email protected] — Fax: (314) 551-5013
Publication of St. Louis Lambert International Airport Noise Management Office
Red - Departures
Blue -Arrivals
Peak Day Operation of 2018
622 Operations June 15, 2018
As reported by FAA