airlines research final report
TRANSCRIPT

Beijing Normal University – Hong Kong Baptist University
United International College
A Study on University Students’ Preference for choosing the Domestic Airlines for Returning
Home: Taking UIC & BNU Students as Examples
Business Research Report
BY
1130600027 FENG Jing ACCT
1130600039 HU Jing ACCT
1130600098 NAN Shu ACCT
1130600156 XU Ziyang ACCT
1130600159 YANG Anqi ACCT
Business Research Method (2)
Submitted to
Dr. Angela Ma
2013/11/26

2
Acknowledgement
Special thanks go to supervisor Dr. Angela MA for her guidance. It is our great
pleasure to express our sincere gratitude and thankfulness to our dearest lecturer Dr.
Angela MA for her kind and patient support throughout the research process. She
devoted her valuable time and efforts to guide us in conducting the research. The
whole group of us would like to express our appreciation to Dr. MA for her
generous help in directing our ways towards the success of this project.
Moreover, we would like to give special thanks to all the participants and
respondents being involved in the research, who had spent their valuable time in
filling out the questionnaires. We really appreciated their hard working and
cooperation.
3
CONTENT
Acknowledgement .......................................................................................................................... 2 1. Title and Executive Summary (YANG Anqi, 1130600159) ....................................................... 5 2. Introduction ................................................................................................................................. 7
2.1 Statement of Problem: Background (YANG Anqi, 1130600159) ...................................... 7 2.2 Importance of DV and IV (NAN Shu, 1130600098) ......................................................... 7 2.3 What is Missing or Gap (HU Jing, 1130600039) .............................................................. 8 2.4 Objective of Our Study to Bridge the Gap (YANG Anqi, 1130600159; XU Ziyang,
1130600156) ............................................................................................................................ 8 3. Literature Review...................................................................................................................... 10
3.1 Dependent variable (DV) (FENG Jing, 1130600027) ..................................................... 10 3.1.1 Definition ............................................................................................................... 10 3.1.2 UIC students........................................................................................................... 10 3.1.3 BNU students ......................................................................................................... 10 3.1.4 Preference ...............................................................................................................11 3.1.5 Airlines ....................................................................................................................11 3.1.6 Purpose ....................................................................................................................11
3.2 Independent Variable Definition (NAN Shu, 1130600098; XU Ziyang 1130600156).... 12 3.2.1 Accident Rate (XU Ziyang, 1130600156) ............................................................. 14 3.2.2 Brand Name and Reputation (XU Ziyang, 1130600156) ...................................... 16 3.2.3 Service Level (XU Ziyang, 1130600156) .............................................................. 17 3.2.4 Punctuality (NAN Shu, 1130600098) .................................................................... 19 3.2.5 Price (HU Jing, 1130600039) ................................................................................ 19
3.3 Moderating variable (MV) ............................................................................................... 21 3.3.1 Definition (FENG Jing, 1130600027) ................................................................... 21 3.3.2 Frequent Flier Experience (FENG Jing, 1130600027) .......................................... 21
4. Conceptual Framework and Hypotheses .................................................................................. 22 4.1 Framework (HU Jing 1130600039) ................................................................................. 22 4.2 Accident Rate (XU Ziyang, 1130600156) ....................................................................... 23 4.3 Reputation and Brand Name (NAN Shu, 1130600098) .................................................. 23 4.4 Service Level (XU Ziyang, 1130600156) ........................................................................ 23 4.5 Punctuality (NAN Shu, 1130600098) .............................................................................. 24 4.6 Price (HU Jing, 1130600039) .......................................................................................... 24
5. Research Mode Procedures/Methodology ............................................................................... 24 5.1 Subjects (HU Jing, 1130600039) ..................................................................................... 24 5.2 Sampling and Data Collection (YANG Anqi, 1130600159, HU Jing, 1130600039)....... 25 5.3 Methods (XU Ziyang, 1130600156) ................................................................................ 26
6. Data Results and Analysis (XU Ziyang, 1130600156) ............................................................ 28 6.2 Data Analysis ................................................................................................................... 29
6.2.1. Accident Rate ........................................................................................................ 30 6.2.2 Brand Name ........................................................................................................... 30 6.2.3 Service Quality....................................................................................................... 31 6.2.4 Punctuality ............................................................................................................. 31 6.2.5 Price ....................................................................................................................... 31
4
6.3 Comparison of UIC & BNU Data .................................................................................... 31 6.3.1 Differences Analysis and Findings ........................................................................ 31
7. Discussion ................................................................................................................................. 32 7.1 Accident Rate (HU Jing 1130600039) ............................................................................. 32 7.2 Brand Name (NAN Shu 1130600098) ............................................................................. 33 7.3 Service Quality (XU Ziyang 1130600156) ...................................................................... 33 7.4 Punctuality (NAN Shu 1130600098) ............................................................................... 34 7.5 Price (HU Jing 1130600039) ........................................................................................... 35 7.6 Implications (FENG Jing, 1130600027) .......................................................................... 36 7.7 Limitation and Further Research (FENG Jing, 1130600027) .......................................... 37
8. Conclusion (FENG Jing, 1130600027) ..................................................................................... 38 9. Reflection .................................................................................................................................. 38 Reference ...................................................................................................................................... 40 Appendix 1 Measurement Table (XU Ziyang, 1130600156) ........................................................ 44 Appendix 2 Framework Literature Review (HU Jing 1130600039) ............................................ 46 Appendix 3 Questionnaire (English) ............................................................................................ 47 Appendix 4 Questionnaire (Chinese version) ............................................................................... 49
LIST OF ILLUSTRATION
Figures Figure 1 .Conceptual Framework Illustration ............................................................................... 22
Tables Table 1 .Overall Literature Review of Independent Variables ...................................................... 12 Table 2 .Literature Review of Accident Rate ................................................................................ 15 Table 3 .Literature Review of Brand Name and Reputation ......................................................... 16 Table 4 .Literature Review of Service Level ................................................................................ 18 Table 5 .Literature Review of Punctuality .................................................................................... 19 Table 6 .Literature Review of Price .............................................................................................. 20 Table 7 .Regression Model Variables ............................................................................................ 26 Table 8 .Descriptive Statistics ....................................................................................................... 28 Table 9 .Cronbach's Alpha for Questions ...................................................................................... 28 Table 10 .ANOVA ......................................................................................................................... 29 Table 11 .Model Summary ............................................................................................................ 29 Table 12 .Coefficients ................................................................................................................... 29 Table 13 .Coefficient Differences between UIC and BNU Data .................................................. 31
5
1. Title and Executive Summary (YANG Anqi, 1130600159)
The full and official title of the research is:
A Study on University Students’ Preference for Choosing the Domestic Airlines for Returning
Home: Taking UIC & BNU Students as Examples.
This research has examined customer preference on the purpose of returning home in
selecting domestic airline companies among students in both BNU and UIC. The study has
demonstrated a model that combing the affecting factors such as price, accident rate, brand,
service quality and punctuality in order to indicate how these five factors influenced customer
preference and to what extent did they affect in selecting different domestic airline companies by
college students both in BNU and UIC.
Researchers applied a non-probability sampling method in conducting this research due to
the limited time, budget and resources. 300 students from both BNU and UIC participated in the
research and finished the questionnaires, either answered directly on the questionnaires
distributed (see Appendix 3, P49-50) or filled out the online questionnaires (see Appendix 4,
P50-51). In order to make participants easier to understand each question and collect more
accurate information, researchers also patiently translated the language in the questionnaires
from English to Chinese.
The research results were as followed. The reclaiming rate of all questionnaires was 82.67%
(248 valid out of 300 copies). A multiple regression model approach was used to assess the
relative importance and strength among the five affecting factors from accident rate, brand,
service level, punctuality to price individually. The research results indicated that the overall
model fitted the data well.
Combined with the predecessors’ research, the research result suggested that one of the five
affecting factors, the brand name, had the strongest correlation with customer preference in
selecting domestic airline companies. Under the guidance of a rigid conceptual framework (see
Figure 1, P21) and rational reasoning, it was inferred that the other three factors, including
accident rate, service quality and punctuality, all had positive relevance with customer preference

6
for domestic airline companies. There was one interesting but important fact that the price factor,
predicted by the researchers suggesting that it should be the strongest affecting factor in college
students’ selection, actually was not so relevant to customer preference in the research.
Overall, the findings confirmed the significance of integrating the five factors, accident rate,
brand, service level, punctuality and price, in affecting customer preference of college students in
both BNU and UIC in choosing domestic airline companies for the purpose of going home. The
theoretical and methodological implications of these results for the study and demonstrations of
customer preference for domestic airline companies were discussed later in the report.
INDEX WORDS: Customer preference, Domestic airline companies, Returning home purpose,
Accident rate, Brand, Service level, Punctuality, Price, Students in BNU and
UIC.
7
2. Introduction
2.1 Statement of Problem: Background (YANG Anqi, 1130600159)
There were two major reasons that raised the researchers’ interests on the topic that was
relating college students with airline companies. The first one is from the experiences of the
researchers’ peer members. Some of them took planes for home in a regular basis. They might
have preferences among different companies but they did not realize it or pay attention to it.
Therefore, the great potential was yet to discover. Also the further reason came from the
literature review conducted by researchers. With the rapid economic development in China and
the accelerating progression in the aviation industry (Zhang & Cao & Du & Cai, 2010), more and
more people began to choose the air transportation as one of the alternatives for travelling. Also,
the emergence of the Chinese middle class strengthened the need for airlines when people
prepared for going home. As indicated by Moonkyu and Lawrence (2001), compared with
normal airline companies, the airline companies with strong customer preference could keep
ahead of the competitions in the airline market and generate profit consistently. Therefore, it was
significant for airline companies to figure out how to obtain more customer preference in order
to raise profits consistently. Combined with the two main reasons, this research aimed at
discovering college students’ customer preference in selecting domestic airline companies for the
purpose of going home.
2.2 Importance of DV and IV (NAN Shu, 1130600098)
The airline industry has evolved rapidly in recent decades. It was a luxurious form of travel
in the early of the last century but has become one of the most common methods of travel today
(Huiling Chen & Peng & Hackley, 2008). College students were the potential consumer sectors
and main consumers in the future market place, so their consumption behaviors and preferences
were essential to airline companies. Thus, realizing the reasons behind college students’
preference on airline companies could be crucial to build and improve long-term relationships
between customers and airline industry. The purpose and contribution of this research was to
analyze and discover what factors would contribute to customer preference on airline by

8
studying UIC and BNU students’ preference.
Identifying the expectations of airline service users was one way to find out the customers'
satisfaction (Natalisa & Subroto, 2003). One of the major factors of customer satisfaction was
service level. In addition, Safety’s influence on customer satisfaction was found to be statistically
significant for travelers, which according to Ringle, Sarstedt, and Zimmermann (2011), the
occurrence of accidents could not be eliminated completely and passengers were aware of this
fact. Additionally, price could also easily influence students’ choice on airlines. Air China has
developed the strategies to manage the passenger perception and one of the prior criteria was
price (Shahin & Zairi, 2009).
2.3 What is Missing or Gap (HU Jing, 1130600039)
There were many gaps that researchers found in the prior report. First, by doing literature
review, most of the data were collected and comparative from many countries, such as Thailand,
America, Indonesia and China. Therefore, it was hard to find a research about airlines for a
specific country. Second, most reports did not specify a clear relationship between the preference
of college students among different airlines and the inferential factors, which would be the main
topic of this research. Third, many articles concentrated on reporting the inferential factors on
customers’ preference for one specific airline but it missed the real reasons behind the preference
of customers when they have more than one choice. Additionally, most of the researches were
focused on the business purpose while seldom of them reflected the real story of college students’
preference on returning home purpose. Furthermore, many research data and conclusions in the
literature were integrated about ten years ago. However, as time went by, people’s perception
towards airlines might change, therefore the update of data and conclusion was quite necessary.
2.4 Objective of Our Study to Bridge the Gap (YANG Anqi,
1130600159; XU Ziyang, 1130600156)
The research intended to figure out the reasons that were affecting customer preference of
students in both BNU and UIC students in choosing domestic airline companies for the purpose

9
of returning home. The ideal research subjects of the study should be a variety of college
students with a need to take planes for home, having certain consumption capacity (the students
would not worry too much about the ticket price because they could receive enough money
regularly from their parents). According to researchers’ understanding, students in both BNU and
UIC are the appropriate college students with similar consumption desire and capacity. Therefore,
the research kept focusing on the customer preference of students in both BNU and UIC.
Furthermore, the research also discovered the students’ consumption fondness among different
domestic airline companies in the current market. Students in both BNU and UIC are the
potential consumers at present because they were still studying in college and they were not
habitual and regular consumers. Nevertheless, the consumption behaviors of these students, to
some extent, could be a good conjecture for representing their purchase behavior in the future
marketplace. Therefore, the consumption behaviors and preferences of the students were
essential to airline companies. College students' preferences could have some influence on
guiding and directing airline companies to make accurate strategies and develop strong customer
preference from them. In this way, airline companies could generate profits consistently.
Considering the gaps mentioned above, the researchers mainly focused on two particular
colleges sharing the geographical proximity, UIC and BNU. Additionally, it was worthwhile to
conduct this research in describing the relationship between customer preference of college
students and the inferential factors that were affecting their choices thoroughly and clearly.
Furthermore, the research has provided several alternatives of domestic airlines for participants
to choose, in order to reduce the bias toward one specific airline company to a great extent. The
research result would also become more widespread and valuable. In addition, the purpose of
selecting the airline companies had narrowed down to home returning purpose, which has
significant seasonal effects among airline companies. Last but not least, the research was
intended to renew the data as most of the research, which was about ten to fifteen years ago.
10
3. Literature Review
3.1 Dependent variable (DV) (FENG Jing, 1130600027)
3.1.1 Definition
Dependent variable is a synonym of criterion variable (Cooper & Schindler, 2011). The
variable is the studied property. Dependent means the property will act as an outcome, which
will be influenced by the independent variables (Cooper & Schindler, 2011). In this research, the
dependent variable is UIC students’ preference on airlines. A well-defined dependent variable is
critical for an accurate research. Thus, the different sections of the dependent variable will be
discussed in further detail in the subsequent report separately.
3.1.2 UIC students
By referring to United International Collage (UIC) students in the research, only students
with intention or experience of flying were included, and exchange students who stay in UIC for
only two years or less were excluded.
The purpose of including students with intention or experience of flying only was to reduce
the incident rate of the response and ensured the subject of the research is relevant (Cooper &
Schindler, 2011).
The reason of excluding exchange students was that, exchange students lack some
characteristics that other UIC students have, which were critical for this research. For instance,
UIC students come from all over China, which created the need and intention of long distance
travel between campus and their hometown during long holidays.
3.1.3 BNU students
BNU is short for Beijing Normal University Zhuhai, which were one of the UIC’s united
schools and the other studied subject source of this research. BNU had similarities with UIC in
the following characteristics, like students came from all over China and they needed to consider
the way to travel between home and school. However, BNU was different from UIC in the style

11
of schooling, collage entrance score and school fee.
In this research, by referring to BNU students, only full time college students with intention
or experience of flying were included, and students from subsidiary school of BNU were
excluded.
By comparing UIC students with BNU students, factors contributing to the preference of
airline were able to be distinguished.
3.1.4 Preference
According to the findings of Slovic (1995), customers choosing a specific company’s
product or service instead of other companies indicate preference. Thus, in this case, the
tendency of UIC students’ fondness in choosing one airline instead of other airlines was the
subjects’ preference.
3.1.5 Airlines
Here, airlines indicated China airline companies that provide domestic flights for
passenger with regular price, excluding low cost airlines.
Some of the examples for the airlines were China National Aviation Corporation, China
Eastern Airline, Cathay Pacific Airways and China Southern Airline.
3.1.6 Purpose
During the research, the home returning purpose of flying was considered to be a
precondition.
By referring to home returning purpose, it meant what was researched was the preference of
choosing airlines for flights between students’ home and school. It was because home and school
trips are students’ most frequent and common flights and grasped most people’s concern.

12
3.2 Independent Variable Definition (NAN Shu, 1130600098; XU
Ziyang 1130600156)
According to Cooper and Schindler (2011) the variables changed or manipulated by the
researchers, consequently causing a difference on dependent variable was called independent
variable (IV).
The literature review below indicated that accident rate, service quality, brand name and
punctuality, which were highlighted, were the mayor factors that influence customer satisfaction
of airlines, which subsequently affect the customer preference on airline. Price was another vital
factor that influences the preference on airline directly.
Therefore, those five factors are selected as independent variables.
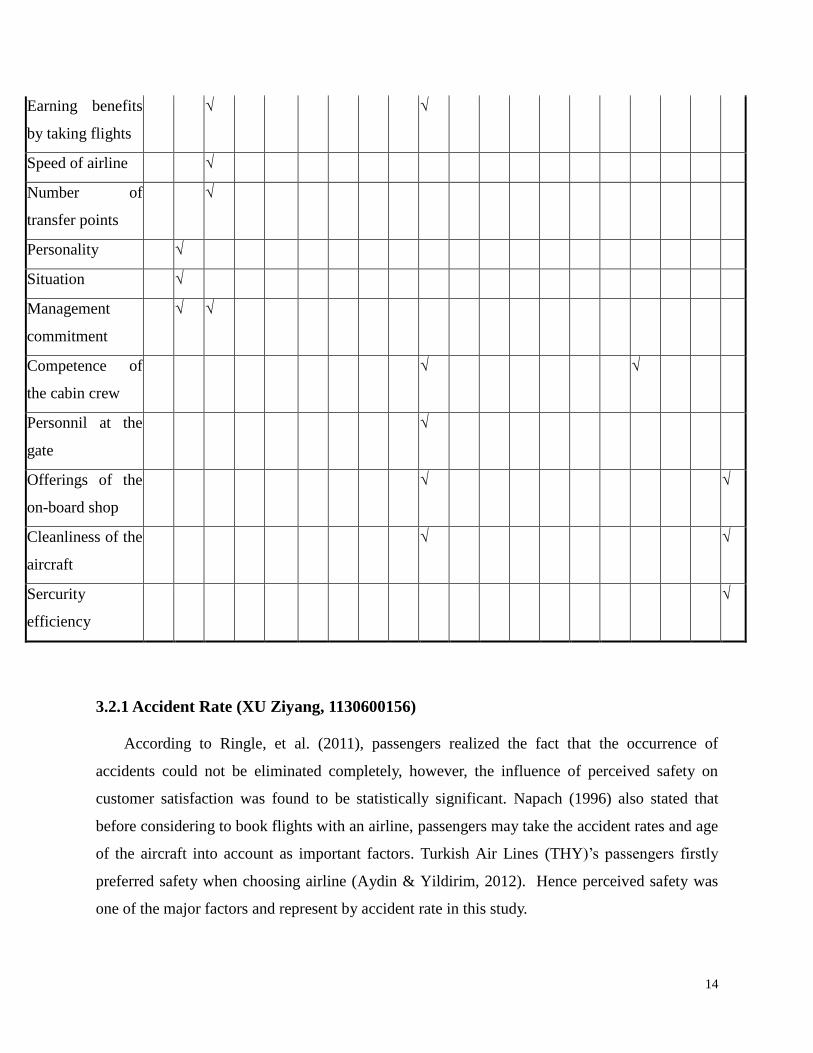
Table 1 .Overall Literature Review of Independent Variables
San
tiag
o,R
oma
n,Ja
vier
Dia
hNa
talis
a,B
udia
rtoS
ubr
oto
(Hu
ilin
g
Che
n &
Pen
g &
Hac
kley
Ber
ry ,
Par
asur
ama
n
Aras
hSh
ahin
a,
Moh
ame
d
Zairi
ba
Cha
ffey
Sky
trax
Chi
ng-
fu
Che
n,
We
n-
Shi
ang
Tse
ng
Zeit
ham
l,Bit
ner
Chr
istia
n
M,
Mar
ko
s,
Lor
enz
Par
k ,
Srin
ivas
an
Her
zber
g,
Ma
usn
er,
Sny
der
man
Atal
ikoz
el,
Gil
bert
,
Wo
ng
Satt
ler
et al
Kell
er
Cob
b-
wal
gre
n,
Rub
le,D
ont
hu,
Yoo
and
Don
thu
Hai
r,
Rin
gle,
Sars
tedt
Den
g
Tay
lor,
S.,
&
Cla
xto
n, J.
D.
Sru
ll
Price √ √ √ √
Accident rate √ √ √ √ √ √ √
Service quality √ √ √ √ √ √ √ √ √
Brand √ √ √ √ √ √ √

13
Punctuality √ √ √ √
Complaints
efficiently
√ √
Boarding
procedure
√ √ √
Baggage arrive
on time
√ √
Airline food
service
√ √ √ √ √
having friendly
assistance
√ √
Integrity,continuit
y, accuracy
√
Quality of in-
flight
entertainment
√ √ √
Plane model √ √
Priority of
executive club
members
√ √
Frequent flyer
mileage
√ √
Staff attitude √ √ √
Seat allocation √
Purpose of the
trip
√ √
web service √
Seat comfort √ √
Sprcial discount
on student tickets
√ √
14
Earning benefits
by taking flights
√ √
Speed of airline √
Number of
transfer points
√
Personality √
Situation √
Management
commitment
√ √
Competence of
the cabin crew
√ √
Personnil at the
gate
√
Offerings of the
on-board shop
√ √
Cleanliness of the
aircraft
√ √
Sercurity
efficiency
√
3.2.1 Accident Rate (XU Ziyang, 1130600156)
According to Ringle, et al. (2011), passengers realized the fact that the occurrence of
accidents could not be eliminated completely, however, the influence of perceived safety on
customer satisfaction was found to be statistically significant. Napach (1996) also stated that
before considering to book flights with an airline, passengers may take the accident rates and age
of the aircraft into account as important factors. Turkish Air Lines (THY)’s passengers firstly
preferred safety when choosing airline (Aydin & Yildirim, 2012). Hence perceived safety was
one of the major factors and represent by accident rate in this study.

15
Aviation Week and Space Technology (2002) has stated that although decreasing number of
accidents were reported, the general aviation accident rate in 2001 increased to 6.56 per 100,000
flight hours from 6.33 in 2000. The general airline accident rate was 7.05 per 100,000 flight
hours in 1999 (GA Accident Rate Hits Historic Low, 2001).
In this research report accident rate was define as a number of 100,000 flight hours of
Chinese airlines.
Table 2 .Literature Review of Accident Rate
Reference Factors Investigated Method Result
Ringle, C. M.,
Sarstedt, M., &
Zimmermann, L.
Customer Satisfaction
with Commercial
Airlines: The Role of
Perceived Safety and
Purpose of Travel.
Structural
equation
modeling
Perceived safety had
great impact on overall
customer satisfaction,
especially for leisure
travelers
Aviation Week
& Space
Technology
Award presentation Descriptive
Statistics
The achievements by
individuals and teams
across the international
fields of aviation,
aerospace, and
defense.
GA Accident
Rate Hits
Historic Low
Fixed-wing aircraft;
Accident and fatality rate
per flight hours;
Plans of the Air Safety
Foundation for an
education program
Descriptive
Statistics
Three factors that
resulted to accidents
Napach, B
(1996)
A rough gauge of airline
safety.
Descriptive
Statistics
Accident rates and
aircraft age were
important factors
16
Aydin, K., &
Yildirim, S.
(2012).
MEASUREMENT OF
SERVICE QUALITY
Correlation
Analysis
THY’s passengers
preferred safety as
their first preference
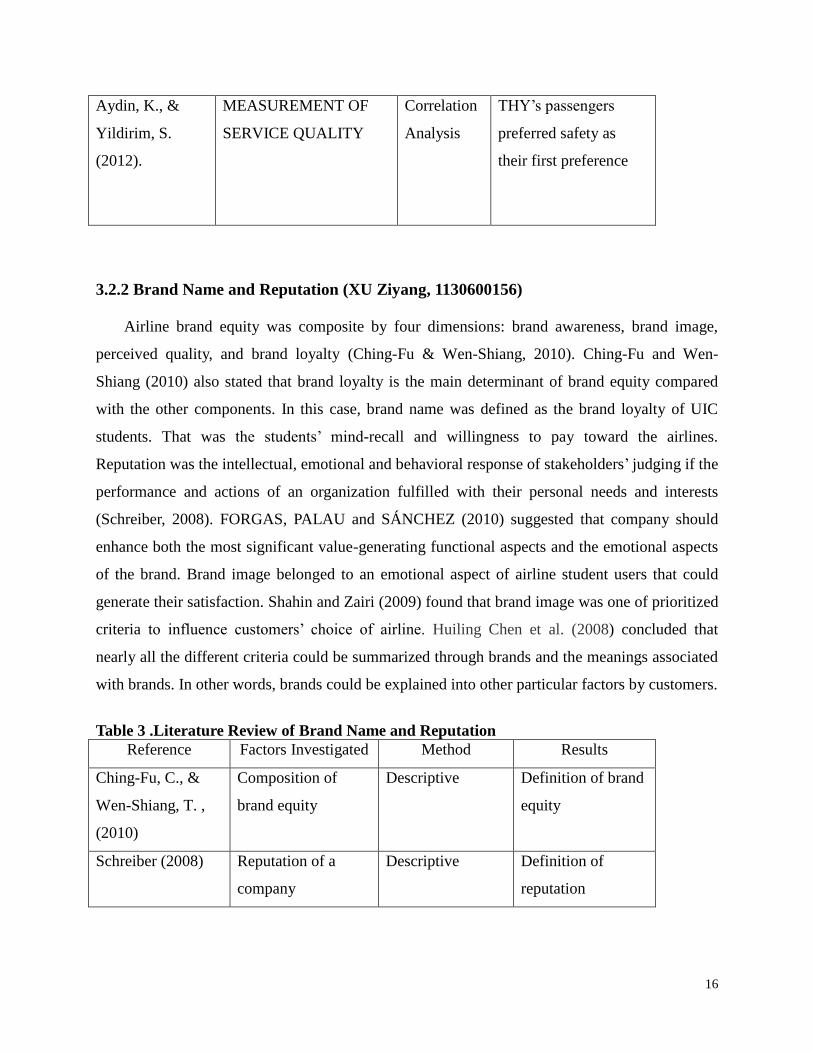
3.2.2 Brand Name and Reputation (XU Ziyang, 1130600156)
Airline brand equity was composite by four dimensions: brand awareness, brand image,
perceived quality, and brand loyalty (Ching-Fu & Wen-Shiang, 2010). Ching-Fu and Wen-
Shiang (2010) also stated that brand loyalty is the main determinant of brand equity compared
with the other components. In this case, brand name was defined as the brand loyalty of UIC
students. That was the students’ mind-recall and willingness to pay toward the airlines.
Reputation was the intellectual, emotional and behavioral response of stakeholders’ judging if the
performance and actions of an organization fulfilled with their personal needs and interests
(Schreiber, 2008). FORGAS, PALAU and SÁNCHEZ (2010) suggested that company should
enhance both the most significant value-generating functional aspects and the emotional aspects
of the brand. Brand image belonged to an emotional aspect of airline student users that could
generate their satisfaction. Shahin and Zairi (2009) found that brand image was one of prioritized
criteria to influence customers’ choice of airline. Huiling Chen et al. (2008) concluded that
nearly all the different criteria could be summarized through brands and the meanings associated
with brands. In other words, brands could be explained into other particular factors by customers.
Table 3 .Literature Review of Brand Name and Reputation
Reference Factors Investigated Method Results
Ching-Fu, C., &
Wen-Shiang, T. ,
(2010)
Composition of
brand equity
Descriptive Definition of brand
equity
Schreiber (2008) Reputation of a
company
Descriptive Definition of
reputation

17
FORGAS, PALAU
and SÁNCHEZ.
(2012)
Whether brands of
image generates
value for the airline
user
Brands of image
should be taken
into account by
airline company
Huiling Chen, Peng
and Hackley (2008)
The role of brands. Descriptive Those significant
criteria could be
summarized
through brands
Shahin and Zairi,
(2009)
The importance of
brands
Brand image is one
of prioritized
criteria
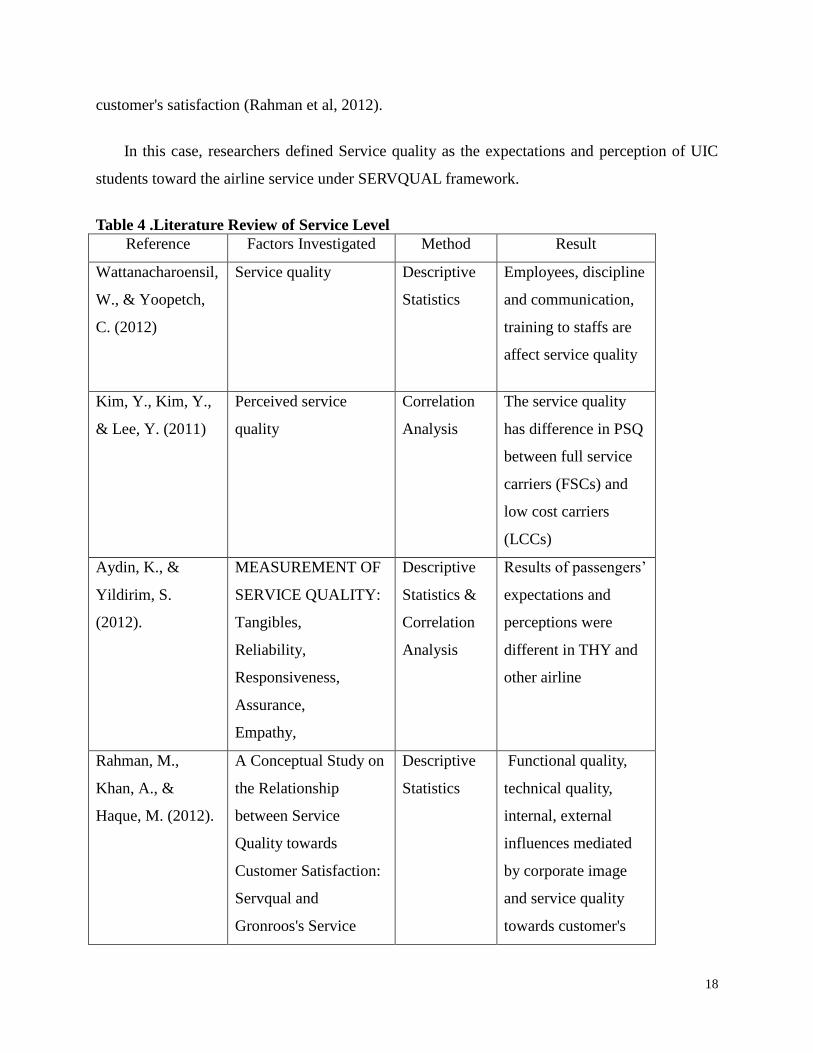
3.2.3 Service Level (XU Ziyang, 1130600156)
Kim, Kim and Lee (2011) stated that perceived service quality (PSQ) had been illustrated to
affect many important outcomes, such as customer satisfaction and customer loyalty in a
competitive environment and become one of the most important reasons for customers to choose
an airline. Service quality was achieved by fostering greatly capable human resources in overall
operations and was one of the most important factors in obtaining a competitive advantage for
airlines (Wattanacharoensil & Yoopetch, 2012).
In THY, passengers’ expectations and perceptions of airline service level generally were
similar while the result was different in other Turkish airline firms (Aydin & Yildirim, 2012).
According to Aydin and Yildirim (2012), service quality could be measured by how well the
service level provided matches expectations of customers. A service quality framework, called
SERVQUAL, was widely accepted of measuring service quality and we would like to use the
framework in the study.
The SERVQUAL could be expressed in the perspective of functional quality, technical
quality, internal, external influences mediated by corporate image and service quality towards
18
customer's satisfaction (Rahman et al, 2012).
In this case, researchers defined Service quality as the expectations and perception of UIC
students toward the airline service under SERVQUAL framework.
Table 4 .Literature Review of Service Level
Reference Factors Investigated Method Result
Wattanacharoensil,
W., & Yoopetch,
C. (2012)
Service quality Descriptive
Statistics
Employees, discipline
and communication,
training to staffs are
affect service quality
Kim, Y., Kim, Y.,
& Lee, Y. (2011)
Perceived service
quality
Correlation
Analysis
The service quality
has difference in PSQ
between full service
carriers (FSCs) and
low cost carriers
(LCCs)
Aydin, K., &
Yildirim, S.
(2012).
MEASUREMENT OF
SERVICE QUALITY:
Tangibles,
Reliability,
Responsiveness,
Assurance,
Empathy,
Descriptive
Statistics &
Correlation
Analysis
Results of passengers’
expectations and
perceptions were
different in THY and
other airline
Rahman, M.,
Khan, A., &
Haque, M. (2012).
A Conceptual Study on
the Relationship
between Service
Quality towards
Customer Satisfaction:
Servqual and
Gronroos's Service
Descriptive
Statistics
Functional quality,
technical quality,
internal, external
influences mediated
by corporate image
and service quality
towards customer's

19
Quality Model
Perspective.
satisfaction.
3.2.4 Punctuality (NAN Shu, 1130600098)
Punctuality meant the completion according to the flight schedule (Mallon & Mulligan, 1993).
Company’s planes arrive and leave punctually within the range of delaying less than 15 minutes.
Punctuality was being increasingly frequent words when student users talking about airline.
Airline users concerned much about punctuality in both takeoff and baggage service (FORGAS,
et al., 2012). The fundamental of the basic needs of passengers were the safety, getting the
luggage to the right place, and punctuality, which meant that punctuality, was such an important
factor that it became a necessary requirement. Taylor and Claxton (1994) found that the delay
affected other service attribute evaluations. In fact, delay was one of the most complaints and
student travelers frequently pay attention to it.
Table 5 .Literature Review of Punctuality
Reference Factors Investigated Method Results
Mallon &
Mulligan (1993)
Punctuality of airline Descriptive Definition of
punctuality
FORGAS,
PALAU and
SÁNCHEZ.
(2012)
Airline passengers
perceived value
Descriptive Punctuality in both
takeoff and baggage
service was crucial
to passengers
Shahin, A., &
Zairi, M. (2009)
The necessity of
punctuality
Descriptive Punctuality was the
basic requirement of
customers
Taylor, S., &
Claxton, J. D.
(1994)
Complaints of delay Descriptive Delay affected other
service attribute
evaluations
3.2.5 Price (HU Jing, 1130600039)
In modern economies, prices were generally expressed in units of some form of currency.

20
Shahin and Zairi (2009) considered that price was an essential factor, which would affect
passengers’ future behavior. Jin-Woo, Rodger and Cheng-Lung (2009) also believed that price
was an influential factor, and they stated that those effects were different from country to country.
Therefore it was assumed that the perception of reasonable or low price was one of the most
critical elements that attracted customers to choose those products.
However, in one research about Indonesian airline, Natalisa and Subroto (2003) stated that
price was not the differentiating factor for the level of satisfaction and dissatisfaction of airline
for Indonesian domestic customers as 74 percent of customers were flying on business purpose,
which meant that their companies would pay their fares. As for self-paying passengers, they were,
in general, Indonesians with high income (Natalisa & Subroto, 2003). Compared with other
factors, customers did care not much about the price. Therefore, this research about the price
factor will only focus on the college students for returning purpose.
Table 6 .Literature Review of Price
Reference Factors Investigated Method Results
Natalisa, D., &
Subroto, B. (2003)
Effects that increase
customer satisfaction of
domestic Airlines in
Indonesia(personality,
situation, price and
customers’ perception)
Descriptive
Statistics &
Correlation
Analysis
price is not the
differentiating
factors for the level
of satisfaction and
dissatisfaction of
airline for
Indonesian domestic
customers
Zou, L., Oum, T.
H., & Yu, C.
(2011)
The impacts of
complementary alliance
on airfares.
Descriptive
Statistics
Price is affected by
airline alliances on
complementary
routes.
Shahin, A., &
Zairi, M. (2009)
Using the Kano model;
whether the
demographic
Correlation
Analysis
The results imply
that the demographic
characteristics of

21
characteristics of
travelers would strongly
affect the Kano quality
categorization.
travelers could
strongly affect the
Kano quality
categorization.
Munusamy, J.,
Chelliah, S., &
Pandian, S. (2011)
price, pre-flight
services, customer
relationship
management, cabin
environment and in-
flight services
Quantitative
Approach &
Correlation
Analysis
Low ticket price
does not affect
customers’
satisfaction
3.3 Moderating variable (MV)
3.3.1 Definition (FENG Jing, 1130600027)
MV is short for moderating variables. In the originally stated IV-DV relationship,
moderating variables will have a significant contributory (Cooper & Schindler, 2011). In this
research, MV has no effect on the relationship between IV and DV.
3.3.2 Frequent Flier Experience (FENG Jing, 1130600027)
Quality of past service performance is related to consumers’ perception to service level. For
those consumers with higher perceptions of quality, the causes of service failures are recognized
as less controllable by the company than the causes identified by consumers with lower
perceptions of quality. Additionally, customers took the same airline company before for several
times, may not easily change to other airline companies (Benini, 2011). Since they find the
former one satisfies their needs, even not perfectly. In this case, customers’ preference won’t be
different, even if the chosen airline’s performs poor or other airline companies perform better.
Therefore, previous experience of frequent flier not only influence satisfaction directly but
also moderates the effect of quality on satisfaction. In this case, Experience of frequent flier is
defined as perceptions of quality of the airlines which bias the UIC and BNU students to choose
22
airlines.
4. Conceptual Framework and Hypotheses
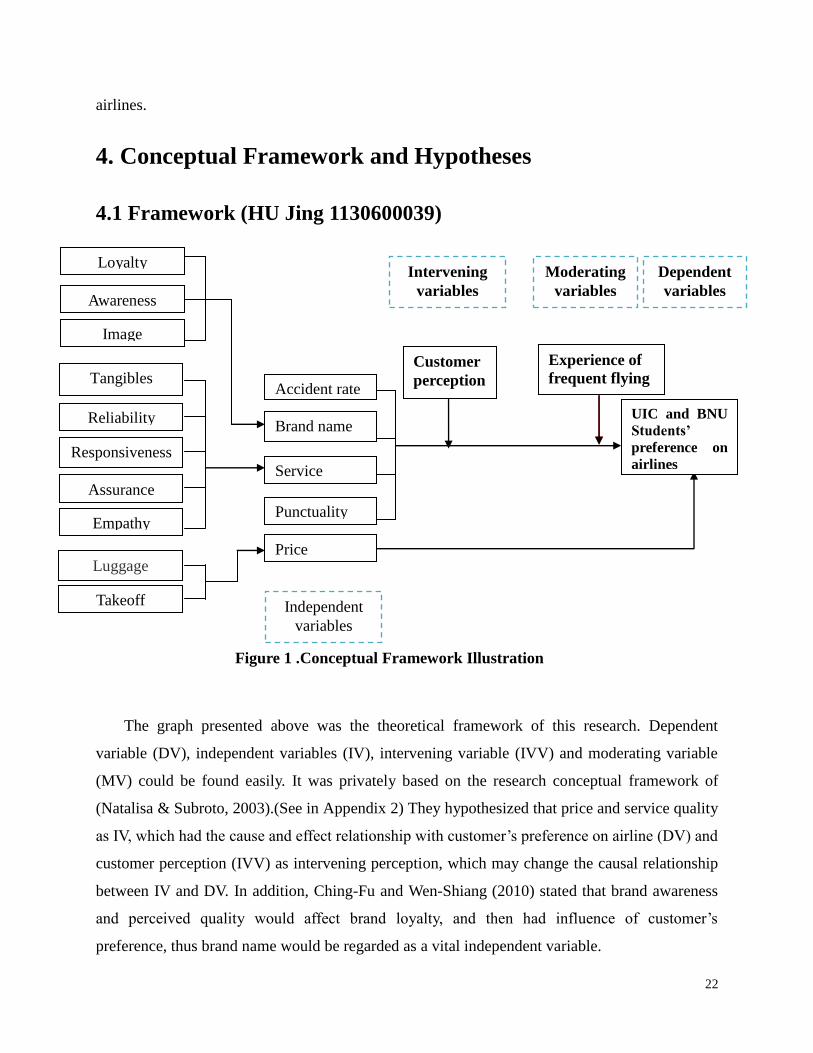
4.1 Framework (HU Jing 1130600039)
The graph presented above was the theoretical framework of this research. Dependent
variable (DV), independent variables (IV), intervening variable (IVV) and moderating variable
(MV) could be found easily. It was privately based on the research conceptual framework of
(Natalisa & Subroto, 2003).(See in Appendix 2) They hypothesized that price and service quality
as IV, which had the cause and effect relationship with customer’s preference on airline (DV) and
customer perception (IVV) as intervening perception, which may change the causal relationship
between IV and DV. In addition, Ching-Fu and Wen-Shiang (2010) stated that brand awareness
and perceived quality would affect brand loyalty, and then had influence of customer’s
preference, thus brand name would be regarded as a vital independent variable.
Price
Independent
variables
Intervening
variables
Moderating
variables
Dependent
variables
UIC and BNU
Students’
preference on
airlines
Customer
perception
Brand name
Punctuality
Service
quality
Accident rate
Assurance
Reliability
Empathy
Responsiveness
Tangibles
Luggage
Takeoff
Experience of
frequent flying
Loyalty
Awareness
Image
Figure 1 .Conceptual Framework Illustration

23
4.2 Accident Rate (XU Ziyang, 1130600156)
According to Ringle, et al (2011), the occurrence of accidents could not be eliminated
completely and passengers were aware of this fact. It was reasonable that customers prefer the
airlines with lower accident rate. Therefore, researchers proposed the hypothesis that
H1: The lower the accidental rate will have positive effect on airline preference of UIC
and BNU students.
4.3 Reputation and Brand Name (NAN Shu, 1130600098)
Shahin & Zairi found that brand image was one of prioritized criteria to influence customers’
choice of airline (2009). The brand of the airline may influence the extent of customer
satisfaction. Customers taking a popular brand name airline felt more satisfied than that of
normal brand airlines. Therefore the hypothesis was proposed that:
H2: The more popular of the brand name will have positive effect on the preference of UIC
and BNU students on airlines.
4.4 Service Level (XU Ziyang, 1130600156)
Chiang (2003) suggested that “Passengers select different airlines based on service quality,
travelers’ socioeconomic characteristics and the purpose of the trip”. It meant that service quality
would affect the passengers’ satisfaction on the airline. Also service quality had positive impacts
on relational benefit and customer loyalty in the airline industry (Chen & Hu, 2013). Therefore,
researchers proposed the hypothesis that
H3: The better the service quality provided by the airline companies the preference of
UIC and BNU students will be higher.

24
4.5 Punctuality (NAN Shu, 1130600098)
Punctuality was being increasingly frequent words when student users talking about airline.
Airline users concerned much about punctuality in both takeoff and baggage service. (FORGAS,
et al., 2012), and since punctuality was so important factor that it nearly became a necessary
requirement, the hypothesis is proposed that:
H4: the more punctual of the airline, the more the student travelers prefer to purchase it and
repurchase it.
4.6 Price (HU Jing, 1130600039)
Price was one of the prior criteria for Air China to manage the passenger perception (Shahin
& Zairi, 2009). Price could directly influence college students’ preference on choosing domestic
airlines. Therefore, the researchers proposed the hypothesis that:
H5: The lower the price will have positive effect on airline preference of UIC and BNU
students.
5. Research Mode Procedures/Methodology
5.1 Subjects (HU Jing, 1130600039)
The participants chosen by the researchers were the students (except for those exchange
students) in Beijing Normal-Hong Kong Baptist United International College (UIC) and Beijing
Normal University Zhuhai Branch (BNU). College students were one type of group customers
that would be the biggest target market in the future. Understanding factors that affect their
choices could help airlines to increase their competitiveness.
This group of students had the following major characteristics. First, a significant number of
these students were coming from other provinces, such as Xinjiang, Inner Mongolia, Heilongjiang
and so on, which meant that nearly all of them had frequent experience of flying when they

25
returned home and went to college. Additionally, UIC and BNU students preferred to return home
by plane and many of them had the ability to afford it.
5.2 Sampling and Data Collection (YANG Anqi, 1130600159, HU
Jing, 1130600039)
The sampling method that the researchers have applied was non-probability sampling
method due to the limited time, budget and resources. The researchers used the convenience
sampling method to conduct the research. In order to make the data and information more accurate
and adequate, the researchers specified more than one control dimension. It included a paper-based
questionnaire (see Appendix, P49-50) and a web-based questionnaire (see Appendix, P50-51). It
was deliberately selected 300 people in both UIC and BNU to give answers to the questionnaire.
This sample size was held appropriate for the research.
To achieve effective collection of data, the researchers has transferred the immeasurable or
hard-to-measure perceptions of service level into quantitative index and determined the qualified
questionnaire (see Appendix, P49-51). The researchers have applied the seven-point Likert Scale
method from “Strongly disagree” (select number 1) to “Strongly agree” (select number 7) to
measure participants’ opinions.
Up to the presentation day, the researchers have collected 300 questionnaires, and it included
196 females and 104 males. 150 questionnaires were distributed to the students in UIC in the
library and F204 (computer lab) and 150 questionnaires were distributed to the BNU students in
the BNU library. The participated students were coming from different grades of years, starting
from freshman, sophomore, junior to senior students. The actual amounts of each grade were 62,
84, 103 and 51 respectively. In the distributed questionnaires, 17 questionnaires were found not
completed and 35 questionnaires were found to be answered by students who have never taken
planes for home returning purpose. For instance, students from Guangdong Province did not need
to take plans for home because of geographical proximity. Therefore, these questions were invalid
and the answers were excluded from the samples. Therefore, the research results were coming
from the 248 effective and valid data out of 300 questionnaires.

26
5.3 Methods (XU Ziyang, 1130600156)
In order to test the variables affecting preference of UIC and BNU students in Zhuhai in
choosing domestic airline companies, our researchers would test the correlation coefficient
between dependent variable and independent variables, including accident rate, brand name,
service quality, punctuality and price. Among service quality factors, we would measure
tangibles, reliability, responsiveness, assurance and empathy.
As the definitions and measurements of the dependent and independent variables mentioned
above and in the Appendix 1, the regression model with one qualitative dependent variable and
six qualitative independent variables would be developed. The regression model was established
as follow:
Yi = β0 + β1 Xaccii + β2 Xbra i + β3 Xser i + β4 Xpun i + β5 Xpri i +ε i
Table 7 .Regression Model Variables
N/A β0= differential effects of factors other than accident
rate, reputation and brand name, service quality,
punctuality and price
Xaccii: accident rate β1= differential effect of accident rate
Xbra i: brand name β2= differential effect of brand name
Xser i: service quality β3 = differential effect of service quality
Xpun i: punctuality β4 = differential effect of punctuality
Xpri i: price β5 =differential effect of price
N/A ε i: Other errors
The analysis of the real data of regression model for the five factors would be processed by
the SPSS and the explanatory of the data of the hypothesis would present in the following report
with a generated ANOVA summary table.
After giving the basic information of the research, Cronbach's Alpha would be used to test
the internal consistency and error-free result of the questions for one specific factor. The
homogeneous sets of items were tested respectively. If the Cronbach's Alpha for our

27
questionnaire was computed more than the recommended threshold of 0.7, our constructs were
said to be reliable.
Testing Goodness of fit
In order to see how well the model we proposed fit with the data, the researchers needed to
find some evidence of goodness of fit. The most important test in our regression was whether β1,
β2, β3, β4, β5 is equal to zero. It would be proved step by step.
Firstly, “R-Square” would be utilized to describe to what extent the variations of the five
independent variables we listed above affecting UIC and BUN students’ preference to choose
domestic airline companies. The larger the R-Square would indicate a more significant model of
the research.
Secondly, the research group would like use F-test before using t-test, as it had overall role
for the model, to see if the five independent variables were jointly significant at 5% level
(p<0.05). If p<0.05, researchers would reject the null hypothesis and accept the alternative
hypothesis. Then researchers would test the overall significance of the regression model for the
hypothesis listed below:
H0: β1=β2=β3=β4=β5= 0
HA: H0 is not true and X and Y are linearly related. (At least one coefficient is different
from zero)
Thirdly, researchers would also use t-test and look at the p-value of each of the five
variables to figure out whether they are significant at the 5% level (p<0.05) to test H1 to H5 as
mentioned in the framework.
Last but not least, researchers would rank the five variables according to t-test and
determined which independent variable is the most significant variable that affects the preference
of choosing airline companies. Then a suggestion that match the value of this report will be
proposed in the end.

28
6. Data Results and Analysis (XU Ziyang, 1130600156)
There were 300 questionnaires distributed to our target respondents. 150 questionnaires
distributed to the students in UIC in the library and F204 according to the “convenience rule”
and 150 questionnaires distributed to the BNU students in the BNU library. After filtering the
data which were
not completed or one-side blank questionnaires, or
responses demonstrating that they didn’t take airline before, or
respondents never took airline to return home
248 out of 300 questionnaires were effective. Descriptive statistics for the data was as following
in Table 8.
Table 8 .Descriptive Statistics
Minimum Maximum Mean
Std.
Deviation N
Y 1 7 4.734 1.157 248
X1 1 7 4.901 1.035 248
X2 1 7 4.943 1.396 248
X3 1 7 3.902 1.003 248
X4 1 7 4.532 1.049 248
X5 1 7 3.721 .951 248
6.1 Reliability of the Questionnaires
The Statistical Package for Social Science (SPSS) was used to analyze the data. As shown
by the Table 9 below, the Cronbach's Alpha for all the questions were greater than 0.70, which
indicated that the measures of Customer Preference, Accident rate, Brand name, Service
Punctuality and Price were reasonably and internally consistent. Therefore the reliability was
within an acceptable range.
Table 9 .Cronbach's Alpha for Questions
Variables Question No. Cronbach's Alpha
Customer Preference Q1,Q2 .788
Accident rate Q3,Q4 .853
Brand name Q5,Q6,Q7 .816
29
Service Q8,Q9,Q10,Q11,Q12 .790
Punctuality Q13, Q14 .843
Price Q15,Q16,Q17 .779
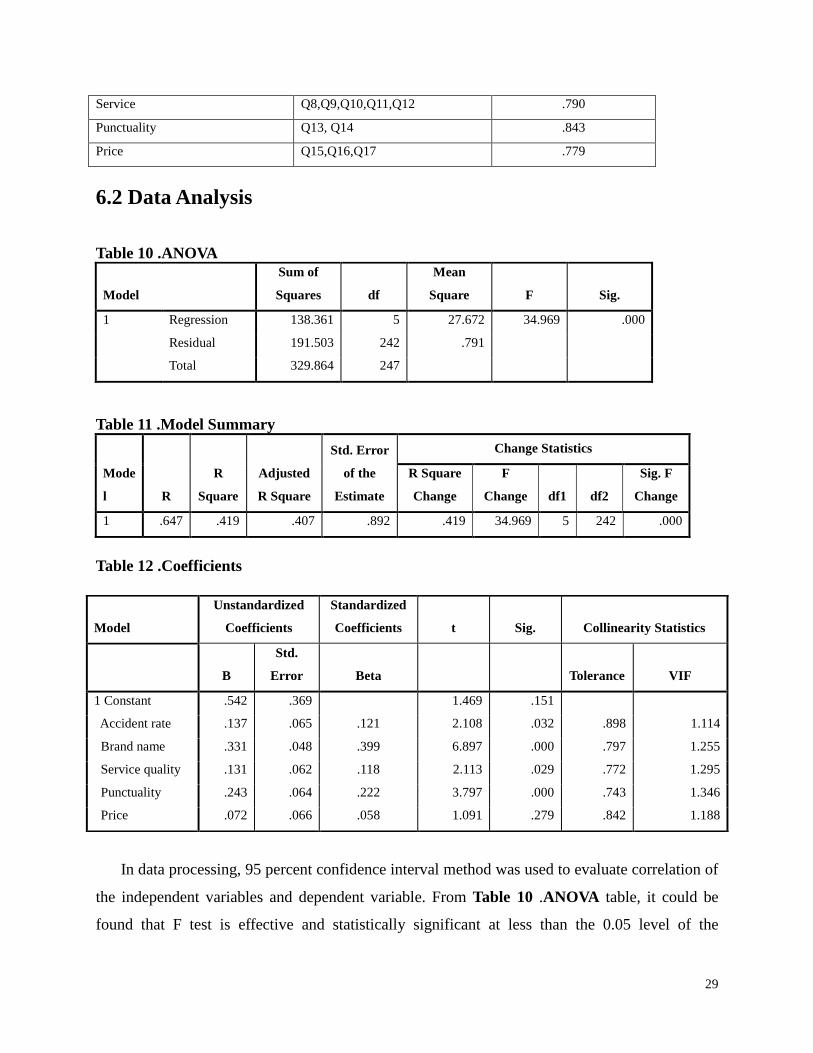
6.2 Data Analysis
Table 10 .ANOVA
Model
Sum of
Squares df
Mean
Square F Sig.
1 Regression 138.361 5 27.672 34.969 .000
Residual 191.503 242 .791
Total 329.864 247
Table 11 .Model Summary
Mode
l R
R
Square
Adjusted
R Square
Std. Error
of the
Estimate
Change Statistics
R Square
Change
F
Change df1 df2
Sig. F
Change
1 .647 .419 .407 .892 .419 34.969 5 242 .000
Table 12 .Coefficients
In data processing, 95 percent confidence interval method was used to evaluate correlation of
the independent variables and dependent variable. From Table 10 .ANOVA table, it could be
found that F test is effective and statistically significant at less than the 0.05 level of the
Model
Unstandardized
Coefficients
Standardized
Coefficients t Sig. Collinearity Statistics
B
Std.
Error Beta Tolerance VIF
1 Constant .542 .369 1.469 .151
Accident rate .137 .065 .121 2.108 .032 .898 1.114
Brand name .331 .048 .399 6.897 .000 .797 1.255
Service quality .131 .062 .118 2.113 .029 .772 1.295
Punctuality .243 .064 .222 3.797 .000 .743 1.346
Price .072 .066 .058 1.091 .279 .842 1.188

30
significance.
From Table 11 .Model Summary, the result of R square equals to 0.419, which indicated
that 41.9% of students’ preference for airline companies could be significantly interpreted by the
five independent variables including Accident rate, Brand name, Service level, Punctuality and
Price. It was a little bit lower than normal range than our expectation. The reasons why the other
58.1% could not take effect on the dependent variable may be explained by several limitations,
like the sample size was not big enough, the sampling respondents were not representative
enough or they were not willing to spend time on filling the questionnaires. The reasons also
could be some other factors researchers did not take into account in the research as the long list
illustrated from the literature review above, such as seat allocation, regional differences, and
student’s financial condition. These factors may contribute to the other 58.1%. However, four out
of five independent variables have direct effect on customers’ preference as shown in the
Coefficient table.
From Table 12 .Coefficients the constant is 0.542, the unstandardized coefficients of
accident rate, brand name, service level, punctuality and price was 0.137, 0.331, 0.131, 0.243 and
0.072 respectively and the 5-variables regression model was established as follow:
β0=0.542, β1=0.137, β2=0.331, β3=0.131, β4=0.243, β5= 0.072
Yi = 0.542+ 0.137Xacci +0.331Xbra + 0.131Xser +0.243 Xpun + 0.072Xpri +ε i
6.2.1. Accident Rate
The results indicated that there was positive correlation between accident rate and students’
preference for airline companies. The significant level was 0.032, which was less than 0.05.
Coefficient equaled to 0.137.
6.2.2 Brand Name
The results indicated that there was a strong positive correlation between brand name and
students’ preference on domestic airlines. The significant level was 0.00, which was less than
0.05. Coefficient equaled to 0.331.

31
6.2.3 Service Quality
There was a positive correlation between service quality and students’ preference on
domestic airlines. The significant level was 0.029, which was less than 0.05. Coefficient equaled
to 0.131.
6.2.4 Punctuality
The results indicated there was a strong positive correlation between punctuality and
students’ preference for airline companies. The significant level was 0.000, which was less than
0.05. Coefficient equaled to 0.243.
6.2.5 Price
There was not a significant correlation between price and students’ preference on domestic
airlines since the significant level was 0.279, which was larger than 0.05. Coefficient equaled to
0.072.
6.3 Comparison of UIC & BNU Data
6.3.1 Differences Analysis and Findings
From the 248 valid questionnaires out of 300 in total, there were 132 effective responses
from UIC students and 116 from BNU students. As the gap between the two universities was not
big and the significance of two groups of data was similar and consistent with the total data
showing above, researchers could make a comparison of the coefficient between UIC and BNU
students.
Table 13 .Coefficient Differences between UIC and BNU Data (UIC minus BNU)
Model
Unstandardized Coefficients
Difference(UIC - BNU)
Constant 0.024
Accident rate -0.046
Brand name -0.221
Service quality 0.119
Punctuality 0.026
Price 0.141

32
The Table 13 above illustrated that the coefficient differences between UIC and BNU had
certain degree of differences. The most significant difference was the brand name. The number
0.221meant that one point increase of the brand name could lead to 0.221 additional increased
for BNU students on preference on airline companies than UIC students. For BNU students, they
were more concern about the brand name. However, it was out of the researchers’ expectation
that the UIC students had 0.141 higher coefficients than BNU students on price. That meant that
UIC students were more sensitive on price when choosing an airline to return home. Natalisa and
Subroto (2003) stated that price was not the factors influencing satisfaction of customer for
official purpose in taking airlines. However, the research had found that UIC students might be
sensitive on price for returning home purpose. The reasonable interpretation suggested that UIC
students always went back home earlier than other domestic universities so that they could have
more choices in selecting airlines with lower price.
7. Discussion
7.1 Accident Rate (HU Jing 1130600039)
From the regression analysis, the accident rate had the significant level of 0.032(< 0.05), that
is, it was positively related to the preference of college students on domestic airlines. The
findings accorded with the result of the report which was proposed by Napach (1996). He
considered that before considering to book flights with an airline, passengers might take the
accident rates and age of the aircraft into account as important factors. The same conclusion was
also suggested by Aydin and Yildirim (2012). They pointed out that THY (Turkish Air Lines)’s
passengers firstly preferred safety when choosing airline. Hence it was believed that perceived
safety was one of the major factors and represent by accident rate in this study.
However, since coefficient was only 0.137, which was less than 0.2, it indicated the very
weak correlation between accident rate and customer preference. One probable reason was that
most of college students might not pay attention to the accident rate before them choosing the
airline but the researchers believed that once they had knowledge about high accident rate, it
would have a negative influence on customers’ preference. Hence the researchers set a question
as follows: “if you know some airline has a relative high accident rate, will it influence your

33
choice?” The result showed that the researcher group’s assumption was correct. The correlation
was quite strong once customers notice accident rate.
7.2 Brand Name (NAN Shu 1130600098)
The data suggested a substantially positive correlation between brand and students’
preference on airline, providing a significant level of 0.000 that far less than 0.05 and a highest
coefficient equals to 0.331.
This is good enough to match the results and analysis of Ching and Wen (2010), which
found that it was crucial to have a customer-based equity for an airline since they were highly
related. This research result was also consistent with the study carried out by FORGAS, et al.
(2012), that had discovered that people knew the good thing for them in choosing their airline
and they could name the recent airline they took as well as the favorite part of that airline, which
indicated that people had their image of airline brand and they chose them accordingly.
That sentiment was also shared by Huiling et al. (2008), who evaluated the influence on
student passengers’ purchasing behavior of airline industry. In addition, she confirmed the
importance of recommendation and word of mouth in travel industry; however, her findings also
showed that it was not without debate. In her research, some of the interviewees viewed their
brand according to airline’s name or advertisement. Nevertheless, this group of people had a
lower proportion. In this study, brand played a pivotal role in students’ preference on airline.
Went back to previous finding, Huiling et al. (2008) concluded that nearly all the different
criteria could be summarized through brands and the meanings associated with brands. This
situation was found here in researching on students in UIC and students in BNU. Both of those
students thought highly of brand name in choosing airlines since nearly all of the variables they
experienced and perceived could contribute to brand name.
7.3 Service Quality (XU Ziyang 1130600156)
The result of this research showed that service quality had positive significant correlation on
students’ preference on domestic airlines. The significant level was 0.029, which was less than

34
0.05. However, the relationship between service and student’s preference was weak, compared
with the other factors. This was consistent with the research done by Aydin and Yildirim (2012),
which concluded that there were significant differences between passengers’ expectations and
perceptions in domestic airline firms for tangibles, reliability, responsiveness, assurance and
empathy dimension.
So for the UIC and BNU students, they also had significant different perceptions on the
service quality provided by the airline companies. The reason perhaps was that the purpose was
to go back home rather than to enjoy a travel. As the service quality doesn’t had significant effect
on students’ preference, the airlines should provide average level of service quality to UIC and
BNU students for back home purpose and focus more on improving the other factors in order to
attract more customers.
According to the research, the service quality had positive impacts on customer loyalty in
the airline industry (Chen & Hu, 2013). It implied that the company could improve service to
attract brand loyal customers. As the previous finding shown, brand name had a strong effect on
customers’ preference. So to maintain or slightly improve the service quality would be more
appropriate for airlines to attract students.
7.4 Punctuality (NAN Shu 1130600098)
With respect to punctuality, the data demonstrated above indicates that punctuality has
positive correlation on students’ preference on choosing airline. The significant level is 0.000,
which is less than 0.05 and coefficient is 0.243.
This result is accord with the research of FORGAS et al. (2012). In their research, they
defined punctuality as: planes arrive and leave punctually. Also it shows that p=0.001, which is
nearly the same as the date showed above. Therefore this data well illustrated the positive
coefficient. Additionally, they measured the punctuality of baggage service. Here this type of
punctuality is not taken into account since it cannot be agreed with the most researchers, which
means it applies only under rare situations.

35
The same result can also be found in the research of delays and the dynamics of service
evaluations by Taylor and Claxton (1994). The only difference is they collected data from non-
delayed respondents and delayed respondents respectively. Both of the result indicates the
importance of punctuality on overall service evaluation. They have no difference in this point,
providing that both of them have a p<0.001.
Hence punctuality has significant effect on passengers’ evaluation on airline companies’
performance. This result is basically consistent with the literature mentioned above.
7.5 Price (HU Jing 1130600039)
Based on statistical analysis, price had no significant correlation with customers’ preference
(0.279>0.05), and this result was inconsistent with our hypothesis. In previous study, both Shahin
and Zairi (2009) and Jin-Woo et al. (2009) believed that price was an essential factor, which
would affect passengers’ future behavior. Therefore it was assumed that the lower price would
have positive effect on airline preference of UIC and BNU students in this research.
According to Kalwani and Yim (1992), if there was a difference between customers’ price
expectation and actual price, customers would consider the difference as high or low price,
which would affect consumers’ purchasing behavior. In other words, customers would consider
the price to be unacceptable if it was higher than what they expected to pay.
However, Kwanho, et al. (2012) stated that existing theory and prior research suggested that
consumers perceived purchase prices more/ less favorably when they preceded by higher/ lower
prices. That is, if customers had purchased high price air ticket before, they would have higher
degree of acceptance with the ticket prices. To combine the study of Kalwani and Yim (1992)
and Kwanho, et al. (2012), it was suggested that if customers had bought high price ticket
previously, they would have higher price expectation, thus they would be less sensitive to the
price. To be specific, the price would have less impact on their preference.
A further literature also proved the above explanation. Kalwani and Yim (1992) found that
there was an insensible range around customers’ expected price, and only if price changed out of
this range would be a significant correlation between price and customers’ preference. It was

36
possible that most of the time, even though the price is relatively high, it still within insensible
range. Consequently, there is no significant correlation that existed.
Referring to the sample the researchers selected, it was obvious that students in UIC and
BNU were at relatively high consumption level compared with others. More importantly, since a
large number of college students had no income, what they paid was actually not their own
money but the money from their financial support, say their parents, thus their price sensibility
might not be as high as the others. In addition, their previous purchasing experience could make
them have a high acceptance with price, which in return made prices have no significant
correlation with customers’ preference for UIC and BNU students.
7.6 Implications (FENG Jing, 1130600027)
This study made two major contributions. First, it supplemented and reinforced existing
literature on customer preference to domestic airline by offering integrated and systematic
contributing factors, specifically on students’ home returning purpose. Secondly, managerial
insights of airline in developing student market are provided.
After analyzing influence factors of UIC and BNU students' customer preference on
domestic airline on returning home through this research, it had been found out that brand equity
played a pivotal role in enhancing students’ preference of airlines. Also, punctuality, accident rate
and service quality were positively related to students’ preference level, whereas price did not
have significant correlation with students’ preference to airline on back home purpose.
Additionally, managerial recommendations for the airlines were provided basing on our
research:
1. Students are large potential future market to grasp, thus, forming preference to certain airline
companies among students is considered to be critical. Also, the following recommendation was
suggested basing on the intention of grasping students’ preference.
2. Brand equity is needed to be enhanced through improving its awareness, image, perceived and
loyalty (Ching & Wen, 2010).
3. Airlines companies also needed to focus on improving their punctuality by not only complying
with the flight schedule but also the baggage service (Shahin & Zairi, 2009).
4. Additionally, accident rate should be taken into consideration, even though many customers

37
seldom check an airline’s accident rate before taking their planes. However, once a bad accident
rate is known, customers’ preference will be severely hurt.
5. Service level should be improved according to the different dimensions like functional quality,
technical quality, internal, external influences mediated by corporate image and service quality
towards customer's satisfaction (Rahman, et al, 2012).
6. Price is unexpectedly proven to be less relevant to students’ preference, as long as it is within a
reasonable range.
7.7 Limitation and further research (FENG Jing, 1130600027)
As with any prior studies, the current study also had its limitations. There were four main
limitations.
Firstly, although a fairly big sample size (N=300) were studied, the samples were not
randomly selected. For the paper version, the researchers handed out their questionnaires to
whoever happened to be in the library or around them; for the web-based survey, they were
mainly distributed to the researchers’ friends who were also senior students. So the future
research may need to have a wider coverage of more universities and make sure respondents
from different grades and departments are more balanced to achieve a more accurate result.
Secondly, there may be many other factors which influence student’s preference to airline on
back home purposes. It was not practically possible to incorporate all the variables in a single
study, so it would be appropriate to extend this study by developing a more extensive model in
future studies. For example, future research can also examine whether plane model, flight seat,
purpose of the trip (which was limited in home returning purposes, and can be extended), web
service, had any influence on students’ preference on airline.
Thirdly, the current research just focused on UIC and BNU students, so the generalizability
of this report’s results may be limited. Further research may include respondents at all ages, local
and positions to increase the generalization power of research.
Additionally, there was a limitation on the measurement of some variables. The
measurement only selected one or two questions from previous studies to represent one
independent variable, which made the questionnaires not as comprehensive as the studies. There
may also be some bias and errors existed in the measurement process, because some of the

38
measurement questions used cannot reflect people’s conditions, like qualitative factors,
completely.
Finally, this study was a single cross-sectional study, but to determine the causal paths of
studied variables, multiple cross sectional studies or a longitudinal study might be more
appropriate and comprehensive.
8. Conclusion (FENG Jing, 1130600027)
Human beings have been dreaming to travel in air for decades, and shortly after the
introduction of civil aviation, aviation industry developed substantially. Though it was
considered to be luxury consumption before to take an airplane, it gets more and more popular
not only among rich people but also ordinary citizens. Also, nowadays, students attend colleges
far away from their home town, which made the demand of taking plane grows gradually and
close to students’ daily life.
Under the driving of research purposes, supplemental literature review were done, and based
on the findings, five IVs, which were brand, service level, punctuality, accident rate and price,
were selected basing on both literature reviews and the practical situation.
The substantial research supported most of the projected hypothesis, and rejected some of
them; for instance, the prominent influence of brand equity to students’ preference, and the
rejected relationship between price and preference.
All research results were analyzed carefully and implication were provided according to
those inspiring result that which areas airline managers should pay attention to.
Airline industry is still growing in a challenging market with plenty of opportunities for
future development. From this study, the researchers hoped the results can provide insights for
the airline managers and help further grow the industry.
9. Reflection
By the end of this report, all group members had learnt a lot, not only for preferring the
report itself.
From the very beginning, topic selection had already brought out many challenges, for
knowing the significance of choosing a good topic. Airline preference happened to be many
students’ concern when going back home. There came this research’s topic.

39
However, conducting the research was also challenging, from choosing suitable IVs,
forming a refined framework, sending questionnaires and analyzing the statistics. Difficulties
were various, like the lack of corresponding knowledge, misunderstood of the newly learnt
concepts, not to mention that some fatal error which results in the second collection of
questionnaires.
Conclusively, this research experience was precious and it enhanced the researchers’
understanding of the knowledge and the subject itself. Additionally, many kind of knowledge,
both inside text book and outside text book had been learnt, understood and practiced.

40
Reference
Anderson, S., Klein Pearo, L., & Widener, S. K. (2008). Drivers of Service Satisfaction: Linking
Customer Satisfaction to the Service Concept and Customer Characteristics. Journal Of
Service Research, 10(4), 365-381. doi:10.1177/1094670508314575
Aydin, K., & Yildirim, S. (2012). THE MEASUREMENT OF SERVICE QUALITY WITH
SERVQUAL FOR DIFFERENT DOMESTIC AIRLINE FIRMS IN TURKEY. Serbian
Journal Of Management, 7(2), 219-230. doi:10.5937/sjm7-1317
Benini, C. (2001). Dispute Rages Over Airline Data. Meetings & Conventions, 36(4), 19.
Chen, P., & Hu, H. (2013). The mediating role of relational benefit between service quality and
customer loyalty in airline industry. Total Quality Management & Business Excellence,
24(9/10), 1084-1095. doi:10.1080/14783363.2012.661130
Ching-Fu, C., & Wen-Shiang, T. (2010). Exploring Customer-based Airline Brand Equity:
Evidence from Taiwan. Transportation Journal (American Society Of Transportation &
Logistics Inc), 49(1), 24-34.
Cooper, D. R., & Schindler, P. S. (2011). Business research methods. New York: McGraw-
Hill/Irwin.
FORGAS, S., PALAU, R., & SÁNCHEZ, J. (2012). AIRLINE PASSENGERS PERCEIVED
VALUE. International Journal Of Management Cases, 14(1), 153-169.
GA Accident Rate Hits Historic Low. (2001). Business & Commercial Aviation, 88(4), 25.

41
Huiling Chen, A., Peng, N., & Hackley, C. (2008). EVALUATING SERVICE MARKETING IN
AIRLINE INDUSTRY AND ITS INFLUENCE ON STUDENT PASSENGERS' PURCHASING
BEHAVIOR USING TAIPEI--LONDON ROUTE AS AN EXAMPLE.Journal Of Travel &
Tourism Marketing, 25(2), 149-160.
ITB World Travel Trends. (2010). AirGuide Business, 6.
Jin-Woo, P., Rodger, R., & Cheng-Lung, W. (2009). Differences in air passengers' buying
behaviour: findings from Korean and Australian international passengers. Transportation
Planning & Technology, 32(5), 441-460. doi:10.1080/03081060903017176
Kalwani, M. U., & Yim, C. (1992). Consumer Price and Promotion Expectations: An
Experimental Study. Journal Of Marketing Research (JMR), 29(1), 90-100.
Kaushik, N., Kaushik, V. K., & Taneja, G. (2008). An Analytical Study of Customers' Preference
and Satisfaction in Indian Domestic Aviation Sector. ICFAI Journal Of Brand
Management, 5(1), 6-19.
Kim, Y., Kim, Y., & Lee, Y. (2011). Perceived service quality for South Korean domestic
airlines. Total Quality Management & Business Excellence, 22(10), 1041-1056.
doi:10.1080/14783363.2011.614872
Kwanho, S., Jiheon, L., & Lichtenstein, D. R. (2012). The Influence of Price Presentation Order
on Consumer Choice. Journal of Marketing Research (JMR), 49(5), 708-717.
Mallon, J.C., & Mulligan, D.E. (1993). Quality function deployment - A system for meeting

42
customers' needs. Journal of Construction Engineering and Management, 119(3), 516-
531
McIvor, R., O'Reilly, D., & Ponsonby, S. (2003). The impact of Internet technologies on the
airline industry: current strategies and future developments. Strategic Change, 12(1), 31-
47. doi:10.1002/jsc.618
Moonkyu, L., & Lawrence F., C. (2001). A cost/benefit approach to understanding service
loyalty. Journal Of Services Marketing, 15(2/3), 113.
Munusamy, J., Chelliah, S., & Pandian, S. (2011). Customer Satisfaction Delivery In Airline
Industry In Malaysia: A Case of Low Cost Carrier. Journal Of Applied Sciences Research,
7(11), 718-723.
Napach, B. (1996). A rough gauge of airline safety. Medical Economics, 73(13), 18.
Natalisa, D., & Subroto, B. (2003). Effects of Management Commitment on Service Quality to
Increase Customer Satisfaction of Domestic Airlines in Indonesia. Singapore
Management Review, 25(1), 85.
O'Brien, L., & Jones, C. (1995). Do Rewards Really Create Loyalty?. Harvard Business Review,
73(3), 75-82.
Rahman, M., Khan, A., & Haque, M. (2012). A Conceptual Study on the Relationship between
Service Quality towards Customer Satisfaction: Servqual and Gronroos's Service Quality
Model Perspective. Asian Social Science, 8(13), 201-210. doi:10.5539/ass.v8n13p201

43
Ringle, C. M., Sarstedt, M., & Zimmermann, L. (2011). Customer Satisfaction with Commercial
Airlines: The Role of Perceived Safety and Purpose of Travel. Journal Of Marketing
Theory & Practice, 19(4), 459-472.
Slovic, P. (1995). The construction of preference. American Psychologist, 50(5), 364-371.
doi:10.1037/0003-066X.50.5.364
Shahin, A., & Zairi, M. (2009). Kano model: A dynamic approach for classifying and prioritising
requirements of airline travellers with three case studies on international airlines. Total
Quality Management & Business Excellence, 20(9), 1003-1028.
doi:10.1080/14783360903181867
U.S. Airline Accident Rates Decline, But Fatalities Highest Since 1977. (2002). Aviation Week &
Space Technology, 156(13), 43.
Wattanacharoensil, W., & Yoopetch, C. (2012). Thailand's Human Resource Competencies in
Airline Service Quality: Voices from the Airline Industry. Journal Of Human Resources
In Hospitality & Tourism, 11(4), 280-302. doi:10.1080/15332845.2012.690680
Zhang, J., Cao, X., Du, W., & Cai, K. (2010). Evolution of Chinese airport network. Physica A,
389(18), 3922-3931. doi:10.1016/j.physa.2010.05.042
Zou, L., Oum, T. H., & Yu, C. (2011). Assessing the price effects of airline alliances on
complementary routes. Transportation Research: Part E, 47(3), 315-332.
doi:10.1016/j.tre.2010.11.004

44
Appendix 1 Measurement Table (XU Ziyang, 1130600156)
Measurement Table: Questions for measuring constructs
Customer
Preference(Adapted
from Kaushik et al,
2008)
Multiple Choice, Multiple-Response Scale:
1. which company do you choose the most frequently
Seven-point Likert Scale: Strongly Disagree(1) to
Strongly Agree(7)
2. I would like to take planes from the preferred airline
companies.
Accident rate
(Adapted from
Kaushik et al, 2008)
Simple category scale
1. I will always check the current accident rate of the
airline company before I take planes from that company?
1. Yes 2. No
Seven-point Likert Scale: Strongly Disagree(1) to
Strongly Agree(7):
2. I will more likely to choose the airline company with a
low accident rate.
Brand name (Adapted
from Kaushik et al,
2008)
Seven-point Likert Scale: Strongly Disagree(1) to
Strongly Agree(7):
1. I take a specified airline company repeatedly.
2. I take a specified airline company because I know a lot
about it.
3. I will choose a specified airline company because of the
company seldom has negative feedbacks. If it has, I will
probably not to choose that airline company.
Service
(Adapted from Aydin
& Yildirim, 2012)
SERVQUAL
Measurement Model
Seven-point Likert Scale: Strongly Disagree(1) to
Strongly Agree(7):
Tangibles
1. I will choose a specified airline company because of
the special decorations are so attracting.
Reliability
2. I will choose a specified airline company because of
the compensation is fairly enough. For example, if it is
delayed, customers will be accommodated well.
Responsiveness
3. I will select a specified airline company because the
aircrews care about passengers and response quickly.
Assurance
4. I like a specified airline company because of the
personalized service the company provides to each
passenger.
Empathy
5. I would like to choose a specified airline company

45
because of the politeness of staffs and their courteous
service.
Punctuality (Adapted
from FORGAS et al.,
2012)
Seven-point Likert Scale: Strongly Disagree(1) to
Strongly Agree(7)
1. I will choose a specified airline company because of
the planes always arrive on time.
2. I will choose a specified airline company because
my luggage can be delivered on time.
3.
Price (Adapted from
FORGAS et al., 2012)
Seven-point Likert Scale: Strongly Disagree(1) to
Strongly Agree(7) 1. I would like to choose a specified airline company
because the price is very inexpensive.
Simple category scale
2. I will choose the airline company because of the
inexpensive price, regardless of any other reasons,
such as high accident rate, poor services quality,
unnamable brand names, etc.
1. Yes 2. No
3. I will choose the airline company because of its low
accident rate, goodservice quality, high punctuality
rate, regardless of the price (even expensive).
1. Yes 2. No
Experience of
frequent flying
(Adapted from
Kaushik et al., 2008)
Multiple Choice, Single Response Scale:
1. How often do you take planes a year?
1.0
2. 1-3
3. 4-6
4. 7 or above
2. Simple category scale
Do you have a preference on a specified plane because of
your frequent flying experiences and decide to take the plane
for no reasons?
1. Yes 2. No

46
Appendix 2 Framework Literature Review (HU Jing
1130600039)
Reference Framework & Explanation Article:
Effects of
management
commitment on
service quality to
increase
customer
satisfaction of
domestic Airlines
in Indonesia
Writer:
Natalisa, D., &
Subroto, B., 2003
Researcher Conceptual Framework:
What the research group based on:
IV: Price
Service quality
DV: Customer’s preference on airline
Article:
Exploring
Customer-based
Airline Brand
Equity: Evidence
from Taiwan
Writer:
Ching-Fu, C., &
Wen-Shiang, T. ,
2010
Conceptual Model of Airline Brand Equity:
What the research group based on:
IV: Brand
DV: Customer’s preference on airline

47
Appendix 3 Questionnaire (English)
The Survey of Customer Preference on Domestic Airlines for
Returning Home Purpose between Students in BNU and UIC
Dear participants:
We are conducting this survey to find out customer preference of students in both BNU and UIC
in selecting domestic airlines for returning home purpose. Please be noticed that all the information in
this survey will be held confidential, will be used only by persons engaged in and for the purpose of
the survey and will not be disclosed or released to other persons or used for any other purpose
without consent of the individual.
Thank you so much for your cooperation.
Sincerely,
Airline Studies Group
The survey includes 3 parts. Please use a “√” to select your answers.
Part1 Basic Information
1. You are a male female
2. You are a student of BNU UIC Other universities
3. You are now currently studying in Y1 Y2 Y3 Y4
4. Your hometown is in Guangdong HK&Macau Non-Guangdong
Part2 General Questions (DV of the research)
5. Have you ever taken planes before? Yes No
6. How often do you take planes a year? 0 1-3 4-6 7 or above
7. Do you have a preference on a specified plane due to your frequent flying experiences and
decide to take the plane for no reasons? Yes No
Part3 Detailed information (IVs of the research)
8. Which company do you select the most frequently?
(Multiple choices question: you can select more than one answer.)
China National Aviation Corporation (中国航空股份有限公司)
China Eastern Air Holding Company (中国东方航空集团公司)
China Southern Airlines (中国南方航空公司)
China Southwest Airlines (中国西南航空公司)
China Northwest Airlines (中国西北航空公司)
Hainan Airlines (海南省航空公司)
Shenzhen Airlines (深圳航空公司)
I do not have preference on a specified plane.
Others, please specify__________________
**Please be noticed the following questions are indicated by figures starting from 1 to 7,

48
demonstrating your attitudes varying from Strongly Disagree to Strongly Agree.
9. Customer Preference.
9. I would like to take planes from the airline companies
selected in Q7.
10. Accident Rate.
10a. I will always check the current accident rate of the Yes No
airline company before I take planes from that company.
10b. I will be more likely to choose the airline company
with a lower accident rate.
11. Brand Name.
11a. I take a specified airline company repeatedly.
11b. I take a specified airline company because I know a
lot about it.
11c. I take the specified airline company because it
seldom has negative feedbacks. Otherwise, I will probably not to choose the company.
12. Services
12a. I will choose a specified airline company due to the
special decorations.
12b. I will choose a specified airline company
because the compensation is fair. (For example,
if the plane is delayed, customers can be settled well.)
12c. I will select a specified airline company
because the aircrews care about passengers and
give response quickly.
12d. I like the company due to the personalized service.
12e. I choose the company for the courteous service.
13. Punctuality
13a. I will choose a specified airline company because
of the planes always arrive on time.
13b. I will choose a specified airline company because
my luggage can be delivered on time.
14. Price 14a. I choose the company because the ticket price is
very cheap.
14b. I choose the airline company only for the
inexpensive price, regardless of any other reasons, such
as high accident rate, poor services quality, unnamable
brand names, etc.
14c. I choose the airline company because of its low
Strongly
Agree
Strongly
Disagree ←----→
1 2 3 4 5 6 7
1 2 3 4 5 6 7
1 2 3 4 5 6 7
1 2 3 4 5 6 7
1 2 3 4 5 6 7
1 2 3 4 5 6 7
1 2 3 4 5 6 7
1 2 3 4 5 6 7
1 2 3 4 5 6 7
1 2 3 4 5 6 7
1 2 3 4 5 6 7
1 2 3 4 5 6 7
1 2 3 4 5 6 7
1 2 3 4 5 6 7
1 2 3 4 5 6 7

49
accident rate, good service quality, high punctuality rate,
regardless of the price (even expensive).
15. (Exploration) Are there any other factors that are affecting you in selecting airline
companies? Please specify.
Thank you so much for your participation!
Appendix 4 Questionnaire (Chinese version)
UIC 与 BNU 学生对往返家庭国内航班的选择调查
The Study of Influence Factors of UIC & BNU Students’ Customer Preference on Domestic
Airlines for Back Home Purpose 基本信息
1. 学校: [单选题] [必答题]
北师大 UIC 其他
2. 年级 [单选题] [必答题]
大一 大二 大三 大四
3. 性别 [单选题] [必答题]
男 女
PART1
4. 你乘坐过飞机吗? [单选题] [必答题]
是 否
5. 请问你每年坐飞机次数是多少? [单选题] [必答题]
0 1-3 4-6 7 以上
6. 请问你是否会由于经常乘坐某一航空公司而产生特殊偏好,并无条件指定乘坐该航空公司航班?(MV)
[单选题] [必答题]
是 否
7. 如果你要乘坐飞机出行你会选择以下哪个航空公司 [多选题] [必答题]

50
中国航空股份有限公司 中国东方航空集团公司) 中国南方航空公司)
中国西南航空公司) 中国西北航空公司) 海南省航空公司)
深圳航空公司) 其他国内航班 没有偏好
以下问题若出现 1、2、3、4、5、6、7 则分别表示强烈反对,很反对,比较反对,中立,比较同意,很同意, 强
烈同意
8. 你会偏向于选择第 7 题所选航空公司的程度。 [单选题] [必答题]
1 2 3 4 5 6 7
请回答以下关于选择往返于学校与家的国内航空公司的问题:
PART2 事故率
9. 你选择航空公司之前是否会留意航空公司的事故率? [单选题] [必答题]
是 否
10. 你更偏向于以上你选择的航空公司因为该公司的事故率较低。 [单选题] [必答题]
1 2 3 4 5 6 7
PART 3 品牌
11. 你经常重复乘坐以上所选航空公司的航班。(loyalty) [单选题] [必答题]
1 2 3 4 5 6 7
12. 你会选择该航空公司,因为你对它了解比较多。(awareness) [单选题] [必答题]
1 2 3 4 5 6 7
13. 你会更偏向于该航空公司因为该公司品牌的负面评价少,倘若有负面评价,你很可能不选择它。(image) [单
选题] [必答题]
1 2 3 4 5 6 7
PART 4 服务
14. 你会更偏向于该航空公司因为该公司有独特的飞机装饰比如动漫主题(例如海贼王主题)。 [单选题] [必答题]
1 2 3 4 5 6 7
15. 你会因为飞机的补救措施很好而选择该公司。例如:当飞机延误时,会给予乘客食物,甚至解决乘客的的住所
问题 [单选题] [必答题]
1 2 3 4 5 6 7
16. 你更偏向于该航空公司因为该公司服务人员关注乘客,响应及时。 [单选题] [必答题]
1 2 3 4 5 6 7

51
17. 你更偏向于该航空公司因为该公司会为不同人群提供个性化服务。例如为行动不便的乘客提供航班陪伴服务。
[单选题] [必答题]
1 2 3 4 5 6 7
18. 你会因为航空公司的员工礼貌和服务特别周到而选择该公司。 [单选题] [必答题]
1 2 3 4 5 6 7
PART 5 准点率
19. 航空公司的准点率高是你倾向于选择它的原因。 [单选题] [必答题]
1 2 3 4 5 6 7
20. 航空公司的行李准时运达是你倾向于选择它的原因。 [单选题] [必答题]
1 2 3 4 5 6 7
PART 6 价格
21. 你会因为价格低而偏向于选择该航空公司。 [单选题] [必答题]
1 2 3 4 5 6 7
22. 如果一个航空公司的事故率、品牌、服务、准点率都很差但价格很低,你是否会选择它。 [单选题] [必答题]
是 否
23. 如果一个航空公司的事故率、品牌、服务、准点率都很好但价格很高,你是否还会选择它。 [单选题] [必答题]
是 否
24. 你觉得除了以上这些因素,还有哪些其他因素会影响你对航空公司的选择呢? [填空题]