airlines - · pdf file4 asia pacific equity research 08 january 2014 corrine png (65) 6882...
TRANSCRIPT
www.jpmorganmarkets.com
Asia Pacific Equity Research08 January 2014
Equity Ratings and Price Targets
Mkt Cap Price Rating Price TargetCompany Ticker ($ mn) CCY Price Cur Prev Cur PrevAirAsia BHD AIRA MK 1,971.56 MYR 2.33 N n/c 2.50 n/cCebu Air, Inc. CEB PM 688.98 PHP 50.95 OW n/c 77.00 n/cTigerair TGR SP 395.42 SGD 0.51 OW n/c 0.75 n/cSource: Company data, Bloomberg, J.P. Morgan estimates. n/c = no change. All prices as of 08 Jan 14.
AirlinesTigerair forms another alliance; this time with Cebu Air; +ve for CEB and TGR, but -ve for AirAsia
Malaysia, Philippines, Singapore
Airlines
Corrine Png AC
(65) 6882-1514
Bloomberg JPMA PNG <GO>
J.P. Morgan Securities (Asia Pacific) Limited
See page 16 for analyst certification and important disclosures, including non-US analyst disclosures.J.P. Morgan does and seeks to do business with companies covered in its research reports. As a result, investors should be aware that the firm may have a conflict of interest that could affect the objectivity of this report. Investors should consider this report as only a single factor in making their investment decision.
Tigerair and Cebu Air plan to enter into a strategic alliance: Both airlines will: 1) jointly operate common routes between SIN and PHILS and other markets that may emerge when they expand their networks, 2) jointly sell and market common and non-common routes using codeshare or interline arrangements and 3) cooperate in relation to sales and marketing, distribution, airport operations and ground handling, scheduling, pricing, service policies, innovation, procurement and other matters to improve the overall quality of service offered to passengers and reduce costs.
Tigerair will also divest its 40% stake in SEAir to fully derive the synergistic benefits of combining their resources. As a result, SEAir will be merged into Cebu Air before entering into the alliance agreement. Post the sale, Tigerair will be present in the Philippines market through the interline agreement with Cebu Air. Cebu Air has agreed to pay S$8.9MM for the 40% stake, implying S$22MM for a 100% stake. The transaction is subject to regulatory approval and is expected to be completed before Mar-14.
Tigerair will book a loss of S$13.5MM: Apart from the S$8.9MM that Tigerair will receive from Cebu Air, it will also book a translation gain of S$2.0MM. However, Tigerair will remit to Cebu Air in cash the total amount of forward sales and net non-aircraft liabilities amounting to S$24.4MM resulting in a net loss of S$13.5MM. Tigerair will also terminate the two A319 sublease agreements entered with SEAir and plans to sublease the remaining three A320 aircraft to Cebu Air.
We view this positively for Tigerair and Cebu Air: The alliance is in line with Tigerair’s asset-light strategy and builds upon its other alliances announced recently (click here for more details). This is also positive for Cebu Air as it reduces competition and allows it to consolidate its position in the domestic market and enhance connectivity to the Australia and Indian markets. Based on seats, Cebu Air and Tigerair have a 52% combined market share in the domestic PHILS market (vs 47% and 5% individually), a 23% combined market share in the PHILS-Asia market (vs 20% and 4% individually) and a 14% combined market share in SIN-Asia market (vs 2% and 12% individually) in 2013. Based on ASK, Cebu Air and Tigerair have a 51% combined market share in the domestic PHILS market (vs 46% and 5% individually), a 22% combined market share in the PHILS-Asia int'l market (vs 18% and 4% individually) and an 11% combined market share in SIN-Asia market (vs 2% and 9% individually) in 2013.
Negative for AirAsia: This alliance will make it even more challenging to operate profitably in PHILS. AirAsia PHILS recorded a net loss of M$65MM in 9M13.

2
Asia Pacific Equity Research08 January 2014
Corrine Png(65) [email protected]
Table 1: Domestic Philippines Market Share – 2013 (one-way)
Airline Based on Seats Based on ASKsCebu Pacific Air 47.1% 46.0%PAL Express 21.0% 19.6%Zest Airways 14.0% 13.7%Philippine Airlines 12.0% 14.6%Tigerair Philippines 4.9% 4.9%Philippines AirAsia 1.0% 1.2%Total 100.0% 100.0%
Source: FlightGlobal.
Table 2: Philippines-Asia Market Share – 2013 (one-way)
Airline Based on Seats Based on ASKs
Philippine Airlines 23.5% 23.9%Cebu Pacific Air 19.7% 18.3%Cathay Pacific Airways 7.8% 4.5%Zest Airways 5.3% 6.1%Singapore Airlines 4.1% 4.6%Korean Air 4.0% 5.2%Asiana Airlines 4.0% 5.0%Delta Air Lines 2.6% 3.6%Philippines AirAsia 2.5% 1.8%Malaysia Airlines 2.4% 2.7%Tigerair* 3.8% 3.6%Jetstar Asia 2.1% 2.4%China Airlines 1.8% 0.9%JAL 1.7% 2.5%PAL Express 1.7% 1.6%Thai 1.7% 1.7%China Southern Airlines 1.6% 0.9%Jeju Air 1.5% 2.0%EVA Air 1.0% 0.5%Others 7.2% 8.0%Total 100.0% 100.0%
Source: FlightGlobal. *Tigerair includes Tigerair Philippines and Tigerair Singapore.
Table 3: Singapore-Asia Market Share – 2013 (one-way)
Airline Based on Seats Based on ASKsSingapore Airlines 27.2% 36.4%Tigerair* 12.1% 9.1%SilkAir 8.4% 6.0%Jetstar Asia 6.7% 4.5%AirAsia 4.6% 1.0%Cathay Pacific Airways 3.9% 4.5%Indonesia AirAsia 3.6% 1.9%Garuda Indonesia 2.4% 1.1%Lion Airlines 2.3% 1.0%Thai 1.9% 1.2%Malaysia Airlines 1.8% 0.3%Cebu Pacific Air 1.6% 1.7%Thai AirAsia 1.5% 0.9%China Eastern Airlines 1.5% 2.5%Scoot 1.3% 1.8%Valuair 1.2% 0.6%China Airlines 1.1% 1.3%Philippine Airlines 1.1% 1.2%Jet Airways 1.0% 1.8%Others 14.8% 21.2%Total 100.0% 100.0%
Source: FlightGlobal. *Tigerair includes Mandala Airlines, Tigerair Philippines and Tigerair Singapore.

3
Asia Pacific Equity Research08 January 2014
Corrine Png(65) [email protected]
Table 4: Asia Pacific Airlines Calendarized Valuation Comparison
Ticker Price P/E (x) P/BV (x) EV/EBITDAR (x)7-Jan-14 2013E 2014E 2013E 2014E 2013E 2014E
Air Arabia AIRARABI UH 1.54 15.7 13.4 1.3 1.2 11.8 10.3AirAsia* AIRA MK 2.39 17.1 9.2 1.1 1.0 8.8 8.7AirAsia X AAX MK 1.01 22.0 10.6 1.6 1.4 13.8 10.2Air China – H* 753 HK 5.29 14.7 13.8 1.0 1.0 8.1 7.3Air New Zealand AIR NZ 1.61 7.6 6.8 0.9 0.8 3.8 3.5All Nippon Airways 9202 JP 220.00 nm 21.5 1.0 1.0 5.7 5.3Asia Aviation AAV TB 3.72 13.8 11.1 0.8 0.8 6.9 6.8Asiana 020560 KS 4955 nm 39.9 1.1 1.1 10.0 7.8CAL* 2610 TT 10.80 nm nm 1.1 1.0 nm nmCathay* 293 HK 16.10 51.7 24.7 1.1 1.1 9.2 7.9Cebu Air* CEB PM 49.25 nm 19.3 1.3 1.2 8.7 6.8China East – H* 670 HK 2.81 10.0 9.5 1.1 1.0 8.5 7.6China Sthn – H* 1055 HK 2.93 19.1 12.0 0.7 0.6 8.3 6.7EVA* 2618 TT 16.70 nm nm 1.5 1.5 nm nmGaruda Indonesia GIAA IJ 490.00 13.5 10.1 0.8 0.7 6.5 6.1Hainan Airlines 600221 CH 1.91 7.1 6.0 1.0 1.1 nm nmJapan Airlines 9201 JP 5220.00 6.3 6.7 1.5 1.3 3.2 2.9Jet* JETIN IN 293.70 nm 10.8 nm nm 6.2 7.5Korean Air* 003490 KS 31200 nm 9.5 1.2 1.0 9.0 6.7MAS MAS MK 0.32 nm nm 1.2 1.5 12.0 10.4Qantas* QAN AU 1.09 nm nm 0.4 0.5 5.5 4.4SIA* SIA SP 10.10 34.2 12.1 0.9 0.9 5.0 3.6Skymark Airlines 9204 JP 413.00 19.7 17.8 0.8 0.8 2.7 4.9Spice Jet SJET IN 20.30 nm nm nm nm 8.3 8.3THAI THAI TB 13.10 nm 14.3 0.4 0.4 8.7 7.2Tigerair* TGR SP 0.52 nm nm 1.4 1.8 nm 17.5Virgin Australia* VAH AU 0.38 nm 38.5 1.0 1.0 7.1 6.2Sector Average 18.0 15.1 1.1 1.0 7.7 7.3Asia Pacific incumbent airlines 25.9 19.2 1.0 1.0 7.9 6.8Asia Pacific LCCs 17.6 13.6 1.2 1.2 8.7 9.2Global LCCs 17.3 13.7 1.8 1.8 8.4 8.4
Source: Bloomberg, J.P. Morgan estimates. Sector average includes consensus estimates for non-covered stocks. nm: not meaningful. *Companies covered by J.P. Morgan. FY2014 and FY2015
March year end for All Nippon, Japan Airlines, Jet, SIA, SpiceJet and Tigerair and June year end for Air New Zealand, Qantas and Virgin Australia.
4
Asia Pacific Equity Research08 January 2014
Corrine Png(65) [email protected]
AirAsia BHD
Company DataShares O/S (mn) 2,779Market Cap (M$ mn) 6,475Market Cap ($ mn) 1,972Price (M$) 2.33Date Of Price 08 Jan 14Free Float(%) 60.8%3M - Avg daily vol (mn) 7.983M - Avg daily val (M$ mn) 19.713M - Avg daily val ($ mn) 6.0FBMKLCI 1825.11Exchange Rate 3.28Price Target End Date 31-Dec-14
AirAsia BHD (Reuters: AIRA.KL, Bloomberg: AIRA MK)
M$ in mn, year-end Dec FY11A FY12A FY13E FY14E FY15ERevenue (M$ mn) 4,495 4,946 5,166 5,586 6,097Net Profit (M$ mn) 555 1,831 400 725 830Recurring Net Profit (M$ mn) 838 709 757 725 830EPS (M$) 0.20 0.66 0.14 0.26 0.30Recurring EPS (M$) 0.30 0.25 0.27 0.26 0.30DPS (M$) 0.00 0.00 0.07 0.08 0.09Revenue growth (%) 13.9% 10.0% 4.4% 8.1% 9.1%Recurring Net Profit growth 12.7% (15.4%) 6.8% (4.3%) 14.5%EPS growth (%) (48.0%) 229.4% (78.2%) 81.4% 14.5%Recurring EPS growth 12.3% (15.5%) 6.8% (4.3%) 14.5%ROCE 7.1% 7.2% 5.6% 6.9% 6.9%ROE 14.5% 36.9% 6.6% 11.3% 11.9%P/E (x) 11.6 3.5 16.2 8.9 7.8P/BV (x) 1.6 1.1 1.1 1.0 0.9EV/EBITDA (x) 7.3 8.2 8.3 8.2 7.8Dividend Yield 0.0% 0.0% 3.1% 3.5% 4.0%Source: Company data, Bloomberg, J.P. Morgan estimates.
Investment Thesis, Valuation and Risks
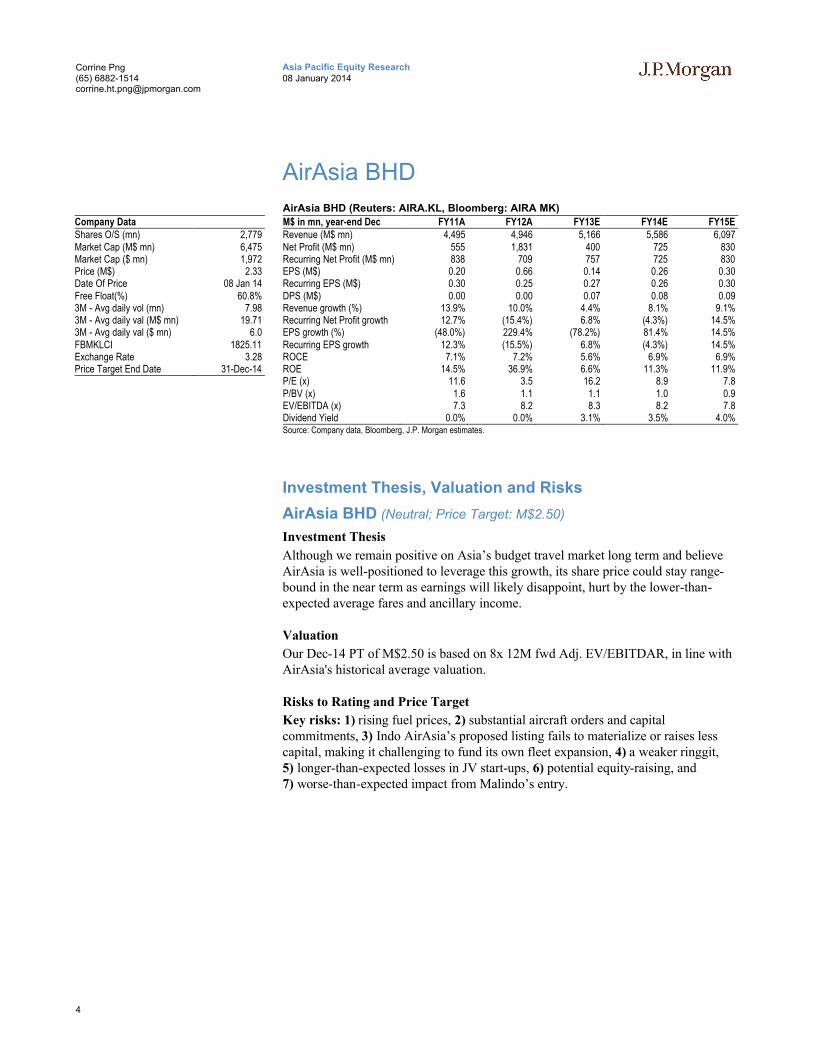
AirAsia BHD (Neutral; Price Target: M$2.50)
Investment Thesis
Although we remain positive on Asia’s budget travel market long term and believe AirAsia is well-positioned to leverage this growth, its share price could stay range-bound in the near term as earnings will likely disappoint, hurt by the lower-than-expected average fares and ancillary income.
Valuation
Our Dec-14 PT of M$2.50 is based on 8x 12M fwd Adj. EV/EBITDAR, in line with AirAsia's historical average valuation.
Risks to Rating and Price Target
Key risks: 1) rising fuel prices, 2) substantial aircraft orders and capital commitments, 3) Indo AirAsia’s proposed listing fails to materialize or raises less capital, making it challenging to fund its own fleet expansion, 4) a weaker ringgit, 5) longer-than-expected losses in JV start-ups, 6) potential equity-raising, and 7) worse-than-expected impact from Malindo’s entry.

5
Asia Pacific Equity Research08 January 2014
Corrine Png(65) [email protected]
Key catalyst for the stock price: Upside risks to our view: Downside risks to our view:
Ancillary revenue growth accelerates,rising earnings contribution from Thai AirAsia, potential listing of Indonesia AirAsia, new JVs in other markets.
Rebound in average fare, fall in fuel prices, stronger MYR, better-than-expected profits from JVs, exit of Malindo from Malaysia.
Rising fuel prices, substantial aircraft orders and capital commitments, Indo AirAsia’s proposed listing fails to materialize or raises less capital, making it challenging to fund its own fleet expansion, weaker ringgit, longer-than-expected losses in JV start-ups, potential equity-raising, and worse-than-expected impact from Malindo’s entry.
Key financial metrics 2012A 2013E 2014E 2015E Valuation and price target basis
Revenues (M$MM) 4,946 5,166 5,586 6,097 Our Dec-14 PT of M$2.50 is based on 8x 12M fwd Adj. EV/EBITDAR, in line with AirAsia's historical average valuation. Revenue growth (%) 10.0% 4.4% 8.1% 9.1%
EBITDA (M$MM) 1,596 1,645 1,848 2,100EBITDA margin (%) 32.3% 31.9% 33.1% 34.4%
Tax rate (%) 8.6% 20.2% 6.0% 6.0%Net profit (M$MM) 1,831 400 725 830
EPS (S$) 0.66 0.14 0.26 0.30
EPS growth (%) 229.4% -78.2% 81.4% 14.5% Adj.EV/EBITDAR Trading Range Since Listing
DPS (S$) - 0.07 0.08 0.09BVPS (S$) 2.12 2.22 2.40 2.60
Operating cash flow (M$MM) 1,355 961 1,354 1,526Free cash flow (M$MM) (581) (303) (1,215) (1,043)
Interest cover (X) 8.7 2.4 3.8 3.7Net margin (%) 14.3% 14.7% 13.0% 13.6%
Sales/assets (X) 0.3 0.3 0.3 0.3Debt/equity (%) 143% 137% 149% 155%Net debt/equity (%) 105% 109% 122% 131%
ROE (%) 36.9% 6.6% 11.3% 11.9%
Key model assumptions 2012A 2013E 2014E 2015E
Passenger carried growth 9.4% 10.7% 10.0% 7.0%Average fare growth 6.3% -9.0% -3.0% -1.0%
Jet fuel price (US$/bbl) 135 125 125 125MYR/USD 3.1 3.2 3.2 3.2
Source: Bloomberg, Company and J.P. Morgan estimates. March year end. Source: Bloomberg, Company and J.P. Morgan estimates.
Comparative metrics
CMP Mkt Cap P/E P/BV Adj. EV/EBITDAR ROE YTD
LC $Mn FY13E FY14E FY13E FY14E FY13E FY14E FY13E FY14E Stock perf.Cebu Air, Inc 49.25 689 nm 19.3 1.3 1.2 8.7 6.8 -1.4% 6.4% 5.1%AirAsia 2.39 1,991 16.6 9.2 1.1 1.0 7.8 8.7 6.6% 11.3% 8.6%Tigerair 0.52 396 nm nm 1.4 1.8 nm 17.5 -49.1% -23.9% 1.0%
Global LCCs average 17.3 13.7 1.8 1.8 8.4 8.4 0.7% 0.8% 4.6%Asian airlines average 18.0 15.1 1.1 1.0 7.7 7.3 1.4% 7.5% 1.0%Source: Bloomberg, J.P. Morgan estimates. Forecasts for non-covered (NC) stocks are based on consensus estimates to calculate sector average. Note: Tigerair valuations are for FY14E and FY15E given its March year end. Prices are as of 7 Jan, 2014.
15.57
8.22
18.36
10.07
6.37
21.16
11.91
4.52
0.00
5.00
10.00
15.00
20.00
25.00
Nov-0
4Ja
n-0
5M
ar-
05
May-0
5Jul-05
Sep-0
5N
ov-0
5Ja
n-0
6M
ar-
06
May-0
6Jul-06
Sep-0
6N
ov-0
6Ja
n-0
7M
ar-
07
May-0
7Jul-07
Sep-0
7N
ov-0
7Ja
n-0
8M
ar-
08
May-0
8Jul-08
Sep-0
8N
ov-0
8Ja
n-0
9M
ar-
09
May-0
9Jul-09
Sep-0
9N
ov-0
9Ja
n-1
0M
ar-
10
May-1
0Jul-10
Sep-1
0N
ov-1
0Ja
n-1
1M
ar-
11
May-1
1Jul-11
Sep-1
1N
ov-1
1Ja
n-1
2M
ar-
12
May-1
2Jul-12
Sep-1
2N
ov-1
2Ja
n-1
3M
ar-
13
May-1
3Jul-13
Sep-1
3N
ov-1
3
AirAsia Adj.EV/EBITDAR (Rolling 12M Fwd)
Adj.EV/EBITDAR Average +1 std dev -1 stde dev +2 std dev -2 std dev
Current Adj.EV/EBITDAR:7.89x
6
Asia Pacific Equity Research08 January 2014
Corrine Png(65) [email protected]
Cebu Air, Inc.
Company DataShares O/S (mn) 606Market Cap (Php mn) 30,873Market Cap ($ mn) 689Price (Php) 50.95Date Of Price 08 Jan 14Free Float(%) 32.9%3M - Avg daily vol (mn) 0.173M - Avg daily val (Php mn) 8.513M - Avg daily val ($ mn) 0.2PSE 5986.48Exchange Rate 44.81Price Target End Date 31-Dec-14
Cebu Air, Inc. (Reuters: CEB.PS, Bloomberg: CEB PM)
Php in mn, year-end Dec FY11A FY12A FY13E FY14E FY15ERevenue (Php mn) 33,935 37,904 39,653 47,342 53,970Net Profit (Php mn) 3,624 3,569 (322) 1,545 2,220Recurring Net Income (Php mn)
3,241 2,100 1,207 1,545 2,220
EPS (Php) 5.93 5.89 (0.53) 2.55 3.66Recurring EPS (Php) 5.31 3.47 1.99 2.55 3.66DPS (Php) 0.00 0.00 0.00 0.00 0.00Revenue growth (%) 16.7% 11.7% 4.6% 19.4% 14.0%EPS growth (%) (49.6%) (0.7%) (109.0%) (579.4%) 43.7%ROCE 8.5% 5.8% 4.4% 3.9% 4.8%ROE 19.6% 17.3% (1.4%) 6.4% 8.5%P/E (x) 8.6 8.7 NM 20.0 13.9P/BV (x) 1.6 1.4 1.3 1.2 1.1EV/EBITDA (x) 2.1 2.3 4.4 3.8 3.2Dividend Yield 0.0% 0.0% 0.0% 0.0% 0.0%Source: Company data, Bloomberg, J.P. Morgan estimates.
Investment Thesis, Valuation and Risks
Cebu Air, Inc. (Overweight; Price Target: Php77.00)
Investment Thesis
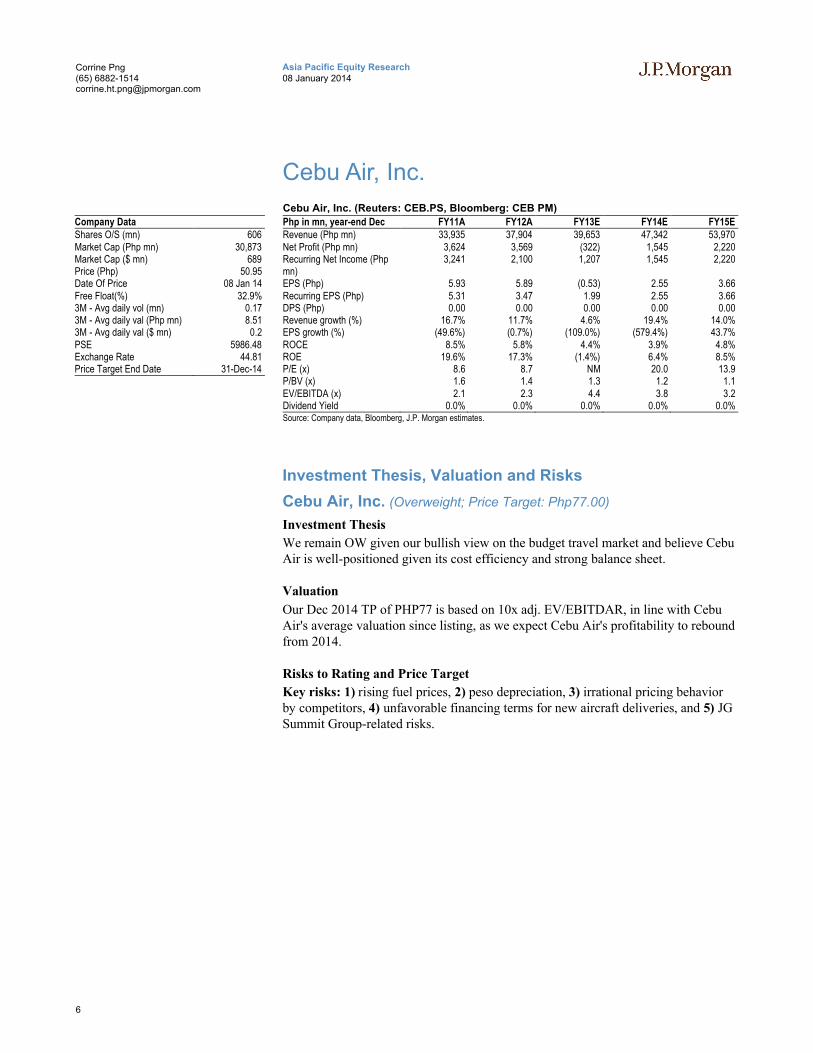
We remain OW given our bullish view on the budget travel market and believe Cebu Air is well-positioned given its cost efficiency and strong balance sheet.
Valuation
Our Dec 2014 TP of PHP77 is based on 10x adj. EV/EBITDAR, in line with Cebu Air's average valuation since listing, as we expect Cebu Air's profitability to rebound from 2014.
Risks to Rating and Price Target
Key risks: 1) rising fuel prices, 2) peso depreciation, 3) irrational pricing behavior by competitors, 4) unfavorable financing terms for new aircraft deliveries, and 5) JG Summit Group-related risks.
7
Asia Pacific Equity Research08 January 2014
Corrine Png(65) [email protected]
Key catalyst for the stock price: Upside risks to our view: Downside risks to our view:
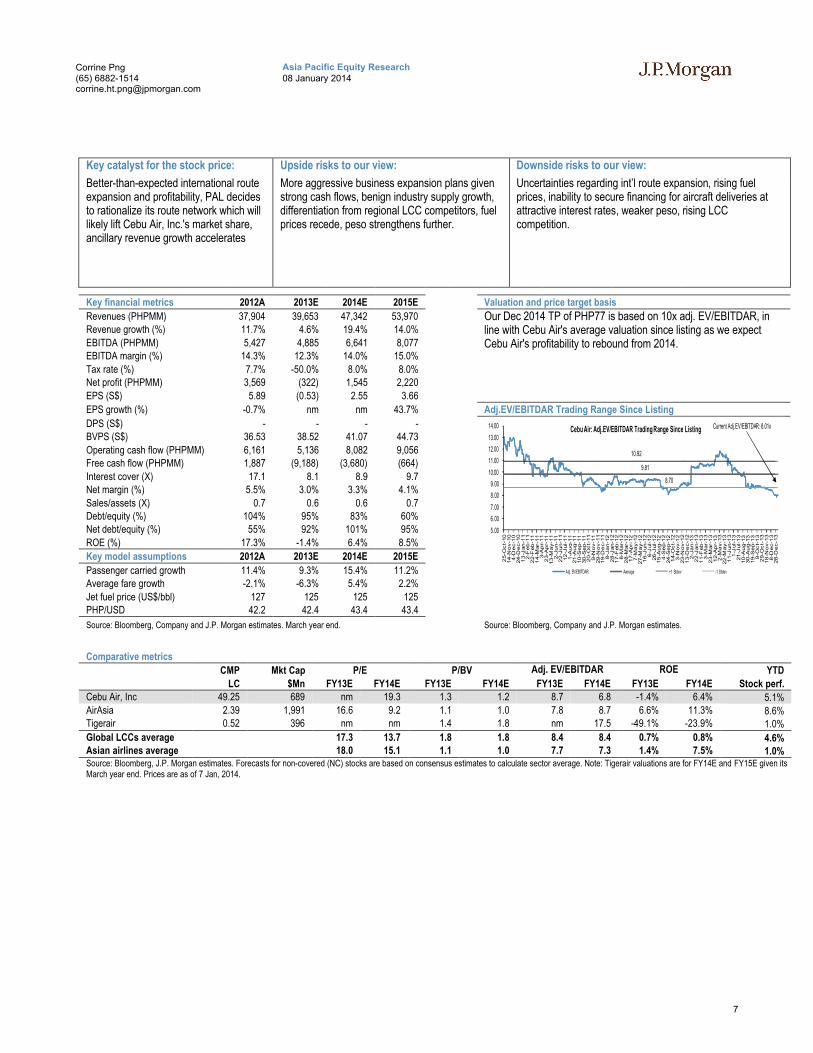
Better-than-expected international route expansion and profitability, PAL decides to rationalize its route network which will likely lift Cebu Air, Inc.'s market share, ancillary revenue growth accelerates
More aggressive business expansion plans given strong cash flows, benign industry supply growth, differentiation from regional LCC competitors, fuel prices recede, peso strengthens further.
Uncertainties regarding int’l route expansion, rising fuel prices, inability to secure financing for aircraft deliveries at attractive interest rates, weaker peso, rising LCC competition.
Key financial metrics 2012A 2013E 2014E 2015E Valuation and price target basis
Revenues (PHPMM) 37,904 39,653 47,342 53,970 Our Dec 2014 TP of PHP77 is based on 10x adj. EV/EBITDAR, in line with Cebu Air's average valuation since listing as we expect Cebu Air's profitability to rebound from 2014.
Revenue growth (%) 11.7% 4.6% 19.4% 14.0%
EBITDA (PHPMM) 5,427 4,885 6,641 8,077EBITDA margin (%) 14.3% 12.3% 14.0% 15.0%
Tax rate (%) 7.7% -50.0% 8.0% 8.0%Net profit (PHPMM) 3,569 (322) 1,545 2,220
EPS (S$) 5.89 (0.53) 2.55 3.66
EPS growth (%) -0.7% nm nm 43.7% Adj.EV/EBITDAR Trading Range Since Listing
DPS (S$) - - - -BVPS (S$) 36.53 38.52 41.07 44.73
Operating cash flow (PHPMM) 6,161 5,136 8,082 9,056Free cash flow (PHPMM) 1,887 (9,188) (3,680) (664)
Interest cover (X) 17.1 8.1 8.9 9.7Net margin (%) 5.5% 3.0% 3.3% 4.1%
Sales/assets (X) 0.7 0.6 0.6 0.7Debt/equity (%) 104% 95% 83% 60%Net debt/equity (%) 55% 92% 101% 95%
ROE (%) 17.3% -1.4% 6.4% 8.5%
Key model assumptions 2012A 2013E 2014E 2015E
Passenger carried growth 11.4% 9.3% 15.4% 11.2%Average fare growth -2.1% -6.3% 5.4% 2.2%
Jet fuel price (US$/bbl) 127 125 125 125PHP/USD 42.2 42.4 43.4 43.4
Source: Bloomberg, Company and J.P. Morgan estimates. March year end. Source: Bloomberg, Company and J.P. Morgan estimates.
Comparative metrics
CMP Mkt Cap P/E P/BV Adj. EV/EBITDAR ROE YTD
LC $Mn FY13E FY14E FY13E FY14E FY13E FY14E FY13E FY14E Stock perf.Cebu Air, Inc 49.25 689 nm 19.3 1.3 1.2 8.7 6.8 -1.4% 6.4% 5.1%AirAsia 2.39 1,991 16.6 9.2 1.1 1.0 7.8 8.7 6.6% 11.3% 8.6%Tigerair 0.52 396 nm nm 1.4 1.8 nm 17.5 -49.1% -23.9% 1.0%
Global LCCs average 17.3 13.7 1.8 1.8 8.4 8.4 0.7% 0.8% 4.6%Asian airlines average 18.0 15.1 1.1 1.0 7.7 7.3 1.4% 7.5% 1.0%Source: Bloomberg, J.P. Morgan estimates. Forecasts for non-covered (NC) stocks are based on consensus estimates to calculate sector average. Note: Tigerair valuations are for FY14E and FY15E given its March year end. Prices are as of 7 Jan, 2014.
9.81
10.92
8.70
5.00
6.00
7.00
8.00
9.00
10.00
11.00
12.00
13.00
14.00
25-O
ct-
10
14
-No
v-1
04
-De
c-1
024
-De
c-1
01
3-J
an
-11
2-F
eb
-11
22
-Feb
-11
14
-Mar-
11
3-A
pr-
11
23-A
pr-
11
13
-Ma
y-1
12-J
un
-11
22
-Jun
-11
12
-Jul-
11
1-A
ug-1
121
-Au
g-1
110
-Se
p-1
130
-Se
p-1
12
0-O
ct-
11
9-N
ov-1
129
-No
v-1
119
-De
c-1
18-J
an
-12
28
-Jan
-12
17
-Feb
-12
8-M
ar-
12
28
-Mar-
12
17-A
pr-
12
7-M
ay-1
227
-Ma
y-1
21
6-J
un
-12
6-J
ul-
12
26
-Jul-
12
15
-Au
g-1
24
-Se
p-1
224
-Se
p-1
21
4-O
ct-
12
3-N
ov-1
223
-No
v-1
213
-De
c-1
22-J
an
-13
22
-Jan
-13
11
-Feb
-13
3-M
ar-
13
23
-Mar-
13
12-A
pr-
13
2-M
ay-1
322
-Ma
y-1
31
1-J
un
-13
1-J
ul-
13
21
-Jul-
13
10
-Au
g-1
330
-Au
g-1
319
-Se
p-1
39
-Oc
t-1
32
9-O
ct-
13
18
-No
v-1
38
-De
c-1
328
-De
c-1
3
Cebu Air: Adj.EV/EBITDAR Trading Range Since Listing
Adj. EV/EBITDAR Average +1 Stdev -1 Stdev
Current Adj.EV/EBITDAR: 8.01x
8
Asia Pacific Equity Research08 January 2014
Corrine Png(65) [email protected]
Tigerair
Company DataShares O/S (mn) 986Market Cap (S$ mn) 503Market Cap ($ mn) 395Price (S$) 0.51Date Of Price 08 Jan 14Free Float(%) 54.9%3M - Avg daily vol (mn) 0.833M - Avg daily val (S$ mn) 0.433M - Avg daily val ($ mn) 0.3FTSTI 3120.88Exchange Rate 1.27Price Target End Date 31-Dec-14Price Target (S$) 0.75
Tigerair (Reuters: TAHL.SI, Bloomberg: TGR SP)
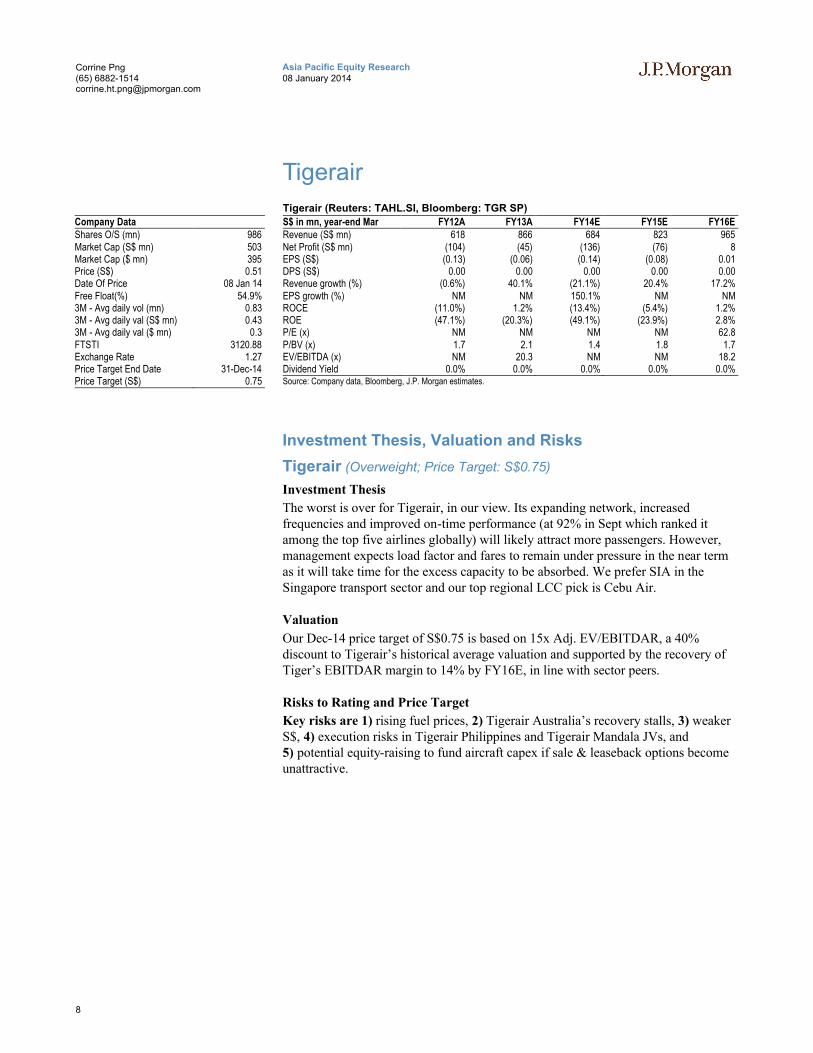
S$ in mn, year-end Mar FY12A FY13A FY14E FY15E FY16ERevenue (S$ mn) 618 866 684 823 965Net Profit (S$ mn) (104) (45) (136) (76) 8EPS (S$) (0.13) (0.06) (0.14) (0.08) 0.01DPS (S$) 0.00 0.00 0.00 0.00 0.00Revenue growth (%) (0.6%) 40.1% (21.1%) 20.4% 17.2%EPS growth (%) NM NM 150.1% NM NMROCE (11.0%) 1.2% (13.4%) (5.4%) 1.2%ROE (47.1%) (20.3%) (49.1%) (23.9%) 2.8%P/E (x) NM NM NM NM 62.8P/BV (x) 1.7 2.1 1.4 1.8 1.7EV/EBITDA (x) NM 20.3 NM NM 18.2Dividend Yield 0.0% 0.0% 0.0% 0.0% 0.0%Source: Company data, Bloomberg, J.P. Morgan estimates.
Investment Thesis, Valuation and Risks
Tigerair (Overweight; Price Target: S$0.75)
Investment Thesis
The worst is over for Tigerair, in our view. Its expanding network, increased frequencies and improved on-time performance (at 92% in Sept which ranked it among the top five airlines globally) will likely attract more passengers. However, management expects load factor and fares to remain under pressure in the near term as it will take time for the excess capacity to be absorbed. We prefer SIA in the Singapore transport sector and our top regional LCC pick is Cebu Air.
Valuation
Our Dec-14 price target of S$0.75 is based on 15x Adj. EV/EBITDAR, a 40% discount to Tigerair’s historical average valuation and supported by the recovery of Tiger’s EBITDAR margin to 14% by FY16E, in line with sector peers.
Risks to Rating and Price Target
Key risks are 1) rising fuel prices, 2) Tigerair Australia’s recovery stalls, 3) weaker S$, 4) execution risks in Tigerair Philippines and Tigerair Mandala JVs, and 5) potential equity-raising to fund aircraft capex if sale & leaseback options become unattractive.

9
Asia Pacific Equity Research08 January 2014
Corrine Png(65) [email protected]
Key catalyst for the stock price: Upside risks to our view: Downside risks to our view:
Ancillary revenue growth accelerates,improved utilization after last year’s capacity indigestion, traffic feed from other airlines following move to Changi Airport Terminal 2, tie-up with Scoot and potential takeover by Singapore Airlines.
Lower fuel prices, better-than-expected traffic and yield growth, higher-than-expected ancillary revenue, higher-than-expected contribution from its associate airlines.
Aggressive fleet expansion plans, rising fuel prices, high financial leverage and potential challenges in securing financing for aircraft deliveries at attractive interest rates,rising LCC competition, further equity raising if sale & leaseback structures become unattractive/losses persist.
Key financial metrics FY13A FY14E FY15E FY16E Valuation and price target basis
Revenues (S$MM) 866 684 823 965 Our Dec-14 price target of S$0.75 is based on 15x Adj. EV/EBITDAR, a 40% discount to Tigerair’s historical average valuation and supported by the recovery of Tiger’s EBITDAR margin to 14% by FY16E, in line with sector peers.
Revenue growth (%) 40.1% -21.1% 20.4% 17.2%
EBITDA (S$MM) 41 (64) (5) 54EBITDA margin (%) 4.8% -9.4% -0.6% 5.6%
Tax rate (%) -29.6% -4.0% -16.0% 16.0%Net profit (S$MM) (45) (136) (76) 8
EPS (S$) (0.06) (0.14) (0.08) 0.01
EPS growth (%) -56.5% 150.1% -44.2% -110.5% Adj.EV/EBITDAR Trading Range Since Listing
DPS (S$) - - - -BVPS (S$) 0.24 0.36 0.28 0.29
Operating cash flow (S$MM) 91 (156) (2) 89Free cash flow (S$MM) 37 (116) (125) (40)
Interest cover (X) 6.02 (20.42) (4.10) 16.68Net margin (%) -5.2% -19.9% -9.2% 0.8%
Sales/assets (X) 0.82 0.65 0.73 0.77Debt/equity (%) 259% 122% 215% 227%Net debt/equity (%) 191% 58% 136% 146%
ROE (%) -20.3% -49.1% -23.9% 2.8%
Key model assumptions FY13A FY14E FY15E FY16E
Passenger carried growth 25.3% -23.1% 15.8% 12.7%Average fare growth 9.5% -3.0% 3.0% 3.0%
Jet fuel price (US$/bbl) 126.0 125.0 125.0 125.0SGD/USD 1.2 1.3 1.3 1.3
Source: Bloomberg, Company and J.P. Morgan estimates. March year end. Source: Bloomberg, Company and J.P. Morgan estimates.
Comparative metrics
CMP Mkt Cap P/E P/BV Adj. EV/EBITDAR ROE YTD
LC $Mn FY13E FY14E FY13E FY14E FY13E FY14E FY13E FY14E Stock perf.Cebu Air, Inc 49.25 689 nm 19.3 1.3 1.2 8.7 6.8 -1.4% 6.4% 5.1%AirAsia 2.39 1,991 16.6 9.2 1.1 1.0 8.8 8.7 6.6% 11.3% 8.6%Tigerair 0.52 396 nm nm 1.4 1.8 nm 17.5 -49.1% -23.9% 1.0%
Global LCCs average 17.3 13.7 1.8 1.8 8.4 8.4 0.7% 0.8% 4.6%Asian airlines average 18.0 15.1 1.1 1.0 7.7 7.3 1.4% 7.5% 1.0%Source: Bloomberg, J.P. Morgan estimates. Forecasts for non-covered (NC) stocks are based on consensus estimates to calculate sector average. Note: Tigerair valuations are for FY14E and FY15E given its March year end. Prices are as of 7 Jan, 2014.
20.49
25.42 28.49
36.64
12.50 14.20
36.48
47.86
4.51 2.98
-
10.00
20.00
30.00
40.00
50.00
60.00
70.00
Ja
n-1
0F
eb-1
0M
ar-
10
Ap
r-10
Ma
y-1
0Ju
n-1
0Ju
l-1
0A
ug
-10
Sep
-10
Oc
t-10
Nov
-10
Dec
-10
Ja
n-1
1F
eb-1
1M
ar-
11
Ap
r-11
Ma
y-1
1Ju
n-1
1Ju
l-1
1A
ug
-11
Sep
-11
Oc
t-11
Nov
-11
Dec
-11
Ja
n-1
2F
eb-1
2M
ar-
12
Ap
r-12
Ma
y-1
2Ju
n-1
2Ju
l-1
2A
ug
-12
Sep
-12
Oc
t-12
Nov
-12
Dec
-12
Ja
n-1
3F
eb-1
3M
ar-
13
Ap
r-13
Ma
y-1
3Ju
n-1
3Ju
l-1
3A
ug
-13
Sep
-13
Oc
t-13
Nov
-13
Dec
-13
Tigerair: Adj.EV/EBITDAR Trading Range Since Listing
Adj. EV/EBITDAR Average +1 Stdev -1 Stdev +2 Stdev -2 Stdev
Current Adj.EV/EBITDAR: 22.24x
10
Asia Pacific Equity Research08 January 2014
Corrine Png(65) [email protected]
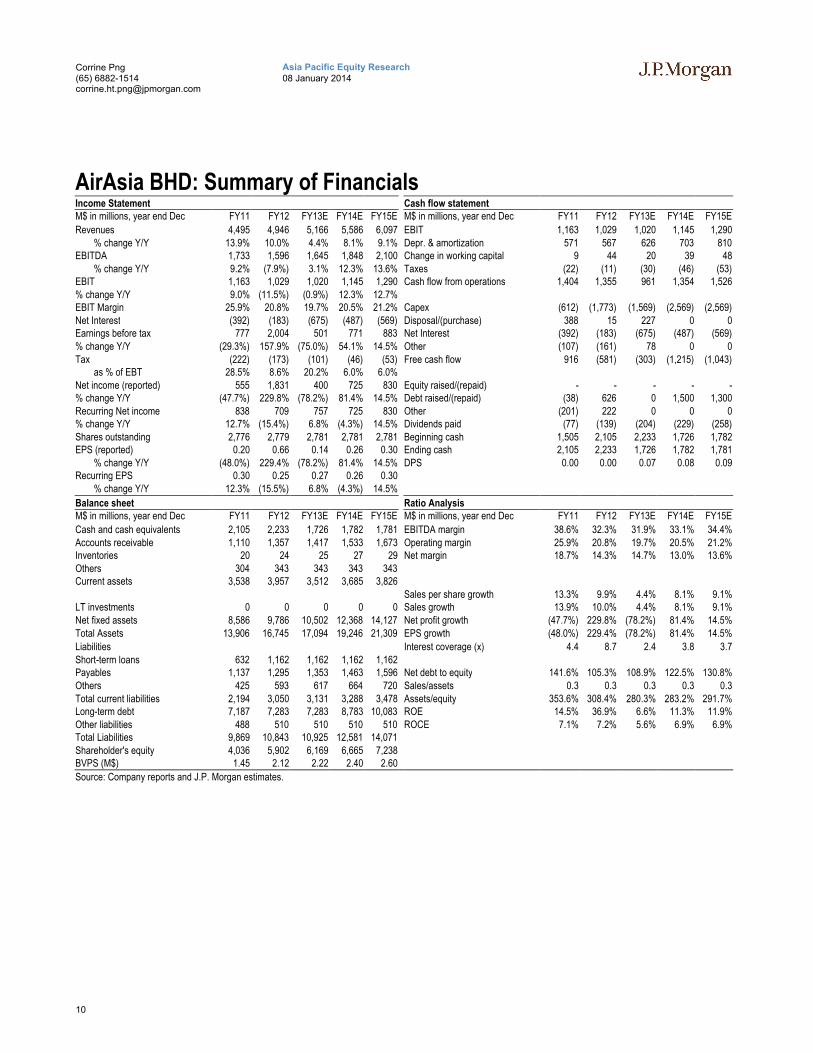
AirAsia BHD: Summary of FinancialsIncome Statement Cash flow statementM$ in millions, year end Dec FY11 FY12 FY13E FY14E FY15E M$ in millions, year end Dec FY11 FY12 FY13E FY14E FY15E
Revenues 4,495 4,946 5,166 5,586 6,097 EBIT 1,163 1,029 1,020 1,145 1,290% change Y/Y 13.9% 10.0% 4.4% 8.1% 9.1% Depr. & amortization 571 567 626 703 810
EBITDA 1,733 1,596 1,645 1,848 2,100 Change in working capital 9 44 20 39 48% change Y/Y 9.2% (7.9%) 3.1% 12.3% 13.6% Taxes (22) (11) (30) (46) (53)
EBIT 1,163 1,029 1,020 1,145 1,290 Cash flow from operations 1,404 1,355 961 1,354 1,526% change Y/Y 9.0% (11.5%) (0.9%) 12.3% 12.7%EBIT Margin 25.9% 20.8% 19.7% 20.5% 21.2% Capex (612) (1,773) (1,569) (2,569) (2,569)Net Interest (392) (183) (675) (487) (569) Disposal/(purchase) 388 15 227 0 0Earnings before tax 777 2,004 501 771 883 Net Interest (392) (183) (675) (487) (569)% change Y/Y (29.3%) 157.9% (75.0%) 54.1% 14.5% Other (107) (161) 78 0 0Tax (222) (173) (101) (46) (53) Free cash flow 916 (581) (303) (1,215) (1,043)
as % of EBT 28.5% 8.6% 20.2% 6.0% 6.0%Net income (reported) 555 1,831 400 725 830 Equity raised/(repaid) - - - - -% change Y/Y (47.7%) 229.8% (78.2%) 81.4% 14.5% Debt raised/(repaid) (38) 626 0 1,500 1,300Recurring Net income 838 709 757 725 830 Other (201) 222 0 0 0% change Y/Y 12.7% (15.4%) 6.8% (4.3%) 14.5% Dividends paid (77) (139) (204) (229) (258)Shares outstanding 2,776 2,779 2,781 2,781 2,781 Beginning cash 1,505 2,105 2,233 1,726 1,782EPS (reported) 0.20 0.66 0.14 0.26 0.30 Ending cash 2,105 2,233 1,726 1,782 1,781
% change Y/Y (48.0%) 229.4% (78.2%) 81.4% 14.5% DPS 0.00 0.00 0.07 0.08 0.09Recurring EPS 0.30 0.25 0.27 0.26 0.30
% change Y/Y 12.3% (15.5%) 6.8% (4.3%) 14.5%
Balance sheet Ratio AnalysisM$ in millions, year end Dec FY11 FY12 FY13E FY14E FY15E M$ in millions, year end Dec FY11 FY12 FY13E FY14E FY15E
Cash and cash equivalents 2,105 2,233 1,726 1,782 1,781 EBITDA margin 38.6% 32.3% 31.9% 33.1% 34.4%Accounts receivable 1,110 1,357 1,417 1,533 1,673 Operating margin 25.9% 20.8% 19.7% 20.5% 21.2%Inventories 20 24 25 27 29 Net margin 18.7% 14.3% 14.7% 13.0% 13.6%Others 304 343 343 343 343Current assets 3,538 3,957 3,512 3,685 3,826
Sales per share growth 13.3% 9.9% 4.4% 8.1% 9.1%LT investments 0 0 0 0 0 Sales growth 13.9% 10.0% 4.4% 8.1% 9.1%Net fixed assets 8,586 9,786 10,502 12,368 14,127 Net profit growth (47.7%) 229.8% (78.2%) 81.4% 14.5%Total Assets 13,906 16,745 17,094 19,246 21,309 EPS growth (48.0%) 229.4% (78.2%) 81.4% 14.5%
Liabilities Interest coverage (x) 4.4 8.7 2.4 3.8 3.7Short-term loans 632 1,162 1,162 1,162 1,162Payables 1,137 1,295 1,353 1,463 1,596 Net debt to equity 141.6% 105.3% 108.9% 122.5% 130.8%Others 425 593 617 664 720 Sales/assets 0.3 0.3 0.3 0.3 0.3Total current liabilities 2,194 3,050 3,131 3,288 3,478 Assets/equity 353.6% 308.4% 280.3% 283.2% 291.7%Long-term debt 7,187 7,283 7,283 8,783 10,083 ROE 14.5% 36.9% 6.6% 11.3% 11.9%Other liabilities 488 510 510 510 510 ROCE 7.1% 7.2% 5.6% 6.9% 6.9%Total Liabilities 9,869 10,843 10,925 12,581 14,071Shareholder's equity 4,036 5,902 6,169 6,665 7,238BVPS (M$) 1.45 2.12 2.22 2.40 2.60
Source: Company reports and J.P. Morgan estimates.
11
Asia Pacific Equity Research08 January 2014
Corrine Png(65) [email protected]
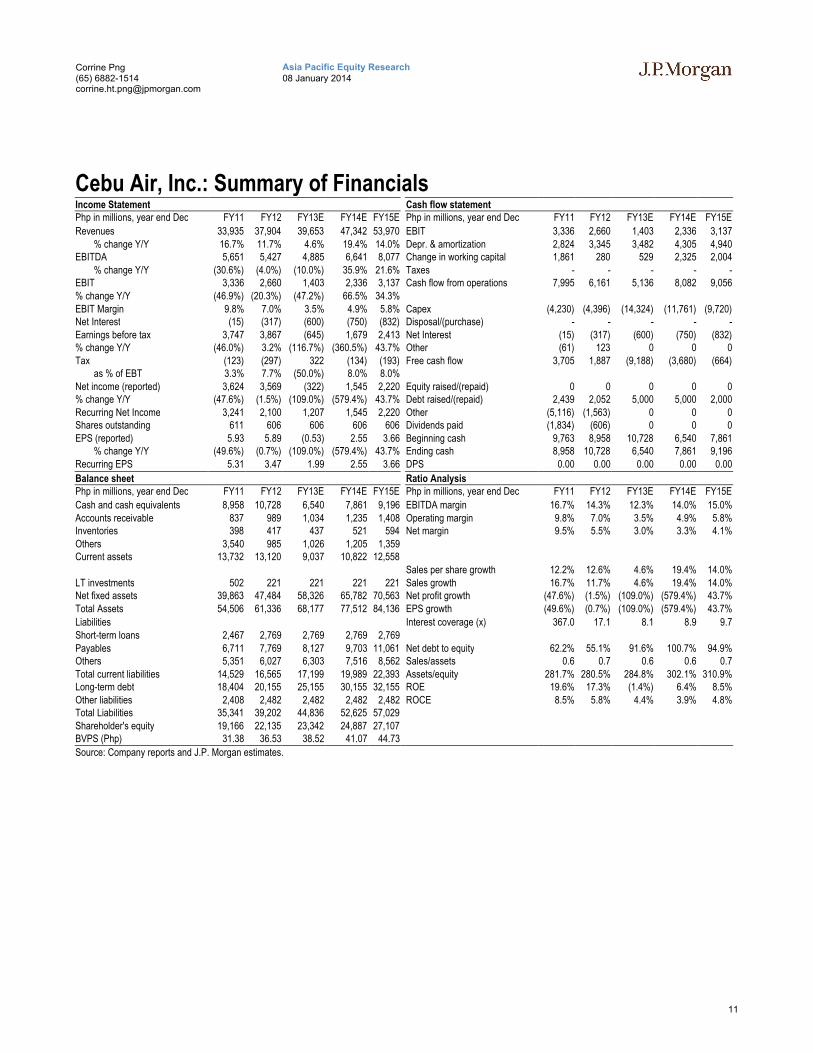
Cebu Air, Inc.: Summary of FinancialsIncome Statement Cash flow statementPhp in millions, year end Dec FY11 FY12 FY13E FY14E FY15E Php in millions, year end Dec FY11 FY12 FY13E FY14E FY15E
Revenues 33,935 37,904 39,653 47,342 53,970 EBIT 3,336 2,660 1,403 2,336 3,137% change Y/Y 16.7% 11.7% 4.6% 19.4% 14.0% Depr. & amortization 2,824 3,345 3,482 4,305 4,940
EBITDA 5,651 5,427 4,885 6,641 8,077 Change in working capital 1,861 280 529 2,325 2,004% change Y/Y (30.6%) (4.0%) (10.0%) 35.9% 21.6% Taxes - - - - -
EBIT 3,336 2,660 1,403 2,336 3,137 Cash flow from operations 7,995 6,161 5,136 8,082 9,056% change Y/Y (46.9%) (20.3%) (47.2%) 66.5% 34.3%EBIT Margin 9.8% 7.0% 3.5% 4.9% 5.8% Capex (4,230) (4,396) (14,324) (11,761) (9,720)Net Interest (15) (317) (600) (750) (832) Disposal/(purchase) - - - - -Earnings before tax 3,747 3,867 (645) 1,679 2,413 Net Interest (15) (317) (600) (750) (832)% change Y/Y (46.0%) 3.2% (116.7%) (360.5%) 43.7% Other (61) 123 0 0 0Tax (123) (297) 322 (134) (193) Free cash flow 3,705 1,887 (9,188) (3,680) (664)
as % of EBT 3.3% 7.7% (50.0%) 8.0% 8.0%Net income (reported) 3,624 3,569 (322) 1,545 2,220 Equity raised/(repaid) 0 0 0 0 0% change Y/Y (47.6%) (1.5%) (109.0%) (579.4%) 43.7% Debt raised/(repaid) 2,439 2,052 5,000 5,000 2,000Recurring Net Income 3,241 2,100 1,207 1,545 2,220 Other (5,116) (1,563) 0 0 0Shares outstanding 611 606 606 606 606 Dividends paid (1,834) (606) 0 0 0EPS (reported) 5.93 5.89 (0.53) 2.55 3.66 Beginning cash 9,763 8,958 10,728 6,540 7,861
% change Y/Y (49.6%) (0.7%) (109.0%) (579.4%) 43.7% Ending cash 8,958 10,728 6,540 7,861 9,196Recurring EPS 5.31 3.47 1.99 2.55 3.66 DPS 0.00 0.00 0.00 0.00 0.00
Balance sheet Ratio AnalysisPhp in millions, year end Dec FY11 FY12 FY13E FY14E FY15E Php in millions, year end Dec FY11 FY12 FY13E FY14E FY15E
Cash and cash equivalents 8,958 10,728 6,540 7,861 9,196 EBITDA margin 16.7% 14.3% 12.3% 14.0% 15.0%Accounts receivable 837 989 1,034 1,235 1,408 Operating margin 9.8% 7.0% 3.5% 4.9% 5.8%Inventories 398 417 437 521 594 Net margin 9.5% 5.5% 3.0% 3.3% 4.1%Others 3,540 985 1,026 1,205 1,359Current assets 13,732 13,120 9,037 10,822 12,558
Sales per share growth 12.2% 12.6% 4.6% 19.4% 14.0%LT investments 502 221 221 221 221 Sales growth 16.7% 11.7% 4.6% 19.4% 14.0%Net fixed assets 39,863 47,484 58,326 65,782 70,563 Net profit growth (47.6%) (1.5%) (109.0%) (579.4%) 43.7%Total Assets 54,506 61,336 68,177 77,512 84,136 EPS growth (49.6%) (0.7%) (109.0%) (579.4%) 43.7%
Liabilities Interest coverage (x) 367.0 17.1 8.1 8.9 9.7Short-term loans 2,467 2,769 2,769 2,769 2,769Payables 6,711 7,769 8,127 9,703 11,061 Net debt to equity 62.2% 55.1% 91.6% 100.7% 94.9%Others 5,351 6,027 6,303 7,516 8,562 Sales/assets 0.6 0.7 0.6 0.6 0.7Total current liabilities 14,529 16,565 17,199 19,989 22,393 Assets/equity 281.7% 280.5% 284.8% 302.1% 310.9%Long-term debt 18,404 20,155 25,155 30,155 32,155 ROE 19.6% 17.3% (1.4%) 6.4% 8.5%Other liabilities 2,408 2,482 2,482 2,482 2,482 ROCE 8.5% 5.8% 4.4% 3.9% 4.8%Total Liabilities 35,341 39,202 44,836 52,625 57,029Shareholder's equity 19,166 22,135 23,342 24,887 27,107BVPS (Php) 31.38 36.53 38.52 41.07 44.73
Source: Company reports and J.P. Morgan estimates.
12
Asia Pacific Equity Research08 January 2014
Corrine Png(65) [email protected]
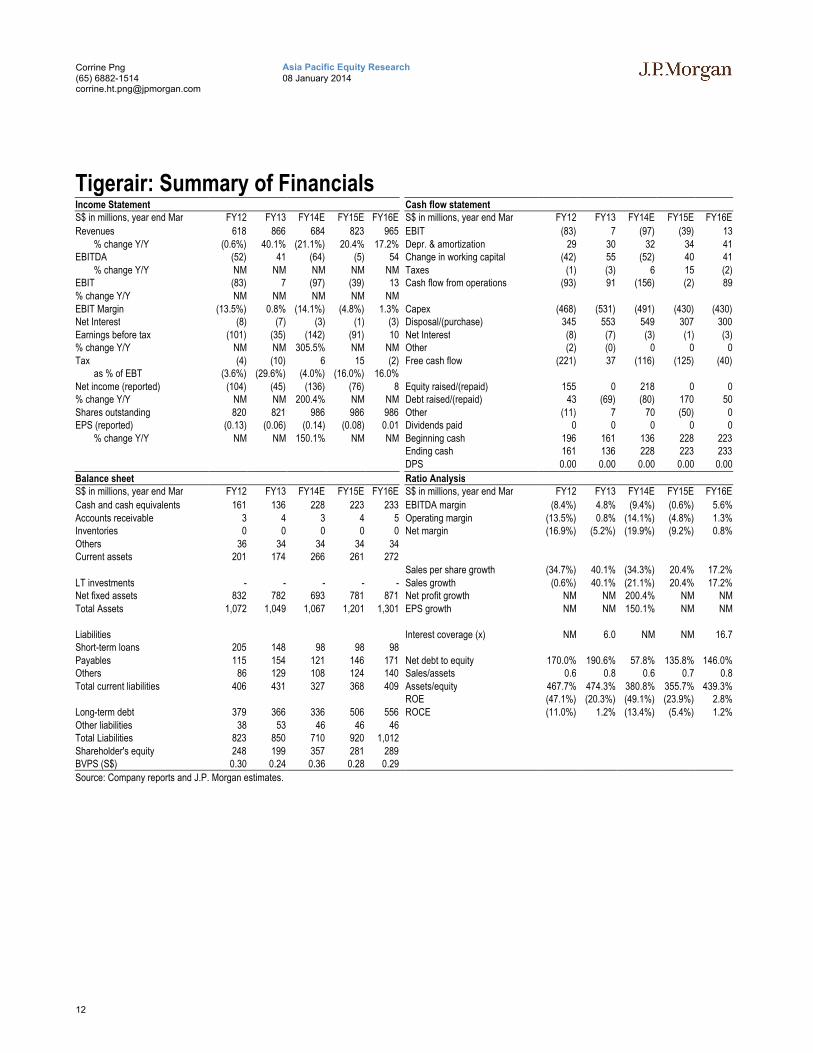
Tigerair: Summary of FinancialsIncome Statement Cash flow statementS$ in millions, year end Mar FY12 FY13 FY14E FY15E FY16E S$ in millions, year end Mar FY12 FY13 FY14E FY15E FY16E
Revenues 618 866 684 823 965 EBIT (83) 7 (97) (39) 13% change Y/Y (0.6%) 40.1% (21.1%) 20.4% 17.2% Depr. & amortization 29 30 32 34 41
EBITDA (52) 41 (64) (5) 54 Change in working capital (42) 55 (52) 40 41% change Y/Y NM NM NM NM NM Taxes (1) (3) 6 15 (2)
EBIT (83) 7 (97) (39) 13 Cash flow from operations (93) 91 (156) (2) 89% change Y/Y NM NM NM NM NMEBIT Margin (13.5%) 0.8% (14.1%) (4.8%) 1.3% Capex (468) (531) (491) (430) (430)Net Interest (8) (7) (3) (1) (3) Disposal/(purchase) 345 553 549 307 300Earnings before tax (101) (35) (142) (91) 10 Net Interest (8) (7) (3) (1) (3)% change Y/Y NM NM 305.5% NM NM Other (2) (0) 0 0 0Tax (4) (10) 6 15 (2) Free cash flow (221) 37 (116) (125) (40)
as % of EBT (3.6%) (29.6%) (4.0%) (16.0%) 16.0%Net income (reported) (104) (45) (136) (76) 8 Equity raised/(repaid) 155 0 218 0 0% change Y/Y NM NM 200.4% NM NM Debt raised/(repaid) 43 (69) (80) 170 50Shares outstanding 820 821 986 986 986 Other (11) 7 70 (50) 0EPS (reported) (0.13) (0.06) (0.14) (0.08) 0.01 Dividends paid 0 0 0 0 0
% change Y/Y NM NM 150.1% NM NM Beginning cash 196 161 136 228 223Ending cash 161 136 228 223 233DPS 0.00 0.00 0.00 0.00 0.00
Balance sheet Ratio AnalysisS$ in millions, year end Mar FY12 FY13 FY14E FY15E FY16E S$ in millions, year end Mar FY12 FY13 FY14E FY15E FY16E
Cash and cash equivalents 161 136 228 223 233 EBITDA margin (8.4%) 4.8% (9.4%) (0.6%) 5.6%Accounts receivable 3 4 3 4 5 Operating margin (13.5%) 0.8% (14.1%) (4.8%) 1.3%Inventories 0 0 0 0 0 Net margin (16.9%) (5.2%) (19.9%) (9.2%) 0.8%Others 36 34 34 34 34Current assets 201 174 266 261 272. Sales per share growth (34.7%) 40.1% (34.3%) 20.4% 17.2%LT investments - - - - - Sales growth (0.6%) 40.1% (21.1%) 20.4% 17.2%Net fixed assets 832 782 693 781 871 Net profit growth NM NM 200.4% NM NMTotal Assets 1,072 1,049 1,067 1,201 1,301 EPS growth NM NM 150.1% NM NM.Liabilities Interest coverage (x) NM 6.0 NM NM 16.7Short-term loans 205 148 98 98 98Payables 115 154 121 146 171 Net debt to equity 170.0% 190.6% 57.8% 135.8% 146.0%Others 86 129 108 124 140 Sales/assets 0.6 0.8 0.6 0.7 0.8Total current liabilities 406 431 327 368 409 Assets/equity 467.7% 474.3% 380.8% 355.7% 439.3%. ROE (47.1%) (20.3%) (49.1%) (23.9%) 2.8%Long-term debt 379 366 336 506 556 ROCE (11.0%) 1.2% (13.4%) (5.4%) 1.2%Other liabilities 38 53 46 46 46Total Liabilities 823 850 710 920 1,012Shareholder's equity 248 199 357 281 289BVPS (S$) 0.30 0.24 0.36 0.28 0.29
Source: Company reports and J.P. Morgan estimates.

13
Asia Pacific Equity Research08 January 2014
Corrine Png(65) [email protected]
JPM Q-ProfileAirAsia Bhd. (MALAYSIA / Industrials)As Of: 03-Jan-2014 [email protected]
Local Share Price Current: 2.51 12 Mth Forward EPS Current: 0.30
Earnings Yield (& local bond Yield) Current: 12% Implied Value Of Growth* Current: -37.80%
PE (1Yr Forward) Current: 8.4x Price/Book Value Current: 1.5x
ROE (Trailing) Current: 12.69 Dividend Yield (Trailing) Current: 2.24
Summary
AirAsia Bhd. 2160.72 As Of:
MALAYSIA 6.742229 SEDOL B03J9L7 Local Price: 2.51
Industrials Airlines EPS: 0.30
Latest Min Max Median Average 2 S.D.+ 2 S.D. - % to Min % to Max % to Med % to Avg12mth Forward PE 8.36x 5.77 28.02 10.27 12.63 23.57 1.68 -31% 235% 23% 51%P/BV (Trailing) 1.52x 0.91 10.43 1.98 2.33 4.76 -0.10 -40% 587% 31% 53%
Dividend Yield (Trailing) 2.24 0.00 2.34 0.00 0.50 2.05 -1.04 -100% 5% -100% -78%
ROE (Trailing) 12.69 1.89 49.24 29.83 28.23 51.71 4.74 -85% 288% 135% 122%
Implied Value of Growth -37.8% -0.98 0.59 -0.09 -0.04 0.81 -0.89 -158% 257% 75% 89%
Source: Bloomberg, Reuters Global Fundamentals, IBES CONSENSUS, J.P. Morgan Calcs * Implied Value Of Growth = (1 - EY/Cost of equity) where cost of equity =Bond Yield + 5.0% (ERP)
3-Jan-14
-0.10
0.00
0.10
0.20
0.30
0.40
0.50
Oct
/98
May
/99
Dec
/99
Jul/0
0
Feb
/01
Sep
/01
Apr
/02
Nov
/02
Jun/
03
Jan/
04
Aug
/04
Mar
/05
Oct
/05
May
/06
Dec
/06
Jul/0
7
Feb
/08
Sep
/08
Apr
/09
Nov
/09
Jun/
10
Jan/
11
Aug
/11
Mar
/12
Oct
/12
May
/13
Dec
/13
0%
2%
4%
6%
8%
10%
12%
14%
16%
18%
20%
Oct
/98
May
/99
Dec
/99
Jul/0
0
Feb
/01
Sep
/01
Apr
/02
Nov
/02
Jun/
03
Jan/
04
Aug
/04
Mar
/05
Oct
/05
May
/06
Dec
/06
Jul/0
7
Feb
/08
Sep
/08
Apr
/09
Nov
/09
Jun/
10
Jan/
11
Aug
/11
Mar
/12
Oct
/12
May
/13
Dec
/13
12Mth fwd EY Malaysia BY Proxy
0.00
0.50
1.00
1.50
2.00
2.50
3.00
3.50
4.00
4.50
Oct
/98
May
/99
Dec
/99
Jul/0
0
Feb
/01
Sep
/01
Apr
/02
Nov
/02
Jun/
03
Jan/
04
Aug
/04
Mar
/05
Oct
/05
May
/06
Dec
/06
Jul/0
7
Feb
/08
Sep
/08
Apr
/09
Nov
/09
Jun/
10
Jan/
11
Aug
/11
Mar
/12
Oct
/12
May
/13
Dec
/13
-1.20
-1.00
-0.80
-0.60
-0.40
-0.20
0.00
0.20
0.40
0.60
0.80
1.00
Oct
/98
May
/99
Dec
/99
Jul/0
0
Feb
/01
Sep
/01
Apr
/02
Nov
/02
Jun/
03
Jan/
04
Aug
/04
Mar
/05
Oct
/05
May
/06
Dec
/06
Jul/0
7
Feb
/08
Sep
/08
Apr
/09
Nov
/09
Jun/
10
Jan/
11
Aug
/11
Mar
/12
Oct
/12
May
/13
Dec
/13
0.0x
5.0x
10.0x
15.0x
20.0x
25.0x
30.0x
Oct
/98
May
/99
Dec
/99
Jul/0
0
Feb
/01
Sep
/01
Apr
/02
Nov
/02
Jun/
03
Jan/
04
Aug
/04
Mar
/05
Oct
/05
May
/06
Dec
/06
Jul/0
7
Feb
/08
Sep
/08
Apr
/09
Nov
/09
Jun/
10
Jan/
11
Aug
/11
Mar
/12
Oct
/12
May
/13
Dec
/13
-2.0x
0.0x
2.0x
4.0x
6.0x
8.0x
10.0x
12.0x
Oct
/98
May
/99
Dec
/99
Jul/0
0
Feb
/01
Sep
/01
Apr
/02
Nov
/02
Jun/
03
Jan/
04
Aug
/04
Mar
/05
Oct
/05
May
/06
Dec
/06
Jul/0
7
Feb
/08
Sep
/08
Apr
/09
Nov
/09
Jun/
10
Jan/
11
Aug
/11
Mar
/12
Oct
/12
May
/13
Dec
/13
PBV hist PBV Forward
0.00
10.00
20.00
30.00
40.00
50.00
60.00
Oct
/98
May
/99
Dec
/99
Jul/0
0
Feb
/01
Sep
/01
Apr
/02
Nov
/02
Jun/
03
Jan/
04
Aug
/04
Mar
/05
Oct
/05
May
/06
Dec
/06
Jul/0
7
Feb
/08
Sep
/08
Apr
/09
Nov
/09
Jun/
10
Jan/
11
Aug
/11
Mar
/12
Oct
/12
May
/13
Dec
/13
0.0
0.5
1.0
1.5
2.0
2.5
Oct
/98
May
/99
Dec
/99
Jul/0
0
Feb
/01
Sep
/01
Apr
/02
Nov
/02
Jun/
03
Jan/
04
Aug
/04
Mar
/05
Oct
/05
May
/06
Dec
/06
Jul/0
7
Feb
/08
Sep
/08
Apr
/09
Nov
/09
Jun/
10
Jan/
11
Aug
/11
Mar
/12
Oct
/12
May
/13
Dec
/13
14
Asia Pacific Equity Research08 January 2014
Corrine Png(65) [email protected]
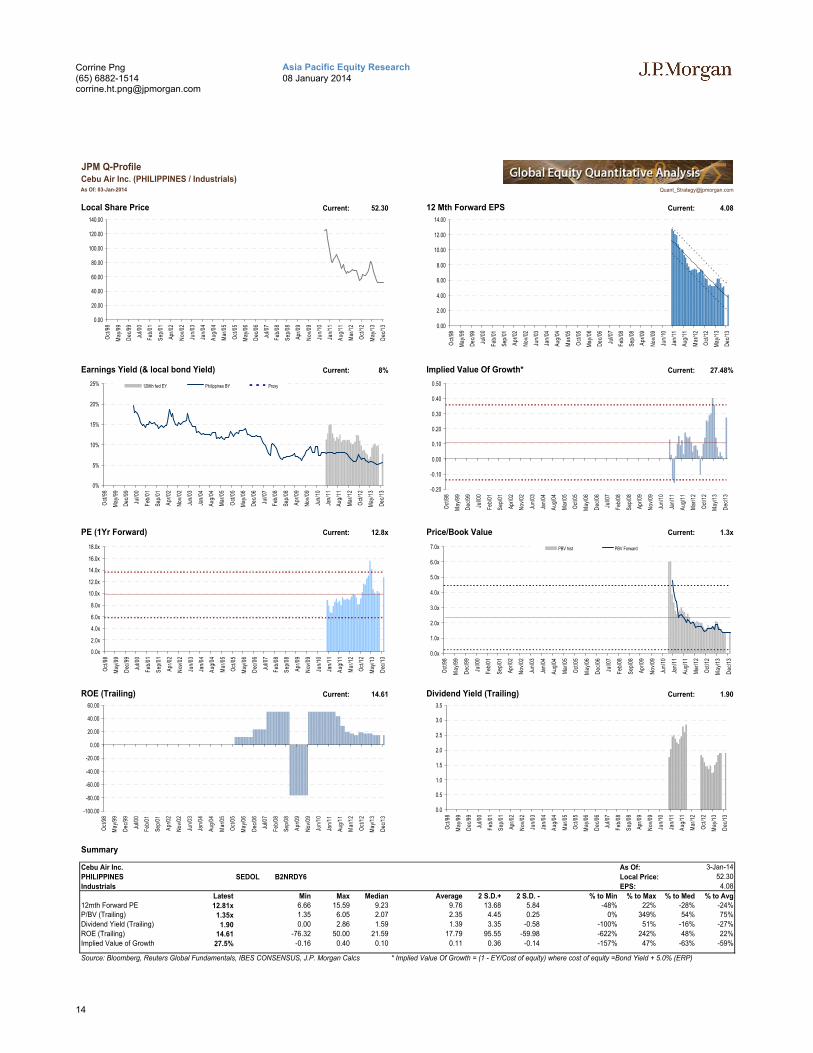
JPM Q-ProfileCebu Air Inc. (PHILIPPINES / Industrials)As Of: 03-Jan-2014 [email protected]
Local Share Price Current: 52.30 12 Mth Forward EPS Current: 4.08
Earnings Yield (& local bond Yield) Current: 8% Implied Value Of Growth* Current: 27.48%
PE (1Yr Forward) Current: 12.8x Price/Book Value Current: 1.3x
ROE (Trailing) Current: 14.61 Dividend Yield (Trailing) Current: 1.90
Summary
Cebu Air Inc. 725.64 As Of:
PHILIPPINES 0.3299249 SEDOL B2NRDY6 Local Price: 52.30
Industrials Airlines EPS: 4.08
Latest Min Max Median Average 2 S.D.+ 2 S.D. - % to Min % to Max % to Med % to Avg12mth Forward PE 12.81x 6.66 15.59 9.23 9.76 13.68 5.84 -48% 22% -28% -24%P/BV (Trailing) 1.35x 1.35 6.05 2.07 2.35 4.45 0.25 0% 349% 54% 75%
Dividend Yield (Trailing) 1.90 0.00 2.86 1.59 1.39 3.35 -0.58 -100% 51% -16% -27%
ROE (Trailing) 14.61 -76.32 50.00 21.59 17.79 95.55 -59.98 -622% 242% 48% 22%
Implied Value of Growth 27.5% -0.16 0.40 0.10 0.11 0.36 -0.14 -157% 47% -63% -59%
Source: Bloomberg, Reuters Global Fundamentals, IBES CONSENSUS, J.P. Morgan Calcs * Implied Value Of Growth = (1 - EY/Cost of equity) where cost of equity =Bond Yield + 5.0% (ERP)
3-Jan-14
0.00
2.00
4.00
6.00
8.00
10.00
12.00
14.00
Oct
/98
May
/99
Dec
/99
Jul/0
0
Feb
/01
Sep
/01
Apr
/02
Nov
/02
Jun/
03
Jan/
04
Aug
/04
Mar
/05
Oct
/05
May
/06
Dec
/06
Jul/0
7
Feb
/08
Sep
/08
Apr
/09
Nov
/09
Jun/
10
Jan/
11
Aug
/11
Mar
/12
Oct
/12
May
/13
Dec
/13
0%
5%
10%
15%
20%
25%
Oct
/98
May
/99
Dec
/99
Jul/0
0
Feb
/01
Sep
/01
Apr
/02
Nov
/02
Jun/
03
Jan/
04
Aug
/04
Mar
/05
Oct
/05
May
/06
Dec
/06
Jul/0
7
Feb
/08
Sep
/08
Apr
/09
Nov
/09
Jun/
10
Jan/
11
Aug
/11
Mar
/12
Oct
/12
May
/13
Dec
/13
12Mth fwd EY Philippines BY Proxy
0.00
20.00
40.00
60.00
80.00
100.00
120.00
140.00
Oct
/98
May
/99
Dec
/99
Jul/0
0
Feb
/01
Sep
/01
Apr
/02
Nov
/02
Jun/
03
Jan/
04
Aug
/04
Mar
/05
Oct
/05
May
/06
Dec
/06
Jul/0
7
Feb
/08
Sep
/08
Apr
/09
Nov
/09
Jun/
10
Jan/
11
Aug
/11
Mar
/12
Oct
/12
May
/13
Dec
/13
-0.20
-0.10
0.00
0.10
0.20
0.30
0.40
0.50
Oct
/98
May
/99
Dec
/99
Jul/0
0
Feb
/01
Sep
/01
Apr
/02
Nov
/02
Jun/
03
Jan/
04
Aug
/04
Mar
/05
Oct
/05
May
/06
Dec
/06
Jul/0
7
Feb
/08
Sep
/08
Apr
/09
Nov
/09
Jun/
10
Jan/
11
Aug
/11
Mar
/12
Oct
/12
May
/13
Dec
/13
0.0x
2.0x
4.0x
6.0x
8.0x
10.0x
12.0x
14.0x
16.0x
18.0x
Oct
/98
May
/99
Dec
/99
Jul/0
0
Feb
/01
Sep
/01
Apr
/02
Nov
/02
Jun/
03
Jan/
04
Aug
/04
Mar
/05
Oct
/05
May
/06
Dec
/06
Jul/0
7
Feb
/08
Sep
/08
Apr
/09
Nov
/09
Jun/
10
Jan/
11
Aug
/11
Mar
/12
Oct
/12
May
/13
Dec
/13
0.0x
1.0x
2.0x
3.0x
4.0x
5.0x
6.0x
7.0x
Oct
/98
May
/99
Dec
/99
Jul/0
0
Feb
/01
Sep
/01
Apr
/02
Nov
/02
Jun/
03
Jan/
04
Aug
/04
Mar
/05
Oct
/05
May
/06
Dec
/06
Jul/0
7
Feb
/08
Sep
/08
Apr
/09
Nov
/09
Jun/
10
Jan/
11
Aug
/11
Mar
/12
Oct
/12
May
/13
Dec
/13
PBV hist PBV Forward
-100.00
-80.00
-60.00
-40.00
-20.00
0.00
20.00
40.00
60.00
Oct
/98
May
/99
Dec
/99
Jul/0
0
Feb
/01
Sep
/01
Apr
/02
Nov
/02
Jun/
03
Jan/
04
Aug
/04
Mar
/05
Oct
/05
May
/06
Dec
/06
Jul/0
7
Feb
/08
Sep
/08
Apr
/09
Nov
/09
Jun/
10
Jan/
11
Aug
/11
Mar
/12
Oct
/12
May
/13
Dec
/13
0.0
0.5
1.0
1.5
2.0
2.5
3.0
3.5
Oct
/98
May
/99
Dec
/99
Jul/0
0
Feb
/01
Sep
/01
Apr
/02
Nov
/02
Jun/
03
Jan/
04
Aug
/04
Mar
/05
Oct
/05
May
/06
Dec
/06
Jul/0
7
Feb
/08
Sep
/08
Apr
/09
Nov
/09
Jun/
10
Jan/
11
Aug
/11
Mar
/12
Oct
/12
May
/13
Dec
/13

15
Asia Pacific Equity Research08 January 2014
Corrine Png(65) [email protected]
JPM Q-ProfileTiger Airways Holdings Limited (SINGAPORE / Industrials)As Of: 03-Jan-2014 [email protected]
Local Share Price Current: 0.51 12 Mth Forward EPS Current: 0.00
Earnings Yield (& local bond Yield) Current: 0% Implied Value Of Growth* Current: 97.04%
PE (1Yr Forward) Current: 75.0x Price/Book Value Current: 1.0x
ROE (Trailing) Current: -6.23 Dividend Yield (Trailing) Current: 0.00
Summary
Tiger Airways Holdings Limited 400.41 As Of:
SINGAPORE 0.3143362 SEDOL B3MVRX3 Local Price: 0.51
Industrials Airlines EPS: 0.00
Latest Min Max Median Average 2 S.D.+ 2 S.D. - % to Min % to Max % to Med % to Avg12mth Forward PE 75.00x -20.00 75.00 13.31 21.17 60.63 -18.29 -127% 0% -82% -72%P/BV (Trailing) 1.00x 0.00 6.81 2.83 3.35 7.00 -0.30 -100% 583% 184% 236%
Dividend Yield (Trailing) 0.00 0.00 0.00 0.00 0.00 0.00 0.00
ROE (Trailing) -6.23 -49.17 50.00 -18.47 -2.36 72.08 -76.79 -689% 902% -196% 62%
Implied Value of Growth 97.0% -0.63 1.12 0.03 0.17 1.13 -0.79 -165% 15% -97% -82%
Source: Bloomberg, Reuters Global Fundamentals, IBES CONSENSUS, J.P. Morgan Calcs * Implied Value Of Growth = (1 - EY/Cost of equity) where cost of equity =Bond Yield + 5.0% (ERP)
3-Jan-14
-0.10
-0.05
0.00
0.05
0.10
0.15
0.20
Oct
/98
May
/99
Dec
/99
Jul/0
0
Feb
/01
Sep
/01
Apr
/02
Nov
/02
Jun/
03
Jan/
04
Aug
/04
Mar
/05
Oct
/05
May
/06
Dec
/06
Jul/0
7
Feb
/08
Sep
/08
Apr
/09
Nov
/09
Jun/
10
Jan/
11
Aug
/11
Mar
/12
Oct
/12
May
/13
Dec
/13
-2%
0%
2%
4%
6%
8%
10%
12%
Oct
/98
May
/99
Dec
/99
Jul/0
0
Feb
/01
Sep
/01
Apr
/02
Nov
/02
Jun/
03
Jan/
04
Aug
/04
Mar
/05
Oct
/05
May
/06
Dec
/06
Jul/0
7
Feb
/08
Sep
/08
Apr
/09
Nov
/09
Jun/
10
Jan/
11
Aug
/11
Mar
/12
Oct
/12
May
/13
Dec
/13
12Mth fwd EY Singapore BY Proxy
0.00
0.20
0.40
0.60
0.80
1.00
1.20
1.40
1.60
1.80
2.00
Oct
/98
May
/99
Dec
/99
Jul/0
0
Feb
/01
Sep
/01
Apr
/02
Nov
/02
Jun/
03
Jan/
04
Aug
/04
Mar
/05
Oct
/05
May
/06
Dec
/06
Jul/0
7
Feb
/08
Sep
/08
Apr
/09
Nov
/09
Jun/
10
Jan/
11
Aug
/11
Mar
/12
Oct
/12
May
/13
Dec
/13
-1.00
-0.50
0.00
0.50
1.00
1.50
Oct
/98
May
/99
Dec
/99
Jul/0
0
Feb
/01
Sep
/01
Apr
/02
Nov
/02
Jun/
03
Jan/
04
Aug
/04
Mar
/05
Oct
/05
May
/06
Dec
/06
Jul/0
7
Feb
/08
Sep
/08
Apr
/09
Nov
/09
Jun/
10
Jan/
11
Aug
/11
Mar
/12
Oct
/12
May
/13
Dec
/13
-40.0x
-20.0x
0.0x
20.0x
40.0x
60.0x
80.0x
Oct
/98
May
/99
Dec
/99
Jul/0
0
Feb
/01
Sep
/01
Apr
/02
Nov
/02
Jun/
03
Jan/
04
Aug
/04
Mar
/05
Oct
/05
May
/06
Dec
/06
Jul/0
7
Feb
/08
Sep
/08
Apr
/09
Nov
/09
Jun/
10
Jan/
11
Aug
/11
Mar
/12
Oct
/12
May
/13
Dec
/13
-1.0x
0.0x
1.0x
2.0x
3.0x
4.0x
5.0x
6.0x
7.0x
8.0x
Oct
/98
May
/99
Dec
/99
Jul/0
0
Feb
/01
Sep
/01
Apr
/02
Nov
/02
Jun/
03
Jan/
04
Aug
/04
Mar
/05
Oct
/05
May
/06
Dec
/06
Jul/0
7
Feb
/08
Sep
/08
Apr
/09
Nov
/09
Jun/
10
Jan/
11
Aug
/11
Mar
/12
Oct
/12
May
/13
Dec
/13
PBV hist PBV Forward
-60.00
-40.00
-20.00
0.00
20.00
40.00
60.00
Oct
/98
May
/99
Dec
/99
Jul/0
0
Feb
/01
Sep
/01
Apr
/02
Nov
/02
Jun/
03
Jan/
04
Aug
/04
Mar
/05
Oct
/05
May
/06
Dec
/06
Jul/0
7
Feb
/08
Sep
/08
Apr
/09
Nov
/09
Jun/
10
Jan/
11
Aug
/11
Mar
/12
Oct
/12
May
/13
Dec
/13
0.0
0.1
0.2
0.3
0.4
0.5
0.6
0.7
0.8
0.9
1.0
Oct
/98
May
/99
Dec
/99
Jul/0
0
Feb
/01
Sep
/01
Apr
/02
Nov
/02
Jun/
03
Jan/
04
Aug
/04
Mar
/05
Oct
/05
May
/06
Dec
/06
Jul/0
7
Feb
/08
Sep
/08
Apr
/09
Nov
/09
Jun/
10
Jan/
11
Aug
/11
Mar
/12
Oct
/12
May
/13
Dec
/13

16
Asia Pacific Equity Research08 January 2014
Corrine Png(65) [email protected]
Other Companies Discussed in This Report (all prices in this report as of market close on 08 January 2014)Singapore Airlines (SIAL.SI/S$10.23/Overweight)
Analyst Certification: The research analyst(s) denoted by an “AC” on the cover of this report certifies (or, where multiple research analysts are primarily responsible for this report, the research analyst denoted by an “AC” on the cover or within the document individually certifies, with respect to each security or issuer that the research analyst covers in this research) that: (1) all of the views expressed in this report accurately reflect his or her personal views about any and all of the subject securities or issuers; and (2) no part of any of the research analyst's compensation was, is, or will be directly or indirectly related to the specific recommendations or views expressed by the research analyst(s) in this report. For all Korea-based research analysts listed on the front cover, they also certify, as per KOFIA requirements, that their analysis was made in good faith and that the views reflect their own opinion, without undue influence or intervention.
Important Disclosures
Client: J.P. Morgan currently has, or had within the past 12 months, the following company(ies) as clients: AirAsia BHD, Cebu Air, Inc., Tigerair, Singapore Airlines.
Client/Investment Banking: J.P. Morgan currently has, or had within the past 12 months, the following company(ies) as investment banking clients: AirAsia BHD, Tigerair.
Client/Non-Investment Banking, Securities-Related: J.P. Morgan currently has, or had within the past 12 months, the following company(ies) as clients, and the services provided were non-investment-banking, securities-related: AirAsia BHD, Cebu Air, Inc., Singapore Airlines.
Client/Non-Securities-Related: J.P. Morgan currently has, or had within the past 12 months, the following company(ies) as clients, and the services provided were non-securities-related: AirAsia BHD, Cebu Air, Inc..
Investment Banking (past 12 months): J.P. Morgan received in the past 12 months compensation from investment banking AirAsia BHD, Tigerair.
Investment Banking (next 3 months): J.P. Morgan expects to receive, or intends to seek, compensation for investment banking services in the next three months from AirAsia BHD, Tigerair.
Non-Investment Banking Compensation: J.P. Morgan has received compensation in the past 12 months for products or services other than investment banking from AirAsia BHD, Cebu Air, Inc., Singapore Airlines.
Company-Specific Disclosures: Important disclosures, including price charts, are available for compendium reports and all J.P. Morgan–covered companies by visiting https://jpmm.com/research/disclosures, calling 1-800-477-0406, or e-mailing [email protected] with your request. J.P. Morgan’s Strategy, Technical, and Quantitative Research teams may screen companies not covered by J.P. Morgan. For important disclosures for these companies, please call 1-800-477-0406 or e-mail [email protected].
Date Rating Share Price (M$)
Price Target (M$)
19-Jul-07 UW 1.94 --
10-Apr-12 OW 3.40 4.30
29-Aug-12 OW 3.56 4.00
22-Aug-13 N 3.08 3.00
21-Nov-13 N 2.51 2.50
0
1
2
3
4
5
6
7
Price(M$)
Oct06
Apr08
Oct09
Apr11
Oct12
AirAsia BHD (AIRA.KL, AIRA MK) Price Chart
N M$2.5
UW OW M$4.3OW M$4 N M$3
Source: Bloomberg and J.P. Morgan; price data adjusted for stock splits and dividends.
Break in coverage Jul 19, 2007 - Apr 10, 2012.
17
Asia Pacific Equity Research08 January 2014
Corrine Png(65) [email protected]
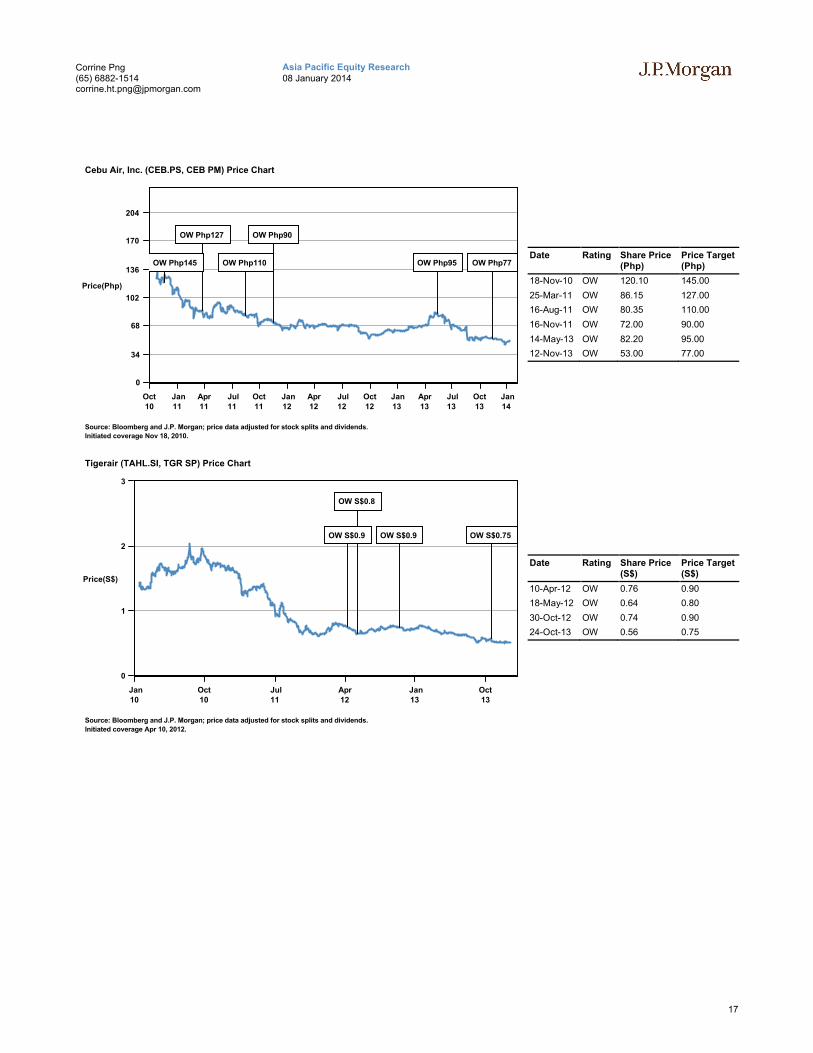
Date Rating Share Price (Php)
Price Target (Php)
18-Nov-10 OW 120.10 145.00
25-Mar-11 OW 86.15 127.00
16-Aug-11 OW 80.35 110.00
16-Nov-11 OW 72.00 90.00
14-May-13 OW 82.20 95.00
12-Nov-13 OW 53.00 77.00
Date Rating Share Price (S$)
Price Target (S$)
10-Apr-12 OW 0.76 0.90
18-May-12 OW 0.64 0.80
30-Oct-12 OW 0.74 0.90
24-Oct-13 OW 0.56 0.75
0
34
68
102
136
170
204
Price(Php)
Oct10
Jan11
Apr11
Jul11
Oct11
Jan12
Apr12
Jul12
Oct12
Jan13
Apr13
Jul13
Oct13
Jan14
Cebu Air, Inc. (CEB.PS, CEB PM) Price Chart
OW Php127 OW Php90
OW Php145 OW Php110 OW Php95 OW Php77
Source: Bloomberg and J.P. Morgan; price data adjusted for stock splits and dividends.
Initiated coverage Nov 18, 2010.
0
1
2
3
Price(S$)
Jan10
Oct10
Jul11
Apr12
Jan13
Oct13
Tigerair (TAHL.SI, TGR SP) Price Chart
OW S$0.8
OW S$0.9 OW S$0.9 OW S$0.75
Source: Bloomberg and J.P. Morgan; price data adjusted for stock splits and dividends.
Initiated coverage Apr 10, 2012.

18
Asia Pacific Equity Research08 January 2014
Corrine Png(65) [email protected]
Date Rating Share Price (S$)
Price Target (S$)
29-Oct-06 OW 15.62 16.50
09-Feb-07 OW 17.42 17.50
11-Feb-07 N 17.02 17.50
16-Apr-07 N 17.92 16.50
11-May-07 N 18.52 18.50
09-Jun-08 N 15.40 15.00
15-Jul-08 N 14.78 13.10
12-Dec-08 N 11.04 10.00
17-Feb-09 N 9.97 9.40
07-Jul-09 OW 12.88 14.00
11-Nov-09 OW 14.08 16.00
02-Feb-10 OW 13.66 17.00
10-Nov-10 OW 16.18 20.00
13-May-11 OW 14.26 19.00
04-Nov-11 OW 11.29 15.50
02-Feb-12 OW 11.00 14.00
16-Jul-12 OW 10.60 13.00
The chart(s) show J.P. Morgan's continuing coverage of the stocks; the current analysts may or may not have covered it over the entire period. J.P. Morgan ratings or designations: OW = Overweight, N= Neutral, UW = Underweight, NR = Not Rated
Explanation of Equity Research Ratings, Designations and Analyst(s) Coverage Universe: J.P. Morgan uses the following rating system: Overweight [Over the next six to twelve months, we expect this stock will outperform the average total return of the stocks in the analyst’s (or the analyst’s team’s) coverage universe.] Neutral [Over the next six to twelve months, we expect this stock will perform in line with the average total return of the stocks in the analyst’s (or the analyst’s team’s) coverage universe.] Underweight [Over the next six to twelve months, we expect this stock will underperform the average total return of the stocks in the analyst’s (or the analyst’s team’s) coverage universe.] Not Rated (NR): J.P. Morgan has removed the rating and, if applicable, the price target, for this stock because of either a lack of a sufficient fundamental basis or for legal, regulatory or policy reasons. The previous rating and, if applicable, the price target, no longer should be relied upon. An NR designation is not a recommendation or a rating. In our Asia (ex-Australia) and U.K. small- and mid-cap equity research, each stock’s expected total return is compared to the expected total return of a benchmark country market index, not to those analysts’ coverage universe. If it does not appear in the Important Disclosures section of this report, the certifying analyst’s coverage universe can be found on J.P. Morgan’s research website, www.jpmorganmarkets.com.
Coverage Universe: Png, Corrine: Air China – H (0753.HK), AirAsia BHD (AIRA.KL), Cathay Pacific (0293.HK), Cebu Air, Inc. (CEB.PS), China Airlines (2610.TW), China Cosco Holdings, Ltd. - H (1919.HK), China Eastern Airlines - H (0670.HK), China Shipping Container Lines - H (2866.HK), China Southern Airlines - H (1055.HK), EVA Airways (2618.TW), Hanjin Shipping Co Ltd (117930.KS), Korean Air (003490.KS), Neptune Orient Lines (NOL) (NEPS.SI), Orient Overseas Int'l Ltd (0316.HK), Pacific BasinShipping (2343.HK), Precious Shipping (PSL.BK), SIA Engineering Company (SIAE.SI), ST Engineering (STEG.SI), Singapore Airlines (SIAL.SI), Tigerair (TAHL.SI)
J.P. Morgan Equity Research Ratings Distribution, as of January 1, 2014
Overweight(buy)
Neutral(hold)
Underweight(sell)
J.P. Morgan Global Equity Research Coverage 43% 45% 12%IB clients* 57% 49% 36%
JPMS Equity Research Coverage 43% 50% 7%IB clients* 75% 66% 59%
*Percentage of investment banking clients in each rating category.For purposes only of FINRA/NYSE ratings distribution rules, our Overweight rating falls into a buy rating category; our Neutral rating falls into a hold rating category; and our Underweight rating falls into a sell rating category. Please note that stocks with an NR designation are not included in the table above.
0
8
16
24
32
Price(S$)
Oct06
Apr08
Oct09
Apr11
Oct12
Singapore Airlines (SIAL.SI, SIA SP) Price Chart
N S$17.5
OW S$17.5N S$18.5 N S$13.1N S$9.4 OW S$17 OW S$14
OW S$16.5N S$16.5 N S$15N S$10OW S$14OW S$16 OW S$20OW S$19OW S$15.5OW S$13
Source: Bloomberg and J.P. Morgan; price data adjusted for stock splits and dividends.
Initiated coverage Oct 29, 2006.

19
Asia Pacific Equity Research08 January 2014
Corrine Png(65) [email protected]
Equity Valuation and Risks: For valuation methodology and risks associated with covered companies or price targets for covered companies, please see the most recent company-specific research report at http://www.jpmorganmarkets.com, contact the primary analyst or your J.P. Morgan representative, or email [email protected].
Equity Analysts' Compensation: The equity research analysts responsible for the preparation of this report receive compensation based upon various factors, including the quality and accuracy of research, client feedback, competitive factors, and overall firm revenues.
Registration of non-US Analysts: Unless otherwise noted, the non-US analysts listed on the front of this report are employees of non-US affiliates of JPMS, are not registered/qualified as research analysts under NASD/NYSE rules, may not be associated persons of JPMS, and may not be subject to FINRA Rule 2711 and NYSE Rule 472 restrictions on communications with covered companies, public appearances, and trading securities held by a research analyst account.
Other Disclosures
J.P. Morgan ("JPM") is the global brand name for J.P. Morgan Securities LLC ("JPMS") and its affiliates worldwide. J.P. Morgan Cazenove is a marketing name for the U.K. investment banking businesses and EMEA cash equities and equity research businesses of JPMorgan Chase & Co. and its subsidiaries.
All research reports made available to clients are simultaneously available on our client website, J.P. Morgan Markets. Not all research content is redistributed, e-mailed or made available to third-party aggregators. For all research reports available on a particular stock, please contact your sales representative.
Options related research: If the information contained herein regards options related research, such information is available only to persons who have received the proper option risk disclosure documents. For a copy of the Option Clearing Corporation's Characteristics and Risks of Standardized Options, please contact your J.P. Morgan Representative or visit the OCC's website at http://www.optionsclearing.com/publications/risks/riskstoc.pdf
Legal Entities Disclosures U.S.: JPMS is a member of NYSE, FINRA, SIPC and the NFA. JPMorgan Chase Bank, N.A. is a member of FDIC. U.K.: JPMorgan Chase N.A., London Branch, is authorised by the Prudential Regulation Authority and is subject to regulation by the Financial Conduct Authority and to limited regulation by the Prudential Regulation Authority. Details about the extent of our regulation by the Prudential Regulation Authority are available from J.P. Morgan on request. J.P. Morgan Securities plc (JPMS plc) is a member of the London Stock Exchange and is authorised by the Prudential Regulation Authority and regulated by the Financial Conduct Authority and the Prudential Regulation Authority. Registered in England & Wales No. 2711006. Registered Office 25 Bank Street, London, E14 5JP. South Africa: J.P. Morgan Equities South Africa Proprietary Limited is a member of the Johannesburg Securities Exchange and is regulated by the Financial Services Board. Hong Kong: J.P. Morgan Securities (Asia Pacific) Limited (CE number AAJ321) is regulated by the Hong Kong Monetary Authority and the Securities and Futures Commission in Hong Kong. Korea: J.P. Morgan Securities (Far East) Ltd, Seoul Branch, is regulated by the Korea Financial Supervisory Service. Australia: J.P. Morgan Australia Limited (JPMAL) (ABN 52 002 888 011/AFS Licence No: 238188) is regulated by ASIC and J.P. Morgan Securities Australia Limited (JPMSAL) (ABN 61 003 245 234/AFS Licence No: 238066) is regulated by ASIC and is a Market, Clearing and Settlement Participant of ASX Limited and CHI-X. Taiwan: J.P.Morgan Securities (Taiwan) Limited is a participant of the Taiwan Stock Exchange (company-type) and regulated by the Taiwan Securities and Futures Bureau. India: J.P. Morgan India Private Limited, having its registered office at J.P. Morgan Tower, Off. C.S.T. Road, Kalina, Santacruz East, Mumbai - 400098, is a member of the National Stock Exchange of India Limited (SEBI Registration Number - INB 230675231/INF 230675231/INE 230675231) and Bombay Stock Exchange Limited (SEBI Registration Number - INB 010675237/INF 010675237) and is regulated by Securities and Exchange Board of India. Thailand: JPMorgan Securities (Thailand) Limited is a member of the Stock Exchange of Thailand and is regulated by the Ministry of Finance and the Securities and Exchange Commission. Indonesia: PT J.P. Morgan Securities Indonesia is a member of the Indonesia Stock Exchange and is regulated by the BAPEPAM LK. Philippines: J.P. Morgan Securities Philippines Inc. is a Trading Participant of the Philippine Stock Exchange and a member of the Securities Clearing Corporation of the Philippines and the Securities Investor Protection Fund. It is regulated by the Securities and Exchange Commission. Brazil: Banco J.P. Morgan S.A. is regulated by the Comissao de Valores Mobiliarios (CVM) and by the Central Bank of Brazil. Mexico: J.P. Morgan Casa de Bolsa, S.A. de C.V., J.P. Morgan Grupo Financiero is a member of the Mexican Stock Exchange and authorized to act as a broker dealer by the National Banking and Securities Exchange Commission. Singapore: This material is issued and distributed in Singapore by J.P. Morgan Securities Singapore Private Limited (JPMSS) [MIC (P) 049/04/2013 and Co. Reg. No.: 199405335R] which is a member of the Singapore Exchange Securities Trading Limited and is regulated by the Monetary Authority of Singapore (MAS) and/or JPMorgan Chase Bank, N.A., Singapore branch (JPMCB Singapore) which is regulated by the MAS. Japan: JPMorgan Securities Japan Co., Ltd. is regulated by the Financial Services Agency in Japan. Malaysia: This material is issued and distributed in Malaysia by JPMorgan Securities (Malaysia) Sdn Bhd (18146-X) which is a Participating Organization of Bursa Malaysia Berhad and a holder of Capital Markets Services License issued by the Securities Commission in Malaysia. Pakistan: J. P. Morgan Pakistan Broking (Pvt.) Ltd is a member of the Karachi Stock Exchange and regulated by the Securities and Exchange Commission of Pakistan. Saudi Arabia: J.P. Morgan Saudi Arabia Ltd. is authorized by the Capital Market Authority of the Kingdom of Saudi Arabia (CMA) to carry out dealing as an agent, arranging, advising and custody, with respect to securities business under licence number 35-07079 and its registered address is at 8th Floor, Al-Faisaliyah Tower, King Fahad Road, P.O. Box 51907, Riyadh 11553, Kingdom of Saudi Arabia. Dubai: JPMorgan Chase Bank, N.A., Dubai Branch is regulated by the Dubai Financial Services Authority (DFSA) and its registered address is Dubai International Financial Centre - Building 3, Level 7, PO Box 506551, Dubai, UAE.
Country and Region Specific Disclosures U.K. and European Economic Area (EEA): Unless specified to the contrary, issued and approved for distribution in the U.K. and the EEA by JPMS plc. Investment research issued by JPMS plc has been prepared in accordance with JPMS plc's policies for managing conflicts of interest arising as a result of publication and distribution of investment research. Many European regulators require a firm to establish, implement and maintain such a policy. This report has been issued in the U.K. only to persons of a kind described in Article 19 (5), 38, 47 and 49 of the Financial Services and Markets Act 2000 (Financial Promotion) Order 2005 (all such persons being referred to as "relevant persons"). This document must not be acted on or relied on by persons who are not relevant persons. Any investment or investment activity to which this document relates is only available to relevant persons and will be engaged in only with relevant persons. In other EEA countries, the report has been issued to persons regarded as professional investors (or equivalent) in

20
Asia Pacific Equity Research08 January 2014
Corrine Png(65) [email protected]
their home jurisdiction. Australia: This material is issued and distributed by JPMSAL in Australia to "wholesale clients" only. This material does not take into account the specific investment objectives, financial situation or particular needs of the recipient. The recipient of this material must not distribute it to any third party or outside Australia without the prior written consent of JPMSAL. For the purposes of this paragraph the term "wholesale client" has the meaning given in section 761G of the Corporations Act 2001. Germany: This material is distributed in Germany by J.P. Morgan Securities plc, Frankfurt Branch and J.P.Morgan Chase Bank, N.A., Frankfurt Branch which are regulated by the Bundesanstalt für Finanzdienstleistungsaufsicht. Hong Kong: The 1% ownership disclosure as of the previous month end satisfies the requirements under Paragraph 16.5(a) of the Hong Kong Code of Conduct for Persons Licensed by or Registered with the Securities and Futures Commission. (For research published within the first ten days of the month, the disclosure may be based on the month end data from two months prior.) J.P. Morgan Broking (Hong Kong) Limited is the liquidity provider/market maker for derivative warrants, callable bull bear contracts and stock options listed on the Stock Exchange of Hong Kong Limited. An updated list can be found on HKEx website: http://www.hkex.com.hk. Japan: There is a risk that a loss may occur due to a change in the price of the shares in the case of share trading, and that a loss may occur due to the exchange rate in the case of foreign share trading. In the case of share trading, JPMorgan Securities Japan Co., Ltd., will be receiving a brokerage fee and consumption tax (shouhizei) calculated by multiplying the executed price by the commission rate which was individually agreed between JPMorgan Securities Japan Co., Ltd., and the customer in advance. Financial Instruments Firms: JPMorgan Securities Japan Co., Ltd., Kanto Local Finance Bureau (kinsho) No. 82 Participating Association / Japan Securities Dealers Association, The Financial Futures Association of Japan, Type II Financial Instruments Firms Association and Japan Investment Advisers Association. Korea: This report may have been edited or contributed to from time to time by affiliates of J.P. Morgan Securities (Far East) Ltd, Seoul Branch. Singapore: JPMSS and/or its affiliates may have a holding in any of the securities discussed in this report; for securities where the holding is 1% or greater, the specific holding is disclosed in the Important Disclosures section above. India: For private circulation only, not for sale. Pakistan: For private circulation only, not for sale. New Zealand: This material is issued and distributed by JPMSAL in New Zealand only to persons whose principal business is the investment of money or who, in the course of and for the purposes of their business, habitually invest money. JPMSAL does not issue or distribute this material to members of "the public" as determined in accordance with section 3 of the Securities Act 1978. The recipient of this material must not distribute it to any third party or outside New Zealand without the prior written consent of JPMSAL. Canada: The information contained herein is not, and under no circumstances is to be construed as, a prospectus, an advertisement, a public offering, an offer to sell securities described herein, or solicitation of an offer to buy securities described herein, in Canada or any province or territory thereof. Any offer or sale of the securities described herein in Canada will be made only under an exemption from the requirements to file a prospectus with the relevant Canadian securities regulators and only by a dealer properly registered under applicable securities laws or, alternatively, pursuant to an exemption from the dealer registration requirement in the relevant province or territory of Canada in which such offer or sale is made. The information contained herein is under no circumstances to be construed as investment advice in any province or territory of Canada and is not tailored to the needs of the recipient. To the extent that the information contained herein references securities of an issuer incorporated, formed or created under the laws of Canada or a province or territory of Canada, any trades in such securities must be conducted through a dealer registered in Canada. No securities commission or similar regulatory authority in Canada has reviewed or in any way passed judgment upon these materials, the information contained herein or the merits of the securities described herein, and any representation to the contrary is an offence. Dubai: This report has been issued to persons regarded as professional clients as defined under the DFSA rules. Brazil: Ombudsman J.P. Morgan: 0800-7700847 / [email protected].
General: Additional information is available upon request. Information has been obtained from sources believed to be reliable but JPMorgan Chase & Co. or its affiliates and/or subsidiaries (collectively J.P. Morgan) do not warrant its completeness or accuracy except with respect to any disclosures relative to JPMS and/or its affiliates and the analyst's involvement with the issuer that is the subject of the research. All pricing is as of the close of market for the securities discussed, unless otherwise stated. Opinions and estimates constitute our judgment as of the date of this material and are subject to change without notice. Past performance is not indicative of future results. This material is not intended as an offer or solicitation for the purchase or sale of any financial instrument. The opinions and recommendations herein do not take into account individual client circumstances, objectives, or needs and are not intended as recommendations of particular securities, financial instruments or strategies to particular clients. The recipient of this report must make its own independent decisions regarding any securities or financial instruments mentioned herein. JPMS distributes in the U.S. research published by non-U.S. affiliates and accepts responsibility for its contents. Periodic updates may be provided on companies/industries based on company specific developments or announcements, market conditions or any other publicly available information. Clients should contact analysts and execute transactions through a J.P. Morgan subsidiary or affiliate in their home jurisdiction unless governing law permits otherwise.
"Other Disclosures" last revised December 7, 2013.
Copyright 2014 JPMorgan Chase & Co. All rights reserved. This report or any portion hereof may not be reprinted, sold or redistributed without the written consent of J.P. Morgan. #$J&098$#*P