airline maintenance cost executive commentary · pdf fileairline maintenance cost executive...
TRANSCRIPT

PUBLICMCTFDecember 2015
An Exclusive Benchmark Analysis (FY2014 data)by IATA’s Maintenance Cost Task Force
AIRLINE MAINTENANCE COST EXECUTIVE COMMENTARY

This report contains data and information that is available only to airlines that provided data and, as such, has been removed
from this "public" version.
To participate in the next Maintenance Cost Task Force (MCTF) data collection, please contact us at [email protected].

Preliminary Remarks 2
Data & Analysis Methodology 4
Definitions & Acronyms 5
1. Global Picture 6 1.1. Airline Industry Landscape in 2014 8 1.2. World Fleet 11 1.3. Maintenance, Repair & Overhaul (MRO) Market 14
2. FY2013 Snapshot 16 2.1. Fleet Overview 18 2.2. Maintenance Cost Analysis 21 2.2.1. Direct Maintenance Spend 21 2.2.2. Direct Maintenance Spend by Aircraft Category 24 2.2.3. Personnel & Overhead 27 2.3. Aircraft Leasing & Maintenance Reserves 30 2.4. Spare Parts Inventory 34
3. Analysis by Airline Group 36 3.1. Fleet Overview 38 3.2. Maintenance Cost Analysis by Airline Group 40 3.3. Aircraft Leasing & Maintenance Reserves by Airline Group 42
4. Cost Trend Analysis 46 4.1. Fleet Overview 48 4.2. Maintenance Cost Overview 51 4.3. General Trends 56 4.4. Trend Analysis by Airline Group 58
5. Maintenance Cost Trend Analysis by Aircraft Category 62 5.1. Overview by Aircraft Category 64 5.2. Narrowbody Aircraft 66 5.3. Widebody Aircraft 68 5.4. Regional Jets 70 5.5. Turboprops 72
Annex I: MCTF Fleet vs World Fleet 74
Annex II: Staff 75
Annex III: Time Breakdown 76
Annex IV: Fleet Distribution by Aircraft Family and by Group 77
Annex V: Operational Data by Aircraft Category 78
Annex VI: Unit Costs by Airline 79
Table of Contents

02
Preliminary remarksMaintenance Cost Task Force (MCTF) collects maintenance cost data from airlines worldwide on an annual basis. The goals of MCTF are to provide the tools, methodology and definitions to be able to determine how much it costs an airline to maintain its fleet and be able to use the data in cases of new fleet introduction or expansion, “make vs. buy” decisions, year-over-year trends, etc.
This report contains data and information that is available only to airlines that provided data and, as such, has been removed from this "public" version.
We are doing our maximum to present meaningful analysis and we encourage you to provide feedback on this report so we can improve it again next year.
THE IMPORTANCE OF DATA QUALITYIt takes a fair amount of time for MCTF airlines to gather and submit data, and it takes a lot of effort to validate this data in order to deliver the most relevant benchmark analysis. We often need to contact airlines and ask for clarifications when numbers do not meet the quality checks set. For this initiative to remain viable and reliable, it is critical to deal with the best possible data quality. That’s why we would like to remind you of the importance of making sure your data are accurate before submitting it. For that purpose, built-in checks are included in the data collection form (on two tabs: Summary Tables and Summary Graphs) in order to help you get an idea of the main metrics (e.g. maintenance cost per flight hour, per flight cycle or per aircraft). Unscheduled events can cause dramatic impact on

03
MCTF data collection is open to all commercial airlines worldwide that would like to benchmark their cost to maintain their fleet. MCTF does not discriminate between IATA and non-IATA member airlines. MCTF does not discriminate between major, domestic, international, low-cost, regional airlines, etc.
maintenance spend, that is why we need also as many comments to explain unusually high or low costs.
THE IMPORTANCE OF REPORTING OPERATIONAL DATAThe focus of MCTF is clearly on maintenance costs but operational data (e.g. flight hours, cycles, ASK, fleet size and fleet age) are very important to calculate unit costs and KPIs. For example, only 25% of MCTF airlines reported ASK in the past four years, preventing us from having a sample statistically large enough to calculate one of the most basic KPIs of the airline industry: CASK (cost per ASK).
We would like to draw your attention on the importance of reporting accurate cost data and operational data in order to get the best benchmark data and analysis possible for the benefit of the airline industry and your own airline.
THE IMPORTANCE OF DATA TREATMENTAll the MCTF analyses presented in this report use maintenance cost data as they were provided by
the airlines through the standardized IATA toolset. No attempt was used to normalize the data based on any parameters such as operational severity (hours to cycle ratio, utilization, harsh environment, etc.), aircraft ageing, fleet size and commonality, labor rate, etc. Additionally, it should be noted that the analysis is done in USD as most of the aircraft parts are marketed in USD; therefore currency exchange rates may play a significant role in benchmarking maintenance costs, especially when substantial foreign exchange fluctuations take place.
Finally, the aircraft delivery schedule and the periodicity of the maintenance program can strongly influence costs, especially when many aircraft were delivered within a short period of time.
THE ACCEPTANCE OF DATAThis report analyzes and comments data from 51 airlines. Due to late submission, insufficient data and poor data quality, a few other airlines' data was excluded from the analysis and report.

04 Data and Analysis Methodology
Data & Analysis Methodology
IATA’s Maintenance Cost Task Force (MCTF) collects maintenance cost data from airlines worldwide on an annual basis.
MCTF Airlines are the carriers which participate in the annual data collection. 51 airlines reported data for FY2014, and 23 airlines provided data consistently over the past five years (FY2010-2014). Airline maintenance cost submitted past the deadline and data that did not pass the quality checks and subsequent questions were excluded from this report. If needed, contributing airlines are contacted to clarify the reported data. The data are then coded (operators are de-identified) and used as reported (i.e. without any normalization) to create this benchmark report.
All airline data are consolidated and then analyzed considering aircraft type, fleet and engine size and models, fleet age, maintenance market segments (line, components, engines, heavy checks and MOD) and elements (labor, material, subcontracted work), flight hours, cycles and geography.
All data presented in this report are de-identified. The two-digit airline codes shown in this report are unique codes given to the participating airlines for de-identification purposes. Although some of these codes may match real IATA airline codes, this is merely a coincidence. If you do not know your airline’s code, please contact us at [email protected].
Typical metrics include: cost per flight hour, cost per departure, cost per aircraft. Next year, we plan to expand the benchmark using cost per ASK (metric that relates closer to the financial performance of the airline than the above listed).
All cost data unit is US dollar, and length unit is kilometer.
The goals of MCTF are to provide the tools, methodology and definitions to be able to determine how much it costs an airline to maintain its fleet and be able to use the data in cases of new fleet introduction or expansion, “make vs. buy” decisions, year-over-year trends, etc.

Definitions and Acronyms 05
Definitions & Acronyms
ACAircraft
AFTKAvailable Freight Tonne Kilometers
Aircraft CategoryNB, WB, RJ, TP (defined below)
Aircraft Sub-CategoryNB, WB2, WB3+, RJ, TP (defined below)
Aircraft FamilyAircraft communalities (e.g. A320 Family includes A318, A319, A320, A321; 737 NG includes 737-600 / 700 / 800 / 900)
ALAirline
APUAuxiliary Power Unit
ASKAvailable-Seat Kilometers
Cost ElementsMaterial, labor and outside repairs (or outsourced or subcontracted, usedinterchangeably)
Cost SegmentsLine, base, component and engine maintenance
CurrencyAll amounts in this report are in US$, unless specified otherwise.
UtilizationNumber of flight hours per aircraft per day (= FH / AC / 365 days)
DMCDirect Maintenance Costs
ESVEngine Shop Visit
FCFlight Cycle
FHFlight Hour
FLFFreight Load Factor
FTKFreight Tonne Kilometers
LGLanding Gear
LLPLife Limited Part
MCTFMaintenance Cost Task Force
MENAMiddle East & North Africa
MRMaintenance Reserves
MTBRMean Time Between Removals
NBNarrow-body single aisle aircraft with more than 100 seats (excludes Embraer 190 / 195)
PLFPassenger Load Factor
RegionsAfrica (Sub-Saharan Africa), ASPAC (Asia Pacific), MENA (Middle East & North Africa), Americas (North & South America), Europe (includes CIS), N. Asia (China, Hong Kong, Macao, Taiwan, Mongolia)
RJRegional Jets up to 100 seats (includes Embraer 190 / 195)
RPKRevenue-Passenger Kilometers
Supply ChainIncludes all maintenance activities performed by third party (also called “contract maintenance” or “outsourcing”) and the cost of material
purchased to do work in-house
Total Maintenance CostsDMC plus overhead costs
TPTurboprops
TRThrust Reversers
UnitsK ($#,000) ThousandM ($#,000,000) MillionB ($#,000,000,000) Billion
WBWidebody aircraft with more than one aisle or equivalent freighter, combination of WB2 and WB3+
WB2Widebody aircraft equipped with two engines
WB3+Widebody aircraft equipped with three or more engines


Global Picture 07
Global Picture
This section provides some context to the MCTF analyses in other sections by presenting an overview of the airline industry, the world fleet count and the Maintenance, Repair and Overhaul (MRO) market for 2014. The industry performed better in 2014, with a net post-tax profit of $19.9 billion, compared to $10.6 billion in 2013.
In 2014, the world fleet count was 24,597 aircraft, with 76% of the fleet manufactured by Boeing or Airbus. Globally, airlines spent $62.1 billion on MRO, representing around 9% of total operational costs.
1

$B / YEAR
2000
2001
2003 20
05
2007
2009
2011
2013
2002
2004
2006
2008
2010
2012
2014
3.7-13 -11.3 -7.5 -5.6 -4.1
5
14.7
-4.6
17.3
8.3 6.110.6
19.9
-26.1
$ / BARREL
2013
2014
2007
2008
2009
2010
2004
2005
2006 2011
2012
49.7
71.481.9
90
126.7
70.9
91.4
127.5 129.6124.5
114.8
08 Global Picture
1.1. Airline Industry Landscape in 2014Aviation has an immeasurable impact on the world we live in, connecting people and cultures, creating opportunities and facilitating economic progress. 2014 was a relatively strong year for the airline industry.
Collectively, the airlines had a net post-tax profit of $19.9 billion (Fig. 1), a 2.7% margin on revenues. This improves on the 2013 results of $10.6 billion profit (1.6% margin). The improvement was achieved through a combination of improving global economic conditions, which supported stronger growth in passenger and air freight demand. Lower fuel costs also helped, but due to hedging, some airlines have experienced a delay in seeing the benefits of the fall in fuel prices. Jet fuel prices fell significantly during 2014, starting the year at $130 per barrel and finishing it at $75 per barrel.
The average for the year was $114.8 / bbl, 6% lower than the 2013 average price of $124.5 / bbl (Fig. 2). However, the strengthening of the US$ over other world currencies does not allow all airlines to benefit from the lower fuel prices (or other costs, e.g. aircraft leasing, maintenance) denominated in US$.
Passenger ancillary revenues continued to play an increasing role in the industry. Revenues from added-value services improved from $42.6 billion in 2013 to $49.9 billion in 2014, or more than $15 per passenger.
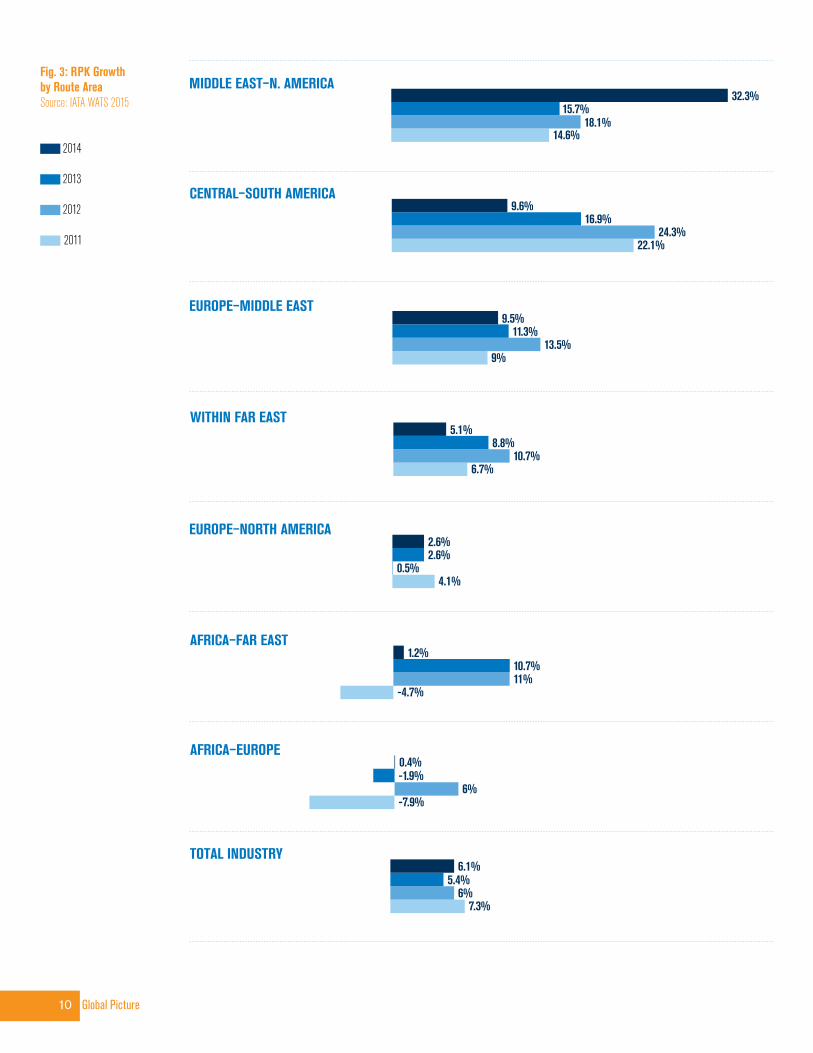
RPKs between regions of the world grew at an accelerated rate in 2014, expanding by 6% compared to 5.4% in 2013. The pick-up in the growth trend reflects increasing demand through improvements in the global economic backdrop.
Fig. 1: Industry Net Profits Source: IATA WATS 2015
Fig. 2: Jet Fuel Price per Barrel Annual average Source: IATA WATS 2015

09
Even so, airlines have continued with disciplined capacity management. The growth in available seat kilometers (ASK) has been 6.4%, only slightly stronger than the expansion in RPKs (Fig. 3).
More than 32.5 million scheduled flight services were provided in 2014, a 2.2% increase on the previous year. Correspondingly, the number of seats rose 4.7% to 4.4 million.
Passenger load factors remained close to 2013’s record high at 80%. This is the result of an increase in passenger volumes, coupled with disciplined capacity management, particularly in mature markets like the US domestic and the North Atlantic.
Break-even load factors came down even further in 2014 (63.7% vs 64.5% in 2013) because of lower fuel
prices and the positive impact of increasing ancillary revenues on yields. In addition, consolidation and capacity management boosted load factors achieved.
Cargo markets showed solid improvement in 2014. The cyclical upturn in the global economy helped boost confidence and international trade, and support stronger demand in air freight.
Sources: IATA WATS (2015)
14.6%18.1%
15.7%32.3%
MIDDLE EAST–N. AMERICA
22.1%24.3%
16.9%9.6%
CENTRAL–SOUTH AMERICA
9%13.5%
11.3%9.5%
EUROPE–MIDDLE EAST
6.7%10.7%
8.8%5.1%
WITHIN FAR EAST
EUROPE–NORTH AMERICA
4.1%0.5%
2.6%2.6%
-4.7%11%10.7%
1.2%AFRICA–FAR EAST
-7.9%6%
-1.9%0.4%
AFRICA–EUROPE
6%7.3%
5.4%6.1%
TOTAL INDUSTRY
10 Global Picture
Fig. 3: RPK Growth by Route Area Source: IATA WATS 2015
2014
2013
2012
2011

Fig. 5 Fig. 6
56%NB
8%TP
16%RJ
20%WB
38%Americas
3%Africa
7%MENA
12%North Asia
15%ASPAC
25%Europe
0.8%Fokker0.6%Others
44.9%Boeing(including MD)31.3%
Airbus
9.8%Bombardier(inclu. DHC)
8.1%Embraer
3.7%ATR
0.8%BAe
Africa: Sub-Saharan AfricaASPAC: Asia Pacific
MENA: Middle East North Africa
Americas: North & South AmericaEurope: includes CIS
N. Asia: China, Hong Kong, Macao, Taiwan, Mongolia
* Excludes all non-western built aircraft
Global Picture 11
1.2. World FleetIn FY2014, the world fleet count was 24,597 aircraft*. 76% of this fleet was manufactured by Boeing or Airbus. In the last decade, airlines introduced 6,665
aircraft to their fleet, broken down as follows: 56% NB, 18% RJ, 16% WB and 11% TP. TPs include only ATR42 / 72 and Q300 / 400.
Fig. 5: World Fleet Number of Aircraft by Aircraft Category (2014) Source: ACAS3 (July 2015)
Fig. 6: World Fleet Number of Aircraft by Region (2014) Source: ACAS3 (July 2015)
Fig. 4: World Fleet Number of Aircraft by Manufacturer (2014) Source: ACAS3 (July 2015)

A330
737 CLASSIC
A320 FAMILY
737 NG
777
5,880
5,054
1,234
1,092
982
767 808
757 791
2004
500
0
1,000
1,500
2,000
2,500
3,000
2005 2006 2007 2008 2009 2010 2011 2012 2013 2014
FH / AC, FC / ACUtilization (Hours / Day)
7.797.19
1,4631,557
2,8422,624
7
8
9
10
12
6
11
12 Global Picture
Fig. 7: Popular Aircraft Families (2014) Source: ACAS3 (July 2015)
Fig. 8: World Fleet Statistics (2004-2014) Source: ACAS3 (July 2015)
Utilization
FC / AC
FH / AC
Most popular aircraft are the Airbus A320s. However, if 737 Classics and NGs are combined, the Boeing 737s have a very narrow lead.

T. 1: Jan 2015 vs Jan 2014
T. 1b: 2014 vs 2013:
AFRICA
ASIA / PACIFIC
EUROPE
LATIN AMERICA
MIDDLE EAST
NORTH AMERICA
TOTAL MARKET
RPK
-0.9%
4.2%
4.9%
5.6%
10.8%
2.6%
4.6%
ASK
0.4%
5%
4.3%
4%
12.6%
4.4%
5.2%
PLF
68.1%
76.8%
76.6%
81.9%
80%
79.4%
77.7%
FTK
5.2%
6.9%
-1.2%
-6.4%
9.2%
-1%
3.2%
AFTK
2.4%
5.4%
3.6%
-2%
18.1%
-2.8%
4.1%
FLF
27.8%
51.7%
43.4%
36.5%
38.6%
35%
42.8%
AFRICA
ASIA / PACIFIC
EUROPE
LATIN AMERICA
MIDDLE EAST
NORTH AMERICA
TOTAL MARKET
RPK
0.3%
7.1%
5.8%
6.4%
12.6%
2.7%
5,9%
ASK
2.5%
7.5%
5.2%
4.1%
11.5%
2.4%
5.6%
PLF
68.4%
77.2%
80.8%
79.8%
78.4%
83.6%
79.7%
FTK
6.7%
5.4%
2%
0.1%
11%
2.4%
4.5%
AFTK
0.9%
5.7%
3%
0.3%
11.1%
-0.5%
3.7%
FLF
30.7%
55.4%
46.9%
41.8%
44.5%
35.3%
45.7%
Global Picture 13
Tables 1-1b: Airline Financial Monitor Source: IATA Economics (Feb 2015)
PLF increased from 79.5% in 2013 to 79.7% in 2014. The average utilization in 2014 was 7.79 hours per day, a 0.3% decrease vs 2013, and an 8.3% increase
vs 2004. All figures in the tables are expressed in % change year on year, except for PLF and FLF which are the load factors for the specific month.
21%Base
17%Line
40%Engines
22%Comp
27%Europe
7%MENA
35%Americas
27%Asia
4%Africa
14 Global Picture
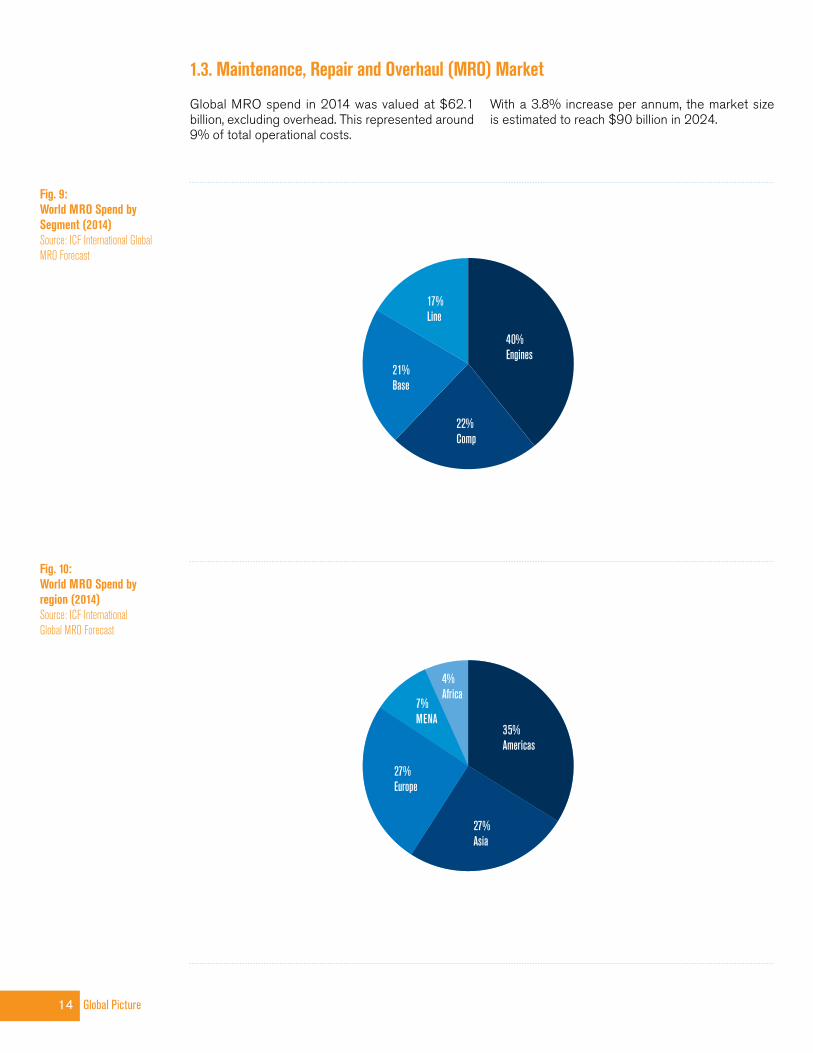
Fig. 9: World MRO Spend by Segment (2014) Source: ICF International Global MRO Forecast
Fig. 10: World MRO Spend by region (2014) Source: ICF International Global MRO Forecast
Global MRO spend in 2014 was valued at $62.1 billion, excluding overhead. This represented around 9% of total operational costs.
With a 3.8% increase per annum, the market size is estimated to reach $90 billion in 2024.
1.3. Maintenance, Repair and Overhaul (MRO) Market

LINE
ENGIN
E
COMP BASE
40%
22% 21% 17%
LINE
ENGIN
E
COMP BASE
40%
23%20% 17%
2014$62.1B
2024$90B
Global Picture 15
DEVELOPING TRENDS AND TECHNOLOGIES IN MAINTENANCE • Aircraft health monitoring systems and big data: e-aircraft are constantly monitoring and transmitting faults and warnings for a more dynamic planning and check scheduling
• New technologies: mobile devices, wearables (e.g. Google Glass) and real-time video transmission for front-line support, e-logbooks for paperless operations, drones and/or sensors for remote inspections
• Predictive maintenance is estimated to increase aircraft availability by up to 35%
• Composite repair capabilities
• Additive manufacturing (3-D printing) is continuously growing, reducing lead times, increasing part availa- bility, optimizing parts and saving weight.
These innovations are estimated to decrease MRO spending by 15 to 20% but first, the market needs to innovate with a clear vision and strategy.
It is critical to identify opportunities and isolate the most promising ones, then develop an innovation process to transform these opportunities into pilot projects and market roll-outs.
Sources: IATA Economics (June 2015) IATA Airline Cost Management Group (August 2015)ICF International Global MRO Forecast (Jan 2015)
Fig. 11: World MRO Market Forecast (2014-2024)Source: ICF International Global MRO Forecast


FY2014 Snapshot - 51 Airlines 17
FY2014 Snapshot — 51 Airlines
This section provides the overview of FY2014 data reported by 51 airlines worldwide. The MCTF airlines operated 4,216 aircraft in 2014, of which more than 85% were Boeing and Airbus aircraft. Technical Division spend totaled $17.6 billion of which $15 billion was Direct Maintenance Cost and $2.5 billion for Overhead.
2
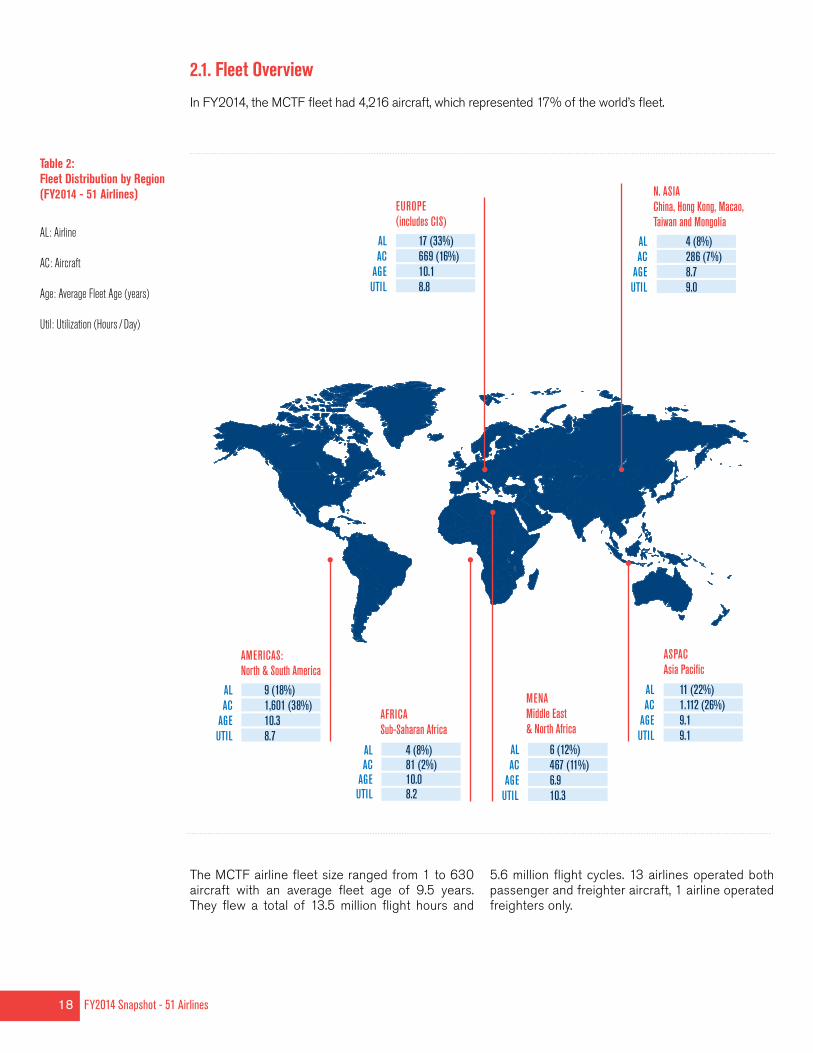
AL 6 (12%) AC 467 (11%) AGE 6.9UTIL 10.3
MENA Middle East & North Africa
AL 11 (22%) AC 1.112 (26%) AGE 9.1 UTIL 9.1
ASPAC Asia Pacific
AL 4 (8%) AC 286 (7%) AGE 8.7 UTIL 9.0
N. ASIA China, Hong Kong, Macao, Taiwan and Mongolia
AL 17 (33%) AC 669 (16%) AGE 10.1 UTIL 8.8
EUROPE (includes CIS)
AL 4 (8%) AC 81 (2%) AGE 10.0 UTIL 8.2
AFRICA Sub-Saharan Africa
AL 9 (18%) AC 1,601 (38%) AGE 10.3 UTIL 8.7
AMERICAS: North & South America
18 FY2014 Snapshot - 51 Airlines
2.1. Fleet OverviewIn FY2014, the MCTF fleet had 4,216 aircraft, which represented 17% of the world’s fleet.
The MCTF airline fleet size ranged from 1 to 630 aircraft with an average fleet age of 9.5 years. They flew a total of 13.5 million flight hours and
5.6 million flight cycles. 13 airlines operated both passenger and freighter aircraft, 1 airline operated freighters only.
Table 2: Fleet Distribution by Region (FY2014 - 51 Airlines)
AL: Airline
AC: Aircraft
Age: Average Fleet Age (years)
Util: Utilization (Hours / Day)
2,223 A / C52.7%
1,418 A / C33.6%
20 A / C0.5%
372 A / C8.8%
95 A / C2.3%
87 A / C2.1%
2 A / C0.05%
2,110 A / C50%
1,287 A / C31%
394 A / C9%
244 A / C6%
182 A / C4%
FY2014 Snapshot - 51 Airlines 19
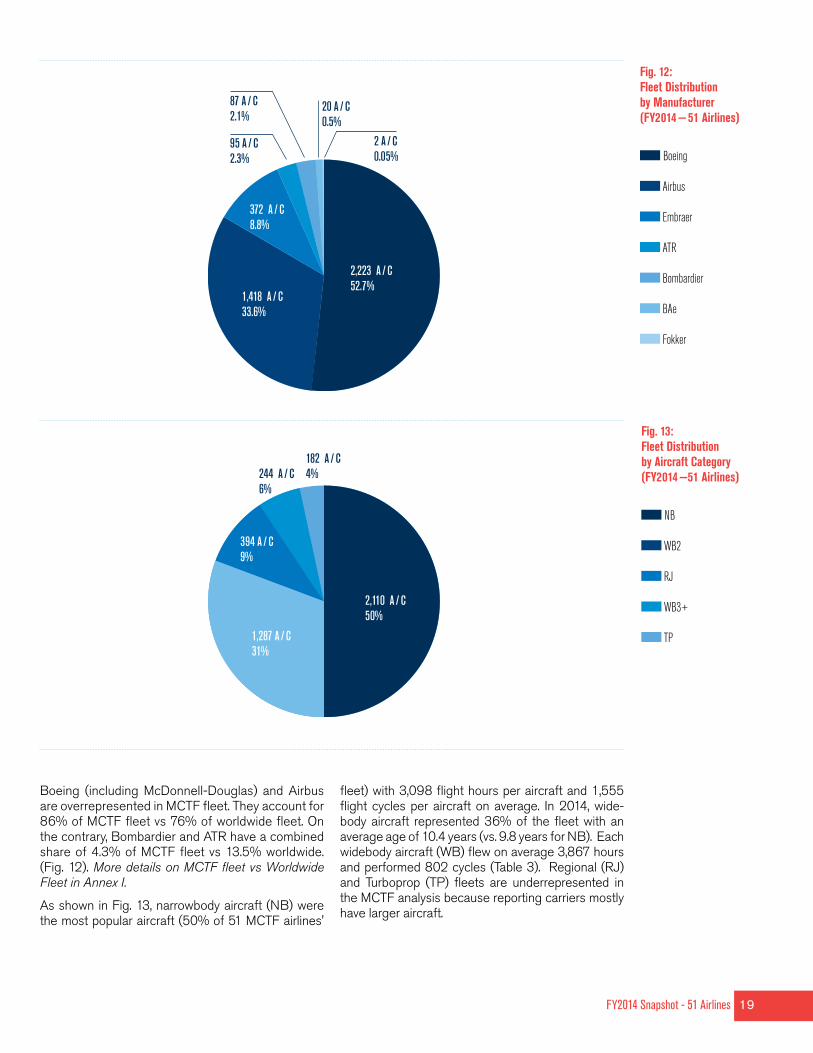
Fig. 12: Fleet Distribution by Manufacturer (FY2014 — 51 Airlines)
Boeing
Airbus
Embraer
ATR
Bombardier
BAe
Fokker
Fig. 13: Fleet Distribution by Aircraft Category (FY2014 —51 Airlines)
NB
WB2
RJ
WB3+
TP
Boeing (including McDonnell-Douglas) and Airbus are overrepresented in MCTF fleet. They account for 86% of MCTF fleet vs 76% of worldwide fleet. On the contrary, Bombardier and ATR have a combined share of 4.3% of MCTF fleet vs 13.5% worldwide. (Fig. 12). More details on MCTF fleet vs Worldwide Fleet in Annex I.
As shown in Fig. 13, narrowbody aircraft (NB) were the most popular aircraft (50% of 51 MCTF airlines'
fleet) with 3,098 flight hours per aircraft and 1,555 flight cycles per aircraft on average. In 2014, wide-body aircraft represented 36% of the fleet with an average age of 10.4 years (vs. 9.8 years for NB). Each widebody aircraft (WB) flew on average 3,867 hours and performed 802 cycles (Table 3). Regional (RJ) and Turboprop (TP) fleets are underrepresented in the MCTF analysis because reporting carriers mostly have larger aircraft.

Aircraft Airlines Avg Age Utilization FH / AC FC / AC FH / FC
NB 2,110 A / C 44 9.8 8.5 3,098 1,555 2.0
WB2 1,287 A / C 33 10.4 10.6 3,863 837 4.6
RJ 394 A / C 14 6.2 7.1 2,607 1,878 1.4
WB3+ 244 A / C 11 10.1 10.7 3,890 620 6.3
TP 182 A / C 14 5.3 5.5 2,015 2,002 1.0
28
1005
0
10
15
20
25
30
0
200
300
400
500
600
800
700
900
1,000AIRCRAFT AIRLINES
B737
CLAS
SIC
B747/
400
A340
ATR7
2
A380
Q400
B787
EMB1
70/17
5
B747
-8
A320
FAMI
LY
B777
EMB1
90/19
5
A330
B737
NG B767
1416
11
22
10 10 9 11
5
8
57
4 4
20 FY2014 Snapshot - 51 Airlines
MCTF airlines operated 26 different aircraft families in 2014. Figure 14 represents only the Top 15 aircraft families with a minimum of 3 operators and 5 aircraft, and a total of 3,856 aircraft (91% of MCTF total fleet). Some populous aircraft types have been removed
because they did not meet the ‘3 operators / 5 aircraft’ rule. The rest of the fleet (not shown here) is mostly composed of mature to old fleet types that will be retired in a near future.
Fig. 14:Fleet Demographics (FY2014 —51 Airlines)
Airlines
Aircraft
Table 3: Operational Data by Aircraft Category (FY2014 —51 Airlines)

Average Minimum Maximum Cost / Airline $295M $0.95M $2.2B
Cost / Flight Hour $1,087 $287 $2,841
Cost / Flight Cycle $2,681 $465 $11,937
Cost / Aircraft $3.6M $0.67M $9.3M
2010$9.7B (43 airlines)
2014$15B (51 airlines)
BASE 20%
BASE 15%
COMPONENT 23%
COMPONENT 24%
ENGINE 38% ENGINE
39%
LINE 19%
LINE 22%
FY2014 Snapshot - 51 Airlines 21
Table 4:Direct Maintenance Cost - Unit Costs (FY2014 — 51 Airlines)
Fig. 15: Evolution of Direct Maintenance Cost Structure by Segment (FY2010 & FY2014)
2.2. Maintenance Cost AnalysisIn FY2014, MCTF airlines reported a total of $17.6 billion for their Technical Division spend: this is $15 billion for Direct Maintenance Cost (reported by 48 airlines) and $2.5 billion for Overhead (reported by 41 airlines). $15 billion represent almost 24% of the world MRO spend for 17% of the world fleet. This may be explained by the fact that MCTF fleet is skewed
towards higher gauge aircraft (36% WB in MCTF fleet vs 20% in world fleet). They employed a total of 30,064 mechanics (report-ed by 29 airlines) and 18,276 OH staff (reported by 43 airlines). Staffing and overhead (OH) are analyzed separately in Section 2.2.3.
2.2.1. Direct Maintenance Spend The 51 MCTF airlines reported $15 billion for their direct maintenance costs, the average maintenance cost was $295 million per airline, $1,087 per flight hour, $2,681 per flight cycle and $3.6 million per aircraft.

50%
100%
0%
CL AT 23 SG GC RC LL UH EY CB 3F U2 J9 1E ZY JA BG ID 77 1Q HF AG 2G RP 5Y WW Q9 F1 XH DD R9 C3 MD PP 4W SL 0S QW MB CC PM SP NN MC G4 DB 7U RA NY 4A T9
AVG 68.6%
2010$9.7B (43 airlines)
2014$15B (51 airlines)
LABOR $ 24%
LABOR $ 17%
MATERIAL $ 22%
MATERIAL $ 15%SUBC $
54%SUB $68%
22 FY2014 Snapshot - 51 Airlines
Fig. 16: Evolution of Direct Maintenance Cost Structure by Segment (FY2010 & FY2014)
Fig. 17:DMC by Airline - Subcontracted vs Labor + Material (FY2014 — 51 Airlines)
Sub Contracted $
Labor + Material $
Engine remains the highest cost segment with 39% of maintenance costs (Fig. 15). Over the past five year, base maintenance has decreased from 20% to 15%.
Contract maintenance (indicated as ‘SubC’ for sub-contracted) continued to grow and reached a new high with 68% of total direct maintenance spend (Fig. 16); 13 airlines indicated that they subcontracted all their maintenance activities (Fig. 17).
As shown in Figure18, the majority of airlines continue subcontract the entirety of their engine work as shown. 0% mostly reflects the absence of any engine over-haul for FY2014.

50%
100%
0%
Q9 AG CL AT MC G4 PM T9 C3 R9 2G 23 JA F1 SP SG 1E MB BG GC RC ZY LL XH NN EY RP 1Q PP ID CB 3F 0S U2 J9 77 WW MD QW NY CC SL 5Y 7U RA DB 4W 4A DD
AVG 87%
50%
100%
0%
Q9 AG T9 BG 4A WW 2G NN MB PM NY JA 7U G4 DB CC RA F1 QW ZY 1E 1Q XH 0S MC C3 ID SP MD 77 R9 PP SL DD 5Y HF RP CL AT 23 SG 4W GC RC LL UH EY CB 3F U2 J9
AVG 66%
FY2014 Snapshot - 51 Airlines 23
Fig. 18: Engine Maintenance Costs by Airline - Subcontracted vs Labor + Material (FY2014 — 51 Airlines)
Eng Sub Contracted %
Eng Labor + Material %
Fig. 19: Line Maintenance Costs by Airline - Labor + Material vs Subcontracted (FY2014 — 51 Airlines)
Line Labor + Material %
Line Sub Contracted %
Figure 19 shows that, although most airlines keep line maintenance in-house, an increasing number is contracting out the work.

24
Fig. 20: Unit Costs by Aircraft Category (FY2014 — 51 Airlines)
Table 5: Fleet Count vs Maintenance Costs by Aircraft Category (FY2014 — 51 Airlines)
2.2.2. Direct Maintenance Spend by Aircraft Category
This part of the report is only available to participating airlines
This part of the report is only available to participating airlines

FY2014 Snapshot - 51 Airlines 25
Table 6: Unit Costs and Operational Data by Aircraft Category (FY2014 — 51 Airlines)
Fig. 21: Evolution of $ / FH by Aircraft Family (2011-2014 — 27 Airlines)
This part of the report is only available to participating airlines
This part of the report is only available to participating airlines

26
Table 7: Operational Data by Aircraft Family (FY2014 — 23 Airlines)
This part of the report is only available to participating airlines
This part of the report is only available to participating airlines

FY2014 Snapshot - 51 Airlines 27
Fig. 22: Technical Division Cost Breakdown (FY2014 — 41 Airlines)
Fig. 23: Technical Division Staff by categories in 2015 (FY2014)
2.2.3. Personnel & OverheadFor a better understanding of Technical Division’s costs, it is important to consider not only the direct maintenance cost but also the personnel and overhead (P&O) data. For FY2014, 41 airlines provided P&O data, at different levels of completion. This section presents some benchmarks based on the available data.
This part of the report is only available to participating airlines
This part of the report is only available to participating airlines
This part of the report is only available to participating airlines
28 FY2014 Snapshot - 51 Airlines
Fig. 24: Technical Division Cost Breakdown (FY2014 — 41 Airlines)
Fig. 25: Number of mechanics per Aircraft vs % DMCSubContracted (FY2014 — 27 Airlines)
This part of the report is only available to participating airlines
This part of the report is only available to participating airlines

FY2014 Snapshot - 51 Airlines 29
Fig. 26: Technical Division Staff (FY2014 — 27 Airlines)
Fig. 27: Direct Labor Time Breakdown (FY2014 — 28 Airlines)
This part of the report is only available to participating airlines
This part of the report is only available to participating airlines

2009
2010
2003
2004
2005
2006
2000
2001
2002
2007
2008
32%34%
36%37%
38% 38%39%
40%41% 41% 41%
40% 40%39% 39%
2013
2014
2011
2012
50%
100%
0%
AVG 42%
30 FY2014 Snapshot - 51 Airlines
Fig. 28: % of World Fleet under Operating LeaseSource: SGI Aviation / Ascend, 2014
Fig. 29: Airline Fleet Size and % of Leased Aircraft per Airline (FY2014 — 51 Airlines)
Over the years, the share of aircraft under operational lease has stabilized around 40% of the world fleet. (Fig. 28)
2.3. Aircraft Leasing & Maintenance Reserves (Supplemental Lease)

FY2014 Snapshot - 51 Airlines 31
Fig. 31: % of Leased Aircraft by Aircraft Category (FY2014 — 47 Airlines)
Fig. 30: % of Leased Aircraft by Region (FY2014 — 47 Airlines)
This part of the report is only available to participating airlines
This part of the report is only available to participating airlines

32 FY2014 Snapshot - 51 Airlines
Fig. 32: Aircraft under Ops Lease by Aircraft Family (FY2014 - 1,629 Aircraft)
This part of the report is only available to participating airlines
This part of the report is only available to participating airlines

FY2014 Snapshot - 51 Airlines 33
Fig. 33: Breakdown of Maintenance Reserves paid to Lessors (FY2014 — 28 Airlines)
Fig. 34: Maintenance Reserves paid by Type and by Airline (FY2014 — 28 Airlines)
This part of the report is only available to participating airlines
This part of the report is only available to participating airlines
This part of the report is only available to participating airlines
34 FY2014 Snapshot - 51 Airlines
2.4. Spare Parts InventoryThe level of spares and inventory that an airline keeps can have a positive impact on its operations in terms of aircraft availability and on-time performance. However, it is also money that is not invested and cannot be used/accessed by the airline easily.
Fig. 35: Inventory $ vs Direct Maintenance Cost $ (FY2014 — 39 Airlines)
Fig. 36: Number of Airlines reporting Spares & Inventory by Region (FY2014 — 39 Airlines)
This part of the report is only available to participating airlines
This part of the report is only available to participating airlines
This part of the report is only available to participating airlines

FY2014 Snapshot - 51 Airlines 35
Fig. 38: Spares & Inventory per Aircraft by Region (FY2014 — 39 Airlines)
Fig. 37: Spares & Inventory by Category (FY2014 — 39 Airlines)
This part of the report is only available to participating airlines
This part of the report is only available to participating airlines
This part of the report is only available to participating airlines

36 FY2014 Snapshot - 51 Airlines

Analysis by Airline Group 37
Analysis by Airline Group
This section of the report presents a maintenance cost analysis of airlines with similar fleet sizes. Group One consists of airlines with a fleet size of up to 50 aircraft. Group Two airlines have a fleet size between 51 and 100. The airlines with fleet of over 101 aircraft form Group Three. In addition to a fleet analysis and maintenance cost analysis, this section also analyzes aircraft leasing and maintenance reserves.
3
38 Analysis by Airline Group
3.1. Fleet OverviewThe 51 participating airlines were grouped by similar fleet sizes. Group One consists of airlines with a fleet size of up to 50 aircraft. Group Two airlines have a fleet size between 51 and 100. The airlines with fleet of over 101 aircraft form Group Three. Table 8 gives an overview of the unit costs and operational data for each Airline Group.
Table 8: Operational and Unit Cost Data by Airline Group (FY2014 — 51 Airlines)
Fig. 39: Fleet Distribution by Aircraft Category and by Airline Group (FY2014 —51 Airlines)
This part of the report is only available to participating airlines
This part of the report is only available to participating airlines
This part of the report is only available to participating airlines

Analysis by Airline Group 39
Fig. 40: Fleet Distribution by Manufacturer and by Airline Group (FY2014 —51 Airlines)
This part of the report is only available to participating airlines

40 Analysis by Airline Group
3.2 Maintenance Cost Analysis By Airline Group
Fig. 41: Direct Maintenance Cost by Airline Group; cost percent of each group related to total maintenance cost (FY2014 —51 Airlines)
This part of the report is only available to participating airlines
This part of the report is only available to participating airlines
This part of the report is only available to participating airlines

Analysis by Airline Group 41
Table 9: Minimum and Maximum Unit Cost by Airline Group (FY2014 —51 Airlines)
Table 10: Direct Maintenance Cost by Aircraft Category and by Airline Group (FY2014 —51 Airlines)
Table 11: Direct Maintenance Cost by Market Element and by Airline Group(FY2014 —51 Airlines)
Table 12: Direct Maintenance Cost by Segment and by Airline Group(FY2014 —51 Airlines)
This part of the report is only available to participating airlines
This part of the report is only available to participating airlines
This part of the report is only available to participating airlines
This part of the report is only available to participating airlines

42
3.3. Aircraft Leasing and Maintenance Reserves By Airline Group
This part of the report is only available to participating airlines

Analysis by Airline Group 43
Fig. 42: Group One % of Leased Aircraft by A / C Category (FY2014 — 24 Airlines)
Fig. 43: Group One % of Leased Aircraft by Region(FY2014 — 24 Airlines)
Fig. 44: Group Two % of Leased Aircraft by A / C Category (FY2014 — 13 Airlines)
This part of the report is only available to participating airlines
This part of the report is only available to participating airlines

44 Analysis by Airline Group
Fig. 45: Group Two % of Leased Aircraft by Region (FY2014 — 13 Airlines)
Fig. 46: Group Three % of Leased Aircraft by A / C Category(FY2014 — 14 Airlines)
Fig. 47: Group Three % of Leased Aircraft by Region (FY2014 — 14 Airlines)
This part of the report is only available to participating airlines
This part of the report is only available to participating airlines
This part of the report is only available to participating airlines

45

46 Trend Analysis (FY2010-2014) - 23 MCTF Airlines

Trend Analysis (FY2010-2014) - 23 MCTF Airlines 47
Trend Analysis (FY2010 - 2014), 23 MCTF Airlines
This section presents a 5-year trend analysis for airlines that have been consistently submitting data to MCTF. Out of 51 airlines, we have data from 23 airlines and we hope to continue progressing to be able to perform a trend analysis over a period of six years (one full maintenance cycle). From 2010 to 2014, the fleet size grew 21% and direct maintenance costs increased 42%. Cost per flight hour increased 12%, cost per cycle increased 21% and cost per aircraft increased 17% over the last five years.
4
0
500
1,000
1,500
2,000
1,582+ 4.2% + 7%
+ 2.3% + 6.1%
AIRCRAFT
1,6491,764 1,804 1,914
2010
2011
2012
2013
2014
48 Trend Analysis (FY2010-2014) - 23 MCTF Airlines
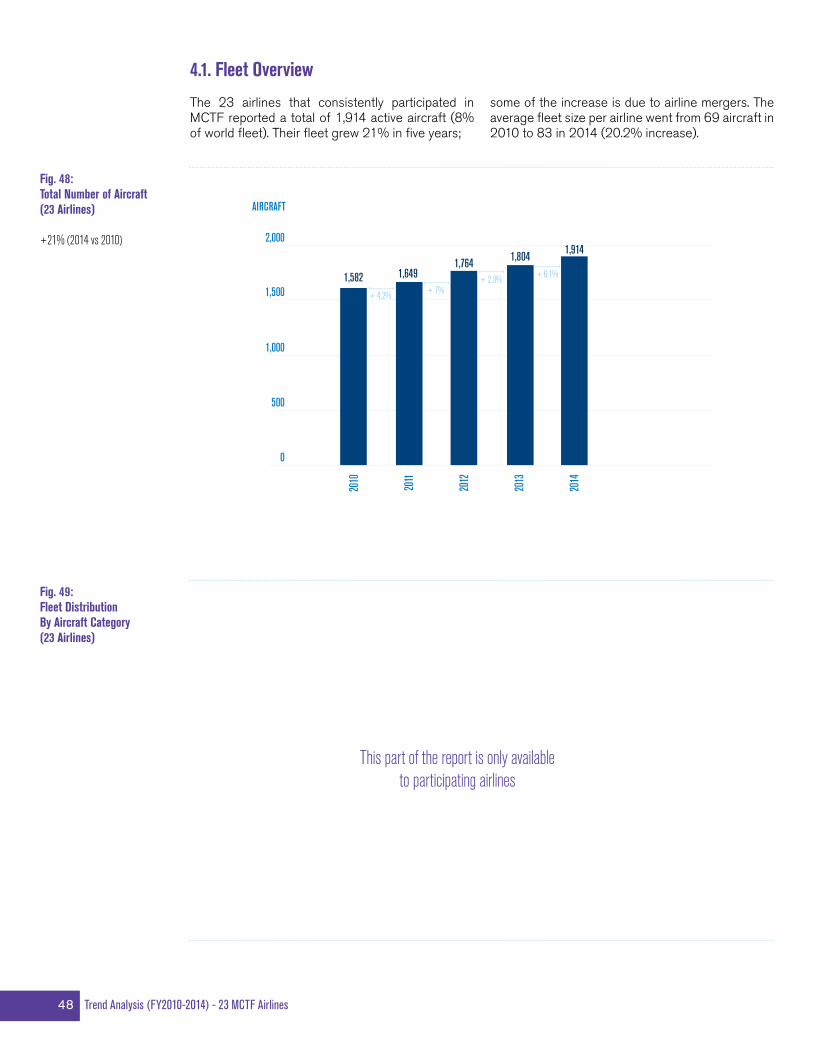
4.1. Fleet OverviewThe 23 airlines that consistently participated in MCTF reported a total of 1,914 active aircraft (8% of world fleet). Their fleet grew 21% in five years;
some of the increase is due to airline mergers. The average fleet size per airline went from 69 aircraft in 2010 to 83 in 2014 (20.2% increase).
Fig. 48: Total Number of Aircraft (23 Airlines)
+21% (2014 vs 2010)
Fig. 49: Fleet Distribution By Aircraft Category (23 Airlines)
This part of the report is only available to participating airlines
Trend Analysis (FY2010-2014) - 23 MCTF Airlines 49
Fig. 50: Fleet Distribution by Manufacturer (23 Airlines)
Fig. 51: Evolution of Fleet Size by Category (23 Airlines)
This part of the report is only available to participating airlines
This part of the report is only available to participating airlines

50
Fig. 52: Evolution of Fleet Size by Manufacturer (23 Airlines)
This part of the report is only available to participating airlines
2010
2011
2012
2013
2014
5.7+ 14.5%
+ 5.9%+ 4.2% + 12.1%
DMC B$
6.5 6.9 7.28.1
Trend Analysis (FY2010-2014) - 23 MCTF Airlines 51
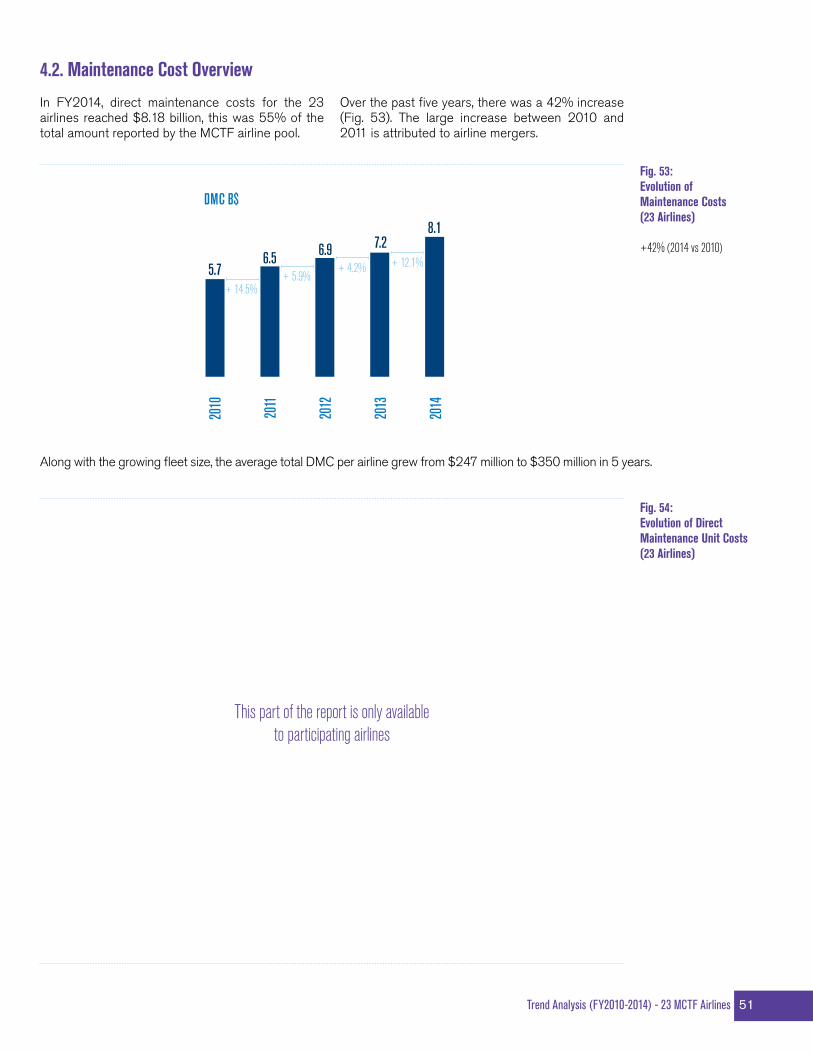
Fig. 53: Evolution of Maintenance Costs (23 Airlines)
+42% (2014 vs 2010)
Fig. 54: Evolution of Direct Maintenance Unit Costs (23 Airlines)
4.2. Maintenance Cost OverviewIn FY2014, direct maintenance costs for the 23 airlines reached $8.18 billion, this was 55% of the total amount reported by the MCTF airline pool.
Over the past five years, there was a 42% increase (Fig. 53). The large increase between 2010 and 2011 is attributed to airline mergers.
Along with the growing fleet size, the average total DMC per airline grew from $247 million to $350 million in 5 years.
This part of the report is only available to participating airlines
52 Trend Analysis (FY2010-2014) - 23 MCTF Airlines
Fig. 55: Direct Maintenance Cost / FH by Segment (23 Airlines)
Fig. 56: Direct Maintenance Costs / FH by Element (23 Airlines)
This part of the report is only available to participating airlines
This part of the report is only available to participating airlines

Trend Analysis (FY2010-2014) - 23 MCTF Airlines 53
Fig. 57: Line Maintenance Cost / FH by Element (23 Airlines)
Fig. 58: Base Maintenance Cost / FH by Element (23 Airlines)
This part of the report is only available to participating airlines
This part of the report is only available to participating airlines

54 Trend Analysis (FY2010-2014) - 23 MCTF Airlines
Fig. 59: Component Maintenance Cost per FH by Element (23 Airlines)
Fig. 60: Engine Maintenance Cost / FH by Element (23 Airlines)
This part of the report is only available to participating airlines
This part of the report is only available to participating airlines

55
This part of the report is only available to participating airlines

2010
2011
2012
2013
2014
AIRCRAFT+21% 2014 vs 2010
1,582+ 4.2% + 7% + 2.3% + 6.1%
1,649 1,764 1,804 1,91420
10
2011
2012
2013
2014
UTILIZATION +4.9%2014 vs 2010
8.93- 0.5% + 1.5% + 3.4% + 0.5%
8.88 9.02 9.33 9.37
2010
2011
2012
2013
2014
FH / AC +4.9%2014 vs 2010
3,259- 0.5% + 1.5% + 3.2% + 0.7%
3,243 3,291 3,396 3,420
2010
2011
2012
2013
2014
FH / FC RATIO +8.3%2014 vs 2010
2.29+ 1.2% +4% + 1.9% + 0.7%
2.32 2.41 2.46 2.48
2010
2011
2012
2013
2014
FC / AC -2.8%2014 vs 20101,421
- 1.7% - 2.4% + 1.2% + 0%1,398 1,364 1,381 1,381
2010
2011
2012
2013
2014
AVG AGE -5.3%2014 vs 2010
8.61- 3.8% - 1.5% + 1.3% - 1.5%
8.29 8.17 8.27 8.15
56 Trend Analysis (FY2010-2014) - 23 MCTF Airlines
Fig. 61: General Trends (FY2010 - 2014) 23 Airlines
4.3. General TrendsThe graphs below present general trends in terms of operational data (fleet size, average age, flight hours and cycles, etc.) and unit costs (maintenance cost per FH, per FC and per AC) for FY2010 to 2014.

2010
2011
2012
2013
2014
DMC $B +42.1%2014 vs 2010
5.7+ 14%
+ 5.9% + 4.2% + 12.1%6.5 6.9 7.28.1
2010
2011
2012
2013
2014
DMC $ / FC +20.6%2014 vs 2010
+ 11.7%+ 1.5% + 0.6% + 5.7%
2,825 2,866 2,885 3,0482,528
2010
2011
2012
2013
2014
DMC $ / AL +41.7%2014 vs 2010
247283 300 313
350
+ 14.5%+ 5.9% + 4.2% + 12.1%
2010
2011
2012
2013
2014
DMC $ / AC +17.3%2014 vs 2010
3.59+9.9%
- 1.0% + 1.9% + 5.8%3.95 3.91 3.98 4.21
2010
2011
2012
2013
2014
AIRCRAFT / AL +20.3%2014 vs 2010
69 72 77 78 83
+ 4.2% + 7% + 2.3% + 6.1%
2010
2011
2012
2013
2014
DMC $ / FH +11.5%2014 vs 2010
1,103+ 10.4%
- 2.5% - 1.2% + 4.9%
1,218 1,188 1,173 1,231
Trend Analysis (FY2010-2014) - 23 MCTF Airlines 57

58 Trend Analysis (FY2010-2014) - 23 MCTF Airlines
4.4. Trend Analysis By Airline GroupIn total, 23 airlines have submitted their data consistently for the past 5 years, allowing us to perform trend analysis for each group between 2010 and 2014. During this period, the number of Group One airlines decreased from13 in 2010 to 10 in 2014. Conversely, the number of Group Two and Group
Three airlines increased, from 5 to 6 and from 5 to 7 respectively. This trend is also reflected in the fleet size between 2010 and 2014 (Fig. 63). The increase in fleet size could be due to mergers and acquisitions or more aircraft entering than leaving airline fleets.
Fig. 62: Airline Group Distribution (FY2010 - FY2014)
Large
Medium
Small
Fig. 63: Airline Group Fleet Size (FY2010 - FY2014)
2010
2011
2012
2013
2014
0%
40%
10%
20%
30%
50%
60%
70%
80%
100%AIRLINES
5
5
13
5
6
12
7
5
11
7
4
12
7
6
10
This part of the report is only available to participating airlines
Trend Analysis (FY2010-2014) - 23 MCTF Airlines 59
Fig. 64: Direct Maintenance Unit Cost for Group One Airlines (FY2010 - FY2014)
Table 13: Operational Data Group One Airlines (FY2010 - FY2014)
This part of the report is only available to participating airlines
This part of the report is only available to participating airlines
This part of the report is only available to participating airlines
60 Trend Analysis (FY2010-2014) - 23 MCTF Airlines
Fig. 65: Direct Maintenance Unit Cost for Group Two Airlines (FY2010 - FY2014)
$ / FH
$ / FC
$ / AC
Table 14: Operational Data Group Two Airlines (FY2010 - FY2014)
This part of the report is only available to participating airlines
This part of the report is only available to participating airlines
This part of the report is only available to participating airlines

Trend Analysis (FY2010-2014) - 23 MCTF Airlines 61
Fig. 66: Direct Maintenance Unit Cost for Group Three Airlines (FY2010 - FY2014)
$ / FH
$ / FC
$ / AC
Table 15: Operational DataGroup Three Airlines (FY2010 - FY2014)
Table 16: Widebody Aircraft for Airline Groups (FY2010 - FY2014)
This part of the report is only available to participating airlines
This part of the report is only available to participating airlines
This part of the report is only available to participating airlines
This part of the report is only available to participating airlines


Maintenance Costs Trend Analysis by Aircraft Category (FY2010-2014 - 23 Airlines) 63
Maintenance Costs Trend Analysis by Aircraft Category (FY2010 - 2014 — 23 Airlines)
This section presents a trend analysis of maintenance costs by aircraft category for the 23 consistent airlines in MCTF. Over the last five years, these airlines had increases in all aircraft categories with the exception of turboprops, which declined 23%. Maintenance unit costs display an increasing trend for most aircraft categories.
5

64 Maintenance Costs Trend Analysis by Aircraft Category (FY2010-2014 - 23 Airlines)
5.1. Overview by Aircraft CategoryThis section gives an overview of all the aircraft categories.
Over the last five years, NB and WB2 fleets had the strongest increases, respectively +30% and
+25% WB3+ and RJ were on a steady but slower progression with +12% and +15%. On the contrary, TPs have been less and less popular (-23%) among the MCTF airlines that contributed data on a consistent basis (Fig. 67).
Fig. 67: Evolution of Fleet Size by AC Category (23 Airlines)
WB3+
WB2
TP
NB
RJ
Fig. 68: Evolution of Direct Maintenance Cost / FH by AC Category (23 Airlines)
AIRCRAFT
1,000
2010 2011 2012 2013 2014
0
500
128
537
121 124 137 143
580 628 631 669
665 719
775 797
862
120
133 115 111 107 103
115 126 132 137
This part of the report is only available to participating airlines
Maintenance Costs Trend Analysis by Aircraft Category (FY2010-2014 - 23 Airlines) 6564 Maintenance Costs Trend Analysis by Aircraft Category (FY2010-2014 - 23 Airlines)
Fig. 69: Evolution of Direct Maintenance Cost / FC by AC Category (23 Airlines)
Fig. 70: Evolution of Direct Maintenance Cost / AC by AC Category (23 Airlines)
This part of the report is only available to participating airlines
This part of the report is only available to participating airlines

66 Maintenance Costs Trend Analysis by Aircraft Category (FY2010-2014 - 23 Airlines)
5.2. Narrowbody Aircraft
Fig. 71: NB Fleet Mix (FY2010 - 2014 — 23 Airlines)
Fig. 72: NB Unit Costs (FY2010 - 2014 — 23 Airlines)
This part of the report is only available to participating airlines
This part of the report is only available to participating airlines

Maintenance Costs Trend Analysis by Aircraft Category (FY2010-2014 - 23 Airlines) 6766 Maintenance Costs Trend Analysis by Aircraft Category (FY2010-2014 - 23 Airlines)
Fig. 73: NB Maintenance Cost / FH by Segment (FY2010 - 2014 — 23 Airlines)
Fig. 74: NB Maintenance Cost / FH by Element (FY2010 - 2014 — 23 Airlines)
This part of the report is only available to participating airlines
This part of the report is only available to participating airlines

68 Maintenance Costs Trend Analysis by Aircraft Category (FY2010-2014 - 23 Airlines)
5.3. Widebody Aircraft
Fig. 75: WB Fleet Mix (FY2010 - 2014 — 23 Airlines)
Fig. 76: WB Unit Costs (FY2010 - 2014 — 23 Airlines)
This part of the report is only available to participating airlines
This part of the report is only available to participating airlines

Maintenance Costs Trend Analysis by Aircraft Category (FY2010-2014 - 23 Airlines) 6968 Maintenance Costs Trend Analysis by Aircraft Category (FY2010-2014 - 23 Airlines)
Fig. 77: WB Maintenance Cost / FH by Segment (FY2010 - 2014 — 23 Airlines)
Fig. 78: WB Maintenance Cost /FH by Element (FY2010 - 2014 — 23 Airlines)
This part of the report is only available to participating airlines
This part of the report is only available to participating airlines

70 Maintenance Costs Trend Analysis by Aircraft Category (FY2010-2014 - 23 Airlines)
5.4. Regional Jets
Fig. 79: RJ Fleet Mix (FY2010 - 2014 — 23 Airlines)
Fig. 80: RB Unit Costs (FY2010 - 2014 — 23 Airlines)
This part of the report is only available to participating airlines
This part of the report is only available to participating airlines

Maintenance Costs Trend Analysis by Aircraft Category (FY2010-2014 - 23 Airlines) 7170 Maintenance Costs Trend Analysis by Aircraft Category (FY2010-2014 - 23 Airlines)
Fig. 81: RJ Maintenance Cost / FH by Segment (FY2010 - 2014 — 23 Airlines)
Fig. 82: RJ Maintenance Cost / FH by Element (FY2010 - 2014 — 23 Airlines)
This part of the report is only available to participating airlines
This part of the report is only available to participating airlines

72 Maintenance Costs Trend Analysis by Aircraft Category (FY2010-2014 - 23 Airlines)
5.5. Turboprops
Fig. 83: TP Fleet Mix (FY2010 - 2014 — 23 Airlines)
Fig. 84: TP Unit Costs (FY2010 - 2014 — 23 Airlines)
This part of the report is only available to participating airlines
This part of the report is only available to participating airlines

Maintenance Costs Trend Analysis by Aircraft Category (FY2010-2014 - 23 Airlines) 7372 Maintenance Costs Trend Analysis by Aircraft Category (FY2010-2014 - 23 Airlines)
Fig. 85: TP Maintenance Cost / FH by Segment (FY2010 - 2014 — 23 Airlines)
Fig. 86: TP Maintenance Cost / FH by Element (FY2010 - 2014 — 23 Airlines)
This part of the report is only available to participating airlines
This part of the report is only available to participating airlines

74 Airline Maintenance Cost Executive Commentary - Annex
Annex I: MCTF Fleet vs World Fleet (2014)
Table 17: Fleet Composition by CategorySources: MCTF (51 Airlines) World (ACAS)
Table 18: Fleet Composition by RegionSources: MCTF (51 Airlines) World (ACAS)
Table 19: Fleet Composition by ManufacturerSources: MCTF (51 Airlines) World (ACAS) Boeing
Airbus
Embraer
Bombardier
ATR
BAE
Fokker
Other
MCTF WORLD
MCTF WORLD
NB 2,110 50.1% 13,792 56.1%
WB 1,530 36.3% 4,968 20.2%
RJ 394 9.3% 3,935 16%
TP 182 4.3% 1,902 7.7%
4,216 100% 24,597 100%
Africa 81 1.9% 707 2.9%
Americas 1,601 38% 9,448 38.4%
ASPAC 1,112 26.4% 3,707 15.1%
Europe 669 15.9% 6,252 25.4%
Middle East 467 11% 1,619 6.6%
N. Asia 286 6.8% 2,864 11.6%
4,216 100% 24,597 100%
MCTF WORLD 2,223 52.7% 11,055 44.9%
1,418 33.6% 7,695 31.3%
372 8.8% 2,407 9.8%
87 2.1% 2,007 8.1%
95 2.3% 906 3.7%
20 0.5% 199 0.8%
2 0% 192 0.8%
0 0% 136 0.6%
4,216 100% 24,597 100%
Airline Maintenance Cost Executive Commentary - Annex 75
Annex II: Staff (2014)
Table 20: Direct Labor Staff (29 Airlines)
Table 21: Overhead Staff (43 Airlines)
Table 22: Overhead Staff by Category (43 Airlines)
This part of the report is only available to participating airlines
This part of the report is only available to participating airlines
This part of the report is only available to participating airlines

76 Airline Maintenance Cost Executive Commentary - Annex
Annex III: Time Breakdown (2014)
Table 23: Time Breakdown for One Mechanic (28 Airlines)
Breakdown of hours per year for one employee of the direct maintenance staff (i.e. mechanic)
This part of the report is only available to participating airlines

Airline Maintenance Cost Executive Commentary - Annex 77
ANNEX IV: Fleet Distribution by Aircraft Family and by Group (51 Airlines, FY2014)
Fig. 87: Fleet Distribution by Aircraft Family for Group One (up to 50 aircraft) 24 Airlines
Fig. 88: Fleet Distribution by Aircraft Family for Group Two (51 – 100 aircraft) 13 Airlines
Fig. 89: Fleet Distribution by Aircraft Family for Group Three (+101 aircraft) 14 Airlines
This part of the report is only available to participating airlines
This part of the report is only available to participating airlines
This part of the report is only available to participating airlines

78 Airline Maintenance Cost Executive Commentary - Annex
Annex V: Operational Data by Aircraft Category
Table 24: Operational Data by Aircraft Category (23 Airlines)
This part of the report is only available to participating airlines

Airline Maintenance Cost Executive Commentary - Annex 79
ANNEXE VI: Unit Costs by Airline
Fig. 90: Direct Maintenance Cost per FH (FY2014 — 51 Airlines)
Fig. 91: Direct Maintenance Cost per FC (FY2014 — 51 Airlines)
This part of the report is only available to participating airlines
This part of the report is only available to participating airlines

80 Airline Maintenance Cost Executive Commentary - Annex
Fig. 92: Direct Maintenance Cost per AC (FY2014 — 51 Airlines)
Fig. 93: Inventory $ per AC (FY2014 — 38 Airlines)
This part of the report is only available to participating airlines
This part of the report is only available to participating airlines

ContributorsChris MARKOU:
Geraldine CROS:[email protected]
Ashley SNG :[email protected]
Contact Information
For additional information, please contact us by email
or visit our webpage.
[email protected]/mctf

Visit our website: www.iata.org