airline business development information report · 2016-01-13 · airline business development...
TRANSCRIPT

Airline Business DevelopmentInformation Report
Strategic DevelopmentCommittee
January 2016
a
Reagan National is expected to reach an all-time record of 23.1 million passengers.
Dulles International service declined slightly; however, new service increases are in place for 2016.
Dulles International’s domestic air service declines, primarily due to Reagan National drawing flights/passengers from Dulles International, stabilized in 2015 and are beginning to increase.
Reagan National and Dulles International projected 2015 passenger numbers combined deliver an airport system growth rate of 5.3%, exceeding many other major airports in the U.S.
Reagan National and BWI have overtaken Dulles International’s regional market share.
2015 Air Service Overview
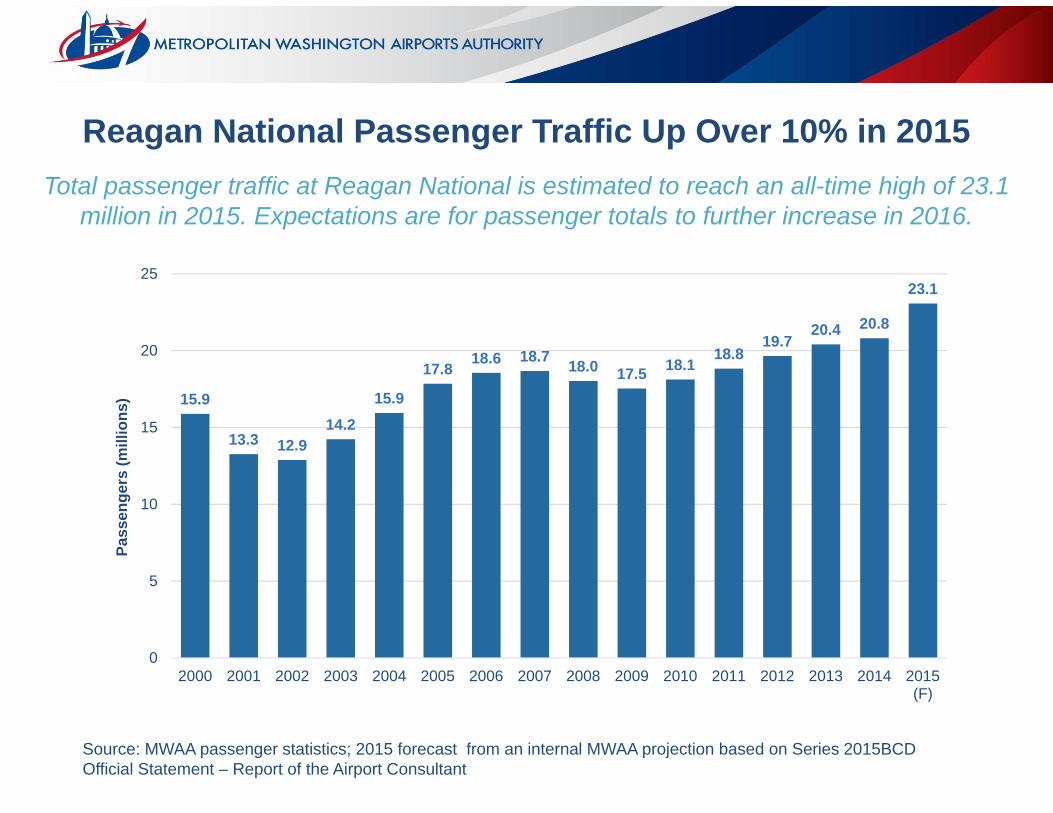
Reagan National Passenger Traffic Up Over 10% in 2015Total passenger traffic at Reagan National is estimated to reach an all-time high of 23.1
million in 2015. Expectations are for passenger totals to further increase in 2016.
15.9
13.3 12.914.2
15.9
17.818.6 18.7 18.0 17.5 18.1
18.819.7
20.4 20.8
23.1
0
5
10
15
20
25
2000 2001 2002 2003 2004 2005 2006 2007 2008 2009 2010 2011 2012 2013 2014 2015(F)
Pass
enge
rs (m
illio
ns)
Source: MWAA passenger statistics; 2015 forecast from an internal MWAA projection based on Series 2015BCD Official Statement – Report of the Airport Consultant

Dulles International Passenger Traffic Stabilized in 2015
Passenger traffic at Dulles International in 2015 expected to remain at 2014 levels
Source: MWAA passenger statistics; 2015 forecast from an internal MWAA projection based on Series 2015BCD Official Statement – Report of the Airport Consultant
15.813.9 13.0 12.8
18.021.9
17.6 18.6 17.5 16.8 17.1 16.5 15.7 15.0 14.3 14.4
4.34.1
4.2 4.2
4.9
5.1
5.46.2
6.4 6.4 6.5 6.7 6.8 7.0 7.1 7.0
0
5
10
15
20
25
30
2000 2001 2002 2003 2004 2005 2006 2007 2008 2009 2010 2011 2012 2013 2014 2015Est.
Pass
enge
rs (M
illio
ns)
Domestic International
20.1
18.0 17.2 17.0
22.9
27.1
23.024.7
23.9 23.2 23.6 23.2 22.5 21.9 21.4 21.4

When DCA and IAD projected 2015 passenger numbers are combined, our airport system’s 5.3% growth rate exceeds many other major airports in the U.S.
DCA/IAD Airport System + 5.3%DCA grew significantly + 10.4%IAD was stable + 0.1%
2015 Performance of 2 Airport System Benchmarks Favorably to U.S. Airports
Source: Air Traffic Statistics; Internal Projections

Top U.S. AirportsBy Passenger Growth
CITY/COUNTRY
12-MONTHS ENDING OCT 2015/2014INTERNATIONAL DOMESTIC TOTAL
(000s) %CHG (000s) %CHG (000s) %CHG
SEATTLE WA,US 4 306.5 14.8 37 347.1 12.7 41 653.6 12.9 DCA 392.5 (0.5) 22 314.5 10.6 22 707.0 10.4 AUSTIN TX,US 238.8 70.3 11 395.2 8.8 11 633.9 9.6 FORT LAUDERDALE, FL 5 424.3 20.9 21 123.3 6.7 26 547.6 9.3 CHICAGO IL,US 10 936.3 1.6 64 786.8 10.4 75 789.2 9.0 OAKLAND CA,US 315.0 50.6 10 729.4 7.3 11 044.3 8.2 MIAMI FL,US 21 038.7 4.7 22 823.9 10.5 43 862.6 7.6 ORLANDO FL,US 4 918.5 16.4 33 116.1 6.1 38 034.6 7.3 TAMPA FL,US 698.6 15.4 17 902.8 6.7 18 601.4 7.0 SAN DIEGO CA,US 690.5 1.9 19 166.0 7.0 19 856.6 6.8 NEW YORK NY,US 29 614.7 5.3 26 581.4 7.5 56 196.1 6.3 NASHVILLE TN,US 82.5 30.7 11 526.5 5.8 11 609.0 6.0 SAN FRANCISCO CA,US 11 039.9 8.2 38 350.2 4.6 49 399.8 5.3 MWAA SYSTEM 44 198.2 5.3 CHICAGO IL,US 768.6 35.2 21 419.6 4.5 22 189.0 5.3 BOSTON MA,US 5 437.1 11.1 27 664.9 4.2 33 102.0 5.3 SALT LAKE CITY UT,US 537.3 48.2 21 477.4 4.4 22 014.7 5.1 NEWARK NJ,US 11 797.3 1.3 25 245.0 6.7 37 042.3 4.9 BALTIMORE MD,US 1 089.1 27.1 22 283.1 3.9 23 372.2 4.8 LOS ANGELES CA,US 19 677.2 7.7 50 992.3 4.8 73 581.1 4.8 NEW YORK NY,US 1 756.0 (3.3) 26 347.7 5.2 28 103.8 4.6 LAS VEGAS NV,US 3 479.3 2.6 41 204.5 4.7 44 695.6 4.6 ATLANTA GA,US 11 069.4 2.2 89 190.7 4.8 100 260.1 4.5 PORTLAND OR,US 611.2 28.6 15 979.4 3.6 16 590.7 4.3 HOUSTON TX,US 10 376.7 6.7 32 241.5 3.5 42 618.2 4.3 MINNEAPOLIS MN,US 2 636.2 9.6 33 570.4 2.7 36 206.6 3.2 DETROIT MI,US 2 874.1 (2.7) 30 215.7 2.0 33 089.8 1.6
DALLAS/FORT WORTH TX, 7 661.4 8.8 56 070.2 0.1 63 731.6 1.1 ST LOUIS MO,US 179.0 9.7 12 376.4 0.9 12 555.4 1.0 CHARLOTTE NC,US 2 842.9 (3.0) 41 839.7 0.9 44 682.6 0.7 IAD 6 924.1 (2.9) 14 567.1 1.5 21 491.2 0.1
Source: Air Traffic Statistics; Internal Projections

Reagan National and BWI Have Overtaken DullesInternational’s Regional Market Share
17
18
19
20
21
22
23
24
2010 2011 2012 2013 2014 2015 (F)
IAD DCA BWI
Total Annual Passengers (In Millions)
6% Growth at BWI
27% Growth at DCA
8% Decline at IAD
Source: Air Traffic Statistics; Internal Projections
The regional leader 5 years ago, Dulles now serves fewer passengers than DCA and BWI
5 Year Activity Trend:

The Region’s Total Passengers Increased and DullesInternational’s Market Share Decreased in the Past Six
YearsTotal Annual Passengers
Source: Air Traffic Statistics; Internal Projections
The Washington-Baltimore Region’s AirportsAre projected to handle over 68 million passengers in 2015.
IAD38%
IAD32%
BWI33%
BWI34%
DCA29% DCA
34%
201063.7 Million
201568.0 Million

2015-2016 New International Service at Dulles InternationalUNITED
1 Weekly Seasonal service to Los Cabos, Mexico began March, 20154 Flights per Week to Barcelona, Spain, to begin May 25, 20164 Flights per Week to Lisbon, Portugal, to begin May 25, 2016
AER LINGUS4 Flights per Week to Dublin, Ireland, began May 2015—to be increased to daily by May 2016—seasonal service
SOUTH AFRICAN AIRWAYS4 Flights per Week to Accra, Ghana, began August 2015
LAN3 Flights per Week to Lima, Peru, scheduled to begin May 2016—to be increased to 4 flights weekly in July 2016
AIR CANADA2 Daily Flights to Toronto, Canada, to begin May 2, 2016
ROYAL AIR MAROC3 Weekly Flights to Casablanca, Morocco, to begin September 2016
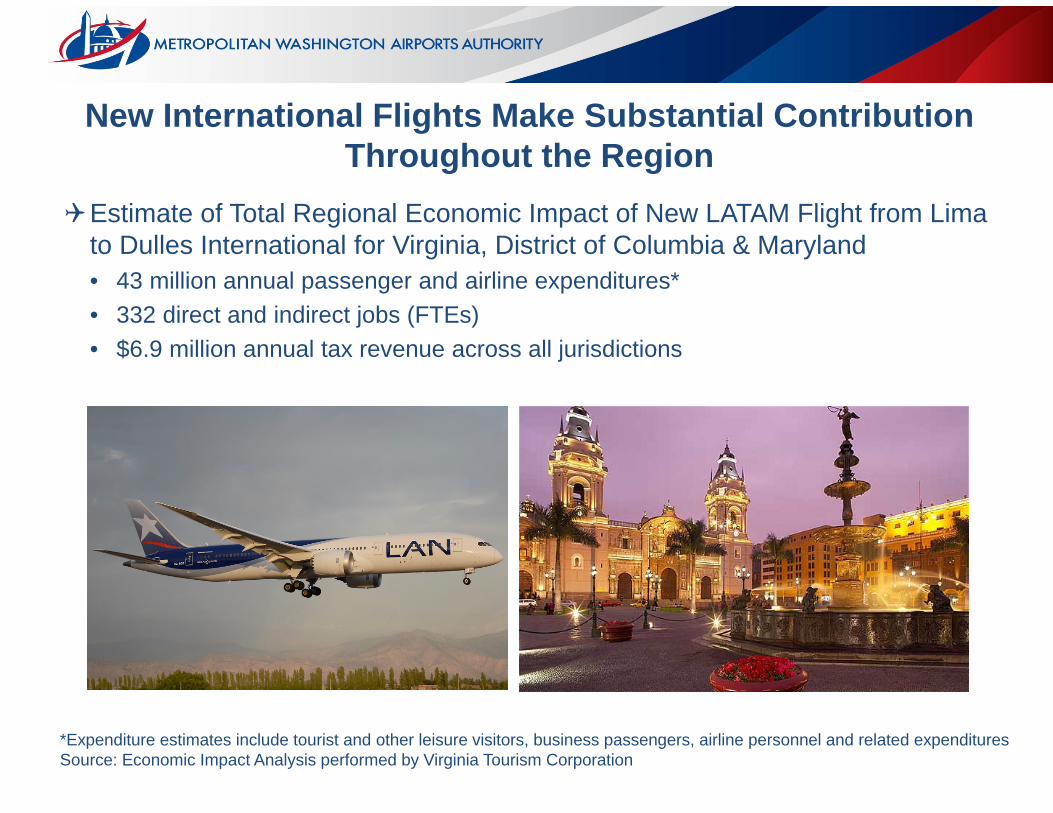
New International Flights Make Substantial ContributionThroughout the Region
Estimate of Total Regional Economic Impact of New LATAM Flight from Lima to Dulles International for Virginia, District of Columbia & Maryland• 43 million annual passenger and airline expenditures* • 332 direct and indirect jobs (FTEs)• $6.9 million annual tax revenue across all jurisdictions
*Expenditure estimates include tourist and other leisure visitors, business passengers, airline personnel and related expenditures Source: Economic Impact Analysis performed by Virginia Tourism Corporation

2015 Dulles Air Cargo Overview
Total air cargo tonnage in 2015 at Dulles International is expected to be down slightly, less than 1% compared to 2014, primarily attributable to overall stagnant economies during 2015 in Dulles International’s largest international trade sectors – Europe and Asia.
International air cargo at Dulles International declined approximately 4%, driven primarily by declines in outbound shipments; loss of military support exports and conversion of wide-body aircraft to narrow-body aircraft.
Domestic air cargo at Dulles International increased approximately 5%, primarily on United.
Dulles International carriers report growing levels in pharmaceuticals and e-commerce goods.

Air Cargo at Dulles InternationalAir cargo volumes at Dulles in 2015 are expected to be basically flat with 2014. Slight declines in international cargo should be offset by growth in domestic cargo.
Source: Metropolitan Washington Airports Authority
175149 154 145 147 157
136119 127 114 113
94 89 94
129
118142 144
191191
184
164
196
177 165
160 178 172
0
50
100
150
200
250
300
350
400
2002 2003 2004 2005 2006 2007 2008 2009 2010 2011 2012 2013 2014 2015 est.
Frei
ght T
ons
(thou
sand
s)
Domestic International
304
278267
254
291
323
283
320
348338
289296
267 266
Est.

How Does Dulles International Air Cargo CompareTo Other US Airports?
The slight decrease (0.9%) in total tonnage for the 12 months ending October 2015 places Dulles in the middle of the pack with other east coast airports. Overall air cargo performance in the U.S. for 2015 was weak compared to 2014.
(10.0)
(8.0)
(6.0)
(4.0)
(2.0)
0.0
2.0
4.0
6.0
EWR ATL SDF PIT MEM BOS CLT MIA IAD JFK PHL IAH DTW BNA
% Change Cargo Tonnage 12 Months ending October 2015

Cooperative Promotional ProgramsAirline Advertising: United Airlines to Amsterdam & Madrid

Cooperative Promotional ProgramsAirline Advertising: United Airlines to Beijing
Air ChinaTo Beijing

Cooperative Promotional ProgramsAirline Advertising: South African Airlines to Accra

Cooperative Promotional ProgramsSpecial Promotional Event: United Airlines at U.S. Embassy in Beijing on July 4th
