aircraftrunwaylengthestimation (part1) - air...
TRANSCRIPT

Virginia Tech 1 of 59
Aircraft Runway Length Estimation(Part 1)
Dr. Antonio A. Trani Professor
Department of Civil Engineering
Virginia Tech

Virginia Tech 2 of 59
Organization of this Section
• Understanding basic aircraft weights and its limits
• General Equations of Motion to Understand Runway Length Curves and Tables
• General Federal Aviation Regulation Criteria to Develop Runway Length Requirements at Airports
• General Methods to Estimate Runway Length at Airports

Virginia Tech 3 of 59
Understanding Aircraft Weights and its Limits

Virginia Tech 4 of 59
Aircraft Mass Definitions
• There are several important aircraft operational characteristics to know about the aircraft mass
• Aircraft mass expenditures are significant and thus need to be accounted for in the air vehicle runway length analysis.
- OEW = operating empty weight (or mass) is the weight (or mass) of the aircraft without fuel and payload (just the pilots and empty seats)
- MTOW = maximum takeoff operating weight (or mass) - structurally the maximum demonstrated mass at takeoff for safe flight
- MALW = maximum allowable landing weight (or mass) is the maximum demonstrated landing weight (or mass) to keep the landing gear intact at maximum sink rate (vertical speed)

Virginia Tech 5 of 59
Aircraft Mass Definitions (II)
- MSPW = maximum structural payload weight (or mass) is the maximum demonstrated payload to be carried without stressing the aircraft fuselage
- MZFW = maximum zero fuel weight (or mass) is the sum of the OEW and the MSPW
- MTW = maximum taxi weight (or mass) of the maximum demonstrated weight (or mass) for ground maneuvering. Usually slightly more than MTOW
All aircraft operating weight limits are established during the certification of the vehicle (FAR part 25 - for transport aircraft or FAR 23 for smaller aircraft)

Virginia Tech 6 of 59
Operational Definitions
DTW = desired takeoff weight (or mass) is the weight of the aircraft considering fuel (includes reserve), payload and OEW to complete a given stage length (trip distance)
where:
is the payload carried (passengers and cargo)
is the operating empty weight
is the fuel weight to be carried (usually includes reserve fuel)
DTW PYL OEW FW+ +=
PYL
OEW
FW
Virginia Tech 7 of 59
Runway Length Estimation Procedures
Factors influencing runway length performance
• Performance requirements imposed by FAR regulations (such as FAR 25, 23, 121, 91, etc.)
• Environmental characteristics (temperature and pressure) of the airport in question
• Operating limits on aircraft weight
Methods to calculate runway length
• AC 150/5325-4 (tables and graphs)
• Use of aircraft manufacturer data (such as Boeing data)
• Declared distance concept (AC 150/5300-13 Appendix 14)

Virginia Tech 8 of 59
General Equations of Motion to Understand Runway Length Curves
and Tables

Virginia Tech 9 of 59
Introductory Remarks on Aircraft Performance
Air vehicles are significant different than their ground vehicle counterparts in three aspects:
• Aircraft require a prepared surface to lift-off and fly which affects the overall capability of the vehicle to carry useful payload
• Aircraft move in a dynamic atmospheric environment where changes in temperature, density, and speed of sound are drastic and cannot be neglected
• Aircraft mass expenditures are significant and thus need to be accounted for in the air vehicle performance analysis. For example, a Boeing 747-400 can takeoff at near 390 metric tons and yet land at its destination at 220 metric tons thus making the fuel expenditure a significant factor in how the vehicle performs along the flight path

Virginia Tech 10 of 59
International Standard Atmosphere (1962)
Characteristics of the International Standard Atmosphere.
Geopotential Altitude (m.) Temperature (oK)T
Density (kg/m3)ρ
Speed of Sound (m/s)a
0 288.2 1.225 340.3
1000 281.7 1.112 336.4
2000 275.2 1.007 332.5
3000 268.7 0.909 328.6
4000 262.2 0.819 324.6
5000 255.7 0.736 320.5
6000 249.2 0.660 316.4
7000 242.7 0.589 312.3
8000 236.2 0.525 308.1
9000 229.7 0.466 303.8
10000 223.2 0.413 299.5
11000 216.7 0.364 295.1
12000 216.7 0.311 295.1
13000 216.7 0.266 295.1
14000 216.7 0.227 295.1
15000 216.7 0.194 295.1
Virginia Tech 11 of 59
Important Aircraft Speed Terms to Know
Indicated Airspeed (IAS) - is the speed registered in the cockpit instrument
True Airspeed (TAS) - is the actual speed of the vehicle with respect of the mass of air surrounding the aircraft (accounts for compressibility effects)
Calibrated Airspeed (CAS) - similar to IAS but corrected for instrument position errors (airflow problems outside the vehicle).
Ground speed (GS) - TAS corrected for wind
Stalling Speed ( ) - minimum speed for safe flight
Mach Number - ratio of the aircraft speed to the speed of sound, (note varies with altitude)
V stall
aa

Virginia Tech 12 of 59
Compressibility Effects
A mathematical expression to estimate true airspeed (in terms of true Mach number) from CAS follows:
(2.1)
where: is the true mach number, is the calibrated airspeed in knots (CAS = IAS) in our analysis, is the atmospheric density at sea level, is the density at the altitude the aircraft is flying, and the constants 0.2 and 661.5 account for the specific heat of the air and the speed of sound at sea level (in knots), respectively.
Defining true mach number ( ) as the ratio of the true aircraft speed ( ) and the speed of sound ( ) at the flight level in question we have,
(2.2)
M true 5 ρ0
ρ----- 1 0.2 V CAS
661.5-------------
2
+3.5
1– 1+
0.286
1–=
M true V CAS
ρ0
ρ
M true
V TAS a
V TAS aM true=

Virginia Tech 13 of 59
Example Computation
Boeing 737-300 (a medium size jet transport) flies at 250 knots (IAS) at an altitude of 5.0 km. in a standard atmosphere. What is TAS?
A quick glance at the ISA Table reveals that air density at 5.0 km. is about 0.736 kg/m3 thus yielding a true mach number of 0.51 (using Equation 2.1). Since the speed of sound at that altitude is 320.5 m/s (see Table) then the true airspeed of the aircraft is 163.5 m/s or 315 knots.
Note that in this case there is a difference of 65 knots between IAS and TAS. As the aircraft climbs the value of TAS increases even if IAS remains constant. Since TAS is responsible for the travel time of the vehicle it is important to learn how to estimate TAS for any feasible flight condition.

Virginia Tech 14 of 59
Aircraft Runway Length Performance Estimation
Critical issue in airport engineering and planning (the wrong runway length is costly to the operator and perhaps unsafe)
Figure 2.1 Forces Acting in the Aircraft During Takeoff.
φ
TED
L
mgFf

Virginia Tech 15 of 59
Nomenclature
- thrust force (also called tractive effort) provided by the vehicle powerplant
- lifting force provided by the wing-body of the vehicle
- drag force to the vehicle body, nacelle(s), landing gears, etc.,
- friction force due to rolling resistance
The functional form of these forces has been derived from dimensional analysis (review your math course notes) and from extensive knowledge of fluid mechanics (wind tunnels and water tank experiments)
T
L
D
F f

Virginia Tech 16 of 59
Functional Forms of the Forces
The functional form of these forces is as follows:
(2.3)
(2.4)
(2.5)
(2.6)
is the vehicle speed (TAS), is the air density (kg/m3), is the aircraft gross wing area, is the lift coefficient (nondimensional),
is the drag coefficient (nondimensional), is the rolling friction coefficient (nondimensional), and is the angle comprised between the runway and the horizontal plane
L12---ρV 2SC L=
D12---ρV 2SC D=
T f V ρ,( )=
F f mg φcos L–( ) f roll=
V ρ SCL
CD f roll
φ

Virginia Tech 17 of 59
Notes on Various Parameters
1) and are specific to each airframe-flap configuration
2) is usually a function of runway surface conditions and aircraft speed
Figure 2.2 Typical Variations of and with Aircraft Speed.
CL CD
f roll
V (m/sec)
T (N)
Sea Level
High Elevation
V (m/sec)
f roll Bias-Ply Tire
Radial Tire
V (m/s) V (m/s)
T f roll
Virginia Tech 18 of 59
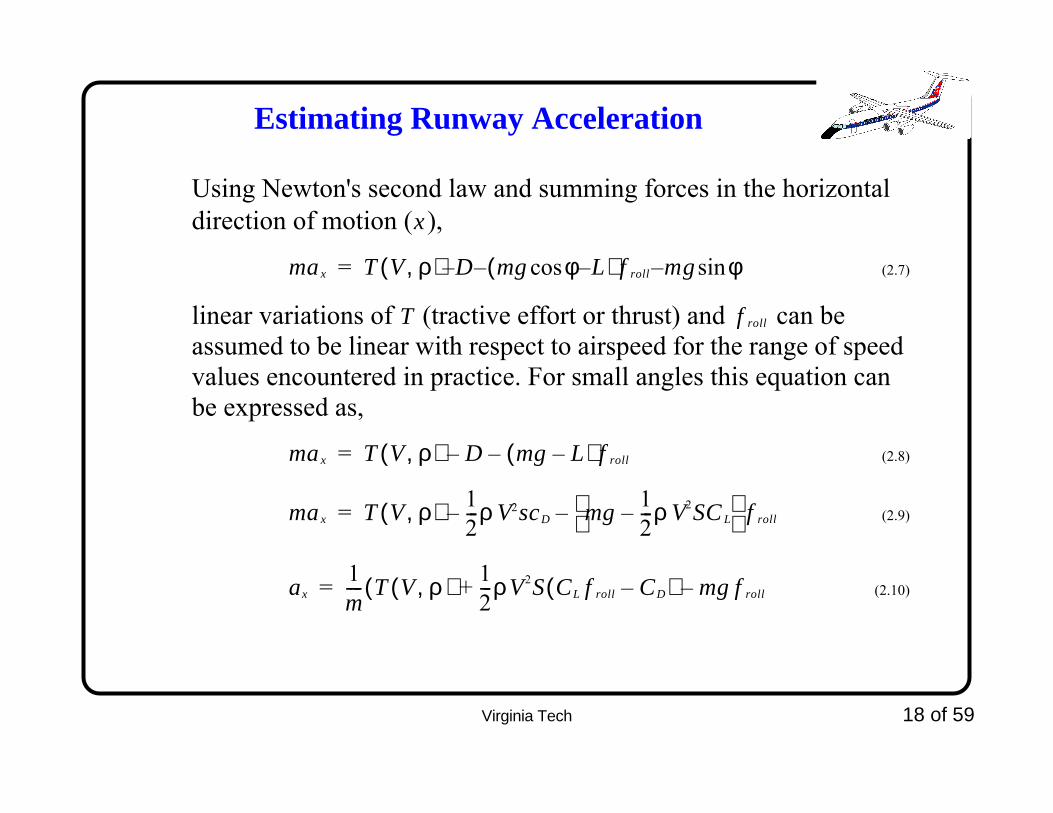
Estimating Runway Acceleration
Using Newton's second law and summing forces in the horizontal direction of motion ( ),
(2.7)
linear variations of (tractive effort or thrust) and can be assumed to be linear with respect to airspeed for the range of speed values encountered in practice. For small angles this equation can be expressed as,
(2.8)
(2.9)
(2.10)
x
ma x T V ρ,( ) D– mg φ L–cos( ) f roll– m– g φsin=
T f roll
ma x T V ρ,( ) D– mg L–( ) f roll–=
ma x T V ρ,( ) 12---ρ V2scD– mg
12---ρ V2SC L–
f roll–=
ax
1m---- T V ρ,(( ) 1
2---ρ V2S CL f roll CD–( ) mg f roll–+=

Virginia Tech 19 of 59
Remarks About Equation 2.10
• The acceleration capability of the aircraft decreases as speed is gained during the takeoff roll due to a reduction in the thrust produced by the engines
• If Eq. 2.10 is integrated twice between an initial speed, and the lift-off speed, the distance traversed during the takeoff roll can be found
• Usually this requires a computer simulation since many parameters such as and vary with speed (time varying) making the coefficient of the differential equation of motion time dependent.
V 0
V lo
T f roll

Virginia Tech 20 of 59
Aerodynamic Coefficients
• The flap setting affects and and hence affects acceleration and runway length required for a takeoff. Typical variations of
with flap angle are shown below
Figure 2.3 Typical Variations of CD and CL with Aircraft Wing Flap Angle.
CD CL
CD
CD CL
Flap Angle (degrees)
5 10 15 20 25
Flap Angle (degrees)
5 10 15 20 25
Constant Angle of Attack Constant Angle of Attack

Virginia Tech 21 of 59
What is the Flap Angle?
• Angle formed between the flap chord and the wing chord
• Flaps are used to increase lift (but they increase drag too!) during takeoff and landing maneuvers
• Flaps reduce the stalling speed of the aircraft
Wing cross section(cruise condition)
Wing cross section(landing and takeoff)
Flap angle
Virginia Tech 22 of 59
Remarks About Aerodynamic Coefficients
• An increase in flap angle increases both and . However, these increments are not linear and consequently are more difficult to interpret
• Increasing the flap angle increases and thus reduces the lift-off speed required for takeoff due to an increase in the lifting force generated (See Equation 2.3 and replace V1 by V).
• Increments in flap angle increases the value of more rapidly which tends to reduce more drastically the acceleration of the aircraft on the runway thus increasing the runway length necessary to reach the lift off speed
CL CD
δ f( ) CL
CD

Virginia Tech 23 of 59
Remarks
• The mass of the aircraft affects its acceleration (according to Newton’s second law).
- Larger takeoff masses produce corresponding increments in the runway length requirement.
• The density of the air, decreases with altitude - Lower thrust generation capability at high airfield elevations- The runway length increases as the field elevation increases - The density also affects the second and third terms in Equation 2.10
(less drag at higher altitude)
ρ
Virginia Tech 24 of 59
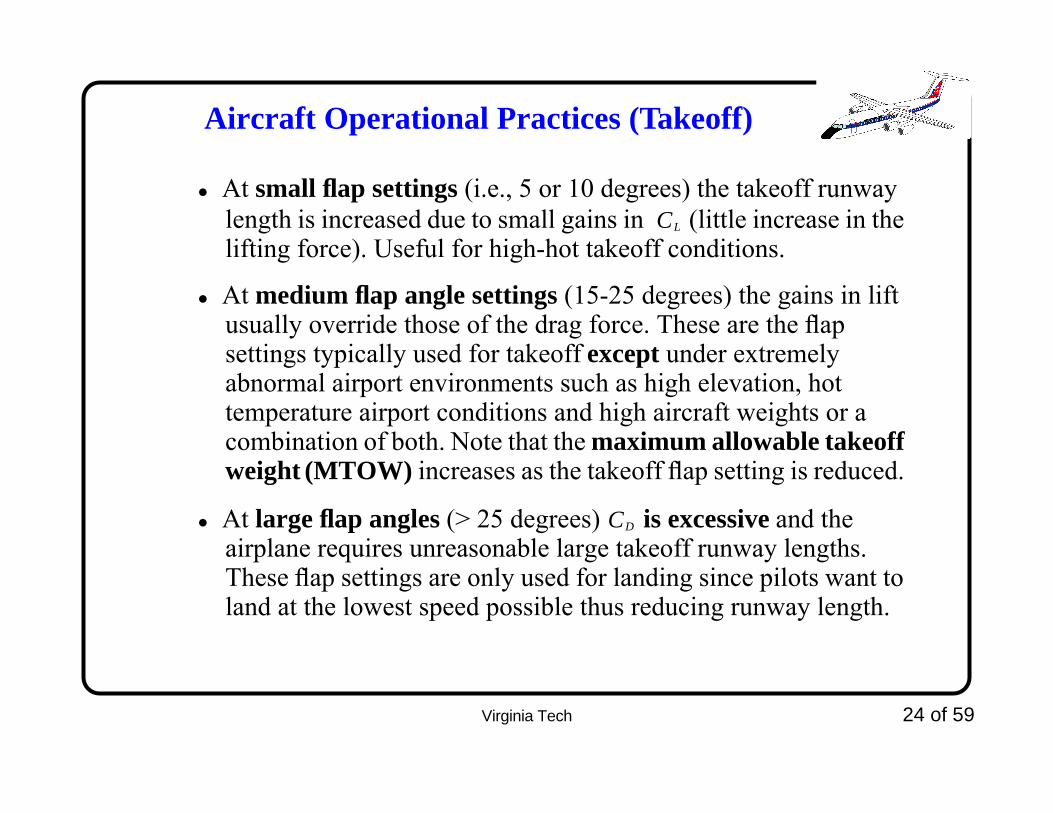
Aircraft Operational Practices (Takeoff)
• At small flap settings (i.e., 5 or 10 degrees) the takeoff runway length is increased due to small gains in (little increase in the lifting force). Useful for high-hot takeoff conditions.
• At medium flap angle settings (15-25 degrees) the gains in lift usually override those of the drag force. These are the flap settings typically used for takeoff except under extremely abnormal airport environments such as high elevation, hot temperature airport conditions and high aircraft weights or a combination of both. Note that the maximum allowable takeoff weight (MTOW) increases as the takeoff flap setting is reduced.
• At large flap angles (> 25 degrees) is excessive and the airplane requires unreasonable large takeoff runway lengths. These flap settings are only used for landing since pilots want to land at the lowest speed possible thus reducing runway length.
CL
CD

Virginia Tech 25 of 59
Application of Equations of Motion to Takeoff Runway Length Requirements
• Equation 2.9 describes the motion of an air vehicle as it accelerates on a runway from an initial speed Vo to a final liftoff speed
• This equation can be theoretically integrated twice with respect to time to obtain the distance traveled from a starting point to the point of liftoff
• With a little more effort we could also predict the distance required to clear a 35 ft. obstacle as required by Federal Aviation Regulations Part 25 or 23 that sets airworthiness criteria for aircraft in the U.S.
• Airport engineers use tabular or graphical data derived from this integration procedure
V lof

Airport Planning and Design (Antonio A. Trani)
Practical Example for Commercial Transport
• Consider the effects of airport elevation in the runway performance of a Boeing 737-800 aircraft
• Engines are GE/Snecma CFM56-7B24/-7B26/-7B27 producing 26,000 lb of thrust
• See Boeing document D6-58325-6: at
• http://www.boeing.com/commercial/airports/737.htm
25a

Airport Planning and Design (Antonio A. Trani)
Identify the Aircraft• Twin engine commercial airliner
• Two emergency exits over the wing
• Some versions have winglets
25b

Airport Planning and Design (Antonio A. Trani)
Sample Performance Chart - Boeing 737-800
source: Boeing (2011)Takeoff Runway Length
ISA Conditions25c

Airport Planning and Design (Antonio A. Trani)
Practical Example - Boeing 737-800
• International Standard Atmosphere (ISA) conditions (see ISA table)
25d
155,000
140,000
0 3000 6000 9000 12000
8100
11500
4950
5900
Sea Level 8000 ft Elevation
F.A.R Takeoff Runway Length (feet)
Take
off W
eigh
t (lb
)
Airport Planning and Design (Antonio A. Trani)
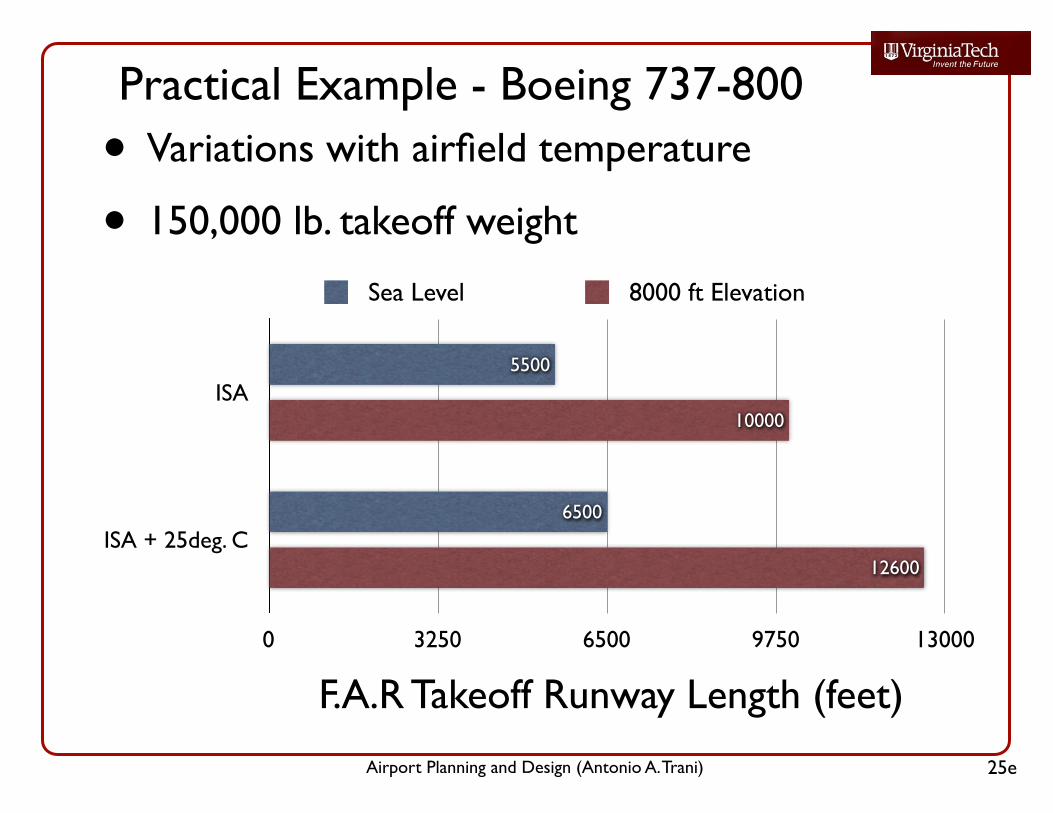
Practical Example - Boeing 737-800
• Variations with airfield temperature
• 150,000 lb. takeoff weight
25e
ISA
ISA + 25deg. C
0 3250 6500 9750 13000
12600
10000
6500
5500
Sea Level 8000 ft Elevation
F.A.R Takeoff Runway Length (feet)
Airport Planning and Design (Antonio A. Trani)
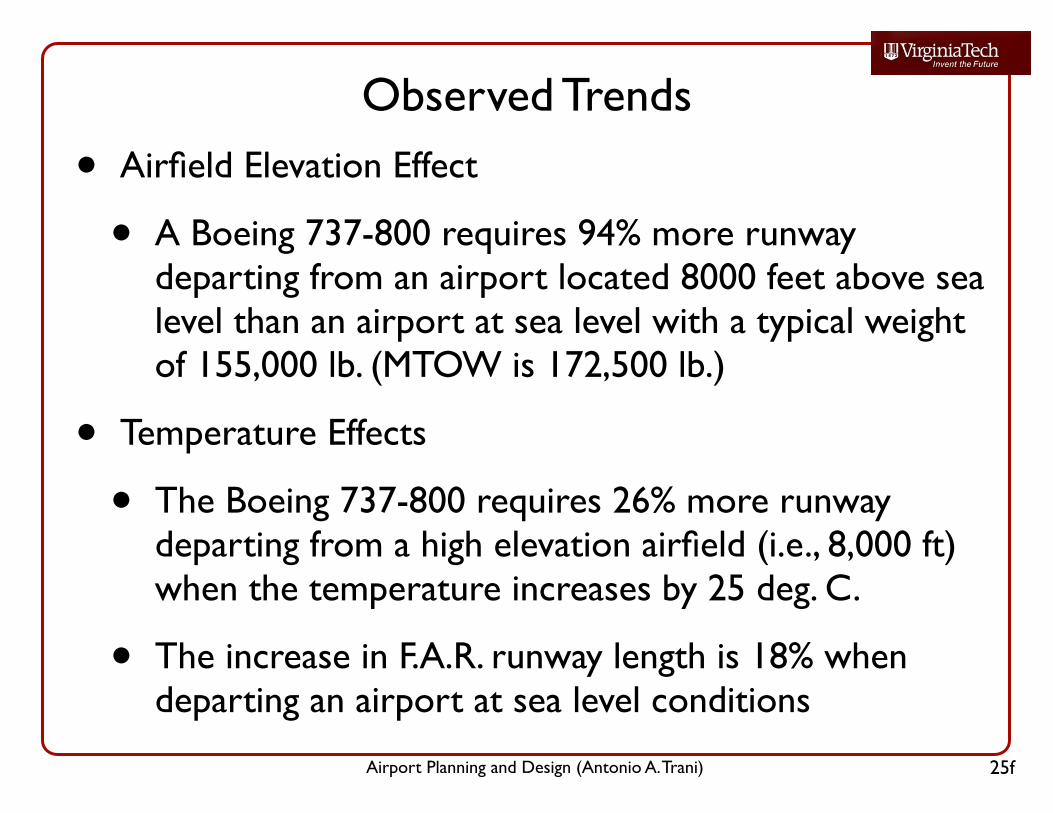
Observed Trends
• Airfield Elevation Effect
• A Boeing 737-800 requires 94% more runway departing from an airport located 8000 feet above sea level than an airport at sea level with a typical weight of 155,000 lb. (MTOW is 172,500 lb.)
• Temperature Effects
• The Boeing 737-800 requires 26% more runway departing from a high elevation airfield (i.e., 8,000 ft) when the temperature increases by 25 deg. C.
• The increase in F.A.R. runway length is 18% when departing an airport at sea level conditions
25f

Virginia Tech 26 of 59
A Word on Stalling and Lift-off Speeds
The stalling speed can be estimated from the basic lift equation
Under steady flight conditions so,
define as the maximum attainable lift coefficient, then
L12---ρV 2SC L=
L mg≅
V2mgρSC L
-------------=
CLmax
V stall2mg
ρSC Lmax
------------------=

Virginia Tech 27 of 59
FAR Regulation Principles
Regulations (FAR 25) specify that:
• Aircraft should lift off at 10% above the stalling speed ( )
• Aircraft climb initially at 20% above the stalling speed ( )
• Aircraft speed during a regular approach be 30% above the stalling speed ( )
• During takeoff aircraft should clear an imaginary 11 m (35 ft.) obstacle
• During landing aircraft should cross the runway threshold 15 m (50 ft.) above ground)
These considerations are necessary to estimate takeoff and landing distances (and thus size runway lenghts)
V lof
V 2
V app

Virginia Tech 28 of 59
Integration of Equation 2.9
First obtain the aircraft speed at time ,
(2.11)
Now get the distance traveled,
(2.12)
t
V t
1m---- T( V( ρ ) 1
2---ρV 2S C( L f roll CD )– mg froll )–+, td
V o
V lof
∫=
S t
S t V t tdo
Dlof
∫=

Virginia Tech 29 of 59
Sample Results (Boeing 727-200 Data)
The following results apply to a medium-size transport aircraft
Figure 2.4 Sensitivity of Aircraft Acceleration vs. Field Elevation.
0 10 20 30 40 501
1.5
2
2.5
3
Roll Time (s)
Sea Level
1250 m
2500 m
Virginia Tech 30 of 59
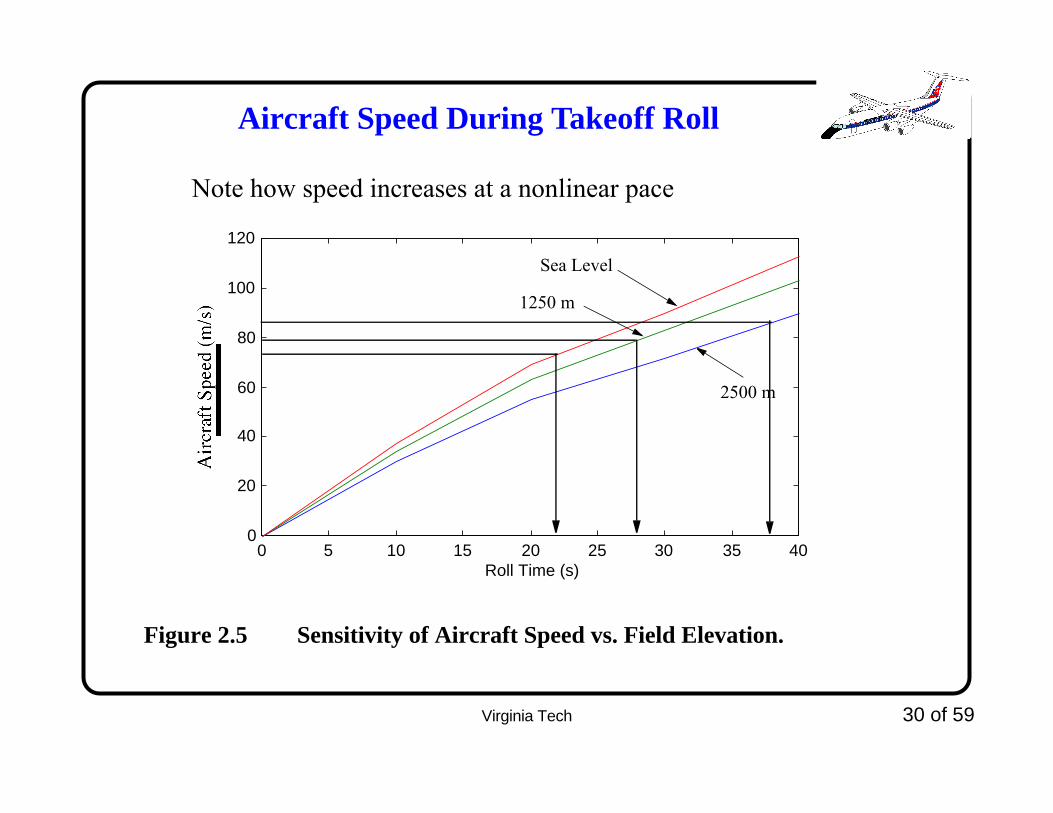
Aircraft Speed During Takeoff Roll
Note how speed increases at a nonlinear pace
Figure 2.5 Sensitivity of Aircraft Speed vs. Field Elevation.
0 5 10 15 20 25 30 35 400
20
40
60
80
100
120
Roll Time (s)
Sea Level
1250 m
2500 m

Virginia Tech 31 of 59
Distance Traveled During the Takeoff Roll
Figure 2.6 Lift-Off Distance vs. Field Elevation.
0 10 20 30 40 500
500
1000
1500
2000
2500
3000
3500
Roll Time (s)
Sea Level
1250 m
2500 m

Virginia Tech 32 of 59
Takeoff Roll Distance vs. Aircraft Mass
Figure 2.7 Lift Off Distance vs. Aircraft Weight.
0 5 10 15 20 25 30 35 40 450
500
1000
1500
2000
2500
3000
3500
Roll Time (s)
DTW = 60,000 kg
DTW = 66,000 kg
DTW = 72,000 kg
2500 m. Field Elevation
Virginia Tech 33 of 59
General Federal Aviation Regulation Criteria to Develop Runway Length
Requirements at Airports

Virginia Tech 34 of 59
General Procedure for Runway Length Estimation (Runway Length Components)
Runways can have three basic components:
• Full strength pavement (FS)
• Clearways (CL)
• Stopways (SW)
Full strength pavement should support the full weight of the aircraft
Clearway is a prepared area are beyond FS clear of obstacles (max slope is 1.5%) allowing the aircraft to climb safely to clear an imaginary 11 m (35’ obstacle)
Stopway is a paved surface that allows and aircraft overrun to take place without harming the vehicle structurally (cannot be used for takeoff)

Virginia Tech 35 of 59
Runway Components
Each runway end will have to be considered individually for runway length analysis
Clearway (CL)
Stopway (SW)
Full Strength Pavement (FS)
Virginia Tech 36 of 59
FAR Certification Procedures
FAR 25 (for turbojet and turbofan powered aircraft) consider three cases in the estimation of runway length performance
• Normal takeoff (all engines working fine)
• Engine-out takeoff condition- Continued takeoff- Aborted takeoff
• Landing
All these cases consider stochastic variations in piloting technique (usually very large for landings and smaller for takeoffs)
Regulations for piston aircraft do not include the normal takeoff case (an engine-out condition is more critical in piston-powered aircraft)

Virginia Tech 37 of 59
Nomenclature
FL = field length (total amount of runway needed)
FS = full strength pavement distance
CL = clearway distance
SW = stopway distance
LOD = lift off distance
TOR = takeoff run
TOD = takeoff distance
LD = landing distance
SD = stopping distance
D35 = distance to clear an 11 m (35 ft.) obstacle

Virginia Tech 38 of 59
Landing Distance Case
The landing distance should be 67% longer than the demonstrated distance to stop an aircraft
Large landing roll variations exist among pilots
Example touchdown point variations (µ=400 m, σ=125 m for Boeing 727-200 landing in Atlanta)
15 m (50 ft)
LD
SD
LD = 1.667 * SDFSland = LD

Virginia Tech 39 of 59
Normal Takeoff Case
The Takeoff Distance (TOD) should be 115% longer than the demonstrated Distance to Clear an 11m (35 ft.) obstacle (D35)
11 m (35 ft)
D35n
LODn
TODn = 1.15 * D35n
Clearway
1.15 LODn
TODn - 1.15 LODn
CLn = 1/2 (TOD-1.15 LOD)
CLn
TORn = TODn - CLnFSn = TORnFLn = FSn + CLn
Relationships

Virginia Tech 40 of 59
Engine-Out Takeoff Case
Dictated by two scenarios:
Continued takeoff subcase
• Actual distance to clear an imaginary 11 m (35 ft) obstacle D35 (with an engine-out)
Aborted or rejected takeoff subcase
• Distance to accelerate and stop (DAS)
Note: no correction is applied due to the rare nature of engine-out conditions in practice for turbofan/turbojet powered aircraft

Virginia Tech 41 of 59
Engine-Out Analysis
11 m (35 ft)
D35eo
LODeo
Clearway
D35eo - LODeo
Stopway
CLeo = 1/2 (D35eo-LODeo)
DAS
V1 = decision speed
TODeo = D35eo
FSeo-c = TOReo
TOReo = D35eo - CLeo
Continued Takeoff
FSeo-a = DAS - SWAborted Takeoff
FLeo-a = FSeo-a + SW FLeo-c = FSeo-c + CLeo
Virginia Tech 42 of 59
Runway Length Estimation According to FAA AC 150/5325-4

Virginia Tech 43 of 59
Runway Length Procedures (AC 150/5325-4)
Two different views of the problem:
• For aircraft with MTOW up to 27,200 kg (60,000 lb.) use the aircraft grouping procedure
- If MTOW is less than 5,670 kg use Figures 2-1 and 2-2 in FAA AC 150/5325-4
- If MTOW is > 5,670 kg but less than 27,200 kg use Figures 2-3 and 2-4 provided in Chapter 2 of the AC 150/5325-4
• For aircraft whose MTOW is more than 27,200 kg (60,000 lb.) use the critical aircraft concept
- The critical aircraft is that one with the longest runway performance characteristics
- This aircraft needs to be operated 250 times in the year from that airport
Review some examples

Virginia Tech 44 of 59
Advisory Circular 150/5325-4

Virginia Tech 45 of 59
Contents of Advisory Circular 150/5325-4
Be familiar with all items contained in FAA AC 150/5325-4
• Chapter 1 - Introduction (background)
• Chapter 2 - Runway length design based on aircraft groupings
• Chapter 3 - Runway length design for specific aircraft- Aircraft performance curves- Aircraft performance tables
• Chapter 4 - Design rationale- Airport temperature and elevation- Wind and runway surface- Difference in runway centerline elevations
• NOTE: The runway length procedure using declared the distance concept is outlined in FAA AC 150/5300-13
Virginia Tech 46 of 59
Advisory Circular 150/5325-4
The following examples illustrates the use of Figures 2-1 through 2-4 in AC 150/5325-4
• These procedures apply to a collection of aircraft (a group of aircraft)
• The process requires correction of runway length due to runway slope and wet pavement conditions
- Wet pavement correction is critical for landing aircraft- Runway gradient (or slope) is critical for departing aircraft- Apply the largest correction possible

Airport Planning and Design (Antonio A. Trani)
Runway Length for Aircraft Weights less than 12,500 lb. (5670 kg)
• Refer to Chapter 2 of the FAA AC 150/5235-4b
• This group of aircraft includes all single and twin engine piston powered aircraft
• Also included are twin and single engine turboprop aircraft used for business
47

Airport Planning and Design (Antonio A. Trani)
Runway Length for Small Airplanes with Fewer than 10 Seats
47a
Figure 2.1 in FAA AC/150/5325-4b
• Required inputs:
• Airfield elevation
• Percent of fleet served
• Mean daily maximum temperature of the hottest month of the year

Airport Planning and Design (Antonio A. Trani)
Deciding on the Aircraft Population in Runway Design (for Small Aircraft with fewer than 10
seats)
47b
• 95% of the fleet
• Small and medium size population communities
• Low-activity airports
• 100% of the fleet
• Communities near metropolitan areas
• Large population remote from a metropolitan area

Virginia Tech 48 of 59
Example # 1 AC 150/5325-4
Suppose we want to size a runway for a small general aviation airport serving all (i.e.,100%) single engine aircraft (MTOW < 5,670 kg)
• The airport is to be located on a plateau 915 m. above sea level
• The proposed airport site has a mean daily maximum temperature of the hottest month of 24 oC (75 oF)
Solution:
Using Figure 2-1 in AC 150/5325-4 we obtain:
RL = 4,600 ft. (or 1,403 m.)

Airport Planning and Design (Antonio A. Trani)
Runway Length Curves for Small Airplanes with 10 or more Seats (excludes Pilot and Co-Pilot)
48a
Figure 2.2 in FAA AC/150/5325-4b
• Required inputs:
• Airfield elevation
• Mean daily maximum temperature of the hottest month of the year

Airport Planning and Design (Antonio A. Trani)
Representative Aircraft for Figure 2.2
48b
Raytheon King Air B300
Mitsubishi MU-2L
Swearinger Merlin III-A

Airport Planning and Design (Antonio A. Trani)
Runway Length for Aircraft Weights Greater than 12,500 lb (5670 kg)and up
to 60,000 lb (27,200 kg)
• Refer to Chapter 3 of the FAA AC 150/5235-4b
• This group of aircraft includes large business jets and small regional turboprops
• Regional jets are not included in this procedure
49

Airport Planning and Design (Antonio A. Trani)
Figure 3.1 in FAA AC 5325-4b
49a

Airport Planning and Design (Antonio A. Trani)
Figure 3.2 in FAA AC 5325-4b
49b
Virginia Tech 51 of 59
Correction Factors to the Grouping Method
1) Difference in Centerline Elevations
• Increase at a rate of 3 m. (10 ft.) for every 0.3 m. (1 ft.) of elevation difference between the high and low points of the runway centerline
2) Wet and Slippery Runways
• Runway lengths taken from 60% useful load curves are increased by 15%, or up to 1,680m. (5,500 ft.), whichever is less
• Runway lengths obtained from the 90% useful load curves are increased by 15%, or up to 2,130 m. (7,000 ft.), whichever is less.
Virginia Tech 52 of 59
Important Note about the Grouping Method Analysis
High Altitude Locations
• For airport elevations above 1,500 m. (5,000 ft.) the runway length requirements for aircraft with MTOW < 5,670 kg. may be greater than those required for turbofan powered aircraft.
This is the result of a higher engine performance degradation on piston-powered aircraft with altitude

Virginia Tech 53 of 59
Specific Aircraft Methods
Several sources of information exist to size runway lengths for specific aircraft
• Individual aircraft performance charts and tables contained in Advisory Circular 150/5325-4
• Individual aircraft performance charts contained in the aircraft manufacturer documents for airport design
• Individual aircraft performance charts contained in the aircraft flight manual and maintained by the airline
Any one of these sources should be consulted when estimating runway lengths for the critical aircraft
NOTE: the critical aircraft operates at least 250 times in a year from the airport in question
Virginia Tech 54 of 59
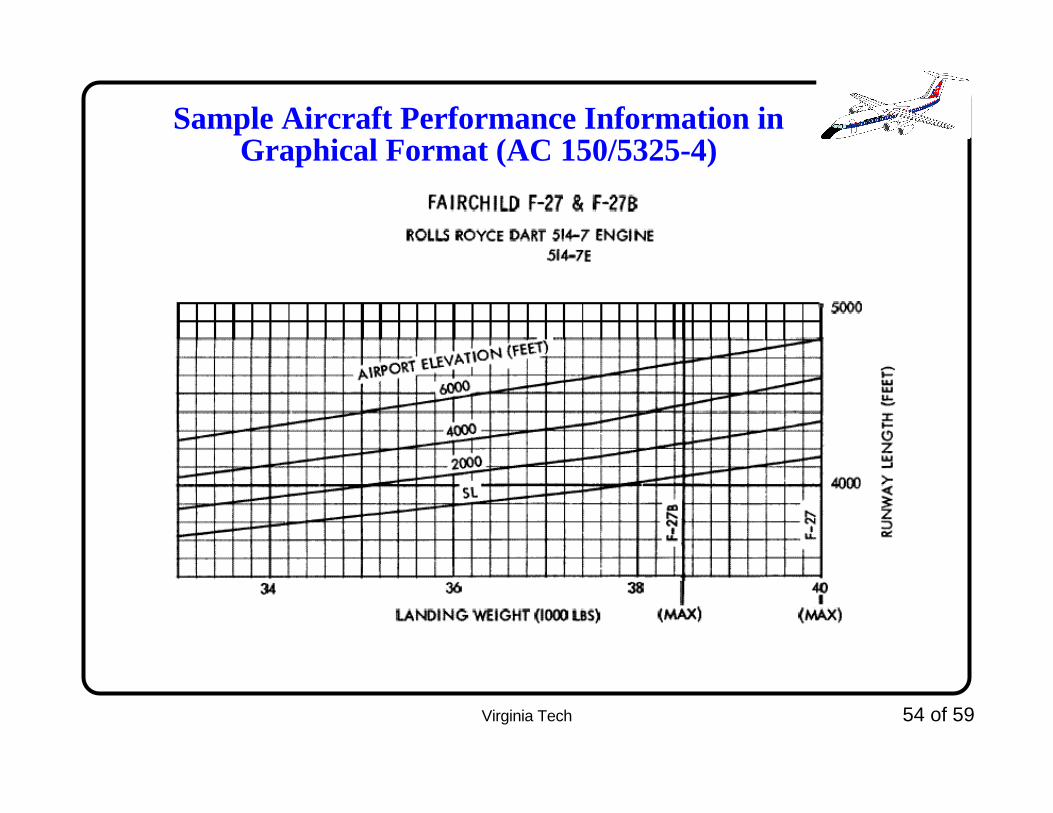
Sample Aircraft Performance Information in Graphical Format (AC 150/5325-4)

Virginia Tech 55 of 59
Another Example of Aircraft Performance Information in Graph Format (AC 150/5325-4)
Douglas DC-9-30 aircraft
Virginia Tech 56 of 59
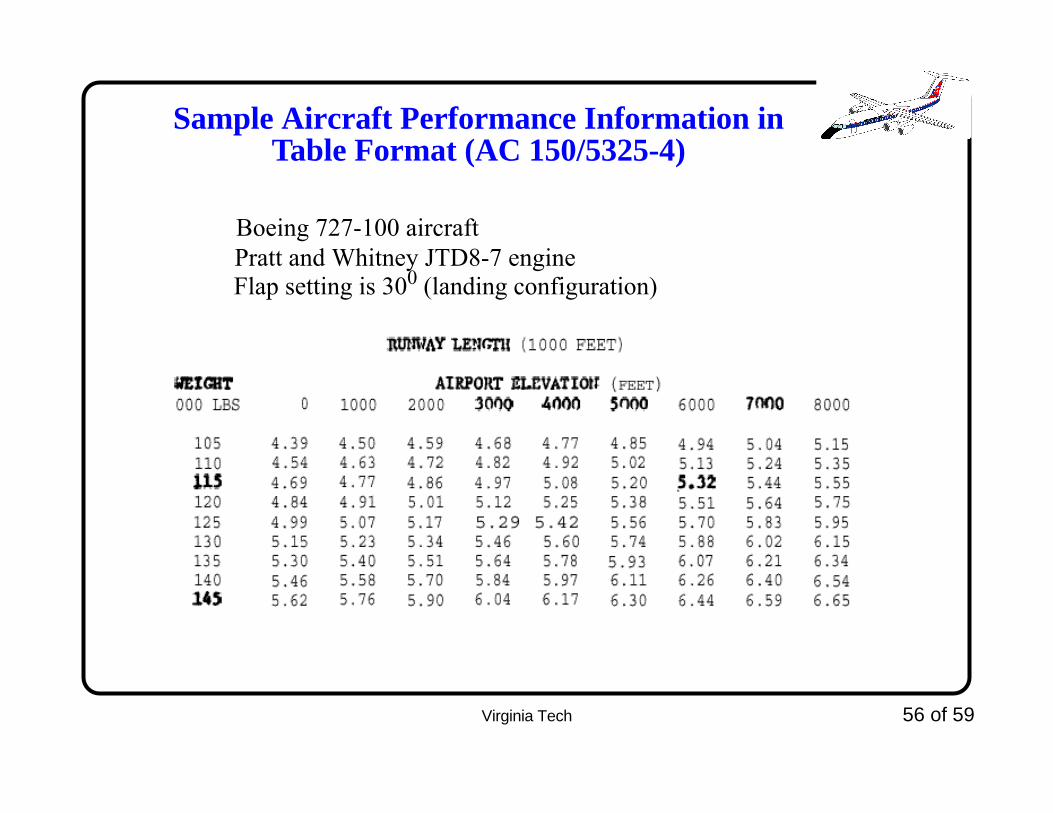
Sample Aircraft Performance Information in Table Format (AC 150/5325-4)
Boeing 727-100 aircraft Pratt and Whitney JTD8-7 engineFlap setting is 300 (landing configuration)

Virginia Tech 57 of 59
Sample Aircraft Performance Information in Graphical Format (Aircraft Manufacturer)
Boeing 777-300 aircraft
Virginia Tech 58 of 59
Few Observations About AC 150/5325-4 Tables and Charts
• Many aircraft performance charts contained in AC 150/5325-4 belong to aircraft that no longer fly in NAS (in the U.S.). Example: Douglas DC-4, Convair 990, etc.
• However, some of these aircraft still fly in other countries so the charts have been left in the AC for completeness

Virginia Tech 59 of 59
Correction Factors for AC 150/5325-4 and Specific Aircraft Performance Method
1) Difference in Centerline Elevations
• Increase at a rate of 3 m. (10 ft.) for every 0.3 m. (1 ft.) of elevation difference between the high and low points of the runway centerline
2) Wet and Slippery Runways
• Runway lengths contained in performance tables account for wet and slippery runways
• Runway lengths charts in Appendix 2 do not account for wet and slippery runways so correction is needed for landing computations (increase by 7% only because a 5-knot tailwind condition is factored in these curves already)