aircraft observations of enhancement and depletion of black … · 2016-01-11 · correspondence...
TRANSCRIPT

Atmos. Chem. Phys., 10, 9667–9680, 2010www.atmos-chem-phys.net/10/9667/2010/doi:10.5194/acp-10-9667-2010© Author(s) 2010. CC Attribution 3.0 License.
AtmosphericChemistry
and Physics
Aircraft observations of enhancement and depletion of black carbonmass in the springtime Arctic
J. R. Spackman1,2, R. S. Gao1, W. D. Neff3, J. P. Schwarz1,2, L. A. Watts1,2, D. W. Fahey1,2, J. S. Holloway1,2,T. B. Ryerson1, J. Peischl1,2, and C. A. Brock1
1National Oceanic and Atmospheric Administration, Earth System Research Laboratory, Chemical Sciences Division,Boulder, Colorado, USA2Cooperative Institute for Research in Environmental Sciences, University of Colorado, Boulder, Colorado, USA3National Oceanic and Atmospheric Administration, Earth System Research Laboratory, Physical Sciences Division,Boulder, Colorado, USA
Received: 29 May 2010 – Published in Atmos. Chem. Phys. Discuss.: 21 June 2010Revised: 24 September 2010 – Accepted: 27 September 2010 – Published: 12 October 2010
Abstract. Understanding the processes controlling blackcarbon (BC) in the Arctic is crucial for evaluating the impactof anthropogenic and natural sources of BC on Arctic cli-mate. Vertical profiles of BC mass loadings were observedfrom the surface to near 7-km altitude in April 2008 usinga Single-Particle Soot Photometer (SP2) during flights onthe NOAA WP-3D research aircraft from Fairbanks, Alaska.These measurements were conducted during the NOAA-sponsored Aerosol, Radiation, and Cloud Processes affect-ing Arctic Climate (ARCPAC) project. In the free tropo-sphere, the Arctic air mass was influenced by long-rangetransport from biomass-burning and anthropogenic sourceregions at lower latitudes especially during the latter part ofthe campaign. Average BC mass mixing ratios peaked atabout 150 ng BC (kg dry air )−1 near 5.5 km altitude in theaged Arctic air mass and 250 ng kg−1 at 4.5 km in biomass-burning influenced air. BC mass loadings were enhanced byup to a factor of 5 in biomass-burning influenced air com-pared to the aged Arctic air mass. At the bottom of some ofthe profiles, positive vertical gradients in BC were observedover the sea-ice. The vertical profiles generally occurred inthe vicinity of open leads in the sea-ice. In the aged Arctic
Correspondence to:J. R. Spackman([email protected])
air mass, BC mass loadings more than doubled with increas-ing altitude within the ABL and across the boundary layertransition while carbon monoxide (CO) remained constant.This is evidence for depletion of BC mass in the ABL. BCmass loadings were positively correlated with O3 in ozonedepletion events (ODEs) for all the observations in the ABL.Since bromine catalytically destroys ozone in the ABL afterbeing released as molecular bromine in regions of new sea-ice formation at the surface, the BC–O3 correlation suggeststhat BC particles were removed by a surface process suchas dry deposition. We develop a box model to estimate thedry deposition flux of BC mass to the snow constrained bythe vertical profiles of BC mass in the ABL. Open leads inthe sea-ice may increase vertical mixing and entrainment ofpollution from the free troposphere possibly enhancing thedeposition of BC aerosol to the snow.
1 Introduction
Black carbon (BC) in the Arctic directly contributes to re-gional climate change through radiative heating of the atmo-sphere and warming at the snow surface due to absorptionof incoming solar shortwave radiation (Shindell and Falu-vegi, 2009; McConnell et al., 2007; Hansen and Nazarenko,2004). Despite the dimming caused by the absorption of
Published by Copernicus Publications on behalf of the European Geosciences Union.

9668 J. R. Spackman et al.: Observations of black carbon mass in the springtime Arctic
solar radiation by BC aerosol aloft, BC deposited in snow hasbeen shown to exacerbate Arctic warming through the snowalbedo effect, a process whereby surface warming causessnow and ice removal leading to a decrease in the surfacealbedo that triggers additional warming (Flanner et al., 2007,2009). The fourth assessment of the Intergovernmental Panelon Climate Change (IPCC) reported that BC in snow ac-counts for a forcing of 0.1 W m−2 with a factor of two inuncertainty (IPCC, 2007). Measurements of BC aerosol inthe Arctic troposphere are both limited and needed to con-strain transport and microphysics in global aerosol models,evaluate climate impacts, and develop mitigation strategies(Koch et al., 2009; Shindell et al., 2008).
Enhancements of BC and other tracers of pollution havebeen observed for decades in the Arctic troposphere in thewinter and early spring (Sturges, 1991; Hansen and Novakov,1989; Sharma et al., 2006; Law and Stohl, 2007; Koch et al.,2009). These enhancements emerge from the chemistry anddynamics unique to high latitudes at this time of year. In thewinter and early spring, the colder temperatures and weakersolar insolation lead to stratification in the Arctic tropospherethat inhibits precipitating cloud formation and, hence, thewet removal of aerosols. The weaker insolation and coldertemperatures also slow down the photochemistry and reac-tion rates that govern the chemical tracer abundances. Asa result, aerosols and tracers are generally longer lived inthe Arctic in winter and early spring than at other times ofthe year.
Most of the BC aerosol in the Arctic troposphere is pro-duced from incomplete fossil-fuel and biomass-burning com-bustion processes at lower latitudes and transported into theArctic along isentropic surfaces (Stohl, 2006). Some mod-eling studies suggest anthropogenic sources from Europeand Asia maintain the enhanced level of pollution at north-ern high latitudes often referred to as Arctic haze (Quinnet al., 2007; Koch and Hansen, 2005). A number of otherworks have shown how transport of biomass-burning plumesfrom agricultural and forest fires at midlatitudes contributeto Arctic haze particularly in spring (Saha et al., 2010;Warneke et al., 2009; Generoso et al., 2007). The parti-tioning of anthropogenic and biomass-burning influenced airmasses in the springtime Arctic largely depends on interan-nual variability in biomass burning at northern midlatitudes(Warneke et al., 2010).
BC mass is observed in snow at sites throughout northernhigh latitudes (Hegg et al., 2010, 2009; Doherty et al., 2010).The seasonally enhanced BC mass loadings in the Arctic tro-posphere may lead to increased wet and dry deposition of BCaerosol to the snow or ice through precipitation scavengingand direct contact with the snow or ice surface, respectively.The mixing state of BC (e.g., Schwarz et al., 2008; Shiraiwaet al., 2007; Jacobson, 2001) may be an important aspect inthe wet removal of BC particles because they are aged andmixed with hydrophilic materials such as sulfate in the Arctic(McNaughton et al., 2010). However, dry removal may play
a more important role than wet removal in depositing BC par-ticles to the snow because of limited precipitation scavengingin the Arctic in winter and spring (Brock et al., 2010). Atmo-spheric perturbations that facilitate the mixing of BC fromthe free troposphere into the Arctic boundary layer (ABL),such as through open leads (Serreze et al., 1992; Andreasand Murphy, 1986) or enhanced vertical wind shear, mightlead to increased dry deposition of BC aerosol to the snow(Strunin et al., 1997).
Here we present vertical profiles of BC mass in the tro-posphere in the springtime Arctic using data from a Single-Particle Soot Photometer (SP2) to measure the refractorymass of individual BC particles. We first show enhance-ments of BC mass in the free troposphere in biomass-burningplumes relative to the aged Arctic air mass and then focuson the observed depletions of BC mass in the ABL over thesea-ice and open leads north of Alaska. We present the cor-relations between simultaneous measurements of BC mass,carbon monoxide (CO) and ozone (O3) in the ABL to exam-ine the processes controlling the removal of BC. Lastly, weuse a simple box model constrained by the observed verticalprofiles of BC to bound the flux of BC from the free tropo-sphere to the snow or ice surface.
2 Aircraft measurements
The NOAA WP-3D research aircraft was deployed to Fair-banks, Alaska (65◦ N, 148◦ W) in April 2008 for the Aerosol,Radiation, and Cloud Processes affecting Arctic Climate(ARCPAC) campaign (Brock et al., 2010). ARCPAC oc-curred during POLARCAT as part of the International Po-lar Year (IPY) research activities in the Arctic. POLARCATis the Polar Study using Aircraft, Remote Sensing, SurfaceMeasurement and Models, of Climate, Chemistry, Aerosols,and Transport. We present measurements of BC mass load-ings, CO, O3, and meteorological parameters from 5 flightsin the Arctic, 12–21 April 2008, spanning 0.1–7.4 km in al-titude, 65–75◦ N in latitude, and 126–165◦ W in longitude(Fig. 1). All of the flights were 7.5 to 9 h in duration and oc-curred during daylight hours. The aircraft probed the ABLmostly over the ice and open leads north of Alaska for a to-tal ∼7 h in duration. The ABL is defined in this work asthe surface layer, typically characterized by a temperatureinversion, over the sea-ice and open leads up to about 300 maltitude based on the temperature profiles from the WP-3D.This layer generally appears consistent in depth and inversionstrength with temperature soundings over the pack ice in thecentral Arctic north of Alaska (Tjernstrom and Graversen,2009). The free troposphere refers to the region immediatelyabove the ABL.
The SP2 measures the refractory BC mass in individualBC-containing particles using laser-induced incandescence,whereby the BC fraction is heated to its boiling point and thethermal radiation, or incandescence, emitted by the intensely
Atmos. Chem. Phys., 10, 9667–9680, 2010 www.atmos-chem-phys.net/10/9667/2010/

J. R. Spackman et al.: Observations of black carbon mass in the springtime Arctic 9669
Fig. 1. The ARCPAC flight tracks for the data presented in thiswork (image courtesy of K. Aikin). The campaign was based fromFairbanks, Alaska (65◦ N, 148◦ W).
hot material is detected (Schwarz et al., 2006). The measure-ment of refractory mass is continuous, BC-specific, propor-tional to the incandescence signal, and independent of parti-cle mixing state and morphology (Slowik et al., 2007). BCmass loading is reported as a mass mixing ratio in ng BC(kg dry air)−1. For the data presented here, the SP2 detectedBC core sizes in the range of 0.090 to 0.600 µm volume-equivalent diameter (VED), based on a void-free density of2 g cm−3 for ambient BC aerosol. This assumed density doesnot affect any results in this work except the VED in the con-structed size distributions. This size range includes∼90%of the BC mass and∼50% of the number of BC particlesassuming a lognormal distribution of BC mass in the finemode peaked near 0.200 µm (Schwarz et al., 2006). The mea-sured BC mass mixing ratios reported in this work have beenmultiplied by 1.1 to account for the unmeasured mass out-side the SP2 detection range. However, this may introducea small error (<10%) to the reported BC mass mixing ra-tios due to variability in the mode of the size distributions.Flight data from the PALMS instrument, a single-particlelaser mass spectrometer, indicating cloud contamination ofits aerosol inlet (Froyd et al., 2010) were used to remove theSP2 data acquired in clouds. The uncertainty of the reportedBC mass loadings during ARCPAC is approximately 40% at-tributed primarily to uncertainty in BC mass calibration witha lesser contribution from sample flow uncertainty.
The SP2 sampled ambient aerosol behind a 1 µm particleimpactor through a low-turbulence inlet (LTI) (Brock et al.,2004; Wilson et al., 2004). The sampling inlet was designedand mounted to the aircraft in a manner to sample the am-bient air stream without contamination from the boundarylayer along the skin of the aircraft. To ensure no particlelosses during sampling, an intercomparison was performedbetween aerosol instruments sampling off the LTI. For vari-ous test aerosols introduced, good agreement between the in-struments at their different sampling points along the sampleline indicated minimal aerosol losses during transport alongthe sample tubing.
In situ measurements of CO were acquired at 1 Hz by avacuum ultraviolet resonance fluorescence instrument withan uncertainty of±5% (Holloway et al., 2000). O3 was mea-sured with a NO-induced chemiluminescence technique withan estimated uncertainty of±(0.05 ppb + 4%) for the 1-Hzdata (Ryerson et al., 1998).
3 Observations of BC mass loadings in theArctic troposphere
Airborne BC measurements in the Arctic troposphere werelimited prior to the POLARCAT campaigns in 2008 and con-sisted mostly of filter-based absorption techniques samplingbulk aerosol (Hansen and Rosen, 1984; Hansen and No-vakov, 1989). In addition to the measurements presentedin this work, two other SP2 instruments aboard the NASADC-8 and P3-B research aircraft collected single-particle BCdata in spring 2008 during the NASA-sponsored Arctic Re-search of the Composition of the Troposphere from Aircraftand Satellites (ARCTAS) campaign (Jacob et al., 2010). TheNASA aircraft sampled biomass-burning plumes less fre-quently than the NOAA WP-3D. Also, the NOAA WP-3Dprobed the ABL around open leads north of Alaska for alonger time than either NASA aircraft that sampled a largergeographical area of the Arctic. The SP2 measurements ofBC mass loadings generally agreed to within stated uncer-tainties during wingtip-to-wingtip intercomparisons betweenthe NOAA and NASA aircraft (G. Chen, private communi-cation, 2009). The Arctic vertical profiles from all the SP2measurements are shown in the context of a measurement-model intercomparison in Fig. 10 of Koch et al. (2009).
3.1 Enhancement of BC mass in the free troposphere
The observed vertical profiles of BC mass loadings from 5flights in the Arctic are shown in Fig. 2. The data pointsare 30 s averages with a horizontal spatial resolution of3 km. The data in blue were collected on the 12 April 2008flight in the aged Arctic air mass and the data in red wereacquired on 4 flights (15–21 April) in air strongly influ-enced by long-range biomass-burning plumes. For simplic-ity, we classify the air mass types by flight date since a
www.atmos-chem-phys.net/10/9667/2010/ Atmos. Chem. Phys., 10, 9667–9680, 2010

9670 J. R. Spackman et al.: Observations of black carbon mass in the springtime Arctic
Fig. 2. Vertical profiles of BC mass mixing ratio for 5 flights inthe Arctic during ARCPAC and 16 flights at midlatitudes in east-ern Texas during the Texas Air Quality Study. The data in blue andred are from 1 flight in the aged Arctic air mass and 4 flights inlong-range biomass-burning plumes, respectively. The small dotsand line markers denote 30 s averages and 1 km mean values, re-spectively, of BC mass mixing ratio, except for the midlatitude datawhere 0.5 km averages are shown without the underlying 30 s data.The horizontal bars represent one standard deviation on both sidesof the mean but are only drawn on the positive side for visual clarity.
quantitative distinction is not important to the results in thiswork. We use the phrase, aged Arctic air, in a qualitativesense to exclude fresh pollution from sources inside and out-side the Arctic, such as biomass-burning plumes. The freetropospheric region sampled by the NOAA WP-3D aircraftwas frequently influenced by long-range biomass-burningplumes from southern Russia and southeast Siberia duringARCPAC after the 12 April flight (Warneke et al., 2009). Al-though the 15–21 April flights were influenced by biomass-burning, it is important to note the air sampled includes amixture of biomass-burning plumes and aged Arctic air.
For both types of air masses, the mean BC mass loadingsincrease with altitude in the springtime Arctic. Average BCmass mixing ratios peak at about 150 ng kg−1 near 5.5 kmaltitude in the aged Arctic air mass and over 250 ng kg−1 inbiomass-burning influenced air at 4.5 km. BC mass loadingsare enhanced by up to a factor of 5 in biomass-burning influ-enced air compared to the aged Arctic air mass. The BC massloadings in the middle troposphere are comparable to thoseobserved in the planetary boundary layer in a polluted urbanenvironment in the United States (Spackman et al., 2008).It is worth noting here that global aerosol models generallyunderestimate advection of BC or overestimate removal of
BC during transport to the Arctic (Koch et al., 2009). Whenplaced in a representative context, these important observa-tions can be used to apply bounds to physical processes inmodels.
The profiles obtained with the SP2 during ARCPAC gen-erally show lower BC mass loadings compared to thosefrom an aethalometer during the Arctic Gas and AerosolSampling Program (AGASP) conducted in the Alaskan Arc-tic (Schnell, 1984). Agreement between the AGASP andARCPAC data should not necessarily be expected because ofvariability in long-range transport and changes in BC emis-sions over time. The ARCPAC profiles show distinct en-hancements in BC mass in the middle and upper tropospherecompared to the lower troposphere unlike the compositeprofiles from AGASP-I (March 1983) and -II (April 1986)that indicate a polluted lower troposphere and decreasingBC mass loadings with increasing altitude. In summary,BC mass mixing ratios decreased from approximately 150–400 ng kg−1 at lower altitudes to 20–75 ng kg−1 at 8–10 km(Hansen and Novakov, 1989).
The ARCPAC profiles contrast with profiles at midlati-tudes (Spackman et al., 2008) and in the tropics (not shown)(Schwarz et al., 2008) where BC mass generally decreases by2 to 3 orders of magnitude from the surface to 5 km altitude,given by the black line in Fig. 2. These profiles may still beconsistent because the tropics and midlatitudes are linked tohigh latitudes by meridional exchange along isentropic sur-faces (Stohl, 2006; Quinn et al., 2007). Since an air parcel islofted in altitude as it is advected poleward, pollution in thelower troposphere at midlatitudes maps to the middle tropo-sphere at high latitudes in the absence of diabatic processesduring transport.
3.2 Depletion of BC mass in the ABL
Vertical profiles of BC mass and CO are shown in detail inFig. 3 for the lowest 2 km of the flight tracks displayed inFig. 1. Each flight includes one ascent profile from and onedescent profile into Fairbanks with local pollution influence,marked by the red points, with the normally observed de-crease in BC mass with increasing altitude above a pollutedboundary layer. The profiles denoted by the blue points aremostly north of Alaska over the ice and open leads. A largepositive but variable vertical gradient in BC mass was ob-served in the lowest few hundred meters over the ice andopen leads on several of the flights. BC mass mixing ratiosincrease by up to a factor of 6 from the minimum altitudeof the WP-3D in the ABL up to 750 m in the free tropo-sphere, observed on 12, 18, 21 April. Figure 3 is a com-posite of all the vertical profiles of BC and CO and offerssome indication of the persistence of the BC vertical gradi-ent during multiple profiles. These data include both spiraland slantwise flight profiles; the latter profiles may add hor-izontal variability to the results. While the WP-3D aircraftextensively sampled the ABL, there are limited profile data
Atmos. Chem. Phys., 10, 9667–9680, 2010 www.atmos-chem-phys.net/10/9667/2010/

J. R. Spackman et al.: Observations of black carbon mass in the springtime Arctic 9671
Fig. 3. Vertical profiles of BC mass loadings and CO in the lowest 2 km altitude for all the flights during ARCPAC. The BC and CO datapoints are 30 s and 1 s data, respectively. The blue points denote BC data over the ice and open leads north of Alaska and the red pointscorrespond to ascent/descent data at Fairbanks. The black lines with bars represent the mean BC profiles including the Fairbanks data withone standard deviation around the mean in each 200 m altitude bin.
between this layer and the free troposphere with widely vary-ing aerosol and chemical compositions during the samplingperiods especially 18–21 April.
Since BC aerosol and CO are both byproducts of incom-plete combustion, they are often well correlated in the tro-posphere (e.g., Spackman et al., 2008). In the springtimeArctic, background values of CO are∼160 ppb (Brock et al.,2010). As shown in Fig. 3 on the 12 April flight in the agedArctic air mass, background values of CO persisted through-out the lowest 2 km while BC mass increased by a factor of2 to 3 from 100 to 500 m altitude. The observed gradient inBC with respect to constant values of CO indicates that thelower BC mass loadings in the ABL cannot be explained byair mass advection in which a cleaner air mass with less BCand CO was mixed into the ABL from the free troposphereat an earlier time. Rather, the simultaneous measurementsare consistent with the physical removal of BC aerosol fromthis air mass through deposition. Size distributions of BCmass in the ABL and free troposphere on 12 April supportthis conclusion (Fig. 4). The modes for both of the mass dis-tributions are∼0.160 µm and the geometric standard devi-ations are nearly identical, suggesting the air masses in the
ABL and the free troposphere have similar sources. Thedata from two other aerosol instruments (for details of theNMASS and UHSAS instruments, see Brock et al., 2004)aboard the WP-3D aircraft that measure particle number andsize distributions also showed evidence for particle removalin the ultrafine and fine modes (i.e., 0.004–1 µm). On thewhole, the tracer and aerosol data across the boundary layertransition strongly suggest the air masses in the ABL andfree troposphere are from the same sources. For comparison,the SP2 instruments on the NASA DC-8 and P-3B reportedvery limited BC mass depletion compared to that observedon the NOAA WP-3D. The processes controlling BC aerosolin the ABL will be explored in greater detail using BC–COand O3–BC correlations in Sect. 4.
Polluted midlatitude air was advected into the AlaskanArctic and was sampled from 15 April through the remainderof the campaign (Brock et al., 2010; Fuelberg et al., 2010).An analysis using chemical signatures and FLEXPART, aLagrangian particle dispersion model, attributes most of thepollution to agricultural and forest fires in Kazakhstan andthe Lake Baikal region of Siberia, respectively (Warnekeet al., 2009). Most of these plumes were observed above
www.atmos-chem-phys.net/10/9667/2010/ Atmos. Chem. Phys., 10, 9667–9680, 2010

9672 J. R. Spackman et al.: Observations of black carbon mass in the springtime Arctic
Fig. 4. Mass size distributions for BC aerosol in the ABL (blue)and free troposphere (red) on 12 April 2008. The free tropo-spheric data include the full altitude profiles immediately before(84698–86798 s, UTC) and after (87827–89447 s) the ABL flightsegment (86799–87826 s). The flight context for these distributionscan be seen more clearly from the time series in Fig. 5. The free tro-pospheric segments bracket the ABL profiles in Fig. 6B. The sizedistributions have been normalized by the total measured BC massfor the flight (Mflight). The modes and geometric standard devi-ations (σg) are reported for the lognormal fits (solid lines) to thedata.
2 km altitude. In fact, less than 1% of the data from airsampled in the ABL during ARCPAC are characterized byCO values greater than 200 ppb, a value typical of biomass-burning plumes sampled in the free troposphere. These fewdata were observed on 19 April near the surface at Barrow,Alaska. Ozonesonde data from the NOAA Global Monitor-ing Division (GMD) baseline site at Barrow on this date in-dicated biomass-burning plumes were advected to the sur-face (S. J. Oltmans, private communication, 2009) consistentwith the BC and CO data in Fig. 3. With this one exception,the plumes in the free troposphere were decoupled from theABL on the timescales of several days during which thesemeasurements were taken.
BC mass mixing ratios increased by about a factor of 6with increasing altitude in the ABL and across the bound-ary layer transition up to 750 m in the free troposphere on18 and 21 April. Enhanced CO values of 180 to 220 ppbat the top of the ABL during this period indicate the preva-lence of biomass-burning plumes in the free troposphere andsuggest the BC gradient is attributable to both advection anddepletion. To avoid the complication from the advection ofbiomass-burning layers aloft, we quantify the BC removalbased only on data from 12 April, in the aged Arctic air massbefore the biomass-burning plumes reached the Arctic. Thetime series of altitude, latitude, O3, CO, BC mass, and sea-surface temperature (SST) for the 12 April flight are shown inFig. 5. Sea-surface temperature is a remote sensing measure-ment of the temperature at the sea-ice or open water surfaceand is most meaningful when the aircraft is a couple kilome-ters or less above the surface. The spikes in the SST data
Fig. 5. Time series of altitude, latitude, ozone, CO, BC mass, andSST for the flight of 12 April 2008. The shaded segments highlightthe parts of the flight where the NOAA WP-3D aircraft profiled thelowest 2 km altitude over the sea-ice and open leads.
in the shaded regions of Fig. 5 indicate the aircraft is fly-ing repeatedly over the sea-ice and open leads. We includeO3 data here because O3 is typically depleted in the ABLover the snow and ice due to bromine-catalyzed O3 destruc-tion (Simpson et al., 2007) coincident with the observationsof BC removal. Note the nearly complete removal of O3 inthe second and third segments. This correlation will be dis-cussed in more detail in the next section in the context of theBC mass depletions.
Low-altitude profile segments for the shaded regions inFig. 5 are shown in Fig. 6 for BC, CO, O3, and potential tem-perature. The shaded region in Fig. 6 marks the ABL and thetop of this layer is defined as the lowest altitude point abovethe surface where the vertical derivative of the potential tem-perature begins to increase which is often coincident witha weak low-level jet, generally at∼300 m altitude. In bothFig. 6b and c, there are positive vertical gradients in BC massloadings in the ABL which are well correlated with ozone de-pletions and generally occur in the vicinity of open leads inthe sea-ice. As mentioned earlier, this gradient occurs whileCO is unvarying. In Fig. 6b, the spiral ascent (red) and slant-wise descent data (blue) are shown separately because of the
Atmos. Chem. Phys., 10, 9667–9680, 2010 www.atmos-chem-phys.net/10/9667/2010/

J. R. Spackman et al.: Observations of black carbon mass in the springtime Arctic 9673
Fig. 6. Vertical profiles of BC mass, CO, O3, and potential temper-ature for the boundary layer flight segments on 12 April 2008 high-lighted in Fig. 5. The shaded regions mark the ABL. The profilesof BC mass consist of mean values of BC mass binned by altitudewhere each bin represents an equal fraction of the data. In(B), theascent (red line, circles) and descent data (blue line, plus markers)are segregated. The BC profiles consist of 30 s data and the CO, O3,and potential temperature profiles are 1 s data.
variability in the free troposphere over the geographical areaof the profiles. In Fig. 6a, the limited BC data in the ABLprevent any conclusions from these particular profiles. Weuse an average of the ascent and descent profiles in Fig. 6b(shown in Fig. 11) to estimate the difference in BC mixing ra-tio of ∼20 ng kg−1 between the top of the boundary layer and75 m altitude, at the bottom of the profile. The mean profilefrom Fig. 6b is used to estimate the BC depletion because theBC variability is relatively small compared to other profilessuch as in Fig. 6c. We assume the 20 ng kg−1 BC differencefrom the profile in Fig. 6b extends 300 m over the full depthof the ABL to calculate a deposition flux of BC to the snowin Sect. 4.
4 BC deposition
The processes controlling BC aerosol in the ABL includelong-range transport and deposition. Since there are limitedlocal anthropogenic sources and it is too early for biomass-
burning in the springtime Arctic, most of the BC reaches theArctic troposphere from lower latitudes by advection in thefree troposphere. Then, it may be slowly mixed into the ABLor more rapidly entrained by episodic events during advec-tion over open leads. Loss processes for BC aerosol includewet and dry deposition. Wet deposition might occur in a sat-urated layer in the ABL or in cloud layers in the free tropo-sphere while dry deposition occurs by BC particles comingin direct contact with snow or ice through mechanical mixingin the ABL.
Open leads emit heat and moisture to the Arctic atmo-sphere and both may influence BC removal in the ABL. Openleads perturb the stable ABL because the temperature differ-ence between the pack ice and the open water induces con-vection over and downstream of the lead (Anderson and Neff,2008; Serreze et al., 1992; Andreas and Murphy, 1986). An-other aircraft study in the Arctic troposphere has shown upto one-third removal of total aerosol in the ABL attributedto increased turbulent diffusion associated with open leads inthe sea-ice (Strunin et al., 1997). Open leads may enhance(i) mixing in the ABL facilitating the deposition of BC tothe snow or ice and (ii) entrainment of air from the free tropo-sphere which is often polluted in the springtime Arctic due tolong-range transport. However, the ARCPAC dataset showsno evidence for (ii), at least for the limited time the NOAAWP-3D was sampling over the sea-ice (Brock et al., 2010).
Although many of the open leads during ARCPAC wereobserved to be at least partially covered with thin ice, theleads were still a major moisture source to the ABL andresulting diamond dust may have played a role in the re-moval of BC particles through impaction scavenging by theseice crystals (Feng, 2009). A wet removal process wherebyBC particles act as ice nuclei is less likely because cloudswere generally not observed over the open leads. In general,very limited precipitation scavenging of total aerosol was ob-served during ARCPAC (Brock et al., 2010). This is in con-trast to previous observations of preferential scavenging ofBC as ice nuclei in mixed-phase clouds at a high-altitude sitein midlatitudes (Cozic et al., 2008). Because it was difficultto unambiguously identify open-lead influenced air in the air-craft data, we cannot definitively comment on the potentialrole of open leads in the removal of BC with this dataset.
4.1 Observational evidence for BC deposition
As shown in Fig. 7, BC mass loadings and CO valueswere generally well correlated in the free troposphere forthe 21 April flight. BC and CO were also correlated on12 and 18 April when BC depletion occurred but we onlyshow the data from 21 April because the dynamic rangein CO is largest on this flight. The slope of the linethrough the main body of points (black) is 4.58± 0.06 ng BC(kg dry air)−1 (ppb CO)−1 and is representative of a mixtureof biomass-burning influenced and aged Arctic air in the freetroposphere. The data have been segregated by altitude to
www.atmos-chem-phys.net/10/9667/2010/ Atmos. Chem. Phys., 10, 9667–9680, 2010

9674 J. R. Spackman et al.: Observations of black carbon mass in the springtime Arctic
Fig. 7. Correlation between BC mass mixing ratio and CO mix-ing ratios for the flight of 21 April 2008. The 30 s data points arediscriminated by altitude at 750 m. The slope with one standarddeviation and theR2 value is shown for each linear regression.
highlight the data in the aged Arctic air over the sea-ice be-low 750 m, the general altitude range for the observed BCvertical gradients as shown in Fig. 3. The correlation for thelower altitude data is different than for the free troposphereconsistent with a process of BC removal in the ABL. Theslope of this line (red), 2.59± 0.10 ng kg−1 ppb−1, mostlyrepresentative of the aged Arctic air, is less than that in thefree troposphere. For a given value of CO, the difference inBC mass between the regressions is greater than the maxi-mum observed difference derived from the 21 April verticalprofile in Fig. 3. This apparent discrepancy may be explainedin part by a lower background CO in the biomass-burninglayers aloft than in the aged Arctic air mass. The increas-ing BC mass differences between the regressions for increas-ing values of CO, as demonstrated by the different slopes,may be related to the larger vertical gradients in BC mass ob-served on 21 April due to the biomass-burning plumes aloftcompared to 12 April in the aged Arctic air mass. Furtherinterpretation of the BC–CO correlations requires a more de-tailed knowledge of the air parcel history.
The O3–BC correlation for all the flights and the entiresample altitude range is shown in Fig. 8a. Ozone is posi-tively correlated with BC for the main body of points (i.e.,O3 > 40 ppb, BC> 30 ng kg−1), associated with biomass-burning plumes and anthropogenic pollution. Two other pos-itive correlations are shown in Fig. 8b for the data in theABL (red points) and across the boundary layer transition(blue points). Ozone mixing ratios and BC mass loadings arewell correlated in ozone-depletion events (ODEs), account-
Fig. 8. Scatter plots of ozone and BC mass for 5 flights(12-21 April 2008) during ARCPAC for(A) the entire sample al-titude range and (B) only up to 600 m altitude to explicitly showthe different O3-BC mixing lines in the ABL (red) and across theboundary layer transition (blue). The data points are 30 s averagesand color-coded by altitude.
ing for most of the data in Fig. 8b. A different correlationwith fewer data points (blue) is observed along a shallowmixing layer at the top of the ABL for 40< O3 < 55 ppband 30< BC< 200 ng kg−1, corresponding to a mixing linebetween the ozone-depleted air masses in the ABL and thepollution in the free troposphere. This mixing line corre-sponds to the largest BC vertical gradient which was usuallyobserved between 300 and 750 m altitude. The maximumaltitude shown in Fig. 8b is 600 m because there is a lot ofvariability between 600 and 750 m altitude that obscures thecorrelations.
The O3–BC correlation in ODEs is robust over the courseof 5 flights spanning 10 days with a total of 7 h samplingin the ABL. In the ODEs, O3 is removed through cat-alytic destruction by active bromine (Simpson et al., 2007).Enhancements of molecular bromine were observed in theODEs during ARCPAC (Neuman et al., 2010). Molecularbromine is believed to be released to the atmosphere from
Atmos. Chem. Phys., 10, 9667–9680, 2010 www.atmos-chem-phys.net/10/9667/2010/

J. R. Spackman et al.: Observations of black carbon mass in the springtime Arctic 9675
brine during sea-ice formation and then rapidly photolyzedto active bromine. The ODEs effectively apply a stamp to anair mass that comes into contact with the sea-ice surface andthe O3 mixing ratio in an air parcel is related to how muchthat air parcel mixed with air that interacted with the surface.As shown in Fig. 8b, lower O3 was generally found at loweraltitude in the ABL and higher O3 near the top of the ABLconsistent with a mixing process where the ozone destructionis greatest near the surface. With this line of reasoning, thecorrelation between O3 and BC mass in ODEs suggests thatBC particles have been preferentially removed by a surfaceprocess such as dry deposition.
The competing hypothesis of precipitation scavenging ofBC mass does not explain the positive O3–BC correlationin the ABL because it is expected that BC-containing parti-cles would be scavenged throughout the depth of the ABLor preferentially at the top of the ABL where clouds formin the vicinity of open leads in the sea-ice. Another possi-ble hypothesis is that sedimentation of BC-containing parti-cles, enhanced in size by hygroscopic materials in the ABL,could contribute to the deposition of the BC mass to the snow.However, the SP2 sizing information for the internally mixedBC particles sampled in the ABL suggests there is insignif-icant mass at the larger sizes required (approaching 1 µm)for sedimentation to make a significant contribution to BCremoval.
4.2 BC deposition flux
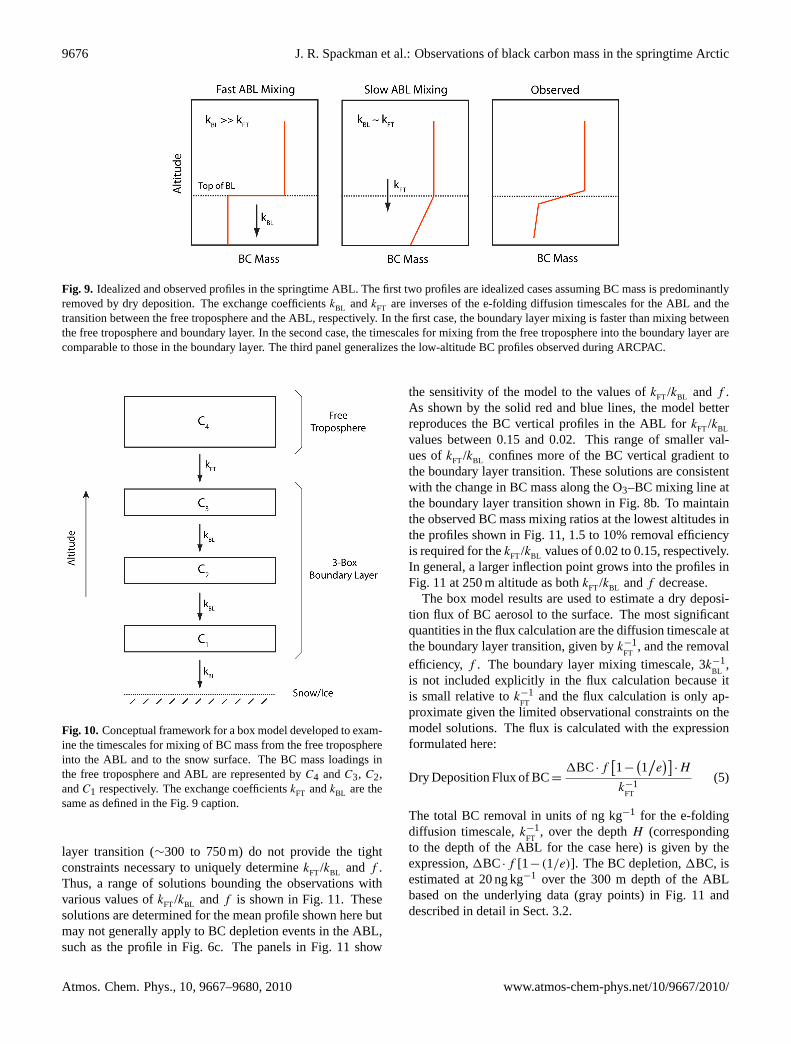
We now place the observations in the context of what is ex-pected from mixing processes in the springtime ABL. Thefirst two profiles in the schematic in Fig. 9 are idealizedcases assuming BC is predominantly removed by dry depo-sition. In the first case, rapid ABL mixing delivers BC to thesnow surface where removal occurs faster than BC can be im-ported from the free troposphere. This results in a step-wisedecrease in BC mass at the top of the ABL. In the secondcase, diffusion timescales are comparable across the bound-ary layer transition and in the ABL leading to a steadily de-creasing BC mass with decreasing altitude through the ABLcontrolled by removal through contact with the surface. Thethird profile in the schematic qualitatively represents whatwas observed on multiple profiles in the ABL on 12, 18, and21 April. The largest BC gradient was generally observedin a shallow layer near the top of the ABL corresponding tothe mixing line between O3 and BC in the tracer-tracer cor-relation in Fig. 8b. This BC gradient extends over a variablealtitude range generally above 250 m. A smaller positive ver-tical gradient was also observed in the ABL as depicted inFig. 9. Although the measurements do not cleanly fit into ei-ther idealized case, they are more consistent with the profilesdepicted by the fast ABL mixing case.
A simple box model is developed to estimate the depo-sition flux of BC aerosol to the snow. Fig. 10 shows aschematic of this 4-box system. A system of coupled linear
differential equations is formulated to quantify the flux ofBC from the free troposphere into the ABL and removal bycontact with the surface:
dC4
dt= 0 (1)
dC3
dt= kFT(C4−C3)−kBL (C3−C2) (2)
dC2
dt= kBL (C3−C2)−kBL (C2−C1) (3)
dC1
dt= kBL (C2−C1)−f kBL C1 (4)
The BC mass loading in the aged Arctic air mass in the freetroposphere is represented byC4. The BC mass loadingsin the ABL are partitioned into 3 boxes each representing100 m altitude depth and given byC3, C2, and C1. Thefree troposphere-to-boundary layer exchange coefficient,kFT,is inversely proportional to the e-folding timescale for mix-ing between the free troposphere and boundary layer. Simi-larly, the ABL exchange coefficient,kBL , is inversely propor-tional to the e-folding timescale for mixing between 2 adja-cent boxes in the ABL and is considered constant throughoutthe depth of the boundary layer. The e-folding timescale formixing through the full depth of the ABL is then expressed as3k−1
BL. A removal efficiency factor,f , of BC particles is used
in the model to scale the deposition velocity of BC mass fromthe lowest altitude box to the snow. The removal efficiencyis an effective removal efficiency that represents the fractionof particles that actually come into direct contact with thesurface and are removed. The removal efficiency factor isconstrained by the observations.
This 4-box construct is the simplest system to model theflux of BC mass from the free troposphere into the ABL andto the surface. The 3 boxes in the ABL are sufficient to repre-sent the BC vertical gradient in the ABL while more boxes donot add much additional value to the model results. The vari-ableskFT, kBL , andf are interrelated and not fully indepen-dent in the model. For example, the exchange coefficientkFT
is expressed as a small fraction ofkBL (i.e., kFT/kBL ≤ 0.15)in the model because the observations indicate the diffusiontimescale between the free troposphere and ABL is longerthan that in the ABL. This ratio controls the BC vertical gra-dient at the boundary layer transition at∼300 m altitude asillustrated schematically in Fig. 9. Larger values off add agreater sink at the surface in the model driving the profile tosmaller BC values as shown in the second panel of Fig. 9. Welater prescribe a value forkBL to estimate the deposition fluxof BC mass to the snow surface. The choice ofkBL does notaffect the steady-state concentrations of BC mass inC4−C1but does affect how quickly the model distributes BC.
In theory, the system of Eqs. (1)–(4) can be solveduniquely forkFT/kBL andf . However, the variability in theBC vertical profiles and the limited data at the boundary
www.atmos-chem-phys.net/10/9667/2010/ Atmos. Chem. Phys., 10, 9667–9680, 2010
9676 J. R. Spackman et al.: Observations of black carbon mass in the springtime Arctic
34
1 2 3 4 Figure 9. Idealized and observed profiles in the springtime ABL. The first two profiles are 5 idealized cases assuming BC mass is predominantly removed by dry deposition. The exchange 6 coefficients
€
kBL and
€
kFT are inverses of the e-folding diffusion timescales for the ABL and the 7 transition between the free troposphere and the ABL, respectively. In the first case, the boundary 8 layer mixing is faster than mixing between the free troposphere and boundary layer. In the 9 second case, the timescales for mixing from the free troposphere into the boundary layer are 10 comparable to those in the boundary layer. The third panel generalizes the low-altitude BC 11 profiles observed during ARCPAC. 12 13
Fig. 9. Idealized and observed profiles in the springtime ABL. The first two profiles are idealized cases assuming BC mass is predominantlyremoved by dry deposition. The exchange coefficientskBL andkFT are inverses of the e-folding diffusion timescales for the ABL and thetransition between the free troposphere and the ABL, respectively. In the first case, the boundary layer mixing is faster than mixing betweenthe free troposphere and boundary layer. In the second case, the timescales for mixing from the free troposphere into the boundary layer arecomparable to those in the boundary layer. The third panel generalizes the low-altitude BC profiles observed during ARCPAC.
35
1 2 3 4 Figure 10. Conceptual framework for a box model developed to examine the timescales for 5 mixing of BC mass from the free troposphere into the ABL and to the snow surface. The BC 6 mass loadings in the free troposphere and ABL are represented by
€
C4 and
€
C3 ,
€
C2, and
€
C1, 7 respectively. The exchange coefficients
€
kFT and
€
kBL are the same as defined in the Fig. 9 8 caption. 9
Fig. 10.Conceptual framework for a box model developed to exam-ine the timescales for mixing of BC mass from the free troposphereinto the ABL and to the snow surface. The BC mass loadings inthe free troposphere and ABL are represented byC4 andC3, C2,andC1 respectively. The exchange coefficientskFT andkBL are thesame as defined in the Fig. 9 caption.
layer transition (∼300 to 750 m) do not provide the tightconstraints necessary to uniquely determinekFT/kBL andf .Thus, a range of solutions bounding the observations withvarious values ofkFT/kBL andf is shown in Fig. 11. Thesesolutions are determined for the mean profile shown here butmay not generally apply to BC depletion events in the ABL,such as the profile in Fig. 6c. The panels in Fig. 11 show
the sensitivity of the model to the values ofkFT/kBL andf .As shown by the solid red and blue lines, the model betterreproduces the BC vertical profiles in the ABL forkFT/kBL
values between 0.15 and 0.02. This range of smaller val-ues ofkFT/kBL confines more of the BC vertical gradient tothe boundary layer transition. These solutions are consistentwith the change in BC mass along the O3–BC mixing line atthe boundary layer transition shown in Fig. 8b. To maintainthe observed BC mass mixing ratios at the lowest altitudes inthe profiles shown in Fig. 11, 1.5 to 10% removal efficiencyis required for thekFT/kBL values of 0.02 to 0.15, respectively.In general, a larger inflection point grows into the profiles inFig. 11 at 250 m altitude as bothkFT/kBL andf decrease.
The box model results are used to estimate a dry deposi-tion flux of BC aerosol to the surface. The most significantquantities in the flux calculation are the diffusion timescale atthe boundary layer transition, given byk−1
FT, and the removal
efficiency,f . The boundary layer mixing timescale, 3k−1BL
,is not included explicitly in the flux calculation because itis small relative tok−1
FTand the flux calculation is only ap-
proximate given the limited observational constraints on themodel solutions. The flux is calculated with the expressionformulated here:
Dry Deposition Flux of BC=1BC·f
[1−
(1/e)]
·H
k−1FT
(5)
The total BC removal in units of ng kg−1 for the e-foldingdiffusion timescale,k−1
FT, over the depthH (corresponding
to the depth of the ABL for the case here) is given by theexpression,1BC·f [1−(1/e)]. The BC depletion,1BC, isestimated at 20 ng kg−1 over the 300 m depth of the ABLbased on the underlying data (gray points) in Fig. 11 anddescribed in detail in Sect. 3.2.
Atmos. Chem. Phys., 10, 9667–9680, 2010 www.atmos-chem-phys.net/10/9667/2010/

J. R. Spackman et al.: Observations of black carbon mass in the springtime Arctic 9677
Fig. 11. Observed (black lines) and simulated (red and blue lines) vertical profiles of BC mass for measurements from 12 April 2008 (meanprofile from Fig. 6B). The 30 s BC data (gray points) are binned by altitude at 100 m resolution below and at 500 m resolution above 500 maltitude. The error bars are one standard deviation around the mean in each bin. The removal efficiency factor,f , is varied for a constantexchange coefficient ratio in(A) and vice versa in(B). The solutions denoted by the solid red and blue lines are used to estimate the depositionflux of BC mass to the surface.
Diffusion timescales as long as 8 h have been found at theSouth Pole for very stable, shallow boundary layers (Neff etal., 2008). However, the timescale could be much shorter un-der higher wind conditions with the potential for solar heat-ing at the surface in the springtime Arctic. If we assumethe boundary layer mixing timescale is 1 h, then the modelsolutions indicate the diffusion timescales at the boundarylayer transition, denoted byk−1
FT, are 2.2 to 17 h for the cases
kFT/kBL = 0.15 and 0.02, respectively. The correspondingdry deposition fluxes then span a range between 5300 and100 ng (m2 day)−1, respectively. If there had been more sam-pling at the boundary layer transition where the BC verticalgradient was the largest, it might have been possible to moretightly constrain the profiles in the box model and reduce thislarge range in deposition fluxes.
These flux estimates decrease for longer boundary layerturnover timescales in accordance with Eq. (5). A tracer-tracer correlation of O3 and CO (not shown) indicatesthe biomass-burning plumes in the free troposphere on15–21 April generally did not mix into the ABL, except thesynoptic-scale event on 19 April mentioned earlier, suggest-ing even longer free troposphere-to-boundary layer diffusiontimescales than given by the box model results for an ABLdiffusion timescale of 1 h. A possible reason for this dis-crepancy may be that the physical mixing processes are lesslikely continuous as modeled but more likely episodic as thetemperature difference between the air over the sea-ice and
open leads enhances the mixing. During the ARCPAC sam-pling period, the WP-3D aircraft may not have sampled theseepisodic exchange processes despite flight legs over and nearopen leads.
Finally, these model-derived deposition fluxes are relatedto the measured BC mass in snow. When deposition occurs,we assume the snow exposed to the air is relatively uncom-pacted with a density of 100 kg m−3 based on a 10:1 snow-to-liquid density ratio (Roebber et al., 2003). The climatedata (1971–2000) at Barrow, Alaska, are probably represen-tative of weather conditions over the Arctic Ocean in thegeneral region where the aircraft measurements took place.The April mean temperature in Barrow of−18◦C may jus-tify selecting a higher snow-to-liquid ratio but since the snowmay be compacted somewhat upon initial impact with thesurface, the 10:1 ratio is still used for this calculation. Wethen use the climatological April mean snowfall of 5.3 cmat Barrow to calculate the average BC mass in the snowbased on the dry deposition fluxes from the box model. Thisequates to 0.6 to 30 ng BC (g snow)−1 for a 1 h ABL diffusiontimescale. These derived values are plausible with respect torecent published results of 4 to 16 ng g−1 at the North Poleand in the North American Arctic, respectively (Hegg et al.,2009, 2010). A contribution of BC aerosol to the snow fromprecipitation scavenging would increase the values derivedhere for dry removal but, given the limited precipitation inthe Arctic in the winter and spring, the total values would
www.atmos-chem-phys.net/10/9667/2010/ Atmos. Chem. Phys., 10, 9667–9680, 2010

9678 J. R. Spackman et al.: Observations of black carbon mass in the springtime Arctic
likely still be consistent with the large range of literature val-ues for BC in snow across the Arctic (Flanner et al., 2007).The large range of reported BC loadings in snow may bepartly explained by the interannual and seasonal variabilityin the amount of snowfall at a given site. The variability mayalso be affected by the interannual variability in BC mass ad-vected to the Arctic and to what extent it is then mixed intothe ABL and deposited to the snow surface.
5 Summary
Single-particle measurements of BC mass loadings from theNOAA WP-3D research aircraft were acquired from theground to about 7 km in the springtime Arctic showing anincrease of BC mass with increasing altitude from the ABLto the middle and upper troposphere. These BC aerosolmeasurements in the Arctic provide important constraints onglobal aerosol models. In the lowest 750 m over the sea-ice,a positive vertical gradient in BC mass was observed in manyof the profiles. Sampling over the sea-ice generally occurredin the vicinity of open leads. The vertical gradient in BCmass was attributed to removal based on the CO data andBC size distributions that indicated air masses in the ABLand free troposphere had similar sources. BC mass and COwere well correlated throughout the free troposphere exceptthe correlation changed in the ABL consistent with the BCdepletions events. Ozone and BC were positively correlatedin ODEs suggesting that BC mass was removed through drydeposition. Using a box model constrained by the BC mea-surements from the 12 April flight prior to the advection ofbiomass-burning plumes to the Arctic, we estimated a depo-sition flux of BC mass between 100 and 5300 ng (m2 day)−1
for a boundary layer e-folding diffusion timescale of 1 h.These results were consistent with measurements of BC insnow based on the April climatology for Barrow.
Interannual variability in BC mass advected to the Arcticmay affect the amount of BC deposited to the snow. How-ever, the fate of BC aerosol ultimately depends on whetherit is mixed from the free troposphere into the boundary layerbefore it is transported out of the Arctic. The analysis inthis work indicates dry deposition of BC aerosol occurredin the aged Arctic air mass. There is no evidence that thebiomass-burning layers in the free troposphere mixed intothe ABL and reached the snow surface during the ARCPACobservation period. However, the work of Hegg et al. (2009)presents a conundrum because it suggests that the bulk of theBC in Arctic snow is attributed to fire sources. The spatiallyand temporally limited representativeness of the observationsduring ARCPAC may explain some of this disparity. On theother hand, the possible role of open leads in the sea-ice infacilitating the entrainment of biomass-burning layers aloftmay also help to explain this discrepancy. Enhanced deposi-tion may be occurring in regions influenced by open leads inthe ice because the open leads facilitate mixing between the
free troposphere and ABL under certain meteorological con-ditions. Additional observations will be important to evalu-ating this hypothesis and better understanding the processescontrolling BC aerosol in the ABL that have important im-plications for Arctic climate.
Acknowledgements.We are grateful to K. D. Froyd and S. Lancefor PALMS and cloud probe data, respectively, used to excludecloud sampling from the black carbon data. We also thankJ. Cozic for particle number concentration data supporting thisanalysis. This research was supported by the NOAA AtmosphericComposition and Climate Program, the NASA Radiation SciencesProgram, and the NASA Upper Atmosphere Research Program.
Edited by: A. Stohl
References
Anderson, P. S. and Neff, W. D.: Boundary layer physics over snowand ice, Atmos. Chem. Phys., 8, 3563–3582, doi:10.5194/acp-8-3563-2008, 2008.
Andreas, E. L. and Murphy, B.: Bulk transfer coefficients for heatmomentum over leads and polynyas, J. Phys. Ocean., 16, 1875–1883, 1986.
Brock, C. A., Hudson, P. K., Lovejoy, E. R., Sullivan, A., Nowak,J. B., Huey, L. G., Cooper, O. R., Cziczo, D. J., de Gouw, J.,Fehsenfeld, F. C., Holloway, J. S., Hubler, G., Lafleur, B. G.,Murphy, D. M., Neuman, J. A., Nicks, D. K., Orsini, D. A.,Parrish, D. D., Ryerson, T. B., Tanner, D. J., Warneke, C., We-ber, R. J., and Wilson, J. C.: Particle characteristics followingcloud-modified transport from Asia to North America, J. Geo-phys. Res., 109, D23S26, doi:10.1029/2003JD004198, 2004.
Brock, C. A., Cozic, J., Bahreini, R., Froyd, K. D., Middlebrook,A. M., McComiskey, A., Brioude, J., Cooper, O. R., Stohl, A.,Aikin, K. C., de Gouw, J. A., Fahey, D. W., Ferrare, R. A., Gao,R.-S., Gore, W., Holloway, J. S., Hubler, G., Jefferson, A., Lack,D. A., Lance, S., Moore, R. H., Murphy, D. M., Nenes, A.,Novelli, P. C., Nowak, J. B., Ogren, J. A., Peischl, J., Pierce,R. B., Pilewskie, P., Quinn, P. K., Ryerson, T. B., Schmidt, K.S., Schwarz, J. P., Sodemann, H., Spackman, J. R., Stark, H.,Thomson, D. S., Thornberry, T., Veres, P., Watts, L. A., Warneke,C., and Wollny, A. G., Characteristics, sources, and transportof aerosols measured in spring 2008 during the Aerosol, Radi-ation, and Cloud Processes Affecting Arctic Climate (ARCPAC)project, Atmos. Chem. Phys. Discuss., in preparation, 2010.
Cozic, J., Mertes, S., Verheggen, B., Cziczo, D. J., Gallavardin,S. J., Walter, S., Baltensperger, U., and Weingartner, E.: Blackcarbon enrichment in atmospheric ice particle residuals observedin lower tropospheric mixed phase clouds, J. Geophys. Res., 113,D15209, doi:10.1029/2007JD009266, 2008.
Doherty, S. J., Warren, S. G., Grenfell, T. C., Clarke, A. D., andBrandt, R. E.: Light-absorbing impurities in Arctic snow, Atmos.Chem. Phys. Discuss., 10, 18807–18878, doi:10.5194/acpd-10-18807-2010, 2010.
Feng, J.: A size-resolved model for below-cloud scavengingof aerosols by snowfall, J. Geophys. Res., 114, D08203,doi:10.1029/2008JD011012, 2009.
Flanner, M. G., Zender, C. S., Randerson, J. T., andRasch, P. J.: Present-day climate forcing and response from
Atmos. Chem. Phys., 10, 9667–9680, 2010 www.atmos-chem-phys.net/10/9667/2010/

J. R. Spackman et al.: Observations of black carbon mass in the springtime Arctic 9679
black carbon in snow: J. Geophys. Res., 112, D11202,doi:10.1029/2006JD008003, 2007.
Flanner, M. G., Zender, C. S., Hess, P. G., Mahowald, N. M.,Painter, T. H., Ramanathan, V., and Rasch, P. J.: Springtimewarming and reduced snow cover from carbonaceous particles,Atmos. Chem. Phys., 9, 2481–2497, doi:10.5194/acp-9-2481-2009, 2009.
Froyd, K. D., Murphy, D. M., Lawson, P., Baumgardner, D.,and Herman, R. L.: Aerosols that form subvisible cirrus atthe tropical tropopause, Atmos. Chem. Phys., 10, 209–218,doi:10.5194/acp-10-209-2010, 2010.
Fuelberg, H. E., Harrigan, D. L., and Sessions, W.: A meteoro-logical overview of the ARCTAS 2008 mission, Atmos. Chem.Phys., 10, 817–842, doi:10.5194/acp-10-817-2010, 2010.
Generoso, S., Bey, I., Attie, J.-L., and Breon, F.-M.: A satellite-and model-based assessment of the 2003 Russian fires: Im-pact on the Arctic region, J. Geophys. Res., 112, D15302,doi:10.1029/2006JD008344, 2007.
Hansen, A. D. A. and Novakov, T.: Aerosol black carbon measure-ments in the Arctic haze during AGASP-II, J. Atmos. Chem., 9,347–361, 1989.
Hansen, A. D. A. and Rosen, H.: Vertical distributions of particu-late carbon, sulfur, and bromine in the Arctic haze and compar-ison with ground-level measurements at Barrow, Alaska, Geo-phys. Res. Lett., 11(5), 381–384, 1984.
Hansen, J. and Nazarenko, L.: Soot climate forcing via snow andice albedos, P. Natl. Acad. Sci., 101, 423–428, 2004.
Hegg, D. A., Warren, S. G., Grenfell, T. C., Doherty, S. J., andClarke, A. D.: Sources of light-absorbing aerosol in arctic snowand their seasonal variation, Atmos. Chem. Phys. Discuss., 10,13755–13796, doi:10.5194/acpd-10-13755-2010, 2010.
Hegg, D. A., Warren, S. G., Grenfell, T. C., Doherty, S. J., Lar-son, T. V., and Clarke, A. D.: Source attribution of black car-bon in Arctic snow, Environ. Sci. Technol., 43(11), 4016–4021,doi:10.1021/es803623f, 2009.
Holloway, J. S., Jakoubek, R. O., Parrish, D. D., Gerbig, C., Volz-Thomas, A., Schmitgen, S., Fried, A., Wert, B., Henry, B., andDrummond, J. R.: Airborne intercomparison of vacuum ultra-violet fluorescence and tunable diode laser absorption measure-ments of tropospheric carbon monoxide, J. Geophys. Res., 105,24251–24261, 2000.
IPCC: Climate Change 2007: The Physical Science Basis, Con-tribution of Working Group I to the Fourth Assessment Reportof the Intergovernmental Panel on Climate Change, edited by:Solomon, S., Qin, D., Manning, M., Chen, Z., Marquis, M., Av-eryt, K. B., Tignor, M., and Miller, H. L., Cambridge UniversityPress, Cambridge, UK and New York, NY, USA, 996 pp., 2007.
Jacob, D. J., Crawford, J. H., Maring, H., Clarke, A. D., Dibb, J. E.,Emmons, L. K., Ferrare, R. A., Hostetler, C. A., Russell, P. B.,Singh, H. B., Thompson, A. M., Shaw, G. E., McCauley, E., Ped-erson, J. R., and Fisher, J. A.: The Arctic Research of the Com-position of the Troposphere from Aircraft and Satellites (ARC-TAS) mission: design, execution, and first results, Atmos. Chem.Phys., 10, 5191–5212, doi:10.5194/acp-10-5191-2010, 2010.
Jacobson, M.: Strong radiative heating due to the mixing state ofblack carbon in atmospheric aerosols, Nature, 409, 695–697,2001.
Koch, D. and Hansen, J.: Distant origins of Arctic black carbon:A Goddard Institute for Space Studies ModelE experiment, J.
Geophys. Res., 110, D04204, doi:10.1029/2004JD005296, 2005.Koch, D., Schulz, M., Kinne, S., McNaughton, C., Spackman, J.
R., Balkanski, Y., Bauer, S., Berntsen, T., Bond, T. C., Boucher,O., Chin, M., Clarke, A., De Luca, N., Dentener, F., Diehl, T.,Dubovik, O., Easter, R., Fahey, D. W., Feichter, J., Fillmore, D.,Freitag, S., Ghan, S., Ginoux, P., Gong, S., Horowitz, L., Iversen,T., Kirkevag, A., Klimont, Z., Kondo, Y., Krol, M., Liu, X.,Miller, R., Montanaro, V., Moteki, N., Myhre, G., Penner, J. E.,Perlwitz, J., Pitari, G., Reddy, S., Sahu, L., Sakamoto, H., Schus-ter, G., Schwarz, J. P., Seland, Ø., Stier, P., Takegawa, N., Take-mura, T., Textor, C., van Aardenne, J. A., and Zhao, Y.: Evalu-ation of black carbon estimations in global aerosol models, At-mos. Chem. Phys., 9, 9001–9026, doi:10.5194/acp-9-9001-2009,2009.
Law, K. S. and Stohl, A.: Arctic air pollution: Origins and impacts,Science, 315, 1537–1540, 2007.
McConnell, J. R., Edwards, R., Kok, G. L., Flanner, M. G., Zender,C. S., Saltzman, E. S., Banta, J. R., Pasteris, D. R., Carter, M.M., and Kahl, J. D. W.: 20th-Century industrial black carbonemissions altered Arctic climate forcing, Science, 317, 1381–1384, 2007.
McNaughton, C. M., Clarke, A. D., Freitag, S., Kapustin, V. N.,Kondo, Y., Moteki, N., Sahu, L., Takegawa, N., Fahey, D. W.,Gao, R. S., Schwarz, J. P., Spackman, J. R., Watts, L., Diskin,G., Podolske, J., Holloway, J. S., Wisthaler, A., Mikoviny, T., deGouw, J., Warneke, C., Jimenez, J., Cubison, M., Howell, S. G.,Middlebrook, A. M., Bahreini, R., Anderson, B. E., Winstead,E., Thornhill, K. L., Lack, D., Cozic, J., and Brock, C. A.: Ab-sorbing aerosol in the troposphere of the Western Arctic duringthe 2008 ARCTAS/ARCPAC airborne field campaigns, Atmos.Phys. Chem. Discuss., in preparation, 2010.
Neff, W. D., Helmig, D., Grachev, A., and Davis, D.: A studyof boundary layer behavior associated with high NO con-centrations at the South Pole using minisodar, tethered bal-loon, and sonic anemometer, Atmos. Environ., 42, 2762–2779,doi:10.1016/j.atmosenv.2007.01.033, 2008.
Neuman, J. A., Nowak, J. B., Huey, L. G., Burkholder, J. B., Dibb,J. E., Holloway, J. S., Liao, J., Peischl, J., Roberts, J. M., Ryer-son, T. B., Scheuer, E., Stark, H., Stickel, R. E., Tanner, D. J.,and Weinheimer, A.: Bromine measurements in ozone depletedair over the Arctic Ocean, Atmos. Chem. Phys., 10, 6503–6514,doi:10.5194/acp-10-6503-2010, 2010.
Quinn, P. K., Shaw, G., Andrews, E., Dutton, E. G., Ruoho-Airola,T., and Gong, S. L.: Arctic haze: current trends and knowledgegaps, Tellus B, 59, 99–114, 2007.
Roebber, P. J., Bruening, S. L., Schultz, D. M., and Cortinas, J.V.: Improving snowfall forecasting by diagnosing snow density,Wea. Forecast., 18, 264–287, 2003.
Ryerson, T. B., Buhr, M. P., Frost, G. J., Goldan, P. D., Holloway,J. S., Hubler, G., Jobson, B. T., Kuster, W. C., McKeen, S.A., Parrish, D. D., Roberts, J. M., Sueper, D. T., Trainer, M.T., Williams, J., and Fehsenfeld, F. C.: Emissions lifetimes andozone formation in power plant plumes, J. Geophys. Res., 103,22569–22583, 1998.
Saha, A., O’Neill, N. T., Eloranta, E., Stone, R. S., Eck, T. F.,Zidane, S., Daou, D., Lupu, A., Lesins, G., Shiobara, M.,and McArthur, L. J. B.: Pan-Arctic sunphotometry during theARCTAS-A campaign of April 2008, Geophys. Res. Lett., 37,L05803, doi:10.1029/2009GL041375, 2010.
www.atmos-chem-phys.net/10/9667/2010/ Atmos. Chem. Phys., 10, 9667–9680, 2010

9680 J. R. Spackman et al.: Observations of black carbon mass in the springtime Arctic
Schnell, R. C.: Arctic haze and the Arctic Gas and Aerosol Sam-pling Program (AGASP), Geophys. Res. Lett., 11, 361–364,1984.
Schwarz, J. P., Gao, R. S., Fahey, D. W., Thomson, D. S., Watts,L. A., Wilson, J. C., Reeves, J. M., Darbeheshti, M., Baum-gardner, D. G., Kok, G. L., Chung, S. H., Schulz, M., Hen-dricks, J., Lauer, A., Karcher, B., Slowik, J. G., Rosenlof,K. H., Thompson, T. L., Langford, A. O., Loewenstein, M.,and Aikin, K. C.: Single-particle measurements of midlatitudeblack carbon and light-scattering aerosols from the boundarylayer to the lower stratosphere, J. Geophys. Res., 111, D16207,doi:10.1029/2006JD007076, 2006.
Schwarz, J. P., Spackman, J. R., Fahey, D. W., Gao, R. S., Lohmann,U., Stier, P., Watts, L. A., Thomson, D. S., Lack, D. A., Pfis-ter, L., Mahoney, M. J., Baumgardner, D., Wilson, J. C., andReeves, J. M.: Coatings and their enhancement of black car-bon light absorption in the tropical atmosphere, J. Geophys. Res.,113, D03203, doi:10.1029/2007JD009042, 2008.
Serreze, M. C., Maslanik, J. A., Rehder, M. C., Schnell, R. C., Kahl,J. D., and Andreas, E. L.: Theoretical heights of buoyant con-vection above open leads in the winter Arctic pack ice cover, J.Geophys. Res., 97, 9411–9422, 1992.
Sharma, S., Andrews, E., Barrie, L. A., Ogren, J. A., and Lavoue,D.: Variations and sources of the equivalent black carbon inthe high Arctic revealed by long-term observations at Alertand Barrow: 1989–2003, J. Geophys. Res., 111, D14208,doi:10.1029/2005JD006581, 2006.
Shindell, D. T., Chin, M., Dentener, F., Doherty, R. M., Faluvegi,G., Fiore, A. M., Hess, P., Koch, D. M., MacKenzie, I. A.,Sanderson, M. G., Schultz, M. G., Schulz, M., Stevenson, D.S., Teich, H., Textor, C., Wild, O., Bergmann, D. J., Bey, I.,Bian, H., Cuvelier, C., Duncan, B. N., Folberth, G., Horowitz, L.W., Jonson, J., Kaminski, J. W., Marmer, E., Park, R., Pringle,K. J., Schroeder, S., Szopa, S., Takemura, T., Zeng, G., Keat-ing, T. J., and Zuber, A.: A multi-model assessment of pollu-tion transport to the Arctic, Atmos. Chem. Phys., 8, 5353–5372,doi:10.5194/acp-8-5353-2008, 2008.
Shindell, D. and Faluvegi, G.: Climate response to regional radia-tive forcing during the twentieth century, Nat. Geosci., 2, 294–300, doi:10.1038/NGEO473, 2009.
Shiraiwa, M., Kondo, Y., Moteki, N., Takegawa, N., Miyazaki, Y.,and Blake, D. R.: Evolution of mixing state of black carbonin polluted air from Tokyo, Geophys. Res. Lett., 34, L16803,doi:10.1029/2007GL029819, 2007.
Simpson, W. R., von Glasow, R., Riedel, K., Anderson, P., Ariya,P., Bottenheim, J., Burrows, J., Carpenter, L. J., Frieß, U., Good-site, M. E., Heard, D., Hutterli, M., Jacobi, H.-W., Kaleschke,L., Neff, B., Plane, J., Platt, U., Richter, A., Roscoe, H., Sander,R., Shepson, P., Sodeau, J., Steffen, A., Wagner, T., and Wolff,E.: Halogens and their role in polar boundary-layer ozone de-pletion, Atmos. Chem. Phys., 7, 4375–4418, doi:10.5194/acp-7-4375-2007, 2007.
Slowik, J. G., Cross, E. S., Han, J.-H., Davidovits, P., Onasch, T. B.,Jayne, J. T., Williams, L. R., Canagaratna, M. R., Worsnop, D.R., Chakrabarty, R. K., Moosmuller, H., Arnott, W. P., Schwarz,J. P., Gao, R.-S., Fahey, D. W., Kok, G. L., and Petzold, A.: Aninter-comparison of instruments measuring black carbon contentof soot particles, Aerosol Sci. Tech., 41, 295–314, 2007.
Spackman, J. R., Schwarz, J. P., Gao, R. S., Watts, L. A., Thom-son, D. S., Fahey, D. W., Holloway, J. S., de Gouw, J. A.,Trainer, M., and Ryerson, T. B.: Empirical correlations be-tween black carbon aerosol and carbon monoxide in the lowerand middle troposphere, Geophys. Res. Lett., 35, L19816,doi:10.1029/2008GL035237, 2008.
Stohl, A.: Characteristics of atmospheric transport in theArctic troposphere, J. Geophys. Res., 111, D11306,doi:10.1029/2005JD006888, 2006.
Strunin, M. A., Postnov, A. A., and Mezrin, M. Y.: Meteorologi-cal potential for contamination of arctic troposphere: Boundarylayer structure and turbulent diffusion characteristics, J. Atmos.Res., 44, 37–51, 1997.
Sturges, W. T.: Pollution of the Arctic Atmosphere, Elsevier Sci-ence Publishing, London, UK and New York, NY, USA, 334 pp.,1991.
Tjernstrom, M. and Graversen, R. G.: The vertical structure ofthe lower Arctic troposphere analysed from observations andthe ERA-40 reanalysis, Q. J. Roy. Meteor. Soc., 135, 431–443,doi:10.1002/qj.380, 2009.
Warneke, C., Bahreini, R., Brioude, J., Brock, C. A., de Gouw, J.A., Fahey, D. W., Froyd, K. D., Holloway, J. S., Middlebrook,A., Miller, L., Montzka, S., Murphy, D. M., Peischl, J., Ryerson,T. B., Schwarz, J. P., Spackman, J. R., and Veres, P.: Biomassburning in Siberia and Kazakhstan as an important source forhaze over the Alaskan Arctic in April 2008, Geophys. Res. Lett.,36, L02813, doi:10.1029/2008GL036194, 2009.
Warneke, C., Froyd, K. D., Brioude, J., Bahreini, R., Brock, C.A., Cozic, J., de Gouw, J. A., Fahey, D. W., Ferrare, R., Hol-loway, J. S., Middlebrook, A. M., Miller, L., Montzka, S.,Schwarz, J. P., Sodemann, H., Spackman, J. R., and Stohl, A.:An important contribution to springtime Arctic aerosol frombiomass-burning in Russia, Geophys. Res. Lett., 37, L01801,doi:10.1029/2009GL041816, 2010.
Wilson, J. C., Lafleur, B. G., Hilbert, H., Seebaugh, W. R., Fox,J., Gesler, D. W., Brock, C. A., Huebert, B. J., and Mullen,J.: Function and performance of a low turbulence inlet for sam-pling super-micron particles from aircraft platforms, Aerosol Sci.Tech., 38, 790–802, 2004.
Atmos. Chem. Phys., 10, 9667–9680, 2010 www.atmos-chem-phys.net/10/9667/2010/