airbus q1 results 2017 - 4-traders.com · airbus expects to deliver more than 700 commercial...
TRANSCRIPT
Harald WilhelmChief Financial Officer
AIRBUSQ1 Results2017
27 April 2017

2SAFE HARBOUR STATEMENT
This presentation includes forward-looking statements. Words such as “anticipates”, “believes”, “estimates”, “expects”, “intends”, “plans”, “projects”, “may” and similar expressions are used to identify these forward-looking statements. Examples of forward-looking statements include statements made about strategy, ramp-up and delivery schedules, introduction of new products and services and market expectations, as well as statements regarding future performance and outlook.By their nature, forward-looking statements involve risk and uncertainty because they relate to future events and circumstances and there are many factors that could cause actual results and developments to differ materially from those expressed or implied by these forward-looking statements.
THESE FACTORS INCLUDE BUT ARE NOT LIMITED TO:
Changes in general economic, political or market conditions, including the cyclical nature of some of Airbus’ businesses;Significant disruptions in air travel (including as a result of terrorist attacks);Currency exchange rate fluctuations, in particular between the Euro and the U.S. dollar;The successful execution of internal performance plans, including cost reduction and productivity efforts;Product performance risks, as well as programme development and management risks;Customer, supplier and subcontractor performance or contract negotiations, including financing issues;Competition and consolidation in the aerospace and defence industry;Significant collective bargaining labour disputes;The outcome of political and legal processes including the availability of government financing for certain programmes and the size of defence and space
procurement budgets;Research and development costs in connection with new products; Legal, financial and governmental risks related to international transactions; Legal and investigatory proceedings and other economic, political and technological risks and uncertainties.
As a result, Airbus’ actual results may differ materially from the plans, goals and expectations set forth in such forward-looking statements. For a discussion of factors that could cause future results to differ from such forward-looking statements, see the Airbus “Registration Document” dated 4 April 2017, including the Risk Factors section.
Any forward-looking statement contained in this presentation speaks as of the date of this presentation. Airbus undertakes no obligation to publicly revise or update any forward-looking statements in light of new information, future events or otherwise.
DISCLAIMER

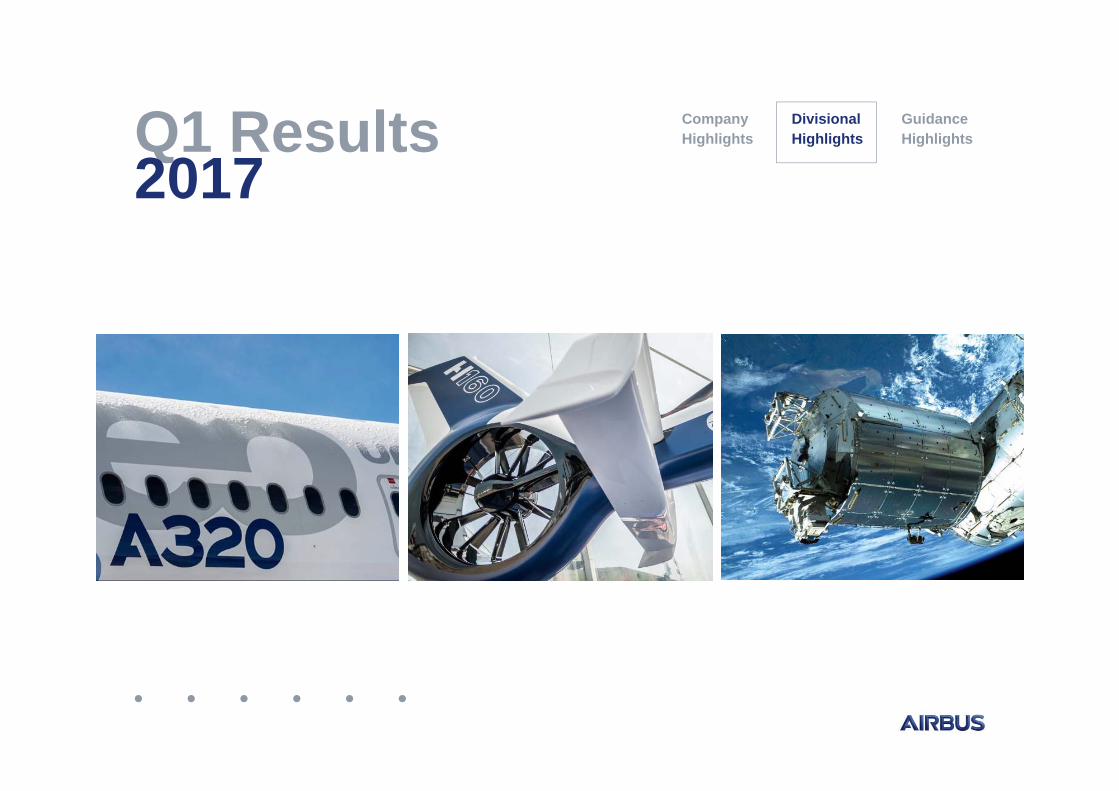
Q1 Results2017
CompanyHighlights
DivisionalHighlights
GuidanceHighlights

Q1 2017 HIGHLIGHTS 4
Strong commercial backlog of 6,744 a/c, supporting ramp-up plans
Q1 financials reflect phasing and divestments
2017 Guidance confirmed

33%
21%
18%
13%
5%
10%
75%
9%
16%
5Q1 2017 COMMERCIAL POSITIONING
COMMERCIAL AIRCRAFT: 26 gross, 6 net orders. Backlog: 6,744 a/c
HELICOPTERS: 60 net orders (incl. 10 Super Puma, 3 H175 and 14 H145)
DEFENCE AND SPACE: Successful repositioning through portfolio reshaping
Airbus Order Book*by Region (by value)
● Asia Pacific● Europe● North America
● Middle East● Latin America● Other countries
Airbus ExternalRevenue Split by Division
● Commercial Aircraft● Helicopters● Defence and Space
* Commercial Order Intake and Order Book based on list prices
€ 1,030 bnt/o defence € 37.7 bn
€ 13 bnt/o defence € 1.9 bn
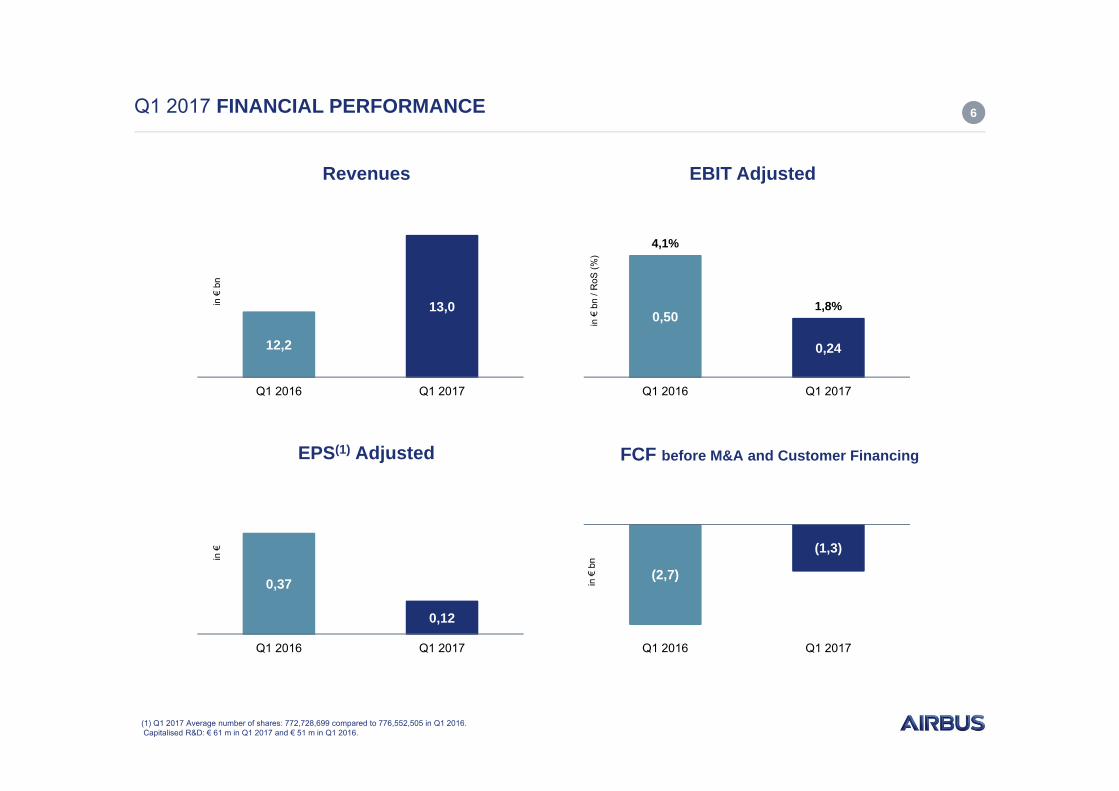
6Q1 2017 FINANCIAL PERFORMANCE
Revenues
(1) Q1 2017 Average number of shares: 772,728,699 compared to 776,552,505 in Q1 2016. Capitalised R&D: € 61 m in Q1 2017 and € 51 m in Q1 2016.
EPS(1) Adjusted
in €
bnin
€
in €
bn/ R
oS(%
)in
€bn
EBIT Adjusted
FCF before M&A and Customer Financing
12,2
13,0
Q1 2016 Q1 2017
0,50
0,24
4,1%
1,8%
Q1 2016 Q1 2017
0,37
0,12
Q1 2016 Q1 2017
(2,7)
(1,3)
Q1 2016 Q1 2017

7Q1 2017 PROFITABILITY
Q1 2017 EBIT reported of € 0.9 bn
Q1 2017 Adjustments resulting from:
€ + 560 m Defence Electronics net capital gain€ + 55 m $ PDP mismatch / BS Revaluation€ - 3 m Other AD Portfolio
€ + 612 m Net Adjustments
Q1 2017 Net Income of € 0.6 bn
Q1 2017 Net Income Adjusted of € 0.1 bn
Q1 2017 tax rate on core business is 28%
EBIT Performance
EPS Performance
in €
bnin
€
Average number of shares: Q1 2017= 772,728,699, Q1 2016= 776,552,505
0,500,36
0,24
0,85
EBIT Adjusted EBIT Reported
Q1 2016 Q1 2017
0,370,51
0,12
0,79
EPS Adjusted EPS Reported
Q1 2016 Q1 2017

Q1 2017 CASH EVOLUTION 8
(1) Excluding net customer financing (2) Excluding net customer financing (3) Thereof Capex of € - 0.5 bn; (4) M&A transactions include acquisitions and disposals of subsidiaries and businesses
IN € BILLION
Free Cash Flow before M&A and customer financing: -1.3
(1) (2)(3)
(4)
11,1
9,8
Net Cashposition Dec.
2016
Gross Cash Flowfrom Operations
Change inWorking Capital
Cash used forinvesting
activities beforeM&A
CustomerFinancing
M&A Pensions &Others
Net Cashposition Mar.
2017
-1.0
-0.3-0.3
0.5
-0.2
0.1
Q1 Results2017
CompanyHighlights
DivisionalHighlights
GuidanceHighlights
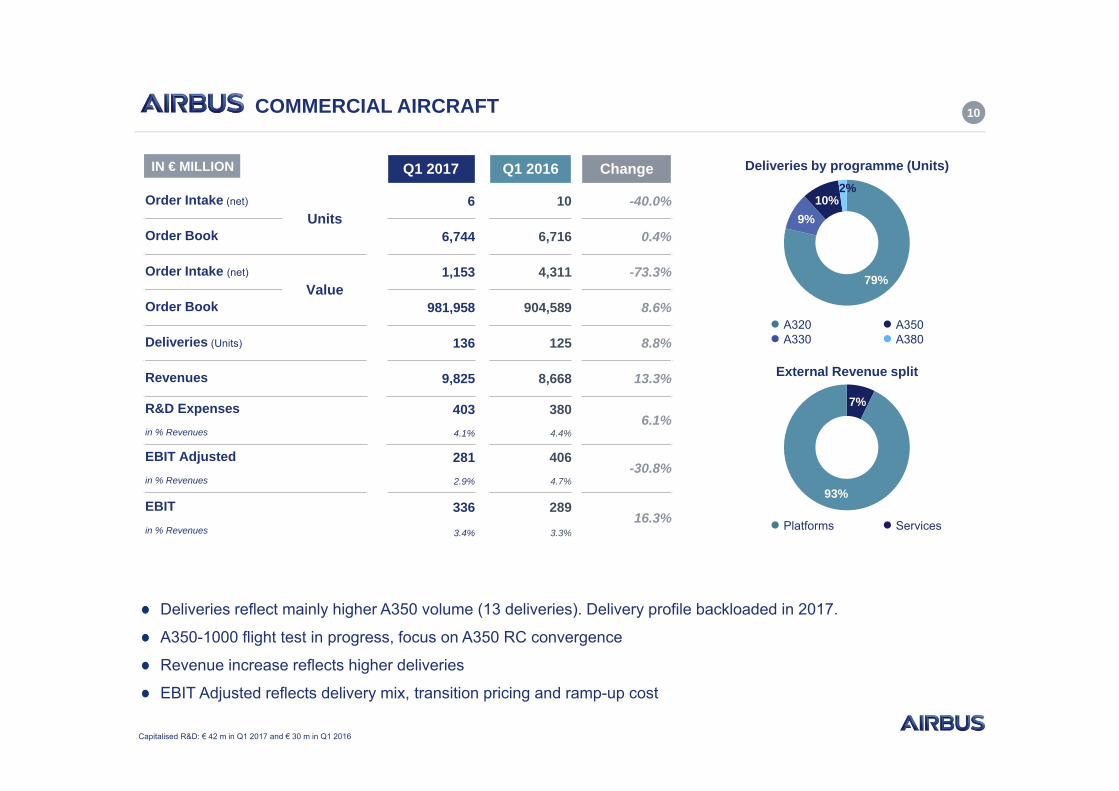
Q1 2017 Q1 2016 Change
Order Intake (net)
Units6 10 -40.0%
Order Book 6,744 6,716 0.4%
Order Intake (net)
Value1,153 4,311 -73.3%
Order Book 981,958 904,589 8.6%
Deliveries (Units) 136 125 8.8%
Revenues 9,825 8,668 13.3%
R&D Expenses 403 3806.1%
in % Revenues 4.1% 4.4%
EBIT Adjusted 281 406-30.8%
in % Revenues 2.9% 4.7%
EBIT 336 28916.3%
in % Revenues 3.4% 3.3%
10COMMERCIAL AIRCRAFT
Deliveries reflect mainly higher A350 volume (13 deliveries). Delivery profile backloaded in 2017.
A350-1000 flight test in progress, focus on A350 RC convergence
Revenue increase reflects higher deliveries
EBIT Adjusted reflects delivery mix, transition pricing and ramp-up cost
Deliveries by programme (Units)
External Revenue split
IN € MILLION
● Platforms ● Services
Capitalised R&D: € 42 m in Q1 2017 and € 30 m in Q1 2016
79%
9%10%
2%
7%
93%
● A320● A330
● A350● A380
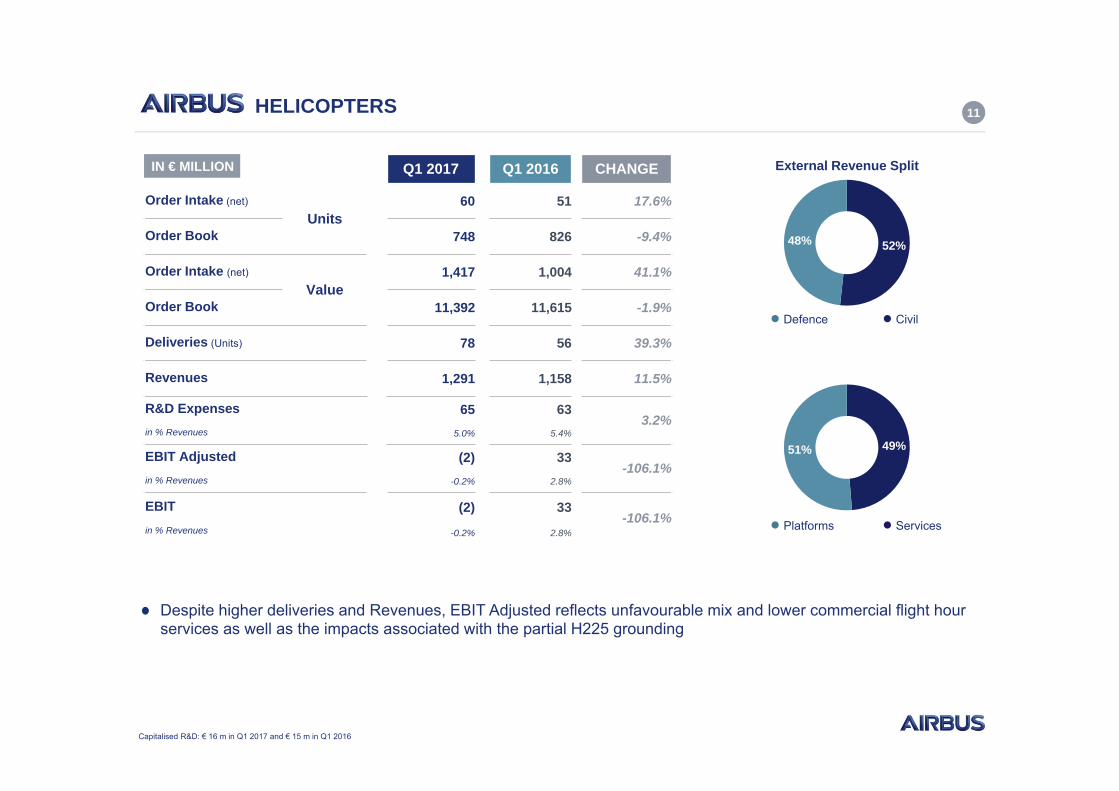
Q1 2017 Q1 2016 CHANGE
Order Intake (net)
Units60 51 17.6%
Order Book 748 826 -9.4%
Order Intake (net)
Value1,417 1,004 41.1%
Order Book 11,392 11,615 -1.9%
Deliveries (Units) 78 56 39.3%
Revenues 1,291 1,158 11.5%
R&D Expenses 65 633.2%
in % Revenues 5.0% 5.4%
EBIT Adjusted (2) 33-106.1%
in % Revenues -0.2% 2.8%
EBIT (2) 33-106.1%
in % Revenues -0.2% 2.8%
11HELICOPTERS
External Revenue Split
● Platforms ● Services
Despite higher deliveries and Revenues, EBIT Adjusted reflects unfavourable mix and lower commercial flight hour services as well as the impacts associated with the partial H225 grounding
Capitalised R&D: € 16 m in Q1 2017 and € 15 m in Q1 2016
49%51%
IN € MILLION
52%48%
● Defence ● Civil

Q1 2017 Q1 2016 CHANGE
Order Intake (net) 1,521 2,515 -39.5%
Order Book 39,421 42,596 -7.5%
Revenues 2,114 2,534 -16.6%
R&D Expenses 60 66-9.1%
in % Revenues 2.8% 2.6%
EBIT Adjusted 63 107-41.1%
in % Revenues 3.0% 4.2%
EBIT 620 88604.5%
in % Revenues 29.3% 3.5%
12DEFENCE AND SPACE
IN € MILLION
Decrease in Revenues driven by perimeter change impact from portfolio reshaping. Q1 2017 deconsolidation impact on Revenues ~ € -0.5bn
EBIT Adjusted mainly reflects perimeter change
Underlying business performing in line with expectations
A400M: 4 a/c delivered in Q1. Execution and capability enhancement remain areas of concern
External Revenue Split
(1) Communications, Intelligence & SecurityCapitalised R&D: € 3 m in Q1 2017 and € 6 m in Q1 2016
31%
69%
28%
44%
28%
● Platforms ● Services
● Space Systems● Military Aircraft
● CIS(1) & Others
Q1 Results2017
CompanyHighlights
DivisionalHighlights
GuidanceHighlights

142017 GUIDANCE
As the basis for its 2017 guidance, Airbus expects the world economy and air traffic to grow in line with prevailing independent forecasts, which assume no major disruptionsAirbus 2017 earnings and FCF guidance is based on a constant perimeter
Airbus expects to deliver more than 700 commercial aircraft
Before M&A, Airbus expects mid-single-digit % growth in EBIT Adjusted and EPS Adjustedcompared to 2016
Free Cash Flow is expected to be similar to 2016 before M&A and Customer Financing
The perimeter change in Defence and Space is expected to reduce EBIT Adjusted and Free CashFlow before M&A and Customer Financing by around € 150 million and EPS Adjusted by around14 cents
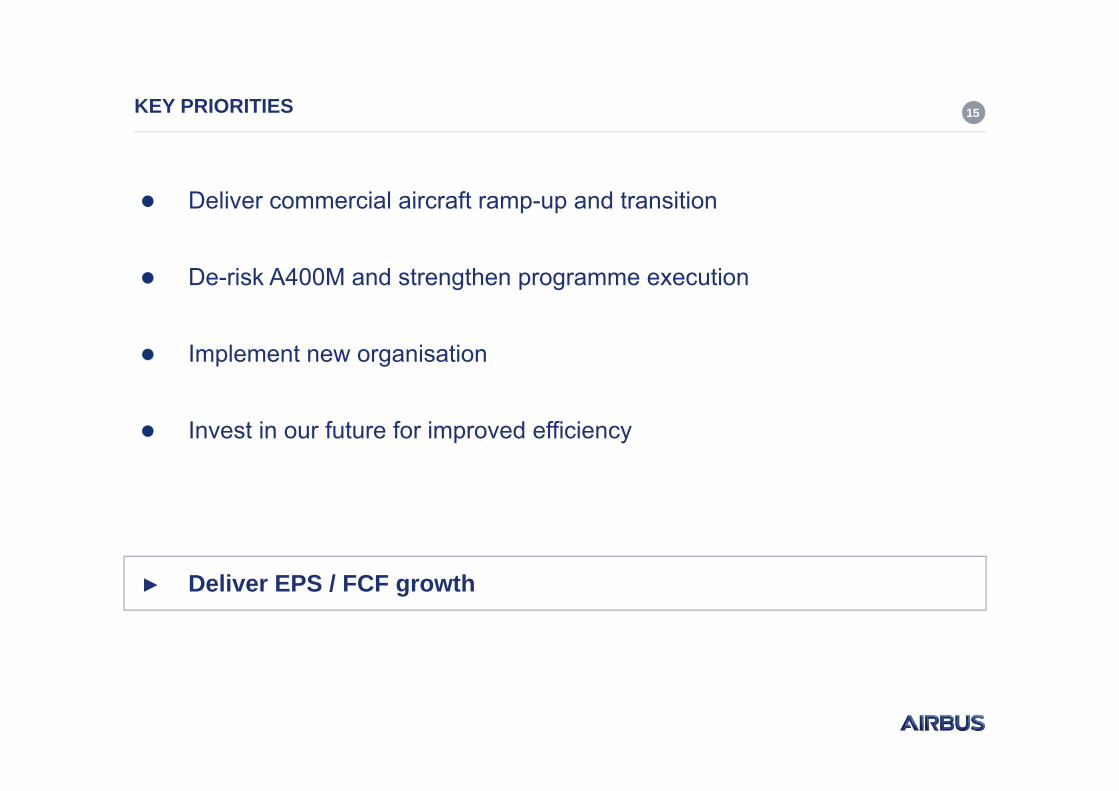
KEY PRIORITIES 15
Deliver commercial aircraft ramp-up and transition
De-risk A400M and strengthen programme execution
Implement new organisation
Invest in our future for improved efficiency
► Deliver EPS / FCF growth
Q1 Results2017
APPENDIX
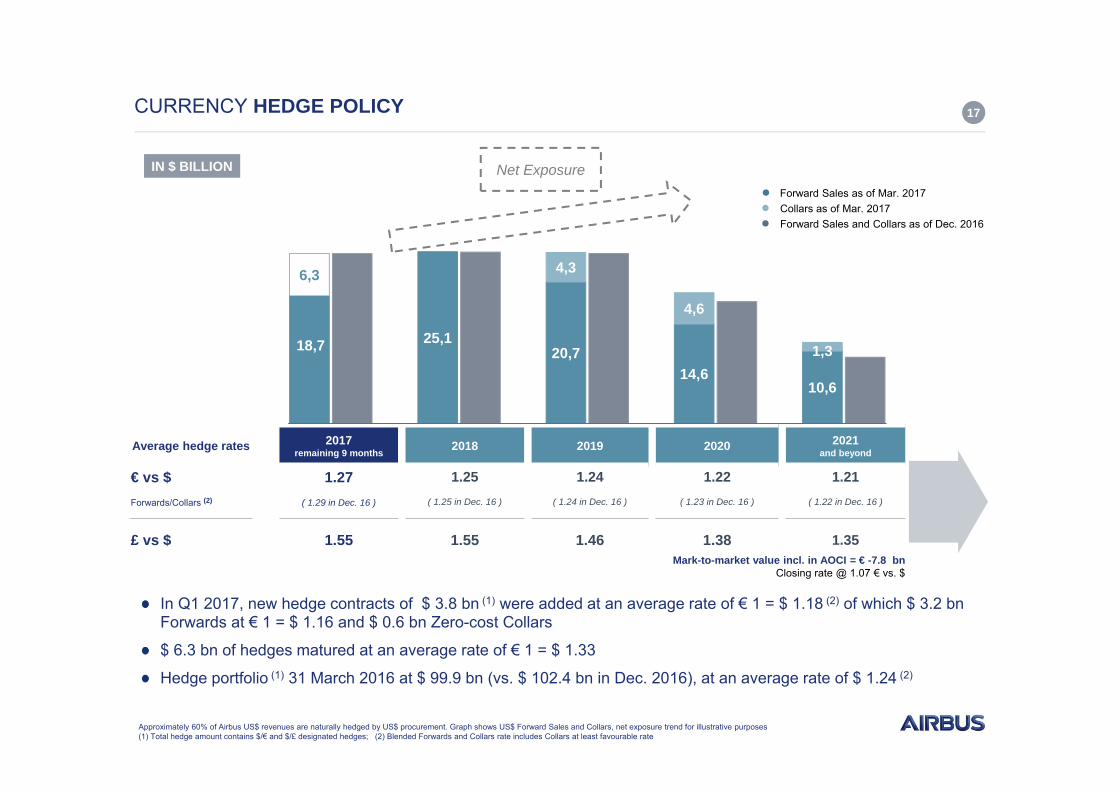
17CURRENCY HEDGE POLICY
Net Exposure
In Q1 2017, new hedge contracts of $ 3.8 bn (1) were added at an average rate of € 1 = $ 1.18 (2) of which $ 3.2 bn Forwards at € 1 = $ 1.16 and $ 0.6 bn Zero-cost Collars
$ 6.3 bn of hedges matured at an average rate of € 1 = $ 1.33
Hedge portfolio (1) 31 March 2016 at $ 99.9 bn (vs. $ 102.4 bn in Dec. 2016), at an average rate of $ 1.24 (2)
Average hedge rates 2017remaining 9 months 2018 2019 2020 2021
and beyond
€ vs $Forwards/Collars (2)
1.27( 1.29 in Dec. 16 )
1.25( 1.25 in Dec. 16 )
1.24( 1.24 in Dec. 16 )
1.22( 1.23 in Dec. 16 )
1.21( 1.22 in Dec. 16 )
£ vs $ 1.55 1.55 1.46 1.38 1.35
IN $ BILLION
Approximately 60% of Airbus US$ revenues are naturally hedged by US$ procurement. Graph shows US$ Forward Sales and Collars, net exposure trend for illustrative purposes (1) Total hedge amount contains $/€ and $/£ designated hedges; (2) Blended Forwards and Collars rate includes Collars at least favourable rate
● Forward Sales as of Mar. 2017● Collars as of Mar. 2017● Forward Sales and Collars as of Dec. 2016
Mark-to-market value incl. in AOCI = € -7.8 bnClosing rate @ 1.07 € vs. $
18,7 25,120,7
14,610,6
6,3 4,3
4,6
1,3

1.33
1.29
1.27
1.25
1.341.33
1.31
1.30
1.231.241.251.261.271.281.291.301.311.321.331.341.351.361.371.38
Q1 Q2 Q3 Q4
FY 2017 E FY 2016
EXPECTED AIRBUS AVERAGE HEDGE RATES € VS. $ 18
Active exposure management
(1)
Average Hedge Rates
FY 2016 1.32
FY 2017E 1.29
(1) Q1 actual

Bridge
Hedge rates (from €/$ 1.34 to €/$ 1.33) 0.00
Other one-off forex effect including PDP reversal 0.19
Compared to Q1 2016 0.19
19Q1 2017 FOREX EBIT IMPACT BRIDGE
IN € BILLION

20Q1 2017 DETAILED INCOME STATEMENT AND ADJUSTMENTS
Defence and Space Commercial Aircraft
EBIT 852 557 55 240in % of revenues 6.6% 1.8%
Interest income 39 39
Interest expenses (127) (127)
Other Financial Result (118) (97) (21)
Finance Result (206) (97) (109)
Income before taxes 646 557 55 (97) 131
Non-controlling interest (1) (1)
Net Income reported 608 93Number of shares 772,728,699 772,728,699
EPS reported (in €) 0.79 0.12
Net Income Adjusted excludes the following items:
Adjustments impacting the EBIT line (as reported in the EBIT Adjusted)
The Other Financial Result, except for the unwinding of discount on provisions
The tax effect on Adjusted Income before taxes is calculated at 28%
thereof Adjustments
Impact on EBIT
Q1 2017 Operational FX Financial Result
Q1 2017Adjusted
IN € MILLION

21Q1 2016 DETAILED INCOME STATEMENT AND ADJUSTMENTS
Commercial Aircraft
Defence and Space
Commercial Aircraft
EBIT 362 19 (19) (136) 498in % of revenues 3.0% 4.1%
Interest income 75 75
Interest expenses (143) (143)
Other Financial Result 261 284 (23)
Finance Result 193 284 (91)
Income before taxes 555 19 (19) (136) 284 407
Non-controlling interest 1 1
Net Income reported 399 290Number of shares 776,552,505 776,552,505
EPS reported (in €) 0.51 0.37
Net Income Adjusted excludes the following items:
Adjustments impacting the EBIT line (as reported in the EBIT Adjusted)
The Other Financial Result, except for the unwinding of discount on provisions
The tax effect on Adjusted Income before taxes is calculated at 29%
thereof Adjustments
Impact on EBIT
Q1 2016 Operational FX Financial Result
Q1 2016 Adjusted
IN € MILLION
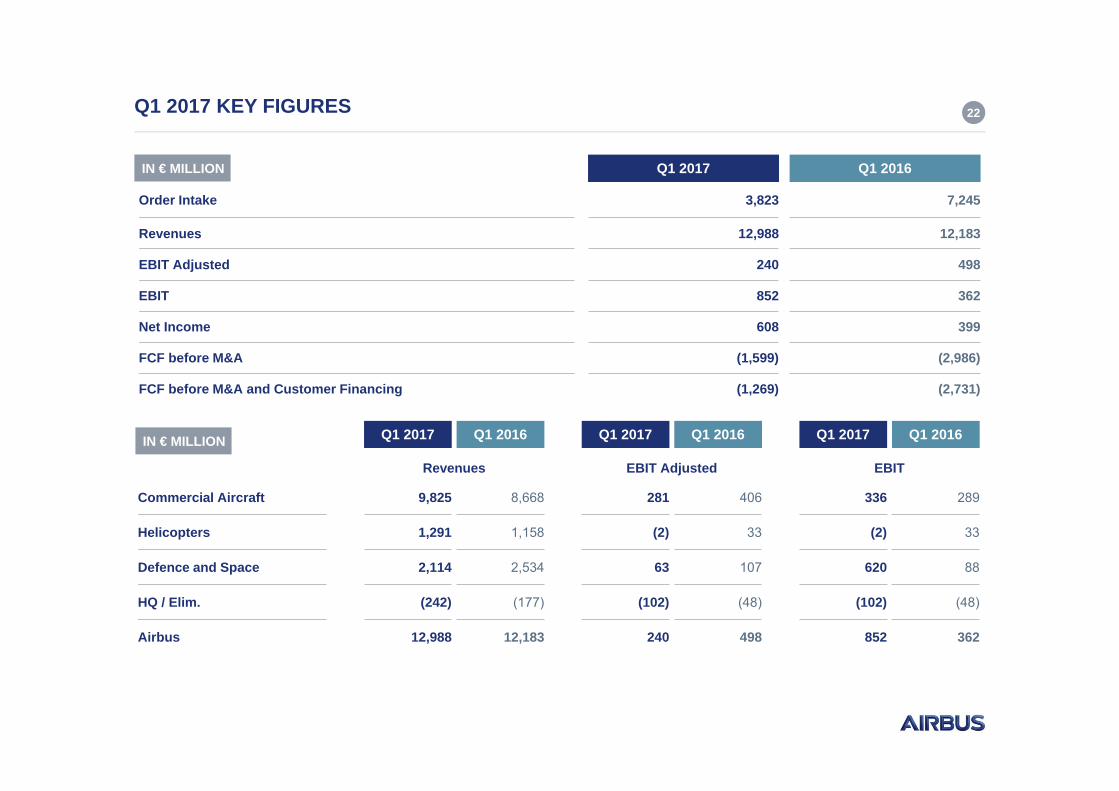
Q1 2017 KEY FIGURES 22
Q1 2017 Q1 2016
Order Intake 3,823 7,245
Revenues 12,988 12,183
EBIT Adjusted 240 498
EBIT 852 362
Net Income 608 399
FCF before M&A (1,599) (2,986)
FCF before M&A and Customer Financing (1,269) (2,731)
IN € MILLION
Commercial Aircraft 9,825 8,668 281 406 336 289
Helicopters 1,291 1,158 (2) 33 (2) 33
Defence and Space 2,114 2,534 63 107 620 88
HQ / Elim. (242) (177) (102) (48) (102) (48)
Airbus 12,988 12,183 240 498 852 362
IN € MILLION Q1 2017 Q1 2016 Q1 2017 Q1 2016 Q1 2017 Q1 2016
Revenues EBIT Adjusted EBIT

AIRBUS STRONG LIQUIDITY POSITION AS AT 31 MARCH 2017 23
€ 20.3 bn
Total Gross Cash
€ 9.8 bn
Net Cash
Invested in highly rated securities
€ 10.6 bn
Financing Liabilities
€ 3.0 bn
Credit Facility (RSCF)
Credit Facility:
Maturity 2021, undrawn Fully committed by 40 banks No financial covenants, no MAC clause
Financing Liabilities:
of which long-term : € 8.7 bn Includes € 3.5 bn EMTN, € 0.5 bn
Convertible Bond, € 1.1 bn exchangeable bond and $ 1 bn USD 144A/RegS
Credit Ratings:
Short-term rating: S & P: A-1+Moody´s: P-1
Long-term rating: S & P: A+ stableMoody’s: A2 stable
(1) US Debt Capital Markets: On April 10, Airbus issued $1.5bn under 144A Rule as a dual-tranche: $ 750 m with 10y maturity and $ 750 m with a 30y maturity
(1)
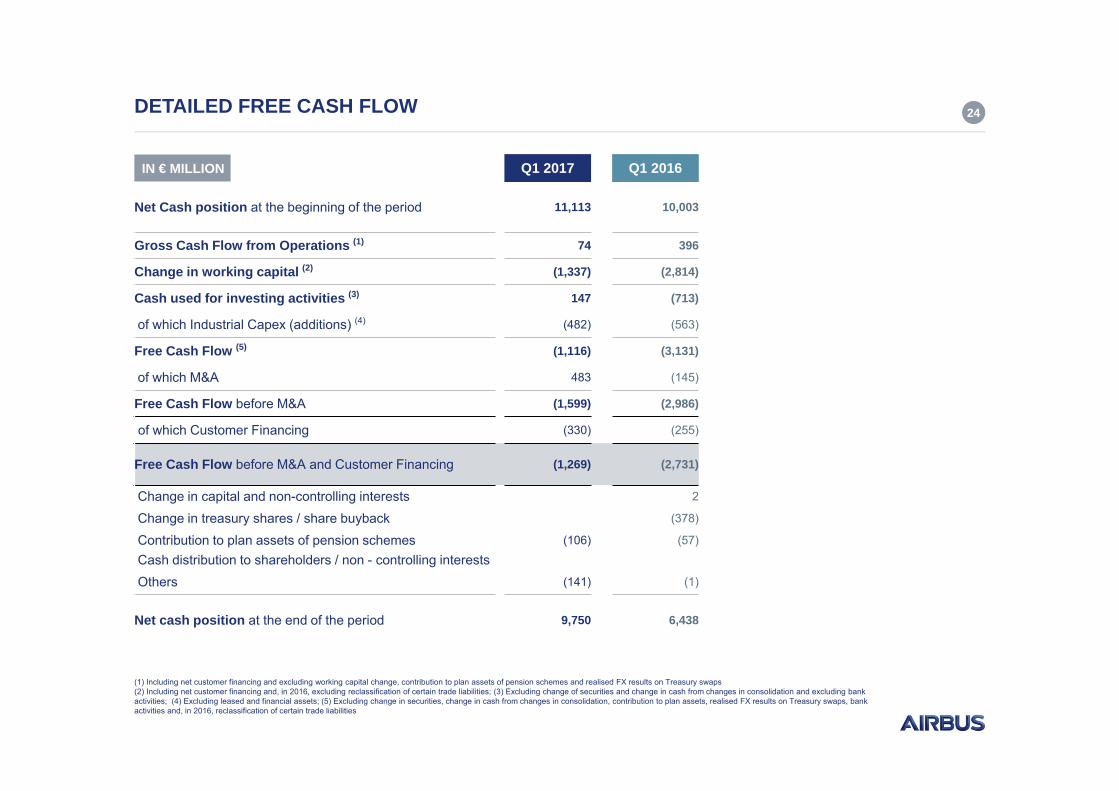
24DETAILED FREE CASH FLOW
(1) Including net customer financing and excluding working capital change, contribution to plan assets of pension schemes and realised FX results on Treasury swaps(2) Including net customer financing and, in 2016, excluding reclassification of certain trade liabilities; (3) Excluding change of securities and change in cash from changes in consolidation and excluding bank activities; (4) Excluding leased and financial assets; (5) Excluding change in securities, change in cash from changes in consolidation, contribution to plan assets, realised FX results on Treasury swaps, bank activities and, in 2016, reclassification of certain trade liabilities
Q1 2017 Q1 2016
Net Cash position at the beginning of the period 11,113 10,003
Gross Cash Flow from Operations (1) 74 396
Change in working capital (2) (1,337) (2,814)
Cash used for investing activities (3) 147 (713)
of which Industrial Capex (additions) (4) (482) (563)
Free Cash Flow (5) (1,116) (3,131)
of which M&A 483 (145)
Free Cash Flow before M&A (1,599) (2,986)
of which Customer Financing (330) (255)
Free Cash Flow before M&A and Customer Financing (1,269) (2,731)
Change in capital and non-controlling interests 2
Change in treasury shares / share buyback (378)
Contribution to plan assets of pension schemes (106) (57)
Cash distribution to shareholders / non - controlling interestsOthers (141) (1)
Net cash position at the end of the period 9,750 6,438
IN € MILLION

25NET CASH POSITION
Mar. 2017 Dec. 2016
Gross Cash 20,324 21,591
Financing Debts (10,574) (10,478)
Short-term Financing Debts (1,839) (1,687)
Long-term Financing Debts (8,735) (8,791)
Reported Net Cash 9,750 11,113
Airbus non-recourse debt 46 43
Net Cash excl. non-recourse 9,796 11,156
IN € MILLION
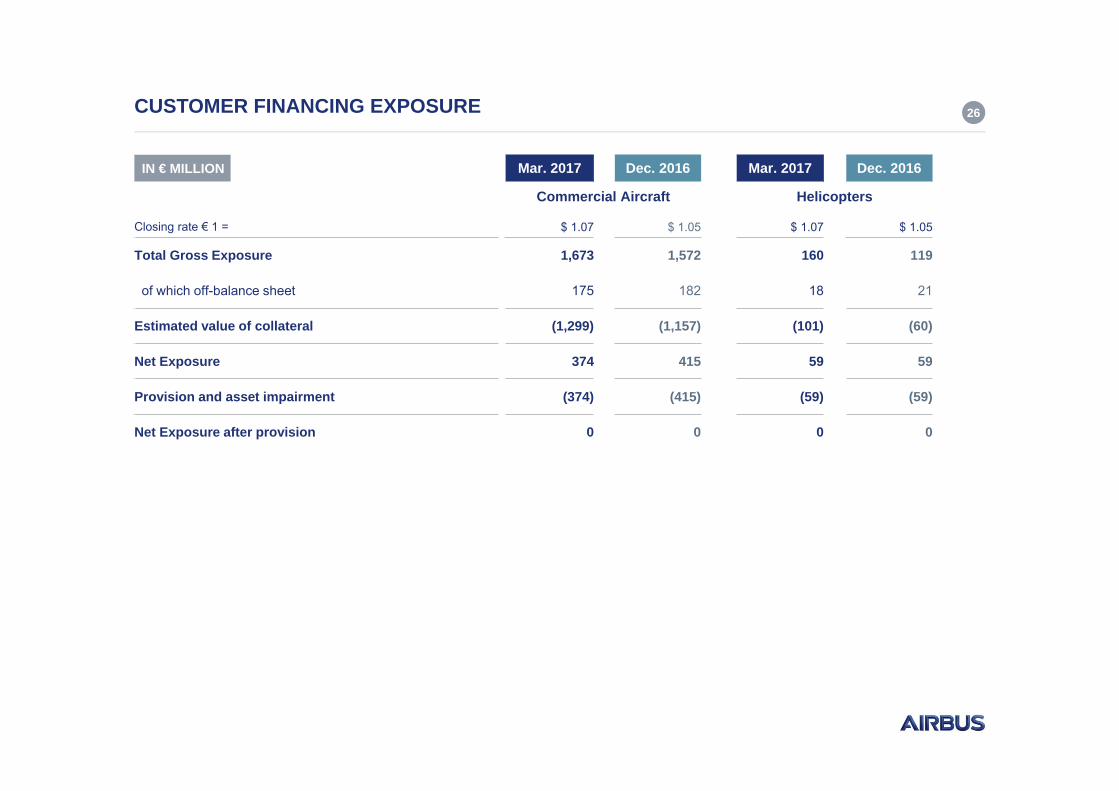
26CUSTOMER FINANCING EXPOSURE
Closing rate € 1 = $ 1.07 $ 1.05 $ 1.07 $ 1.05
Total Gross Exposure 1,673 1,572 160 119
of which off-balance sheet 175 182 18 21
Estimated value of collateral (1,299) (1,157) (101) (60)
Net Exposure 374 415 59 59
Provision and asset impairment (374) (415) (59) (59)
Net Exposure after provision 0 0 0 0
IN € MILLION Mar. 2017 Dec. 2016 Mar. 2017 Dec. 2016
Commercial Aircraft Helicopters

AIRBUS COMMERCIAL AIRCRAFT CUSTOMER FINANCING 27
IN € BILLION
Gross Exposure in $ bn 3.9 3.1 3.8 4.8 4.6 3.8 1.8 1.5 1.5 1.8 1.7 1.4 1.5 1.6 1.3 1.5 1.7 1.8
Commercial Aircraft Customer Financing
Gross Exposure
Net Exposure fully provisionedNet Exposure fully provisioned
31 December 2016€/$ = 1.05
31 March 2017€/$ = 1.07
Net Exposure€ 0.4 bn
0,6 0,5
1,5 1,5
1,0 0,9
0,4
0,8
0,30,6 0,8
0,5 0,61,0
0,60.9 0,9
0,5
(0,9) (0,7) (0,7) (0,2) (1,0)(1,3) (2,2)
(1,1)(0,2) (0,2) (0,7) (0,7)
(0,3)(0,7) (0,7)
(0,6) (0,5) (0,4)
(0,1)(0,2) (0,2)
(0,3)
(0,3)(0,2)
(0,2)
(0,1)
(0,1) (0,1)(0,2) (0,1)
(0,1)(0,1) (0,2)
(0,1) (0,2)(0,0)
2000 2001 2002 2003 2004 2005 2006 2007 2008 2009 2010 2011 2012 2013 2014 2015 2016 Q1 2017
Additions Sell Down Amortization Net change
Net Exposure€ 0.4 bnGross
Exposure€ 1.6 bn
($ 1.7 bn)
EstimatedCollateral€ 1.2 bn
($ 1.4 bn)
GrossExposure€ 1.7 bn
($ 1.8 bn)
EstimatedCollateral€ 1.3 bn
($ 1.4 bn)
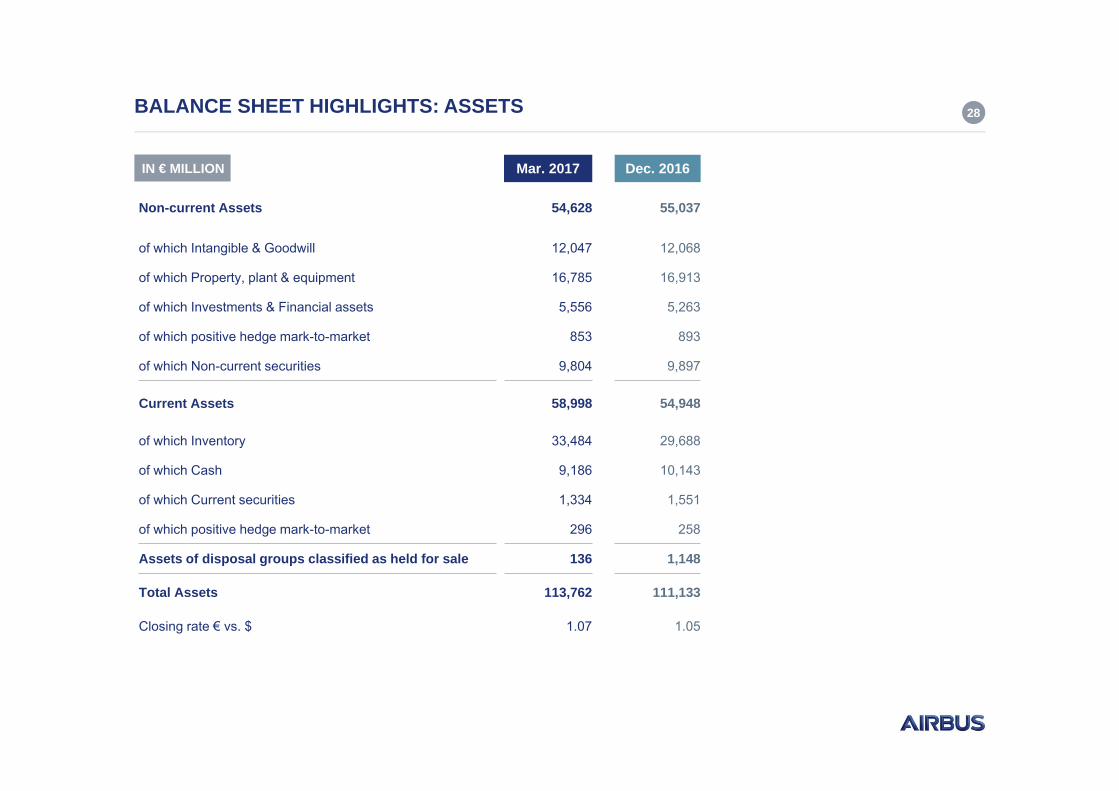
28BALANCE SHEET HIGHLIGHTS: ASSETS
Mar. 2017 Dec. 2016
Non-current Assets 54,628 55,037
of which Intangible & Goodwill 12,047 12,068
of which Property, plant & equipment 16,785 16,913
of which Investments & Financial assets 5,556 5,263
of which positive hedge mark-to-market 853 893
of which Non-current securities 9,804 9,897
Current Assets 58,998 54,948
of which Inventory 33,484 29,688
of which Cash 9,186 10,143
of which Current securities 1,334 1,551
of which positive hedge mark-to-market 296 258
Assets of disposal groups classified as held for sale 136 1,148
Total Assets 113,762 111,133
Closing rate € vs. $ 1.07 1.05
IN € MILLION
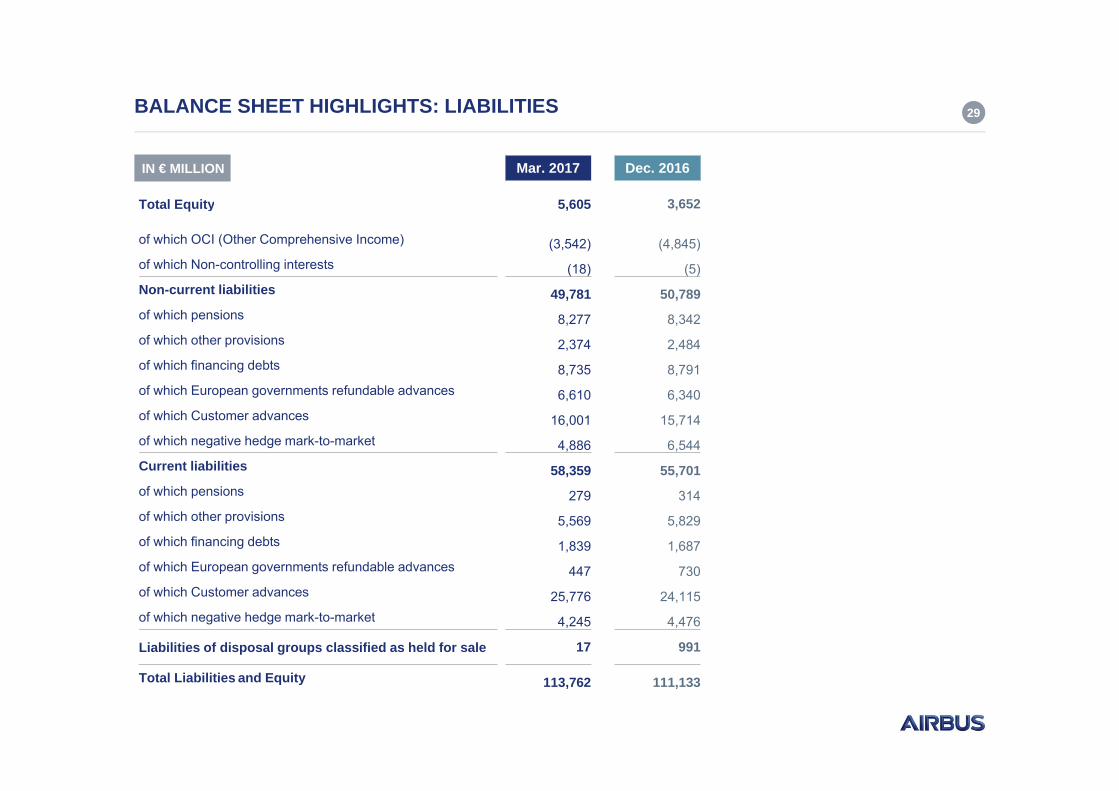
29BALANCE SHEET HIGHLIGHTS: LIABILITIES
Mar. 2017 Dec. 2016
Total Equity 5,605 3,652
of which OCI (Other Comprehensive Income) (3,542) (4,845)of which Non-controlling interests (18) (5)Non-current liabilities 49,781 50,789of which pensions 8,277 8,342of which other provisions 2,374 2,484of which financing debts 8,735 8,791of which European governments refundable advances 6,610 6,340of which Customer advances 16,001 15,714of which negative hedge mark-to-market 4,886 6,544Current liabilities 58,359 55,701of which pensions 279 314of which other provisions 5,569 5,829of which financing debts 1,839 1,687of which European governments refundable advances 447 730of which Customer advances 25,776 24,115of which negative hedge mark-to-market 4,245 4,476
Liabilities of disposal groups classified as held for sale 17 991
Total Liabilities and Equity 113,762 111,133
IN € MILLION

SOGEPA
GZBV
SEPI
30SHAREHOLDING STRUCTURE AS AT 31 MARCH 2017
Shareholder Agreement
Free Float
Treasury shares
73.6%
26.4%
0.0%
73.6%
11.1%
11.1%
4.2%
772,912,869 shares issued as at 31 March 2017
11.1%
11.1%
4.2%

31QUARTERLY ORDER INTAKE BREAKDOWN (CUMULATIVE)
IN € MILLION
Commercial Aircraft 1,153 4,311 32,302 63,103 114,938
Helicopters 1,417 1,004 2,338 3,588 6,057
Defence and Space (1) 1,521 2,515 5,189 8,189 15,393
HQ / Elim. (268) (585) (694) (1,662) (1,908)
Airbus 3,823 7,245 39,135 73,218 134,480
Q1 H1 9m FY
2017 2016 2017 2016 2017 2016 2017 2016
(1) Defence and Space figures reflect perimeter change impact

32QUARTERLY ORDER BOOK BREAKDOWN (CUMULATIVE)
Commercial Aircraft 981,958 904,589 930,885 939,079 1,010,200
Helicopters 11,392 11,615 11,421 11,075 11,269
Defence and Space (1) 39,421 42,596 37,665 38,355 41,499
HQ / Elim. (2,613) (1,820) (1,884) (2,508) (2,521)
Airbus 1,030,158 956,980 978,087 986,001 1,060,447
IN € MILLION Q1 H1 9m FY
2017 2016 2017 2016 2017 2016 2017 2016
(1) Defence and Space figures reflect perimeter change impact

33QUARTERLY REVENUES BREAKDOWN (CUMULATIVE)
Commercial Aircraft 9,825 8,668 21,061 31,511 49,237
Helicopters 1,291 1,158 2,687 4,282 6,652
Defence and Space (1) 2,114 2,534 5,440 7,714 11,854
HQ / Elim. (242) (177) (433) (802) (1,162)
Airbus 12,988 12,183 28,755 42,705 66,581
IN € MILLION Q1 H1 9m FY
2017 2016 2017 2016 2017 2016 2017 2016
(1) Defence and Space figures reflect perimeter change impact

34QUARTERLY EBIT BREAKDOWN (CUMULATIVE)
Commercial Aircraft 336 289 420 773 1,543
Helicopters (2) 33 144 200 308
Defence and Space (1) 620 88 475 579 (93)
HQ / Elim. (102) (48) 812 804 500
Airbus 852 362 1,851 2,356 2,258
IN € MILLION Q1 H1 9m FY
2017 2016 2017 2016 2017 2016 2017 2016
(1) Defence and Space figures reflect perimeter change impact

35QUARTERLY EBIT ADJUSTED BREAKDOWN (CUMULATIVE)
Commercial Aircraft 281 406 1,269 1,836 2,811
Helicopters (2) 33 144 200 350
Defence and Space (1) 63 107 322 436 1,002
HQ / Elim. (102) (48) (56) (64) (208)
Airbus 240 498 1,679 2,408 3,955
IN € MILLION Q1 H1 9m FY
2017 2016 2017 2016 2017 2016 2017 2016
(1) Defence and Space figures reflect perimeter change impact

Q1 2017 IFRS VS. APM CASH FLOW RECONCILIATION 36
IN € BILLION IN € BILLION Q1 17
Cash provided by operating activities (1.4)
t/o Reimbursement from / contribution to plan assets (0.1)
t/o Treasury swaps 0.0
t/o Change in working capital (1.3)
Gross Cash Flow from Operations 0.1
Q1 17
Cash provided by operating activities (1.4)
Cash provided by (used for) investing activities 0.3
t/o Payment for investments in securities (0.5)
t/o Proceeds from disposals of securities 0.8
Others 0.3
Free Cash Flow (1.1)
t/o Disposal of NCA (incl. DE) 0.6
t/o Proceeds from disposals of subs 0.0
t/o Others M&A transactions (0.1)
Free Cash Flow before M&A (1.6)
t/o Customer Financing (0.3)
FCF before M&A and Customer Financing (1.3)
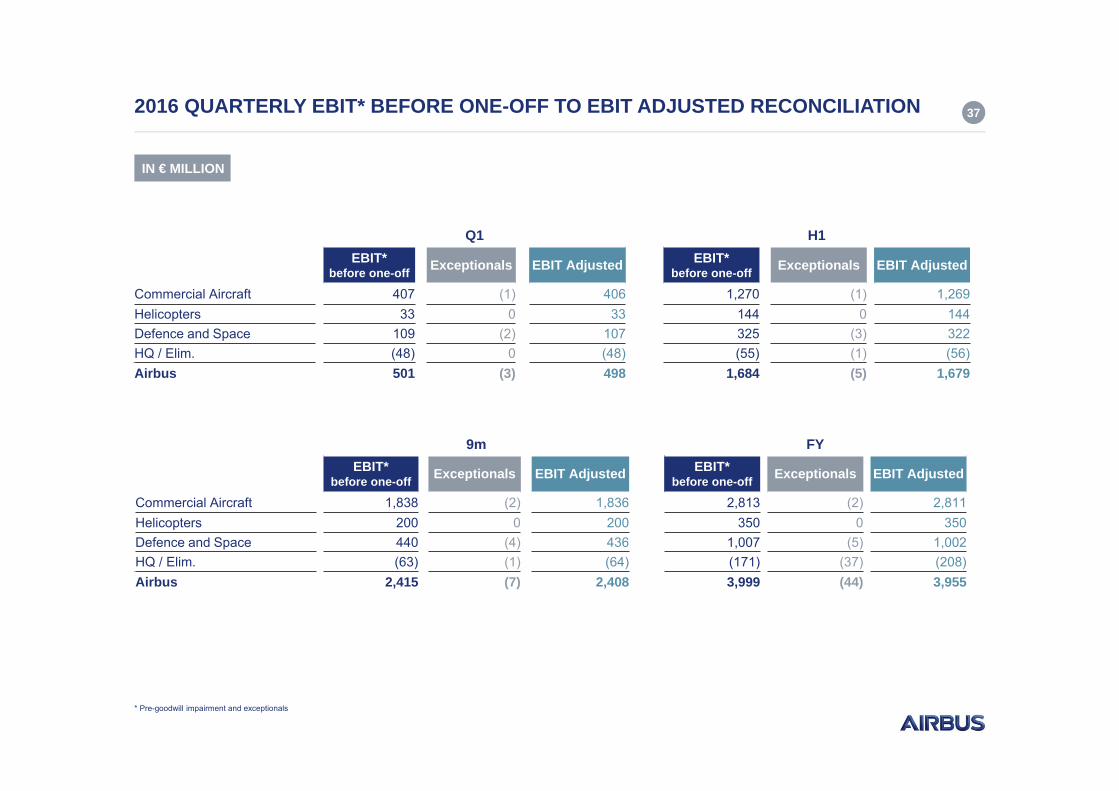
2016 QUARTERLY EBIT* BEFORE ONE-OFF TO EBIT ADJUSTED RECONCILIATION 37
IN € MILLION
Q1 H1EBIT*
before one-off Exceptionals EBIT Adjusted EBIT*before one-off Exceptionals EBIT Adjusted
Commercial Aircraft 407 (1) 406 1,270 (1) 1,269Helicopters 33 0 33 144 0 144Defence and Space 109 (2) 107 325 (3) 322HQ / Elim. (48) 0 (48) (55) (1) (56)Airbus 501 (3) 498 1,684 (5) 1,679
9m FYEBIT*
before one-off Exceptionals EBIT Adjusted EBIT*before one-off Exceptionals EBIT Adjusted
Commercial Aircraft 1,838 (2) 1,836 2,813 (2) 2,811Helicopters 200 0 200 350 0 350Defence and Space 440 (4) 436 1,007 (5) 1,002HQ / Elim. (63) (1) (64) (171) (37) (208)Airbus 2,415 (7) 2,408 3,999 (44) 3,955
* Pre-goodwill impairment and exceptionals

GLOSSARY ON ALTERNATIVE PERFORMANCE MEASURES (APM) 38
The following Presentation also contains certain “non-GAAP financial measures”, i.e. financial measures that either exclude or include amounts that are not excluded or included in the most directly comparable measure calculated and presented in accordance with IFRS. For example, Airbus makes use of the non-GAAP measures “EBIT Adjusted”, “EPS Adjusted” and “Free Cash Flow”.Airbus uses these non-GAAP financial measures to assess its consolidated financial and operating performance and believes they are helpful in identifying trends in its performance. These measures enhance management’s ability to make decisions with respect to resource allocation and whether Airbus is meeting established financial goals.Non-GAAP financial measures have certain limitations as analytical tools, and should not be considered in isolation or as substitutes for analysis of Airbus’ results as reported under IFRS. Because of these limitations, they should not be considered substitutes for the relevant IFRS measures.• EBIT: Airbus continues to use the term EBIT (Earnings before interest and taxes). It is identical to Profit before finance cost and income taxes as defined by
IFRS Rules.• Adjustment is an alternative performance measure used by Airbus which includes material charges or profits caused by movements in provisions related to
programmes, restructuring or foreign exchange impacts as well as capital gains/losses from the disposal and acquisition of businesses.• EBIT Adjusted: Airbus uses an alternative performance measure, EBIT Adjusted as a key indicator capturing the underlying business margin by excluding
material charges or profits caused by movements in provisions related to programmes, restructuring or foreign exchange impacts as well as capitalgains/losses from the disposal and acquisition of businesses.
• EPS Adjusted is an alternative performance measure of a basic EPS as reported whereby the net income as the numerator does include Adjustments. Forreconciliation see slide 20.
• Gross Cash position: Airbus defines its consolidated gross cash position as the sum of (i) cash and cash equivalents and (ii) securities (all as recorded inthe consolidated statement of financial position).
• Net cash position: Airbus defines its consolidated net cash position as the sum of (i) cash and cash equivalents and (ii) securities, minus (iii) financingliabilities (all as recorded in the consolidated statement of financial position) as defined in MD&A section 2.1.6.
• Gross cash flow from operations: Gross cash flow from operations is an alternative performance measure and an indicator used by Airbus to measure itsoperating cash performance before changes in working capital. It is defined in Registration Document, MD&A section 2.1.6 as cash provided by operatingactivities, excluding (i) changes in other operating assets and liabilities (working capital), (ii) contribution to plan assets of pension schemes and (iii) realisedforeign exchange results on Treasury swaps.
• Change in working capital: it is identical to changes in other operating assets and liabilities as defined by IFRS Rules. It is comprised of inventories, tradereceivables, other assets and prepaid expenses netted against trade liabilities, other liabilities (including customer advances), deferred income andcustomer financing.
• FCF: For the definition of the alternative performance measure free cash flow, see Registration Document, MD&A section 2.1.6.1. It is a key indicator whichallows the Company to measure the amount of cash flow generated from operations after cash used in investing activities.
• FCF before M&A refers to FCF as defined in the Registration Document, MD&A section 2.1.6.1 adjusted for net proceeds from disposals and acquisitions.It is an alternative performance measure and indicator that is important in order to measure FCF excluding those cash flows from the disposal andacquisition of businesses.
• FCF before M&A and customer financing refers to free cash flow before mergers and acquisitions adjusted for cash flow related to aircraft financingactivities. It is an alternative performance measure and indicator that may be used from time to time by the Company in its financial guidance, esp. whenthere is higher uncertainty around customer financing activities, such as during the suspension of ECA financing support.