airborne disease transmission via bioaerosols: formation
TRANSCRIPT

Airborne Disease Transmission viaBioaerosols: Formation Mechanismsand the Influence of Viscoelasticity
The Harvard community has made thisarticle openly available. Please share howthis access benefits you. Your story matters
Citation Thomas, Matthew K. 2012. Airborne Disease Transmissionvia Bioaerosols: Formation Mechanisms and the Influence ofViscoelasticity. Doctoral dissertation, Harvard University.
Citable link http://nrs.harvard.edu/urn-3:HUL.InstRepos:10436309
Terms of Use This article was downloaded from Harvard University’s DASHrepository, and is made available under the terms and conditionsapplicable to Other Posted Material, as set forth at http://nrs.harvard.edu/urn-3:HUL.InstRepos:dash.current.terms-of-use#LAA

© 2012 – Matthew Kenneth Thomas
All rights reserved.

iii
Professor David Weitz Matthew K. Thomas
Airborne disease transmission via bioaerosols:
Formation mechanisms and the influence of viscoelasticity
Abstract
Airborne disease transmission is a prominent problem facing an increasingly mobilized
world. It involves small droplets (bioaerosols) containing pathogens which form in the lungs and
are expelled to the environment, where they may persist in the air until inhaled by others.
Conceptually, there are two basic approaches to preventing transmission: protect the potential
target, or eliminate the source. To this end, the effectiveness of modifying mucus viscoelasticity,
through cation exposure, to prevent pathogen transport via bioaerosols was investigated.
In vitro models were developed to explore the proposed mechanisms for droplet
formation: shear-induced surface-wave instabilities in the airway lining fluid (ALF) of the upper
airways; and film formation during the re-opening of collapsed bronchioles in the lower airways.
Droplet formation during tidal breathing was shown to be an inhalation process for both upper
and lower airway models, and the bifurcation angle of the first bronchi was relevant to the upper
airway model. A simulated cough system was also developed and produced the largest number
of droplets.
COPD sputum viscoelasticity was characterized and its response to cation presence
measured: low concentrations of calcium resulted in increased complex modulus and decreased
loss tangent (indicating increased fluid stiffness resulting from higher elasticity). Higher

iv
concentrations of calcium had the reverse effect. Using the cough system, calcium treated (low
concentration) and untreated sputum were compared: treated sputum produced fewer droplets.
Droplet concentration (number per liter of air) correlated well with the magnitude of the complex
modulus.
Once the reduction in total droplets was established, pathogen transport experiments, in
which human rhinovirus (HRV) was added to calcium-treated and untreated COPD sputum, were
performed. Cell culture media was exposed to cough-air from the samples and then placed on
HRV-sensitized HeLa cells, which were then monitored for cell death. Cell death was observed
for untreated sputum samples, but not for cation-treated samples, indicating that reducing
bioaerosol formation (through cationic modification of mucus viscoelasticity) prevented airborne
transport of the virus.

v
Table of Contents
Chapter 1: Airborne infectious disease transmission ............................................................................................ 1
Introduction: .............................................................................................................................................................. 1
Respiratory disease and transmission: ...................................................................................................................... 2
Airborne transmission and prevention: ..................................................................................................................... 6
Thesis research: ......................................................................................................................................................... 9
References: .............................................................................................................................................................. 10
Chapter 2: Mechanisms of bioaerosol formation and transport ......................................................................... 11
Introduction: ............................................................................................................................................................ 11
Airway lining fluid and mucins: ............................................................................................................................... 12
The Pulmonary System: ........................................................................................................................................... 16
Bioaerosol formation: Upper airway model ............................................................................................................ 18
Bioaerosol formation: Lower airway model ............................................................................................................ 22
Droplet transport: .................................................................................................................................................... 24
Conclusion: .............................................................................................................................................................. 29
References: .............................................................................................................................................................. 30
Chapter 3: Bioaerosol generation – in vitro models ............................................................................................ 31
Introduction: ............................................................................................................................................................ 31
Background: ............................................................................................................................................................ 31
Optical Particle Counting Systems: .......................................................................................................................... 32
Lower Airway Model Development: ........................................................................................................................ 34
Upper Airway Model Development: ........................................................................................................................ 36
Simulated Cough System: ........................................................................................................................................ 38
Tidal breathing system: ........................................................................................................................................... 40
Sample Mucus: ........................................................................................................................................................ 41
Results: .................................................................................................................................................................... 42
Conclusion: .............................................................................................................................................................. 44
References: .............................................................................................................................................................. 46
Chapter 4: Mucus rheology, response to salt addition, and resultant droplet formation ..................................... 47
Introduction: ............................................................................................................................................................ 47

vi
Background: ............................................................................................................................................................ 47
Mucus and viscoelasticity: ....................................................................................................................................... 49
Mucus sources: ........................................................................................................................................................ 53
Mimetics: ................................................................................................................................................................. 54
Animal-derived sources: .......................................................................................................................................... 56
Human sources: ....................................................................................................................................................... 57
Bulk additives: ......................................................................................................................................................... 59
Results: .................................................................................................................................................................... 61
Conclusion: .............................................................................................................................................................. 64
References: .............................................................................................................................................................. 66
Chapter 5: Preventing bioaerosol transport by modifying mucus viscoelasticity ................................................. 67
Introduction: ............................................................................................................................................................ 67
Background: ............................................................................................................................................................ 67
Test system development: ....................................................................................................................................... 68
Method development: ............................................................................................................................................. 70
Viral Transport: ....................................................................................................................................................... 73
Results: .................................................................................................................................................................... 75
Conclusion: .............................................................................................................................................................. 76
References: .............................................................................................................................................................. 78
Chapter 6: Conclusions and further work ........................................................................................................... 79
Introduction: ............................................................................................................................................................ 79
Formation and transport mechanisms: ................................................................................................................... 80
In vitro model development: ................................................................................................................................... 82
Mucus viscoelasticity - cationic response and effect on droplet formation: ........................................................... 83
Pathogen transport and transport prevention: ....................................................................................................... 84
Implications: ............................................................................................................................................................ 85
Open questions: ....................................................................................................................................................... 86
Future work: ............................................................................................................................................................ 87
References: .............................................................................................................................................................. 88

vii
Acknowledgements
No great endeavor is performed in complete isolation, and this work is no different: it
would not have been possible but for the support of many others. In particular, I would like to
thank David Edwards of Harvard University, Robert Clarke and Jean Sung of Pulmatrix, Inc. and
above all my wife, Jenny Thomas.

1
Chapter 1: Airborne infectious disease transmission
Introduction:
Transmissible diseases are a basic part of existence. They occur in many forms and
varieties, but the most basic description would involve an invasive and foreign particle entering a
host and replicating, typically to the detriment of the host. There are many routes or vectors
which a particle can take to enter the body – for example, it may directly enter the bloodstream
through cuts or other wounds, or it may colonize the gastrointestinal or pulmonary tracts after
being swallowed or inhaled – the exact mechanism of infection will depend on the specific
pathogen. However, the simple fact that, before an infection can begin, a pathogenic organism
must first reach its target destination makes preventing exposure an immediate and obvious route
to halting the spread of these infectious diseases.
At the simplest level, this can be accomplished in one of two ways: either creating
“barriers” around the destination, or preventing the pathogen from escaping from the source. The
former is frequently employed through the use of masks, gloves, antibacterial sprays and washes
but it remains a passive defense which does not always eliminate the pathogen from the
environment. It thus becomes only a question of time until the “barrier” is circumvented (through
mistakes, negligence, ineffectiveness or even adaptation).As long as the pathogen is in the
environment, the risk of infection remains. Targeting the source is therefore more desirable,
however it is also more difficult – pathogens are transported within bodily fluids (blood, mucus,
etc.) and are shed from the body in a variety of ways, many of which are invisible to the naked
eye. Furthermore, the exact route to infection is not uniform across all pathogens.

Respiratory disease and transmission:
large populations
expelled droplets produced by talking, breathing, coughing or sneezing)
global proportions.
created widespread panic
syndrome (SARS, 2003); avian
not observed and
more recently swine flu (H1N1, 200
highlighted the seriousness
pandemics.
season
chicken pox,
Respiratory disease and transmission:
large populations
expelled droplets produced by talking, breathing, coughing or sneezing)
global proportions.
created widespread panic
syndrome (SARS, 2003); avian
not observed and
more recently swine flu (H1N1, 200
highlighted the seriousness
pandemics.
seasonal influenza,
chicken pox,
Respiratory disease and transmission:
Of particular interest are
large populations
expelled droplets produced by talking, breathing, coughing or sneezing)
global proportions.
created widespread panic
syndrome (SARS, 2003); avian
not observed and
more recently swine flu (H1N1, 200
highlighted the seriousness
pandemics.
al influenza,
chicken pox,
Respiratory disease and transmission:
Of particular interest are
large populations
expelled droplets produced by talking, breathing, coughing or sneezing)
global proportions.
created widespread panic
syndrome (SARS, 2003); avian
not observed and
more recently swine flu (H1N1, 200
highlighted the seriousness
pandemics. Airborne transmission
al influenza,
chicken pox,
Respiratory disease and transmission:
Of particular interest are
large populations
expelled droplets produced by talking, breathing, coughing or sneezing)
global proportions.
created widespread panic
syndrome (SARS, 2003); avian
not observed and
more recently swine flu (H1N1, 200
highlighted the seriousness
Airborne transmission
al influenza,
pneumonia and anthrax,
Respiratory disease and transmission:
Of particular interest are
large populations throu
expelled droplets produced by talking, breathing, coughing or sneezing)
global proportions.
created widespread panic
syndrome (SARS, 2003); avian
not observed and subsequent studies
more recently swine flu (H1N1, 200
highlighted the seriousness
Airborne transmission
al influenza,
pneumonia and anthrax,
Respiratory disease and transmission:
Of particular interest are
throu
expelled droplets produced by talking, breathing, coughing or sneezing)
global proportions.
created widespread panic
syndrome (SARS, 2003); avian
subsequent studies
more recently swine flu (H1N1, 200
highlighted the seriousness
Airborne transmission
al influenza,
pneumonia and anthrax,
Respiratory disease and transmission:
Of particular interest are
throu
expelled droplets produced by talking, breathing, coughing or sneezing)
global proportions. Over the past decade there have been a number of
created widespread panic
syndrome (SARS, 2003); avian
subsequent studies
more recently swine flu (H1N1, 200
highlighted the seriousness
Airborne transmission
the common cold
pneumonia and anthrax,
Respiratory disease and transmission:
Of particular interest are
throu
expelled droplets produced by talking, breathing, coughing or sneezing)
Over the past decade there have been a number of
created widespread panic
syndrome (SARS, 2003); avian
subsequent studies
more recently swine flu (H1N1, 200
highlighted the seriousness
Airborne transmission
the common cold
pneumonia and anthrax,
Respiratory disease and transmission:
Of particular interest are
through airborne transmission
expelled droplets produced by talking, breathing, coughing or sneezing)
Over the past decade there have been a number of
created widespread panic
syndrome (SARS, 2003); avian
subsequent studies
more recently swine flu (H1N1, 200
highlighted the seriousness
Airborne transmission
the common cold
pneumonia and anthrax,
Respiratory disease and transmission:
Of particular interest are
gh airborne transmission
expelled droplets produced by talking, breathing, coughing or sneezing)
Over the past decade there have been a number of
created widespread panic with the fear of pandemic
syndrome (SARS, 2003); avian
subsequent studies
more recently swine flu (H1N1, 200
highlighted the seriousness
Airborne transmission
the common cold
pneumonia and anthrax,
Respiratory disease and transmission:
Of particular interest are
gh airborne transmission
expelled droplets produced by talking, breathing, coughing or sneezing)
Over the past decade there have been a number of
with the fear of pandemic
syndrome (SARS, 2003); avian
subsequent studies
more recently swine flu (H1N1, 200
highlighted the seriousness (and often
Airborne transmission
the common cold
pneumonia and anthrax,
Respiratory disease and transmission:
Of particular interest are
gh airborne transmission
expelled droplets produced by talking, breathing, coughing or sneezing)
Over the past decade there have been a number of
with the fear of pandemic
syndrome (SARS, 2003); avian
subsequent studies
more recently swine flu (H1N1, 200
(and often
Airborne transmission
the common cold
pneumonia and anthrax,
Respiratory disease and transmission:
Of particular interest are respiratory
gh airborne transmission
expelled droplets produced by talking, breathing, coughing or sneezing)
Over the past decade there have been a number of
with the fear of pandemic
flu
subsequent studies
more recently swine flu (H1N1, 200
(and often
Airborne transmission
the common cold
pneumonia and anthrax,
Respiratory disease and transmission:
respiratory
gh airborne transmission
expelled droplets produced by talking, breathing, coughing or sneezing)
Over the past decade there have been a number of
with the fear of pandemic
flu
subsequent studies
more recently swine flu (H1N1, 200
(and often
Airborne transmission can also occur in many other re
the common cold
pneumonia and anthrax,
Respiratory disease and transmission:
respiratory
gh airborne transmission
expelled droplets produced by talking, breathing, coughing or sneezing)
Over the past decade there have been a number of
with the fear of pandemic
(H5N1,
subsequent studies
more recently swine flu (H1N1, 2008
(and often
can also occur in many other re
the common cold
pneumonia and anthrax,
Respiratory disease and transmission:
respiratory
gh airborne transmission
expelled droplets produced by talking, breathing, coughing or sneezing)
Over the past decade there have been a number of
with the fear of pandemic
(H5N1,
subsequent studies h
8
(and often
can also occur in many other re
the common cold
pneumonia and anthrax,
Figure 1.1: Droplet spray visualization
Respiratory disease and transmission:
respiratory
gh airborne transmission
expelled droplets produced by talking, breathing, coughing or sneezing)
Over the past decade there have been a number of
with the fear of pandemic
(H5N1,
have
8).
(and often
can also occur in many other re
(rhinovirus)
pneumonia and anthrax, amongst others.
Figure 1.1: Droplet spray visualization
Respiratory disease and transmission:
respiratory
gh airborne transmission
expelled droplets produced by talking, breathing, coughing or sneezing)
Over the past decade there have been a number of
with the fear of pandemic
(H5N1,
ave
).
(and often hysteria) which are associated with the threat of
can also occur in many other re
(rhinovirus)
amongst others.
Figure 1.1: Droplet spray visualization
Respiratory disease and transmission:
respiratory
gh airborne transmission
expelled droplets produced by talking, breathing, coughing or sneezing)
Over the past decade there have been a number of
with the fear of pandemic
(H5N1,
ave
). T
hysteria) which are associated with the threat of
can also occur in many other re
(rhinovirus)
amongst others.
Figure 1.1: Droplet spray visualization
Respiratory disease and transmission:
respiratory
gh airborne transmission
expelled droplets produced by talking, breathing, coughing or sneezing)
Over the past decade there have been a number of
with the fear of pandemic
(H5N1,
ave
These
hysteria) which are associated with the threat of
can also occur in many other re
(rhinovirus)
amongst others.
Figure 1.1: Droplet spray visualization
respiratory
gh airborne transmission
expelled droplets produced by talking, breathing, coughing or sneezing)
Over the past decade there have been a number of
with the fear of pandemic
(H5N1,
ave show
hese
hysteria) which are associated with the threat of
can also occur in many other re
(rhinovirus)
amongst others.
Figure 1.1: Droplet spray visualization
respiratory
gh airborne transmission
expelled droplets produced by talking, breathing, coughing or sneezing)
Over the past decade there have been a number of
with the fear of pandemic
(H5N1, 200
show
hese
hysteria) which are associated with the threat of
can also occur in many other re
(rhinovirus)
amongst others.
Figure 1.1: Droplet spray visualization
diseases, as these infections can rapidly spread to
gh airborne transmission
expelled droplets produced by talking, breathing, coughing or sneezing)
Over the past decade there have been a number of
with the fear of pandemic
200
show
hese epidemics
hysteria) which are associated with the threat of
can also occur in many other re
(rhinovirus)
amongst others.
Figure 1.1: Droplet spray visualization
diseases, as these infections can rapidly spread to
gh airborne transmission
expelled droplets produced by talking, breathing, coughing or sneezing)
Over the past decade there have been a number of
with the fear of pandemic
2004
shown
epidemics
hysteria) which are associated with the threat of
can also occur in many other re
(rhinovirus)
amongst others.
Figure 1.1: Droplet spray visualization
2
diseases, as these infections can rapidly spread to
(which involves the spread of pathogens through
expelled droplets produced by talking, breathing, coughing or sneezing)
Over the past decade there have been a number of
with the fear of pandemic
4
n
epidemics
hysteria) which are associated with the threat of
can also occur in many other re
(rhinovirus)
amongst others.
Figure 1.1: Droplet spray visualization
2
diseases, as these infections can rapidly spread to
(which involves the spread of pathogens through
expelled droplets produced by talking, breathing, coughing or sneezing)
Over the past decade there have been a number of
with the fear of pandemic
and 2005
limited human
epidemics
hysteria) which are associated with the threat of
can also occur in many other re
(rhinovirus),
amongst others.
Figure 1.1: Droplet spray visualization
diseases, as these infections can rapidly spread to
(which involves the spread of pathogens through
expelled droplets produced by talking, breathing, coughing or sneezing)
Over the past decade there have been a number of
with the fear of pandemic
and 2005
limited human
epidemics
hysteria) which are associated with the threat of
can also occur in many other re
, pulmonary
amongst others.
Figure 1.1: Droplet spray visualization
diseases, as these infections can rapidly spread to
(which involves the spread of pathogens through
expelled droplets produced by talking, breathing, coughing or sneezing)
Over the past decade there have been a number of
with the fear of pandemic. These include severe acute respiratory
and 2005
limited human
epidemics
hysteria) which are associated with the threat of
can also occur in many other re
pulmonary
amongst others.
Figure 1.1: Droplet spray visualization
diseases, as these infections can rapidly spread to
(which involves the spread of pathogens through
expelled droplets produced by talking, breathing, coughing or sneezing)
Over the past decade there have been a number of
. These include severe acute respiratory
and 2005
limited human
epidemics
hysteria) which are associated with the threat of
can also occur in many other re
pulmonary
Figure 1.1: Droplet spray visualization
diseases, as these infections can rapidly spread to
(which involves the spread of pathogens through
expelled droplets produced by talking, breathing, coughing or sneezing)
Over the past decade there have been a number of
. These include severe acute respiratory
and 2005
limited human
generated major headlines
hysteria) which are associated with the threat of
can also occur in many other re
pulmonary
Figure 1.1: Droplet spray visualization
diseases, as these infections can rapidly spread to
(which involves the spread of pathogens through
expelled droplets produced by talking, breathing, coughing or sneezing)
Over the past decade there have been a number of
. These include severe acute respiratory
and 2005, although
limited human
generated major headlines
hysteria) which are associated with the threat of
can also occur in many other re
pulmonary
Figure 1.1: Droplet spray visualization
diseases, as these infections can rapidly spread to
(which involves the spread of pathogens through
expelled droplets produced by talking, breathing, coughing or sneezing)
Over the past decade there have been a number of
. These include severe acute respiratory
, although
limited human
generated major headlines
hysteria) which are associated with the threat of
can also occur in many other re
pulmonary tuberculosis (TB)
Figure 1.1: Droplet spray visualization
diseases, as these infections can rapidly spread to
(which involves the spread of pathogens through
expelled droplets produced by talking, breathing, coughing or sneezing)
Over the past decade there have been a number of
. These include severe acute respiratory
, although
limited human-
generated major headlines
hysteria) which are associated with the threat of
can also occur in many other re
tuberculosis (TB)
Figure 1.1: Droplet spray visualization
diseases, as these infections can rapidly spread to
(which involves the spread of pathogens through
expelled droplets produced by talking, breathing, coughing or sneezing)
Over the past decade there have been a number of
. These include severe acute respiratory
, although
-to
generated major headlines
hysteria) which are associated with the threat of
can also occur in many other re
tuberculosis (TB)
Figure 1.1: Droplet spray visualization
diseases, as these infections can rapidly spread to
(which involves the spread of pathogens through
expelled droplets produced by talking, breathing, coughing or sneezing)
Over the past decade there have been a number of
. These include severe acute respiratory
, although
to
generated major headlines
hysteria) which are associated with the threat of
can also occur in many other re
tuberculosis (TB)
Figure 1.1: Droplet spray visualization
diseases, as these infections can rapidly spread to
(which involves the spread of pathogens through
expelled droplets produced by talking, breathing, coughing or sneezing)
Over the past decade there have been a number of
. These include severe acute respiratory
, although
to-
generated major headlines
hysteria) which are associated with the threat of
can also occur in many other respiratory diseases, including
tuberculosis (TB)
Figure 1.1: Droplet spray visualization
diseases, as these infections can rapidly spread to
(which involves the spread of pathogens through
expelled droplets produced by talking, breathing, coughing or sneezing)
Over the past decade there have been a number of
. These include severe acute respiratory
, although
-human t
generated major headlines
hysteria) which are associated with the threat of
spiratory diseases, including
tuberculosis (TB)
Figure 1.1: Droplet spray visualization
diseases, as these infections can rapidly spread to
(which involves the spread of pathogens through
expelled droplets produced by talking, breathing, coughing or sneezing)
Over the past decade there have been a number of
. These include severe acute respiratory
, although airborne transmission was
human t
generated major headlines
hysteria) which are associated with the threat of
spiratory diseases, including
tuberculosis (TB)
Figure 1.1: Droplet spray visualization
diseases, as these infections can rapidly spread to
(which involves the spread of pathogens through
expelled droplets produced by talking, breathing, coughing or sneezing)
Over the past decade there have been a number of pulmonary diseases t
. These include severe acute respiratory
airborne transmission was
human t
generated major headlines
hysteria) which are associated with the threat of
spiratory diseases, including
tuberculosis (TB)
diseases, as these infections can rapidly spread to
(which involves the spread of pathogens through
expelled droplets produced by talking, breathing, coughing or sneezing)
pulmonary diseases t
. These include severe acute respiratory
airborne transmission was
human t
generated major headlines
hysteria) which are associated with the threat of
spiratory diseases, including
tuberculosis (TB)
diseases, as these infections can rapidly spread to
(which involves the spread of pathogens through
expelled droplets produced by talking, breathing, coughing or sneezing), potentially reaching
pulmonary diseases t
. These include severe acute respiratory
airborne transmission was
human t
generated major headlines
hysteria) which are associated with the threat of
spiratory diseases, including
tuberculosis (TB)
diseases, as these infections can rapidly spread to
(which involves the spread of pathogens through
, potentially reaching
pulmonary diseases t
. These include severe acute respiratory
airborne transmission was
human transmission
generated major headlines
hysteria) which are associated with the threat of
spiratory diseases, including
tuberculosis (TB)
diseases, as these infections can rapidly spread to
(which involves the spread of pathogens through
, potentially reaching
pulmonary diseases t
. These include severe acute respiratory
airborne transmission was
ransmission
generated major headlines
hysteria) which are associated with the threat of
spiratory diseases, including
tuberculosis (TB), measles
diseases, as these infections can rapidly spread to
(which involves the spread of pathogens through
, potentially reaching
pulmonary diseases t
. These include severe acute respiratory
airborne transmission was
ransmission
generated major headlines
hysteria) which are associated with the threat of
spiratory diseases, including
, measles
diseases, as these infections can rapidly spread to
(which involves the spread of pathogens through
, potentially reaching
pulmonary diseases t
. These include severe acute respiratory
airborne transmission was
ransmission
and
hysteria) which are associated with the threat of
spiratory diseases, including
, measles
diseases, as these infections can rapidly spread to
(which involves the spread of pathogens through
, potentially reaching
pulmonary diseases t
. These include severe acute respiratory
airborne transmission was
ransmission1); and
and
spiratory diseases, including
, measles
diseases, as these infections can rapidly spread to
(which involves the spread of pathogens through
, potentially reaching
pulmonary diseases t
. These include severe acute respiratory
airborne transmission was
); and
spiratory diseases, including
, measles,
diseases, as these infections can rapidly spread to
(which involves the spread of pathogens through
, potentially reaching
pulmonary diseases t
. These include severe acute respiratory
airborne transmission was
); and
spiratory diseases, including
diseases, as these infections can rapidly spread to
(which involves the spread of pathogens through
, potentially reaching
pulmonary diseases that
. These include severe acute respiratory
airborne transmission was
); and
spiratory diseases, including
diseases, as these infections can rapidly spread to
(which involves the spread of pathogens through
, potentially reaching
hat
airborne transmission was
); and
spiratory diseases, including
diseases, as these infections can rapidly spread to
(which involves the spread of pathogens through
, potentially reaching
hat
airborne transmission was
); and
spiratory diseases, including
diseases, as these infections can rapidly spread to
(which involves the spread of pathogens through
hat
airborne transmission was
); and
spiratory diseases, including
(which involves the spread of pathogens through
airborne transmission was
spiratory diseases, including
(which involves the spread of pathogens through (which involves the spread of pathogens through

3
In 2004 a study conducted on the SARS outbreak in Hong Kong and published in the
New England Journal of Medicine by Ignatius Yu et al.2 concluded that airborne transmission
was the likely route for the spread of the virus. Chad Roy (U.S. Army Medical Research Institute
of Infectious Diseases) and Donald Milton (Harvard School of Public Health) cited Yu’s study in
an article3 in the same publication to highlight the need for a fundamental shift in how doctors
understood and approached the relationship between infectious disease and airborne
transmission. Claiming the traditionally held view that diseases either were “true” airborne
infections or not airborne infections at all was too limited, and did not lead to “useful thinking”
about the problem, they proposed a new classification system for airborne diseases as “obligate,
preferential, or opportunistic.” Obligate airborne diseases transmit only through aerosols;
preferential airborne diseases transmit primarily via aerosols, but may spread in other ways as
well (such as direct contact); opportunistic airborne diseases may transmit via aerosol, but
primarily spread through other means.
Roy and Milton pointed out the need for a deeper understanding of airborne transmission,
specifically in regards to hospitals and other indoor settings (schools, airplanes, etc.) while citing
the transmission of SARS in hospital waiting rooms. They believed their new categorization
system would provide a more nuanced way of thinking about disease transmission, specifically
in regards to prevention. For example, in preferential or opportunistic airborne disease scenarios,
hand-washing alone might reduce the probability for transmission, but it would not eliminate it –
a combination of preventative measures would be necessary – but due to observed decreases in
transmission, the additional measures might not be implemented. Furthermore, some measures
thought to reduce bioaerosol transmission, such as the use of surgical masks, have been shown to

4
be ineffective for any but the largest droplets4. Hence, further research into airborne disease
transmission and prevention is vital.
Historically, airborne transmission has been thought to be the result of pathogen-laden,
large-diameter droplets expelled via coughing, sneezing or talking. In the 1940s, J. P. Duguid
(Edinburgh University) performed a series of experiments attempting to clarify the role of
droplet spray in infection transmission5. Patients with a confirmed infection of either haemolytic
streptococcus, diphtheria or tuberculosis were asked to perform different breathing maneuvers
(coughing, sneezing, talking) while a microscope slide or culture plate was held in front of them
to collect expelled droplets by impingement. The slide or plate was then analyzed for pathogen
presence. The study acknowledged that only the largest droplets would be collected on the plates,
but claimed that the majority of “pathogenic organisms were contained in the large droplets.”
This claim was made without reference to any supporting evidence, and reflects the prevailing
opinions of the time. These opinions were the result of a simple fact: there were no methods for
detecting smaller droplets (aerosols), and therefore no one was aware of how many were being
produced. With the development and proliferation of optical methods for measuring small and
very small airborne particles (nanometers to microns in scale) in the 1980s and 1990s, research
began on the size and number of expelled droplets.
In 1997, R. Papineni and F. Rosenthal (Purdue University) published a study on the
number and size distribution of droplets in the exhaled breath of healthy humans7. Not only did
they confirm the presence of small droplets (less than 5 microns in diameter), but they found that
these droplets were present in numbers that were significantly greater than those of larger
droplets (more than an order of magnitude difference).

for example, is only 30 nanometers in diameter), they could easily be contained within the
expelled aerosols
of expelled pathogens were to be found in the sm
number produced.
droplets because they may persist in the environment for longer and may
source, placing a larger population at risk of infection, especially in public
Papineni and Rosenthal’s study, research on airborne disea
increased consideration to
research have lagged (as evidenced by Roy and Milton’s desire to
by
outbreaks).
for example, is only 30 nanometers in diameter), they could easily be contained within the
expelled aerosols
of expelled pathogens were to be found in the sm
number produced.
droplets because they may persist in the environment for longer and may
source, placing a larger population at risk of infection, especially in public
Papineni and Rosenthal’s study, research on airborne disea
increased consideration to
research have lagged (as evidenced by Roy and Milton’s desire to
by introduc
outbreaks).
for example, is only 30 nanometers in diameter), they could easily be contained within the
expelled aerosols
of expelled pathogens were to be found in the sm
number produced.
droplets because they may persist in the environment for longer and may
source, placing a larger population at risk of infection, especially in public
Papineni and Rosenthal’s study, research on airborne disea
increased consideration to
research have lagged (as evidenced by Roy and Milton’s desire to
introduc
outbreaks).
Given that the size of
for example, is only 30 nanometers in diameter), they could easily be contained within the
expelled aerosols
of expelled pathogens were to be found in the sm
number produced.
droplets because they may persist in the environment for longer and may
source, placing a larger population at risk of infection, especially in public
Papineni and Rosenthal’s study, research on airborne disea
increased consideration to
research have lagged (as evidenced by Roy and Milton’s desire to
introducing
outbreaks).
Given that the size of
for example, is only 30 nanometers in diameter), they could easily be contained within the
expelled aerosols
of expelled pathogens were to be found in the sm
number produced.
droplets because they may persist in the environment for longer and may
source, placing a larger population at risk of infection, especially in public
Papineni and Rosenthal’s study, research on airborne disea
increased consideration to
research have lagged (as evidenced by Roy and Milton’s desire to
ing
Given that the size of
for example, is only 30 nanometers in diameter), they could easily be contained within the
expelled aerosols
of expelled pathogens were to be found in the sm
number produced.
droplets because they may persist in the environment for longer and may
source, placing a larger population at risk of infection, especially in public
Papineni and Rosenthal’s study, research on airborne disea
increased consideration to
research have lagged (as evidenced by Roy and Milton’s desire to
new categories to descri
dramatically as the size decreases, however this was not observed until the
Given that the size of
for example, is only 30 nanometers in diameter), they could easily be contained within the
expelled aerosols.
of expelled pathogens were to be found in the sm
number produced.
droplets because they may persist in the environment for longer and may
source, placing a larger population at risk of infection, especially in public
Papineni and Rosenthal’s study, research on airborne disea
increased consideration to
research have lagged (as evidenced by Roy and Milton’s desire to
new categories to descri
Figure 1.2:
dramatically as the size decreases, however this was not observed until the
Given that the size of
for example, is only 30 nanometers in diameter), they could easily be contained within the
This mea
of expelled pathogens were to be found in the sm
number produced. Pathogen
droplets because they may persist in the environment for longer and may
source, placing a larger population at risk of infection, especially in public
Papineni and Rosenthal’s study, research on airborne disea
increased consideration to
research have lagged (as evidenced by Roy and Milton’s desire to
new categories to descri
Figure 1.2:
dramatically as the size decreases, however this was not observed until the
1990s, after the developme
Given that the size of
for example, is only 30 nanometers in diameter), they could easily be contained within the
This mea
of expelled pathogens were to be found in the sm
Pathogen
droplets because they may persist in the environment for longer and may
source, placing a larger population at risk of infection, especially in public
Papineni and Rosenthal’s study, research on airborne disea
increased consideration to bio
research have lagged (as evidenced by Roy and Milton’s desire to
new categories to descri
Expelled droplets
dramatically as the size decreases, however this was not observed until the
1990s, after the developme
Given that the size of
for example, is only 30 nanometers in diameter), they could easily be contained within the
This meant that it was not only possible, but highly probable that the majority
of expelled pathogens were to be found in the sm
Pathogen-
droplets because they may persist in the environment for longer and may
source, placing a larger population at risk of infection, especially in public
Papineni and Rosenthal’s study, research on airborne disea
bio
research have lagged (as evidenced by Roy and Milton’s desire to
new categories to descri
Expelled droplets
dramatically as the size decreases, however this was not observed until the
1990s, after the developme
Given that the size of nearly all
for example, is only 30 nanometers in diameter), they could easily be contained within the
nt that it was not only possible, but highly probable that the majority
of expelled pathogens were to be found in the sm
-laden aerosols
droplets because they may persist in the environment for longer and may
source, placing a larger population at risk of infection, especially in public
Papineni and Rosenthal’s study, research on airborne disea
bio
research have lagged (as evidenced by Roy and Milton’s desire to
new categories to descri
Expelled droplets
dramatically as the size decreases, however this was not observed until the
1990s, after the developme
nearly all
for example, is only 30 nanometers in diameter), they could easily be contained within the
nt that it was not only possible, but highly probable that the majority
of expelled pathogens were to be found in the sm
laden aerosols
droplets because they may persist in the environment for longer and may
source, placing a larger population at risk of infection, especially in public
Papineni and Rosenthal’s study, research on airborne disea
bioaerosols, although
research have lagged (as evidenced by Roy and Milton’s desire to
new categories to descri
Expelled droplets
dramatically as the size decreases, however this was not observed until the
1990s, after the developme
nearly all
for example, is only 30 nanometers in diameter), they could easily be contained within the
nt that it was not only possible, but highly probable that the majority
of expelled pathogens were to be found in the sm
laden aerosols
droplets because they may persist in the environment for longer and may
source, placing a larger population at risk of infection, especially in public
Papineni and Rosenthal’s study, research on airborne disea
aerosols, although
research have lagged (as evidenced by Roy and Milton’s desire to
new categories to describe airborne disease transmission following the SARS
Expelled droplets
dramatically as the size decreases, however this was not observed until the
1990s, after the developme
viruses and
for example, is only 30 nanometers in diameter), they could easily be contained within the
nt that it was not only possible, but highly probable that the majority
of expelled pathogens were to be found in the sm
laden aerosols
droplets because they may persist in the environment for longer and may
source, placing a larger population at risk of infection, especially in public
Papineni and Rosenthal’s study, research on airborne disea
aerosols, although
research have lagged (as evidenced by Roy and Milton’s desire to
be airborne disease transmission following the SARS
Expelled droplets –
dramatically as the size decreases, however this was not observed until the
1990s, after the development of optical particle counting techniques.
viruses and
for example, is only 30 nanometers in diameter), they could easily be contained within the
nt that it was not only possible, but highly probable that the majority
of expelled pathogens were to be found in the sm
laden aerosols
droplets because they may persist in the environment for longer and may
source, placing a larger population at risk of infection, especially in public
Papineni and Rosenthal’s study, research on airborne disea
aerosols, although
research have lagged (as evidenced by Roy and Milton’s desire to
be airborne disease transmission following the SARS
– the number of droplets
dramatically as the size decreases, however this was not observed until the
nt of optical particle counting techniques.
viruses and
for example, is only 30 nanometers in diameter), they could easily be contained within the
nt that it was not only possible, but highly probable that the majority
of expelled pathogens were to be found in the sm
(bioaerosols)
droplets because they may persist in the environment for longer and may
source, placing a larger population at risk of infection, especially in public
Papineni and Rosenthal’s study, research on airborne disea
aerosols, although
research have lagged (as evidenced by Roy and Milton’s desire to
be airborne disease transmission following the SARS
the number of droplets
dramatically as the size decreases, however this was not observed until the
nt of optical particle counting techniques.
viruses and
for example, is only 30 nanometers in diameter), they could easily be contained within the
nt that it was not only possible, but highly probable that the majority
of expelled pathogens were to be found in the sm
(bioaerosols)
droplets because they may persist in the environment for longer and may
source, placing a larger population at risk of infection, especially in public
Papineni and Rosenthal’s study, research on airborne disea
aerosols, although
research have lagged (as evidenced by Roy and Milton’s desire to
be airborne disease transmission following the SARS
5
the number of droplets
dramatically as the size decreases, however this was not observed until the
nt of optical particle counting techniques.
viruses and
for example, is only 30 nanometers in diameter), they could easily be contained within the
nt that it was not only possible, but highly probable that the majority
of expelled pathogens were to be found in the sm
(bioaerosols)
droplets because they may persist in the environment for longer and may
source, placing a larger population at risk of infection, especially in public
Papineni and Rosenthal’s study, research on airborne disea
aerosols, although practical prevention
research have lagged (as evidenced by Roy and Milton’s desire to
be airborne disease transmission following the SARS
5
the number of droplets
dramatically as the size decreases, however this was not observed until the
nt of optical particle counting techniques.
viruses and
for example, is only 30 nanometers in diameter), they could easily be contained within the
nt that it was not only possible, but highly probable that the majority
of expelled pathogens were to be found in the smaller droplets, based simply on the sheer
(bioaerosols)
droplets because they may persist in the environment for longer and may
source, placing a larger population at risk of infection, especially in public
Papineni and Rosenthal’s study, research on airborne disea
practical prevention
research have lagged (as evidenced by Roy and Milton’s desire to
be airborne disease transmission following the SARS
the number of droplets
dramatically as the size decreases, however this was not observed until the
nt of optical particle counting techniques.
viruses and
for example, is only 30 nanometers in diameter), they could easily be contained within the
nt that it was not only possible, but highly probable that the majority
aller droplets, based simply on the sheer
(bioaerosols)
droplets because they may persist in the environment for longer and may
source, placing a larger population at risk of infection, especially in public
Papineni and Rosenthal’s study, research on airborne disea
practical prevention
research have lagged (as evidenced by Roy and Milton’s desire to
be airborne disease transmission following the SARS
the number of droplets
dramatically as the size decreases, however this was not observed until the
nt of optical particle counting techniques.
viruses and many
for example, is only 30 nanometers in diameter), they could easily be contained within the
nt that it was not only possible, but highly probable that the majority
aller droplets, based simply on the sheer
(bioaerosols)
droplets because they may persist in the environment for longer and may
source, placing a larger population at risk of infection, especially in public
Papineni and Rosenthal’s study, research on airborne disea
practical prevention
research have lagged (as evidenced by Roy and Milton’s desire to
be airborne disease transmission following the SARS
the number of droplets
dramatically as the size decreases, however this was not observed until the
nt of optical particle counting techniques.
many
for example, is only 30 nanometers in diameter), they could easily be contained within the
nt that it was not only possible, but highly probable that the majority
aller droplets, based simply on the sheer
(bioaerosols)
droplets because they may persist in the environment for longer and may
source, placing a larger population at risk of infection, especially in public
Papineni and Rosenthal’s study, research on airborne disea
practical prevention
research have lagged (as evidenced by Roy and Milton’s desire to
be airborne disease transmission following the SARS
the number of droplets
dramatically as the size decreases, however this was not observed until the
nt of optical particle counting techniques.
many bacteria
for example, is only 30 nanometers in diameter), they could easily be contained within the
nt that it was not only possible, but highly probable that the majority
aller droplets, based simply on the sheer
(bioaerosols) are a greater threat compared to large
droplets because they may persist in the environment for longer and may
source, placing a larger population at risk of infection, especially in public
Papineni and Rosenthal’s study, research on airborne disea
practical prevention
research have lagged (as evidenced by Roy and Milton’s desire to
be airborne disease transmission following the SARS
the number of droplets
dramatically as the size decreases, however this was not observed until the
nt of optical particle counting techniques.
bacteria
for example, is only 30 nanometers in diameter), they could easily be contained within the
nt that it was not only possible, but highly probable that the majority
aller droplets, based simply on the sheer
are a greater threat compared to large
droplets because they may persist in the environment for longer and may
source, placing a larger population at risk of infection, especially in public
Papineni and Rosenthal’s study, research on airborne disease transmission began to give
practical prevention
research have lagged (as evidenced by Roy and Milton’s desire to
be airborne disease transmission following the SARS
the number of droplets
dramatically as the size decreases, however this was not observed until the
nt of optical particle counting techniques.
bacteria
for example, is only 30 nanometers in diameter), they could easily be contained within the
nt that it was not only possible, but highly probable that the majority
aller droplets, based simply on the sheer
are a greater threat compared to large
droplets because they may persist in the environment for longer and may
source, placing a larger population at risk of infection, especially in public
se transmission began to give
practical prevention
research have lagged (as evidenced by Roy and Milton’s desire to
be airborne disease transmission following the SARS
the number of droplets released
dramatically as the size decreases, however this was not observed until the
nt of optical particle counting techniques.
bacteria
for example, is only 30 nanometers in diameter), they could easily be contained within the
nt that it was not only possible, but highly probable that the majority
aller droplets, based simply on the sheer
are a greater threat compared to large
droplets because they may persist in the environment for longer and may
source, placing a larger population at risk of infection, especially in public
se transmission began to give
practical prevention
research have lagged (as evidenced by Roy and Milton’s desire to
be airborne disease transmission following the SARS
released
dramatically as the size decreases, however this was not observed until the
nt of optical particle counting techniques.
bacteria are microns or less (rhinovirus,
for example, is only 30 nanometers in diameter), they could easily be contained within the
nt that it was not only possible, but highly probable that the majority
aller droplets, based simply on the sheer
are a greater threat compared to large
droplets because they may persist in the environment for longer and may
source, placing a larger population at risk of infection, especially in public
se transmission began to give
practical prevention
research have lagged (as evidenced by Roy and Milton’s desire to
be airborne disease transmission following the SARS
released
dramatically as the size decreases, however this was not observed until the
nt of optical particle counting techniques.
are microns or less (rhinovirus,
for example, is only 30 nanometers in diameter), they could easily be contained within the
nt that it was not only possible, but highly probable that the majority
aller droplets, based simply on the sheer
are a greater threat compared to large
droplets because they may persist in the environment for longer and may
source, placing a larger population at risk of infection, especially in public
se transmission began to give
practical prevention
encourage “useful thinking”
be airborne disease transmission following the SARS
released
dramatically as the size decreases, however this was not observed until the
nt of optical particle counting techniques.
are microns or less (rhinovirus,
for example, is only 30 nanometers in diameter), they could easily be contained within the
nt that it was not only possible, but highly probable that the majority
aller droplets, based simply on the sheer
are a greater threat compared to large
droplets because they may persist in the environment for longer and may
source, placing a larger population at risk of infection, especially in public
se transmission began to give
practical prevention efforts reflecting that
encourage “useful thinking”
be airborne disease transmission following the SARS
released
dramatically as the size decreases, however this was not observed until the
nt of optical particle counting techniques.
are microns or less (rhinovirus,
for example, is only 30 nanometers in diameter), they could easily be contained within the
nt that it was not only possible, but highly probable that the majority
aller droplets, based simply on the sheer
are a greater threat compared to large
droplets because they may persist in the environment for longer and may
source, placing a larger population at risk of infection, especially in public
se transmission began to give
efforts reflecting that
encourage “useful thinking”
be airborne disease transmission following the SARS
released increases
dramatically as the size decreases, however this was not observed until the
nt of optical particle counting techniques.
are microns or less (rhinovirus,
for example, is only 30 nanometers in diameter), they could easily be contained within the
nt that it was not only possible, but highly probable that the majority
aller droplets, based simply on the sheer
are a greater threat compared to large
droplets because they may persist in the environment for longer and may
source, placing a larger population at risk of infection, especially in public
se transmission began to give
efforts reflecting that
encourage “useful thinking”
be airborne disease transmission following the SARS
increases
dramatically as the size decreases, however this was not observed until the
nt of optical particle counting techniques.
are microns or less (rhinovirus,
for example, is only 30 nanometers in diameter), they could easily be contained within the
nt that it was not only possible, but highly probable that the majority
aller droplets, based simply on the sheer
are a greater threat compared to large
droplets because they may persist in the environment for longer and may travel further from the
source, placing a larger population at risk of infection, especially in public
se transmission began to give
efforts reflecting that
encourage “useful thinking”
be airborne disease transmission following the SARS
increases
dramatically as the size decreases, however this was not observed until the
nt of optical particle counting techniques.
are microns or less (rhinovirus,
for example, is only 30 nanometers in diameter), they could easily be contained within the
nt that it was not only possible, but highly probable that the majority
aller droplets, based simply on the sheer
are a greater threat compared to large
travel further from the
source, placing a larger population at risk of infection, especially in public spaces
se transmission began to give
efforts reflecting that
encourage “useful thinking”
be airborne disease transmission following the SARS
increases
dramatically as the size decreases, however this was not observed until the
nt of optical particle counting techniques.
are microns or less (rhinovirus,
for example, is only 30 nanometers in diameter), they could easily be contained within the
nt that it was not only possible, but highly probable that the majority
aller droplets, based simply on the sheer
are a greater threat compared to large
travel further from the
spaces
se transmission began to give
efforts reflecting that
encourage “useful thinking”
be airborne disease transmission following the SARS
increases
dramatically as the size decreases, however this was not observed until the
are microns or less (rhinovirus,
for example, is only 30 nanometers in diameter), they could easily be contained within the
nt that it was not only possible, but highly probable that the majority
aller droplets, based simply on the sheer
are a greater threat compared to large
travel further from the
spaces
se transmission began to give
efforts reflecting that
encourage “useful thinking”
be airborne disease transmission following the SARS
are microns or less (rhinovirus,
for example, is only 30 nanometers in diameter), they could easily be contained within the
nt that it was not only possible, but highly probable that the majority
aller droplets, based simply on the sheer
are a greater threat compared to large
travel further from the
spaces.
se transmission began to give
efforts reflecting that
encourage “useful thinking”
be airborne disease transmission following the SARS
are microns or less (rhinovirus,
for example, is only 30 nanometers in diameter), they could easily be contained within the
nt that it was not only possible, but highly probable that the majority
aller droplets, based simply on the sheer
are a greater threat compared to large
travel further from the
As a result of
efforts reflecting that
encourage “useful thinking”
be airborne disease transmission following the SARS
are microns or less (rhinovirus,
for example, is only 30 nanometers in diameter), they could easily be contained within the
nt that it was not only possible, but highly probable that the majority
are a greater threat compared to large
travel further from the
As a result of
efforts reflecting that
encourage “useful thinking”
be airborne disease transmission following the SARS
are microns or less (rhinovirus,
nt that it was not only possible, but highly probable that the majority
are a greater threat compared to large
travel further from the
As a result of
encourage “useful thinking”
be airborne disease transmission following the SARS
are microns or less (rhinovirus,
nt that it was not only possible, but highly probable that the majority
are a greater threat compared to large
travel further from the
As a result of
encourage “useful thinking”
be airborne disease transmission following the SARS
are microns or less (rhinovirus,
nt that it was not only possible, but highly probable that the majority
are a greater threat compared to large
travel further from the
As a result of
encourage “useful thinking”
are microns or less (rhinovirus,
nt that it was not only possible, but highly probable that the majority
are a greater threat compared to large
travel further from the
As a result of
encourage “useful thinking”
are microns or less (rhinovirus,
nt that it was not only possible, but highly probable that the majority
travel further from the
As a result of
are microns or less (rhinovirus,

Airborne transmission and prevention:
I, droplets are formed at the infection site within the pulmonary system. They are then
transported to the naso
droplets range in size and number, but are loosel
(bio
at the number, size and composition of expelled droplets.
subject to numero
its size. Stage III encompasses these
evaporation
rapidly enough)
environment is a function of the exact conditions they are exposed to, as is the length of time
Airborne transmission and prevention:
I, droplets are formed at the infection site within the pulmonary system. They are then
transported to the naso
droplets range in size and number, but are loosel
bio
at the number, size and composition of expelled droplets.
subject to numero
its size. Stage III encompasses these
evaporation
rapidly enough)
environment is a function of the exact conditions they are exposed to, as is the length of time
Airborne transmission and prevention:
I, droplets are formed at the infection site within the pulmonary system. They are then
transported to the naso
droplets range in size and number, but are loosel
bioaerosols).
at the number, size and composition of expelled droplets.
subject to numero
its size. Stage III encompasses these
evaporation
rapidly enough)
environment is a function of the exact conditions they are exposed to, as is the length of time
Airborne transmission and prevention:
I, droplets are formed at the infection site within the pulmonary system. They are then
transported to the naso
droplets range in size and number, but are loosel
aerosols).
at the number, size and composition of expelled droplets.
subject to numero
its size. Stage III encompasses these
evaporation
rapidly enough)
environment is a function of the exact conditions they are exposed to, as is the length of time
Airborne transmission and prevention:
Airborne transmission can be broken into 4 majo
I, droplets are formed at the infection site within the pulmonary system. They are then
transported to the naso
droplets range in size and number, but are loosel
aerosols).
at the number, size and composition of expelled droplets.
subject to numero
its size. Stage III encompasses these
evaporation (
rapidly enough)
environment is a function of the exact conditions they are exposed to, as is the length of time
Airborne transmission and prevention:
Airborne transmission can be broken into 4 majo
I, droplets are formed at the infection site within the pulmonary system. They are then
transported to the naso
droplets range in size and number, but are loosel
aerosols).
at the number, size and composition of expelled droplets.
subject to numero
its size. Stage III encompasses these
(in which larger droplets
rapidly enough)
environment is a function of the exact conditions they are exposed to, as is the length of time
Airborne transmission and prevention:
Airborne transmission can be broken into 4 majo
I, droplets are formed at the infection site within the pulmonary system. They are then
transported to the naso
droplets range in size and number, but are loosel
The majority of bioaerosol research has, to date, focused on this stage by looking
at the number, size and composition of expelled droplets.
subject to numero
its size. Stage III encompasses these
in which larger droplets
rapidly enough)
environment is a function of the exact conditions they are exposed to, as is the length of time
Figure 1.3
Airborne transmission and prevention:
Airborne transmission can be broken into 4 majo
I, droplets are formed at the infection site within the pulmonary system. They are then
transported to the naso
droplets range in size and number, but are loosel
The majority of bioaerosol research has, to date, focused on this stage by looking
at the number, size and composition of expelled droplets.
subject to numero
its size. Stage III encompasses these
in which larger droplets
and convective transport
environment is a function of the exact conditions they are exposed to, as is the length of time
Figure 1.3
Airborne transmission and prevention:
Airborne transmission can be broken into 4 majo
I, droplets are formed at the infection site within the pulmonary system. They are then
transported to the naso
droplets range in size and number, but are loosel
The majority of bioaerosol research has, to date, focused on this stage by looking
at the number, size and composition of expelled droplets.
subject to numerous forces resulting from environmental conditions, the droplet composition and
its size. Stage III encompasses these
in which larger droplets
and convective transport
environment is a function of the exact conditions they are exposed to, as is the length of time
Figure 1.3
Airborne transmission and prevention:
Airborne transmission can be broken into 4 majo
I, droplets are formed at the infection site within the pulmonary system. They are then
transported to the naso
droplets range in size and number, but are loosel
The majority of bioaerosol research has, to date, focused on this stage by looking
at the number, size and composition of expelled droplets.
us forces resulting from environmental conditions, the droplet composition and
its size. Stage III encompasses these
in which larger droplets
and convective transport
environment is a function of the exact conditions they are exposed to, as is the length of time
Figure 1.3
Airborne transmission and prevention:
Airborne transmission can be broken into 4 majo
I, droplets are formed at the infection site within the pulmonary system. They are then
transported to the naso-
droplets range in size and number, but are loosel
The majority of bioaerosol research has, to date, focused on this stage by looking
at the number, size and composition of expelled droplets.
us forces resulting from environmental conditions, the droplet composition and
its size. Stage III encompasses these
in which larger droplets
and convective transport
environment is a function of the exact conditions they are exposed to, as is the length of time
Figure 1.3
Airborne transmission and prevention:
Airborne transmission can be broken into 4 majo
I, droplets are formed at the infection site within the pulmonary system. They are then
-pharyngeal region and expelled to the environment in stage II. The
droplets range in size and number, but are loosel
The majority of bioaerosol research has, to date, focused on this stage by looking
at the number, size and composition of expelled droplets.
us forces resulting from environmental conditions, the droplet composition and
its size. Stage III encompasses these
in which larger droplets
and convective transport
environment is a function of the exact conditions they are exposed to, as is the length of time
Figure 1.3: Stages of airborne transmission, including small and large droplets
Airborne transmission and prevention:
Airborne transmission can be broken into 4 majo
I, droplets are formed at the infection site within the pulmonary system. They are then
pharyngeal region and expelled to the environment in stage II. The
droplets range in size and number, but are loosel
The majority of bioaerosol research has, to date, focused on this stage by looking
at the number, size and composition of expelled droplets.
us forces resulting from environmental conditions, the droplet composition and
its size. Stage III encompasses these
in which larger droplets
and convective transport
environment is a function of the exact conditions they are exposed to, as is the length of time
: Stages of airborne transmission, including small and large droplets
Airborne transmission and prevention:
Airborne transmission can be broken into 4 majo
I, droplets are formed at the infection site within the pulmonary system. They are then
pharyngeal region and expelled to the environment in stage II. The
droplets range in size and number, but are loosel
The majority of bioaerosol research has, to date, focused on this stage by looking
at the number, size and composition of expelled droplets.
us forces resulting from environmental conditions, the droplet composition and
its size. Stage III encompasses these forces
in which larger droplets
and convective transport
environment is a function of the exact conditions they are exposed to, as is the length of time
: Stages of airborne transmission, including small and large droplets
Airborne transmission and prevention:
Airborne transmission can be broken into 4 majo
I, droplets are formed at the infection site within the pulmonary system. They are then
pharyngeal region and expelled to the environment in stage II. The
droplets range in size and number, but are loosel
The majority of bioaerosol research has, to date, focused on this stage by looking
at the number, size and composition of expelled droplets.
us forces resulting from environmental conditions, the droplet composition and
forces
may transition to small
and convective transport.
environment is a function of the exact conditions they are exposed to, as is the length of time
: Stages of airborne transmission, including small and large droplets
Airborne transmission and prevention:
Airborne transmission can be broken into 4 majo
I, droplets are formed at the infection site within the pulmonary system. They are then
pharyngeal region and expelled to the environment in stage II. The
droplets range in size and number, but are loosel
The majority of bioaerosol research has, to date, focused on this stage by looking
at the number, size and composition of expelled droplets.
us forces resulting from environmental conditions, the droplet composition and
forces
may transition to small
. The length of time the droplets persist in the
environment is a function of the exact conditions they are exposed to, as is the length of time
: Stages of airborne transmission, including small and large droplets
Airborne transmission can be broken into 4 majo
I, droplets are formed at the infection site within the pulmonary system. They are then
pharyngeal region and expelled to the environment in stage II. The
droplets range in size and number, but are loosel
The majority of bioaerosol research has, to date, focused on this stage by looking
at the number, size and composition of expelled droplets.
us forces resulting from environmental conditions, the droplet composition and
forces, in which the
may transition to small
The length of time the droplets persist in the
environment is a function of the exact conditions they are exposed to, as is the length of time
: Stages of airborne transmission, including small and large droplets
Airborne transmission can be broken into 4 majo
I, droplets are formed at the infection site within the pulmonary system. They are then
pharyngeal region and expelled to the environment in stage II. The
droplets range in size and number, but are loosel
The majority of bioaerosol research has, to date, focused on this stage by looking
at the number, size and composition of expelled droplets.
us forces resulting from environmental conditions, the droplet composition and
, in which the
may transition to small
The length of time the droplets persist in the
environment is a function of the exact conditions they are exposed to, as is the length of time
6
: Stages of airborne transmission, including small and large droplets
Airborne transmission can be broken into 4 majo
I, droplets are formed at the infection site within the pulmonary system. They are then
pharyngeal region and expelled to the environment in stage II. The
droplets range in size and number, but are loosely divided into large droplets and small droplets
The majority of bioaerosol research has, to date, focused on this stage by looking
at the number, size and composition of expelled droplets.
us forces resulting from environmental conditions, the droplet composition and
, in which the
may transition to small
The length of time the droplets persist in the
environment is a function of the exact conditions they are exposed to, as is the length of time
6
: Stages of airborne transmission, including small and large droplets
Airborne transmission can be broken into 4 majo
I, droplets are formed at the infection site within the pulmonary system. They are then
pharyngeal region and expelled to the environment in stage II. The
y divided into large droplets and small droplets
The majority of bioaerosol research has, to date, focused on this stage by looking
at the number, size and composition of expelled droplets.
us forces resulting from environmental conditions, the droplet composition and
, in which the
may transition to small
The length of time the droplets persist in the
environment is a function of the exact conditions they are exposed to, as is the length of time
: Stages of airborne transmission, including small and large droplets
Airborne transmission can be broken into 4 major stages, as sh
I, droplets are formed at the infection site within the pulmonary system. They are then
pharyngeal region and expelled to the environment in stage II. The
y divided into large droplets and small droplets
The majority of bioaerosol research has, to date, focused on this stage by looking
at the number, size and composition of expelled droplets.
us forces resulting from environmental conditions, the droplet composition and
, in which the
may transition to small
The length of time the droplets persist in the
environment is a function of the exact conditions they are exposed to, as is the length of time
: Stages of airborne transmission, including small and large droplets
r stages, as sh
I, droplets are formed at the infection site within the pulmonary system. They are then
pharyngeal region and expelled to the environment in stage II. The
y divided into large droplets and small droplets
The majority of bioaerosol research has, to date, focused on this stage by looking
at the number, size and composition of expelled droplets.
us forces resulting from environmental conditions, the droplet composition and
droplets
may transition to small
The length of time the droplets persist in the
environment is a function of the exact conditions they are exposed to, as is the length of time
: Stages of airborne transmission, including small and large droplets
r stages, as sh
I, droplets are formed at the infection site within the pulmonary system. They are then
pharyngeal region and expelled to the environment in stage II. The
y divided into large droplets and small droplets
The majority of bioaerosol research has, to date, focused on this stage by looking
Once in the environment, they are
us forces resulting from environmental conditions, the droplet composition and
droplets
may transition to smaller
The length of time the droplets persist in the
environment is a function of the exact conditions they are exposed to, as is the length of time
: Stages of airborne transmission, including small and large droplets
r stages, as sh
I, droplets are formed at the infection site within the pulmonary system. They are then
pharyngeal region and expelled to the environment in stage II. The
y divided into large droplets and small droplets
The majority of bioaerosol research has, to date, focused on this stage by looking
Once in the environment, they are
us forces resulting from environmental conditions, the droplet composition and
droplets
er
The length of time the droplets persist in the
environment is a function of the exact conditions they are exposed to, as is the length of time
: Stages of airborne transmission, including small and large droplets
r stages, as sh
I, droplets are formed at the infection site within the pulmonary system. They are then
pharyngeal region and expelled to the environment in stage II. The
y divided into large droplets and small droplets
The majority of bioaerosol research has, to date, focused on this stage by looking
Once in the environment, they are
us forces resulting from environmental conditions, the droplet composition and
droplets
droplets if eva
The length of time the droplets persist in the
environment is a function of the exact conditions they are exposed to, as is the length of time
: Stages of airborne transmission, including small and large droplets
r stages, as sh
I, droplets are formed at the infection site within the pulmonary system. They are then
pharyngeal region and expelled to the environment in stage II. The
y divided into large droplets and small droplets
The majority of bioaerosol research has, to date, focused on this stage by looking
Once in the environment, they are
us forces resulting from environmental conditions, the droplet composition and
droplets are subject to sedimentation,
droplets if eva
The length of time the droplets persist in the
environment is a function of the exact conditions they are exposed to, as is the length of time
: Stages of airborne transmission, including small and large droplets
r stages, as sh
I, droplets are formed at the infection site within the pulmonary system. They are then
pharyngeal region and expelled to the environment in stage II. The
y divided into large droplets and small droplets
The majority of bioaerosol research has, to date, focused on this stage by looking
Once in the environment, they are
us forces resulting from environmental conditions, the droplet composition and
are subject to sedimentation,
droplets if eva
The length of time the droplets persist in the
environment is a function of the exact conditions they are exposed to, as is the length of time
: Stages of airborne transmission, including small and large droplets
r stages, as shown in Figure 1.3
I, droplets are formed at the infection site within the pulmonary system. They are then
pharyngeal region and expelled to the environment in stage II. The
y divided into large droplets and small droplets
The majority of bioaerosol research has, to date, focused on this stage by looking
Once in the environment, they are
us forces resulting from environmental conditions, the droplet composition and
are subject to sedimentation,
droplets if eva
The length of time the droplets persist in the
environment is a function of the exact conditions they are exposed to, as is the length of time
: Stages of airborne transmission, including small and large droplets
own in Figure 1.3
I, droplets are formed at the infection site within the pulmonary system. They are then
pharyngeal region and expelled to the environment in stage II. The
y divided into large droplets and small droplets
The majority of bioaerosol research has, to date, focused on this stage by looking
Once in the environment, they are
us forces resulting from environmental conditions, the droplet composition and
are subject to sedimentation,
droplets if evaporation occurs
The length of time the droplets persist in the
environment is a function of the exact conditions they are exposed to, as is the length of time
: Stages of airborne transmission, including small and large droplets
own in Figure 1.3
I, droplets are formed at the infection site within the pulmonary system. They are then
pharyngeal region and expelled to the environment in stage II. The
y divided into large droplets and small droplets
The majority of bioaerosol research has, to date, focused on this stage by looking
Once in the environment, they are
us forces resulting from environmental conditions, the droplet composition and
are subject to sedimentation,
poration occurs
The length of time the droplets persist in the
environment is a function of the exact conditions they are exposed to, as is the length of time
own in Figure 1.3. In stage
pharyngeal region and expelled to the environment in stage II. The
y divided into large droplets and small droplets
The majority of bioaerosol research has, to date, focused on this stage by looking
Once in the environment, they are
us forces resulting from environmental conditions, the droplet composition and
are subject to sedimentation,
poration occurs
environment is a function of the exact conditions they are exposed to, as is the length of time
. In stage
y divided into large droplets and small droplets
The majority of bioaerosol research has, to date, focused on this stage by looking
us forces resulting from environmental conditions, the droplet composition and
are subject to sedimentation,
. In stage
y divided into large droplets and small droplets
The majority of bioaerosol research has, to date, focused on this stage by looking
us forces resulting from environmental conditions, the droplet composition and
. In stage
y divided into large droplets and small droplets
us forces resulting from environmental conditions, the droplet composition and
. In stage
us forces resulting from environmental conditions, the droplet composition and

7
pathogens remain infectious (i.e. pathogen lifetime). Droplets which settle will contaminate
nearby surfaces, whereas bioaerosols persist in the air and may be convectively transported
larger distances. Both these routes can lead to exposure (stage IV), either through contact with
contaminated surfaces or through inhaled bioaerosols depositing directly in the lungs.
Prevention methods have largely focused on stage III and IV, either through treating the
environment (washing hands, cleaning exposed surfaces, etc.) or erecting barriers to prevent
inhalation (i.e. facemasks). However in 2004, David Edwards (Harvard University) et al.
published a study in the Proceedings of the National Academy of Science8 in which they
screened healthy human subjects for exhaled droplets both before and after treatment with
nebulized isotonic saline. This novel approach sought to address the issue of airborne
transmission by targeting the bioaerosol origin (stage I). They identified a portion of the
population as “super-producers” – individuals who expelled significantly greater droplet amounts
compared to the rest of the population. Treatment of these individuals with nebulized saline
subsequently reduced the number of droplets they expelled. These results were replicated with
Holstein bull calves in a subsequent study (R. Clarke et al., 2005, American Journal of Infection
Control10
). Further investigation of this effect was carried out by W. Watanabe et al. (2007,
Journal of Colloid and Interface Science)9 and indicated that inhaled salt water altered the
viscoelasticity of airway mucus through mucin charge-shielding, thereby stabilizing the interface
and resulting in reduced droplet formation.
Debate has arisen over the location and mechanism of bioaerosol formation within the
pulmonary system. The pulmonary system (Figure 1.4) is commonly divided into two regions:
the upper airways (which consists of the naso-pharynx, trachea, and bronchi) and the lower
airways (bronchioles and alveoli)14
.While the traditional view has been that droplets are formed

8
through shear forces acting on the surface of the airway lining fluid in the upper airways (as
demonstrated computationally by J. Moriarty and J. Grotberg in their 1999 publication)11
, an
alternative method involving film rupture in the lower airways has also been proposed (with
supporting research performed by G. Johnson and L. Morawska published in 2009 and
2010)12,13
.As the two mechanisms differ significantly, the relevant physical properties are likely
to differ as well; hence any investigation into bioaerosol prevention must consider both of these
approaches.
Figure 1.4: The pulmonary system14

9
Thesis research:
The purpose of my thesis will be to investigate the small droplet hypothesis of airborne
disease transmission (which states that small aerosols generated in the airways and expelled to
the environment can contain pathogens which lead to infection when inhaled), particularly with
the aim of preventing such transmission by targeting droplet origins (specifically through the use
of cationic agents to alter the physical properties of airway mucus). These goals will be
accomplished by empirical examination of the following hypotheses, which were developed
based on literature review and empirical results (to be demonstrated in subsequent chapters):
i) Droplet generation during tidal breathing can occur in both the
upper airways (via surface shear) and lower airways (via film
rupture) during inhalation, and will vary with bifurcation angle
in the upper airways.
ii) Mucus viscoelasticity will influence droplet formation by shear
forces, with increased stiffness yielding fewer droplets in total.
iii) Reducing the number of bioaerosols generated decreases the
probability of airborne pathogen transport, and therefore the
transmission of infection.
This research will yield a deeper understanding of bioaerosol formation and airborne
disease transmission. It will clarify the influence of cations on mucus viscoelasticity, and provide
guidelines regarding cation concentration which will have applicable ramifications in
determining effective dosages. Finally, bench-top tools will be developed to enable more rapid
experimentation on the mechanisms of bioaerosol formation.

10
References:
1. Ungchusak, K.; Auewarakul, P.; Dowell, S.; Kitphati, R.; Auwanit, W.; Puthavathana, P.; Uiprasertkul, M.;
Boonnak, K.; Pittayawonganon, C.; Cox, N.; Zaki, S.; Thawatsupha, P.; Chittaganpitch, M.; Khontong, R;
Simmerman, J.; Chunsutthiwat, S. (2005) N. Engl. J. Med. 352:333-340
2. Yu, I.; Li, Y.; Wong, T.; Tam, W.; Chan, A.; Lee, J.; Leung, D.; Ho, T. (2004) N. Engl. J. Med. 350:1731-
1739
3. Roy, C.; Milton, D. (2004) N. Engl. J. Med. 350:1741-1744
4. Charney, W. (1991) J. Occu. Med. 33(9): 943-944
5. Duguid, J. (1946) British Medical Journal 265-268
6. Loudon, R.; Roberts, R. (1967) American Review of Respiratory Disease95(3): 435-438
7. Papineni, R.; Rosenthal, J. (1997) J Aerosol Med. 10(2):105-116
8. Edwards, D.; Man, J.; Brand, P.; Katstra, J.; Sommerer, K.; Stone, H.; Nardell, E.; Scheuch, G.
(2004)PNAS 101(50): 17383-17388
9. Watanabe, W.; Thomas, M.; Clarke, R.; Klibanov, A.; Langer, R.; Katstra, K.;Fuller, G.; Griele, L.; Fiegel,
J.; Edwards, D. (2007) J Colloid Interface Sci. 307(1): 71–78
10. Clarke, R.; Katstra, J.;Man, J.;Dehaan, W.;Edwards, D.;Griel, L. (2005)American J Infection Control33(5):
85
11. Moriarty, J.; Grotberg, J. (1999) J. Fluid Mech. 397: 1–22.
12. Johnson, G.; Morawska, L. (2009) J Aerosol Med Pulm Drug Deliv. 22:1-9.
13. Morawska, L.; Johnson, G.; Ristovski, Z.; Hargreaves, M.; Mengersen, K.; Corbett, S.; Chao, C.; Li, Y.;
Katoshevski, D.(2009) J Aerosol Sci. 40:256-269
14. Hinds, W.(1982) Aerosol technology - properties, behaviour, and measurements of airborne particles

11
Chapter 2: Mechanisms of bioaerosol formation and transport
Introduction:
In order to investigate airborne transmission through bioaerosols, as discussed in chapter
1, a review of existing literature and theory regarding the mechanisms of formation and transport
is necessary. Bioaerosols (biological aerosols) are small, airborne droplets containing pathogens
and other biological material which are generated in the lungs1. They are formed from the airway
lining fluid (ALF) which is a protective coating covering the entire pulmonary system. As such,
the material properties of the ALF will influence the mechanics of droplet formation. The
structure of the pulmonary system will also be relevant, especially in regards to the type of
breath-action (coughing versus tidal breathing) as well as the location of droplet formation.
Some controversy over the exact mechanism and origin of droplet formation has arisen
over the past decade, particularly with respect to formation during tidal breathing, resulting in
two major schools of thought. The first states that droplet generation occurs in the upper airways
due to shedding (arising from instabilities) from surface wave-crests formed in the ALF as the
result of surface-shearing by air. This mechanism is similar to that involved in cough-generated
droplets, but occurs at much lower air-flow velocities. Kelvin-Helmholtz instabilities arising
from core-annular flow were studied experimentally by I. Kataoka in 198226
, and droplet
formation was shown to be theoretically possible for a complete ALF model by J. Moriarty and
J. Grotberg in 199918
. The second mechanism proposed involves droplet shedding from ruptured
films which arise from the reopening of collapsed bronchioles in the lower airways. The basic
mechanism of film rupture producing droplets was first reported by Blanchard in 1963 with
respect to bubbles in sea water27
. Small-airway collapse in healthy subjects was established in
the 1970s (L. Engel et al. demonstrated the phenomenon in 197528
), but the link to film-rupture
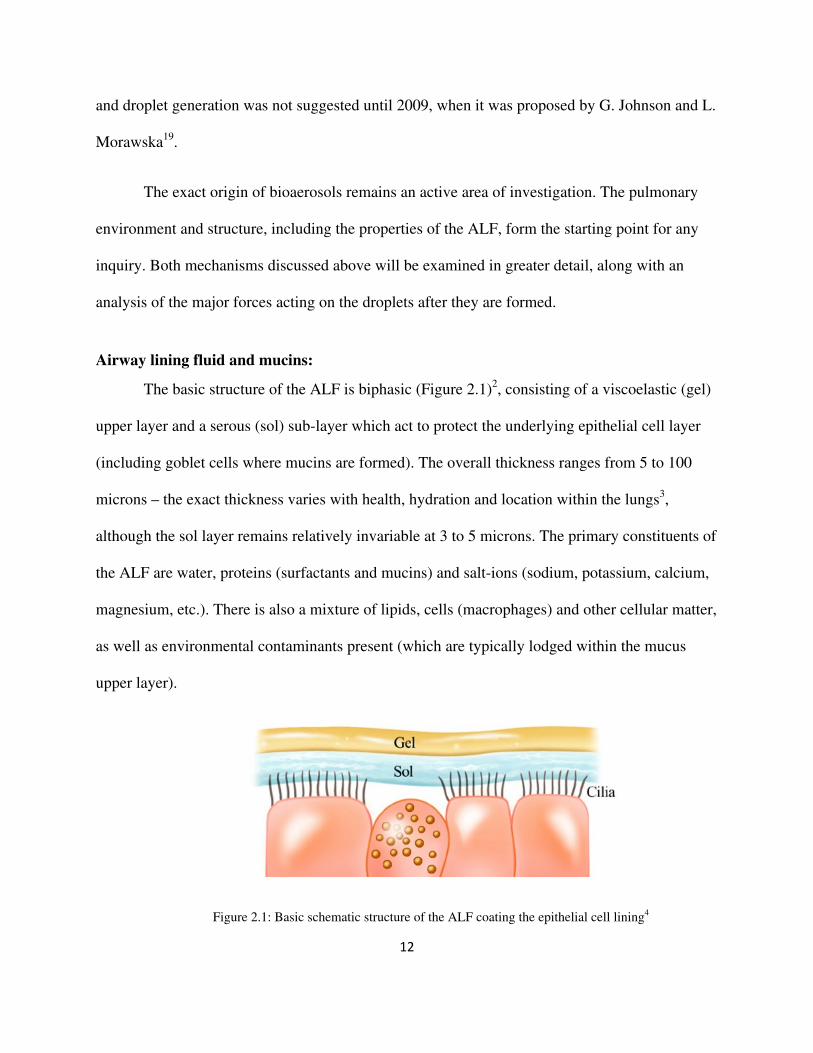
12
and droplet generation was not suggested until 2009, when it was proposed by G. Johnson and L.
Morawska19
.
The exact origin of bioaerosols remains an active area of investigation. The pulmonary
environment and structure, including the properties of the ALF, form the starting point for any
inquiry. Both mechanisms discussed above will be examined in greater detail, along with an
analysis of the major forces acting on the droplets after they are formed.
Airway lining fluid and mucins:
The basic structure of the ALF is biphasic (Figure 2.1)2, consisting of a viscoelastic (gel)
upper layer and a serous (sol) sub-layer which act to protect the underlying epithelial cell layer
(including goblet cells where mucins are formed). The overall thickness ranges from 5 to 100
microns – the exact thickness varies with health, hydration and location within the lungs3,
although the sol layer remains relatively invariable at 3 to 5 microns. The primary constituents of
the ALF are water, proteins (surfactants and mucins) and salt-ions (sodium, potassium, calcium,
magnesium, etc.). There is also a mixture of lipids, cells (macrophages) and other cellular matter,
as well as environmental contaminants present (which are typically lodged within the mucus
upper layer).
Figure 2.1: Basic schematic structure of the ALF coating the epithelial cell lining4

13
ALF is one of the lung’s primary defense mechanisms3, acting as a protective layer
designed to trap or slow contaminants/pathogens and prevent access to the epithelial layer of the
lungs, as well as maintain cellular hydration. These trapped contaminants are transported along
with the ALF via the “mucociliary escalator”5, which involves hair-like cilia extending from the
epithelial layer through the sol sub-layer and moving in a two-stroke pattern (see Figure 2.2) in
coordination with surrounding cilia. This process drives the ALF and any trapped material in a
cephalic direction (towards the head), clearing the pulmonary system and exiting into the throat,
where it can be swallowed and ultimately digested5.
Figure 2.2: Ciliary two-stroke pattern – recovery stroke in limp state (1-9) followed by an effective stroke6
The hydration level of the ALF, which directly influences the thickness as well as other
material properties, is primarily regulated by ion concentrations. Cellular ion channels sensitized
to concentration trigger the secretion or absorption of aqueous fluid, which is thought to be
released from serous and clara cells and absorbed by brush cells7. The basic constituents and
their typical concentrations in healthy ALF are shown in Table 2.1 (data was taken from
Junqueira’s Basic Histology: Text and Atlas8).

14
Table 2.1: Mucus constituents and concentrations
Mucus forms the upper layer of the ALF. Mucus is a mixture of water and mucin
glycoproteins (as well as lipids, proteoglycans and salts/minerals)8. Glycoproteins are extremely
large (molecular mass >1MDa) polymer-like molecules (see Figure 2.3). In human pulmonary
mucus, the primary mucins expressed are MUC5b and MUC5ac9. The central backbone of the
mucin monomer is composed of several cysteine rich domains and repeating regions of heavy
glycosylation (O- and N-linked oligosaccharides). These regions are negatively charged with
sialic acids and sulfate groups. Disulfide rich domains are found at the terminal ends of the
monomer, which bundle together to stabilize the un-glycosylated regions of the protein, and
which can crosslink with other monomers (end-to-end) to form a larger mucus network10
.
Figure 2.3: Mucin monomer structure11
Constituent Concentration
(%w/w)
Water >95
Glycoproteins 1-2
Free Protein 0.5-1
Salts/Minerals 1

sub
high concentrations of calcium causing significant charge
sub
monomer to spread out and away from each ot
These monomers interact with each other, forming non
through di
viscoelastic prope
associates with hydrophilic regions found along the mucin chains.
sub
high concentrations of calcium causing significant charge
sub
monomer to spread out and away from each ot
These monomers interact with each other, forming non
through di
viscoelastic prope
associates with hydrophilic regions found along the mucin chains.
sub
high concentrations of calcium causing significant charge
sub
monomer to spread out and away from each ot
These monomers interact with each other, forming non
through di
viscoelastic prope
associates with hydrophilic regions found along the mucin chains.
sub-
high concentrations of calcium causing significant charge
sub-
monomer to spread out and away from each ot
These monomers interact with each other, forming non
through di
viscoelastic prope
associates with hydrophilic regions found along the mucin chains.
-layer via a calcium
high concentrations of calcium causing significant charge
-layer, sodium ions exchange places with calcium ions, driving the folds and loops of the
monomer to spread out and away from each ot
These monomers interact with each other, forming non
through di
viscoelastic prope
associates with hydrophilic regions found along the mucin chains.
layer via a calcium
high concentrations of calcium causing significant charge
layer, sodium ions exchange places with calcium ions, driving the folds and loops of the
monomer to spread out and away from each ot
These monomers interact with each other, forming non
through di
viscoelastic prope
associates with hydrophilic regions found along the mucin chains.
Mucins are formed in goblet cells within the epithelial lining, and released into the sol
layer via a calcium
high concentrations of calcium causing significant charge
layer, sodium ions exchange places with calcium ions, driving the folds and loops of the
monomer to spread out and away from each ot
These monomers interact with each other, forming non
through disulfide bridges. This results in an oligomeric mucin network from which the gel
viscoelastic prope
associates with hydrophilic regions found along the mucin chains.
Mucins are formed in goblet cells within the epithelial lining, and released into the sol
layer via a calcium
high concentrations of calcium causing significant charge
layer, sodium ions exchange places with calcium ions, driving the folds and loops of the
monomer to spread out and away from each ot
These monomers interact with each other, forming non
sulfide bridges. This results in an oligomeric mucin network from which the gel
viscoelastic properties of mucus arises. This gel includes bound or “trapped” water, which
associates with hydrophilic regions found along the mucin chains.
Mucins are formed in goblet cells within the epithelial lining, and released into the sol
layer via a calcium
high concentrations of calcium causing significant charge
layer, sodium ions exchange places with calcium ions, driving the folds and loops of the
monomer to spread out and away from each ot
These monomers interact with each other, forming non
sulfide bridges. This results in an oligomeric mucin network from which the gel
rties of mucus arises. This gel includes bound or “trapped” water, which
associates with hydrophilic regions found along the mucin chains.
Figure 2.
Mucins are formed in goblet cells within the epithelial lining, and released into the sol
layer via a calcium-
high concentrations of calcium causing significant charge
layer, sodium ions exchange places with calcium ions, driving the folds and loops of the
monomer to spread out and away from each ot
These monomers interact with each other, forming non
sulfide bridges. This results in an oligomeric mucin network from which the gel
rties of mucus arises. This gel includes bound or “trapped” water, which
associates with hydrophilic regions found along the mucin chains.
Figure 2.
Mucins are formed in goblet cells within the epithelial lining, and released into the sol
-sodium exchange (Figure 2.
high concentrations of calcium causing significant charge
layer, sodium ions exchange places with calcium ions, driving the folds and loops of the
monomer to spread out and away from each ot
These monomers interact with each other, forming non
sulfide bridges. This results in an oligomeric mucin network from which the gel
rties of mucus arises. This gel includes bound or “trapped” water, which
associates with hydrophilic regions found along the mucin chains.
Figure 2.
Mucins are formed in goblet cells within the epithelial lining, and released into the sol
sodium exchange (Figure 2.
high concentrations of calcium causing significant charge
layer, sodium ions exchange places with calcium ions, driving the folds and loops of the
monomer to spread out and away from each ot
These monomers interact with each other, forming non
sulfide bridges. This results in an oligomeric mucin network from which the gel
rties of mucus arises. This gel includes bound or “trapped” water, which
associates with hydrophilic regions found along the mucin chains.
Figure 2.4
Mucins are formed in goblet cells within the epithelial lining, and released into the sol
sodium exchange (Figure 2.
high concentrations of calcium causing significant charge
layer, sodium ions exchange places with calcium ions, driving the folds and loops of the
monomer to spread out and away from each ot
These monomers interact with each other, forming non
sulfide bridges. This results in an oligomeric mucin network from which the gel
rties of mucus arises. This gel includes bound or “trapped” water, which
associates with hydrophilic regions found along the mucin chains.
4: Mucin release from goblet cells, expansion via Ca
Mucins are formed in goblet cells within the epithelial lining, and released into the sol
sodium exchange (Figure 2.
high concentrations of calcium causing significant charge
layer, sodium ions exchange places with calcium ions, driving the folds and loops of the
monomer to spread out and away from each ot
These monomers interact with each other, forming non
sulfide bridges. This results in an oligomeric mucin network from which the gel
rties of mucus arises. This gel includes bound or “trapped” water, which
associates with hydrophilic regions found along the mucin chains.
: Mucin release from goblet cells, expansion via Ca
Mucins are formed in goblet cells within the epithelial lining, and released into the sol
sodium exchange (Figure 2.
high concentrations of calcium causing significant charge
layer, sodium ions exchange places with calcium ions, driving the folds and loops of the
monomer to spread out and away from each other, rapidly expanding in size up to 600 fold.
These monomers interact with each other, forming non
sulfide bridges. This results in an oligomeric mucin network from which the gel
rties of mucus arises. This gel includes bound or “trapped” water, which
associates with hydrophilic regions found along the mucin chains.
: Mucin release from goblet cells, expansion via Ca
15
Mucins are formed in goblet cells within the epithelial lining, and released into the sol
sodium exchange (Figure 2.
high concentrations of calcium causing significant charge
layer, sodium ions exchange places with calcium ions, driving the folds and loops of the
her, rapidly expanding in size up to 600 fold.
These monomers interact with each other, forming non
sulfide bridges. This results in an oligomeric mucin network from which the gel
rties of mucus arises. This gel includes bound or “trapped” water, which
associates with hydrophilic regions found along the mucin chains.
: Mucin release from goblet cells, expansion via Ca
Mucins are formed in goblet cells within the epithelial lining, and released into the sol
sodium exchange (Figure 2.4
high concentrations of calcium causing significant charge
layer, sodium ions exchange places with calcium ions, driving the folds and loops of the
her, rapidly expanding in size up to 600 fold.
These monomers interact with each other, forming non
sulfide bridges. This results in an oligomeric mucin network from which the gel
rties of mucus arises. This gel includes bound or “trapped” water, which
associates with hydrophilic regions found along the mucin chains.
: Mucin release from goblet cells, expansion via Ca
Mucins are formed in goblet cells within the epithelial lining, and released into the sol
4). They are initial
high concentrations of calcium causing significant charge
layer, sodium ions exchange places with calcium ions, driving the folds and loops of the
her, rapidly expanding in size up to 600 fold.
These monomers interact with each other, forming non
sulfide bridges. This results in an oligomeric mucin network from which the gel
rties of mucus arises. This gel includes bound or “trapped” water, which
associates with hydrophilic regions found along the mucin chains.
: Mucin release from goblet cells, expansion via Ca
Mucins are formed in goblet cells within the epithelial lining, and released into the sol
). They are initial
high concentrations of calcium causing significant charge
layer, sodium ions exchange places with calcium ions, driving the folds and loops of the
her, rapidly expanding in size up to 600 fold.
These monomers interact with each other, forming non-
sulfide bridges. This results in an oligomeric mucin network from which the gel
rties of mucus arises. This gel includes bound or “trapped” water, which
associates with hydrophilic regions found along the mucin chains.
: Mucin release from goblet cells, expansion via Ca
Mucins are formed in goblet cells within the epithelial lining, and released into the sol
). They are initial
high concentrations of calcium causing significant charge
layer, sodium ions exchange places with calcium ions, driving the folds and loops of the
her, rapidly expanding in size up to 600 fold.
-covalent bonds, enta
sulfide bridges. This results in an oligomeric mucin network from which the gel
rties of mucus arises. This gel includes bound or “trapped” water, which
associates with hydrophilic regions found along the mucin chains.
: Mucin release from goblet cells, expansion via Ca
Mucins are formed in goblet cells within the epithelial lining, and released into the sol
). They are initial
high concentrations of calcium causing significant charge-
layer, sodium ions exchange places with calcium ions, driving the folds and loops of the
her, rapidly expanding in size up to 600 fold.
covalent bonds, enta
sulfide bridges. This results in an oligomeric mucin network from which the gel
rties of mucus arises. This gel includes bound or “trapped” water, which
associates with hydrophilic regions found along the mucin chains.
: Mucin release from goblet cells, expansion via Ca
Mucins are formed in goblet cells within the epithelial lining, and released into the sol
). They are initial
-shielding) but when released to the
layer, sodium ions exchange places with calcium ions, driving the folds and loops of the
her, rapidly expanding in size up to 600 fold.
covalent bonds, enta
sulfide bridges. This results in an oligomeric mucin network from which the gel
rties of mucus arises. This gel includes bound or “trapped” water, which
associates with hydrophilic regions found along the mucin chains.
: Mucin release from goblet cells, expansion via Ca
Mucins are formed in goblet cells within the epithelial lining, and released into the sol
). They are initial
shielding) but when released to the
layer, sodium ions exchange places with calcium ions, driving the folds and loops of the
her, rapidly expanding in size up to 600 fold.
covalent bonds, enta
sulfide bridges. This results in an oligomeric mucin network from which the gel
rties of mucus arises. This gel includes bound or “trapped” water, which
associates with hydrophilic regions found along the mucin chains.10
: Mucin release from goblet cells, expansion via Ca
Mucins are formed in goblet cells within the epithelial lining, and released into the sol
). They are initial
shielding) but when released to the
layer, sodium ions exchange places with calcium ions, driving the folds and loops of the
her, rapidly expanding in size up to 600 fold.
covalent bonds, enta
sulfide bridges. This results in an oligomeric mucin network from which the gel
rties of mucus arises. This gel includes bound or “trapped” water, which
10
: Mucin release from goblet cells, expansion via Ca
Mucins are formed in goblet cells within the epithelial lining, and released into the sol
). They are initial
shielding) but when released to the
layer, sodium ions exchange places with calcium ions, driving the folds and loops of the
her, rapidly expanding in size up to 600 fold.
covalent bonds, enta
sulfide bridges. This results in an oligomeric mucin network from which the gel
rties of mucus arises. This gel includes bound or “trapped” water, which
: Mucin release from goblet cells, expansion via Ca-
Mucins are formed in goblet cells within the epithelial lining, and released into the sol
). They are initially tightly packed (due to
shielding) but when released to the
layer, sodium ions exchange places with calcium ions, driving the folds and loops of the
her, rapidly expanding in size up to 600 fold.
covalent bonds, enta
sulfide bridges. This results in an oligomeric mucin network from which the gel
rties of mucus arises. This gel includes bound or “trapped” water, which
-Na ion exchange
Mucins are formed in goblet cells within the epithelial lining, and released into the sol
ly tightly packed (due to
shielding) but when released to the
layer, sodium ions exchange places with calcium ions, driving the folds and loops of the
her, rapidly expanding in size up to 600 fold.
covalent bonds, enta
sulfide bridges. This results in an oligomeric mucin network from which the gel
rties of mucus arises. This gel includes bound or “trapped” water, which
Na ion exchange
Mucins are formed in goblet cells within the epithelial lining, and released into the sol
ly tightly packed (due to
shielding) but when released to the
layer, sodium ions exchange places with calcium ions, driving the folds and loops of the
her, rapidly expanding in size up to 600 fold.
covalent bonds, entangling or connecting
sulfide bridges. This results in an oligomeric mucin network from which the gel
rties of mucus arises. This gel includes bound or “trapped” water, which
Na ion exchange
Mucins are formed in goblet cells within the epithelial lining, and released into the sol
ly tightly packed (due to
shielding) but when released to the
layer, sodium ions exchange places with calcium ions, driving the folds and loops of the
her, rapidly expanding in size up to 600 fold.
ngling or connecting
sulfide bridges. This results in an oligomeric mucin network from which the gel
rties of mucus arises. This gel includes bound or “trapped” water, which
Na ion exchange12
Mucins are formed in goblet cells within the epithelial lining, and released into the sol
ly tightly packed (due to
shielding) but when released to the
layer, sodium ions exchange places with calcium ions, driving the folds and loops of the
her, rapidly expanding in size up to 600 fold.
ngling or connecting
sulfide bridges. This results in an oligomeric mucin network from which the gel
rties of mucus arises. This gel includes bound or “trapped” water, which
12
Mucins are formed in goblet cells within the epithelial lining, and released into the sol
ly tightly packed (due to
shielding) but when released to the
layer, sodium ions exchange places with calcium ions, driving the folds and loops of the
her, rapidly expanding in size up to 600 fold.
ngling or connecting
sulfide bridges. This results in an oligomeric mucin network from which the gel
rties of mucus arises. This gel includes bound or “trapped” water, which
Mucins are formed in goblet cells within the epithelial lining, and released into the sol
ly tightly packed (due to
shielding) but when released to the
layer, sodium ions exchange places with calcium ions, driving the folds and loops of the
her, rapidly expanding in size up to 600 fold.
ngling or connecting
sulfide bridges. This results in an oligomeric mucin network from which the gel-
rties of mucus arises. This gel includes bound or “trapped” water, which
Mucins are formed in goblet cells within the epithelial lining, and released into the sol
ly tightly packed (due to
shielding) but when released to the
layer, sodium ions exchange places with calcium ions, driving the folds and loops of the
her, rapidly expanding in size up to 600 fold.12
ngling or connecting
-like
rties of mucus arises. This gel includes bound or “trapped” water, which
Mucins are formed in goblet cells within the epithelial lining, and released into the sol
ly tightly packed (due to
shielding) but when released to the
layer, sodium ions exchange places with calcium ions, driving the folds and loops of the
12
ngling or connecting
like
Mucins are formed in goblet cells within the epithelial lining, and released into the sol
ly tightly packed (due to
shielding) but when released to the
layer, sodium ions exchange places with calcium ions, driving the folds and loops of the
12
ngling or connecting
like
Mucins are formed in goblet cells within the epithelial lining, and released into the sol
ly tightly packed (due to
shielding) but when released to the
ngling or connecting
like
ly tightly packed (due to
ngling or connecting
like
ngling or connecting ngling or connecting

16
The physical properties of the ALF are specifically adapted to achieve the protective
coating which is its primary purpose. The viscoelastic nature of mucus provides an elastic and
physical diffusion barrier to particle contaminants from the environment, while retaining a
sufficiently viscous nature to allow transport and clearance, as well as maintaining a complete
covering of the epithelial layer10
(viscoelasticity will be discussed in greater detail within
Chapter 4). In addition, pulmonary surfactant proteins, combined with lipids, reduce the work of
breathing by preventing complete collapse and easier expansion of the alveolar termini of the
pulmonary system. The surface tension is lowest in the alveoli, increasing throughout the lungs
and towards the trachea13
. Reported values for ALF physical properties vary widely as a result of
methodology and conditions – ranges are listed in Table 2.2.
Table 2.2: Physical properties of the ALF
The Pulmonary System:
The pulmonary system’s purpose is to transport oxygen into the bloodstream while
removing carbon dioxide. It is typically divided into two regions: the conducting portion, which
is further separated into the upper airways (naso-pharynx, trachea and bronchi) and the lower
airways (bronchioles and terminal bronchioles); and the respiratory portion, which includes the
Property Value
Viscoelasticity
- Complex Modulus 5-50 Pa
- Loss Tangent 0.2-0.4
Surface Tension
- Lower Airway 1-30 mN/m
- Upper Airway 30-60 mN/m
pH 6.8-7.2

respiratory bronchioles and alveoli (where the exchange of O
occurs
adapted by Hinds
cylindrical elements in which the parent cylinder divides into two child cylinders of smaller
diameter (the cross
model t
internal organs means there is a difference in total volume between the right and left lobes of the
lungs (which
child cylinders is the bifurcation angle. Each bifurcation indicates the start of a new air
generation, as indicated in Figure 2.
is employed so that each air
velocities, despite differing locations in physical space.
respiratory bronchioles and alveoli (where the exchange of O
occurs14
adapted by Hinds
cylindrical elements in which the parent cylinder divides into two child cylinders of smaller
diameter (the cross
model t
internal organs means there is a difference in total volume between the right and left lobes of the
lungs (which
child cylinders is the bifurcation angle. Each bifurcation indicates the start of a new air
generation, as indicated in Figure 2.
is employed so that each air
velocities, despite differing locations in physical space.
respiratory bronchioles and alveoli (where the exchange of O
14).
The basic, simplified structure was introduced by E. R. Weibel
adapted by Hinds
cylindrical elements in which the parent cylinder divides into two child cylinders of smaller
diameter (the cross
model treats each child
internal organs means there is a difference in total volume between the right and left lobes of the
lungs (which
child cylinders is the bifurcation angle. Each bifurcation indicates the start of a new air
generation, as indicated in Figure 2.
is employed so that each air
velocities, despite differing locations in physical space.
respiratory bronchioles and alveoli (where the exchange of O
).
The basic, simplified structure was introduced by E. R. Weibel
adapted by Hinds
cylindrical elements in which the parent cylinder divides into two child cylinders of smaller
diameter (the cross
reats each child
internal organs means there is a difference in total volume between the right and left lobes of the
lungs (which
child cylinders is the bifurcation angle. Each bifurcation indicates the start of a new air
generation, as indicated in Figure 2.
is employed so that each air
velocities, despite differing locations in physical space.
respiratory bronchioles and alveoli (where the exchange of O
The basic, simplified structure was introduced by E. R. Weibel
adapted by Hinds
cylindrical elements in which the parent cylinder divides into two child cylinders of smaller
diameter (the cross
reats each child
internal organs means there is a difference in total volume between the right and left lobes of the
lungs (which can result
child cylinders is the bifurcation angle. Each bifurcation indicates the start of a new air
generation, as indicated in Figure 2.
is employed so that each air
velocities, despite differing locations in physical space.
respiratory bronchioles and alveoli (where the exchange of O
The basic, simplified structure was introduced by E. R. Weibel
adapted by Hinds
cylindrical elements in which the parent cylinder divides into two child cylinders of smaller
diameter (the cross
reats each child
internal organs means there is a difference in total volume between the right and left lobes of the
can result
child cylinders is the bifurcation angle. Each bifurcation indicates the start of a new air
generation, as indicated in Figure 2.
is employed so that each air
velocities, despite differing locations in physical space.
respiratory bronchioles and alveoli (where the exchange of O
The basic, simplified structure was introduced by E. R. Weibel
adapted by Hinds31
cylindrical elements in which the parent cylinder divides into two child cylinders of smaller
diameter (the cross
reats each child
internal organs means there is a difference in total volume between the right and left lobes of the
can result
child cylinders is the bifurcation angle. Each bifurcation indicates the start of a new air
generation, as indicated in Figure 2.
is employed so that each air
velocities, despite differing locations in physical space.
respiratory bronchioles and alveoli (where the exchange of O
The basic, simplified structure was introduced by E. R. Weibel
31: beginning with the
cylindrical elements in which the parent cylinder divides into two child cylinders of smaller
diameter (the cross-
reats each child
internal organs means there is a difference in total volume between the right and left lobes of the
can result
child cylinders is the bifurcation angle. Each bifurcation indicates the start of a new air
generation, as indicated in Figure 2.
is employed so that each air
velocities, despite differing locations in physical space.
respiratory bronchioles and alveoli (where the exchange of O
The basic, simplified structure was introduced by E. R. Weibel
: beginning with the
cylindrical elements in which the parent cylinder divides into two child cylinders of smaller
-sectional area of each child branch is decreased by a factor of 0.75
reats each child
internal organs means there is a difference in total volume between the right and left lobes of the
can result
child cylinders is the bifurcation angle. Each bifurcation indicates the start of a new air
generation, as indicated in Figure 2.
is employed so that each air
velocities, despite differing locations in physical space.
respiratory bronchioles and alveoli (where the exchange of O
The basic, simplified structure was introduced by E. R. Weibel
: beginning with the
cylindrical elements in which the parent cylinder divides into two child cylinders of smaller
sectional area of each child branch is decreased by a factor of 0.75
reats each child-
internal organs means there is a difference in total volume between the right and left lobes of the
can result
child cylinders is the bifurcation angle. Each bifurcation indicates the start of a new air
generation, as indicated in Figure 2.
is employed so that each air
velocities, despite differing locations in physical space.
respiratory bronchioles and alveoli (where the exchange of O
The basic, simplified structure was introduced by E. R. Weibel
: beginning with the
cylindrical elements in which the parent cylinder divides into two child cylinders of smaller
sectional area of each child branch is decreased by a factor of 0.75
-cylinder as equal, although in reality the need to make room for other
internal organs means there is a difference in total volume between the right and left lobes of the
in differing sizes between child
child cylinders is the bifurcation angle. Each bifurcation indicates the start of a new air
generation, as indicated in Figure 2.
is employed so that each air
velocities, despite differing locations in physical space.
respiratory bronchioles and alveoli (where the exchange of O
The basic, simplified structure was introduced by E. R. Weibel
: beginning with the
cylindrical elements in which the parent cylinder divides into two child cylinders of smaller
sectional area of each child branch is decreased by a factor of 0.75
cylinder as equal, although in reality the need to make room for other
internal organs means there is a difference in total volume between the right and left lobes of the
in differing sizes between child
child cylinders is the bifurcation angle. Each bifurcation indicates the start of a new air
generation, as indicated in Figure 2.
is employed so that each air-way gene
velocities, despite differing locations in physical space.
respiratory bronchioles and alveoli (where the exchange of O
The basic, simplified structure was introduced by E. R. Weibel
: beginning with the
cylindrical elements in which the parent cylinder divides into two child cylinders of smaller
sectional area of each child branch is decreased by a factor of 0.75
cylinder as equal, although in reality the need to make room for other
internal organs means there is a difference in total volume between the right and left lobes of the
in differing sizes between child
child cylinders is the bifurcation angle. Each bifurcation indicates the start of a new air
generation, as indicated in Figure 2.
way gene
velocities, despite differing locations in physical space.
Figure 2.5
respiratory bronchioles and alveoli (where the exchange of O
The basic, simplified structure was introduced by E. R. Weibel
: beginning with the
cylindrical elements in which the parent cylinder divides into two child cylinders of smaller
sectional area of each child branch is decreased by a factor of 0.75
cylinder as equal, although in reality the need to make room for other
internal organs means there is a difference in total volume between the right and left lobes of the
in differing sizes between child
child cylinders is the bifurcation angle. Each bifurcation indicates the start of a new air
generation, as indicated in Figure 2.5
way gene
velocities, despite differing locations in physical space.
Figure 2.5
respiratory bronchioles and alveoli (where the exchange of O
The basic, simplified structure was introduced by E. R. Weibel
: beginning with the
cylindrical elements in which the parent cylinder divides into two child cylinders of smaller
sectional area of each child branch is decreased by a factor of 0.75
cylinder as equal, although in reality the need to make room for other
internal organs means there is a difference in total volume between the right and left lobes of the
in differing sizes between child
child cylinders is the bifurcation angle. Each bifurcation indicates the start of a new air
5, beginning with the trachea numbered zero
way gene
velocities, despite differing locations in physical space.
Figure 2.5
respiratory bronchioles and alveoli (where the exchange of O
The basic, simplified structure was introduced by E. R. Weibel
: beginning with the
cylindrical elements in which the parent cylinder divides into two child cylinders of smaller
sectional area of each child branch is decreased by a factor of 0.75
cylinder as equal, although in reality the need to make room for other
internal organs means there is a difference in total volume between the right and left lobes of the
in differing sizes between child
child cylinders is the bifurcation angle. Each bifurcation indicates the start of a new air
, beginning with the trachea numbered zero
way generation is characterized by similar diameter and airflow
velocities, despite differing locations in physical space.
Figure 2.5
respiratory bronchioles and alveoli (where the exchange of O
The basic, simplified structure was introduced by E. R. Weibel
: beginning with the
cylindrical elements in which the parent cylinder divides into two child cylinders of smaller
sectional area of each child branch is decreased by a factor of 0.75
cylinder as equal, although in reality the need to make room for other
internal organs means there is a difference in total volume between the right and left lobes of the
in differing sizes between child
child cylinders is the bifurcation angle. Each bifurcation indicates the start of a new air
, beginning with the trachea numbered zero
ration is characterized by similar diameter and airflow
velocities, despite differing locations in physical space.
Figure 2.5: Airway generation numbering schematic
respiratory bronchioles and alveoli (where the exchange of O
The basic, simplified structure was introduced by E. R. Weibel
trachea, it consists of a series of bifurcated, roughly
cylindrical elements in which the parent cylinder divides into two child cylinders of smaller
sectional area of each child branch is decreased by a factor of 0.75
cylinder as equal, although in reality the need to make room for other
internal organs means there is a difference in total volume between the right and left lobes of the
in differing sizes between child
child cylinders is the bifurcation angle. Each bifurcation indicates the start of a new air
, beginning with the trachea numbered zero
ration is characterized by similar diameter and airflow
velocities, despite differing locations in physical space.
: Airway generation numbering schematic
17
respiratory bronchioles and alveoli (where the exchange of O
The basic, simplified structure was introduced by E. R. Weibel
trachea, it consists of a series of bifurcated, roughly
cylindrical elements in which the parent cylinder divides into two child cylinders of smaller
sectional area of each child branch is decreased by a factor of 0.75
cylinder as equal, although in reality the need to make room for other
internal organs means there is a difference in total volume between the right and left lobes of the
in differing sizes between child
child cylinders is the bifurcation angle. Each bifurcation indicates the start of a new air
, beginning with the trachea numbered zero
ration is characterized by similar diameter and airflow
velocities, despite differing locations in physical space.
: Airway generation numbering schematic
respiratory bronchioles and alveoli (where the exchange of O
The basic, simplified structure was introduced by E. R. Weibel
trachea, it consists of a series of bifurcated, roughly
cylindrical elements in which the parent cylinder divides into two child cylinders of smaller
sectional area of each child branch is decreased by a factor of 0.75
cylinder as equal, although in reality the need to make room for other
internal organs means there is a difference in total volume between the right and left lobes of the
in differing sizes between child-
child cylinders is the bifurcation angle. Each bifurcation indicates the start of a new air
, beginning with the trachea numbered zero
ration is characterized by similar diameter and airflow
velocities, despite differing locations in physical space.
: Airway generation numbering schematic
respiratory bronchioles and alveoli (where the exchange of O
The basic, simplified structure was introduced by E. R. Weibel
trachea, it consists of a series of bifurcated, roughly
cylindrical elements in which the parent cylinder divides into two child cylinders of smaller
sectional area of each child branch is decreased by a factor of 0.75
cylinder as equal, although in reality the need to make room for other
internal organs means there is a difference in total volume between the right and left lobes of the
-cylinders).
child cylinders is the bifurcation angle. Each bifurcation indicates the start of a new air
, beginning with the trachea numbered zero
ration is characterized by similar diameter and airflow
velocities, despite differing locations in physical space.
: Airway generation numbering schematic
respiratory bronchioles and alveoli (where the exchange of O
The basic, simplified structure was introduced by E. R. Weibel
trachea, it consists of a series of bifurcated, roughly
cylindrical elements in which the parent cylinder divides into two child cylinders of smaller
sectional area of each child branch is decreased by a factor of 0.75
cylinder as equal, although in reality the need to make room for other
internal organs means there is a difference in total volume between the right and left lobes of the
cylinders).
child cylinders is the bifurcation angle. Each bifurcation indicates the start of a new air
, beginning with the trachea numbered zero
ration is characterized by similar diameter and airflow
: Airway generation numbering schematic
respiratory bronchioles and alveoli (where the exchange of O2
The basic, simplified structure was introduced by E. R. Weibel
trachea, it consists of a series of bifurcated, roughly
cylindrical elements in which the parent cylinder divides into two child cylinders of smaller
sectional area of each child branch is decreased by a factor of 0.75
cylinder as equal, although in reality the need to make room for other
internal organs means there is a difference in total volume between the right and left lobes of the
cylinders).
child cylinders is the bifurcation angle. Each bifurcation indicates the start of a new air
, beginning with the trachea numbered zero
ration is characterized by similar diameter and airflow
: Airway generation numbering schematic
2 and CO
The basic, simplified structure was introduced by E. R. Weibel
trachea, it consists of a series of bifurcated, roughly
cylindrical elements in which the parent cylinder divides into two child cylinders of smaller
sectional area of each child branch is decreased by a factor of 0.75
cylinder as equal, although in reality the need to make room for other
internal organs means there is a difference in total volume between the right and left lobes of the
cylinders).
child cylinders is the bifurcation angle. Each bifurcation indicates the start of a new air
, beginning with the trachea numbered zero
ration is characterized by similar diameter and airflow
: Airway generation numbering schematic
and CO
The basic, simplified structure was introduced by E. R. Weibel
trachea, it consists of a series of bifurcated, roughly
cylindrical elements in which the parent cylinder divides into two child cylinders of smaller
sectional area of each child branch is decreased by a factor of 0.75
cylinder as equal, although in reality the need to make room for other
internal organs means there is a difference in total volume between the right and left lobes of the
The angle between the two
child cylinders is the bifurcation angle. Each bifurcation indicates the start of a new air
, beginning with the trachea numbered zero
ration is characterized by similar diameter and airflow
: Airway generation numbering schematic
and CO2
The basic, simplified structure was introduced by E. R. Weibel30
trachea, it consists of a series of bifurcated, roughly
cylindrical elements in which the parent cylinder divides into two child cylinders of smaller
sectional area of each child branch is decreased by a factor of 0.75
cylinder as equal, although in reality the need to make room for other
internal organs means there is a difference in total volume between the right and left lobes of the
The angle between the two
child cylinders is the bifurcation angle. Each bifurcation indicates the start of a new air
, beginning with the trachea numbered zero
ration is characterized by similar diameter and airflow
: Airway generation numbering schematic
2
30
trachea, it consists of a series of bifurcated, roughly
cylindrical elements in which the parent cylinder divides into two child cylinders of smaller
sectional area of each child branch is decreased by a factor of 0.75
cylinder as equal, although in reality the need to make room for other
internal organs means there is a difference in total volume between the right and left lobes of the
The angle between the two
child cylinders is the bifurcation angle. Each bifurcation indicates the start of a new air
, beginning with the trachea numbered zero
ration is characterized by similar diameter and airflow
: Airway generation numbering schematic
between air and blood
in 1963 and later
trachea, it consists of a series of bifurcated, roughly
cylindrical elements in which the parent cylinder divides into two child cylinders of smaller
sectional area of each child branch is decreased by a factor of 0.75
cylinder as equal, although in reality the need to make room for other
internal organs means there is a difference in total volume between the right and left lobes of the
The angle between the two
child cylinders is the bifurcation angle. Each bifurcation indicates the start of a new air
, beginning with the trachea numbered zero
ration is characterized by similar diameter and airflow
: Airway generation numbering schematic14
between air and blood
in 1963 and later
trachea, it consists of a series of bifurcated, roughly
cylindrical elements in which the parent cylinder divides into two child cylinders of smaller
sectional area of each child branch is decreased by a factor of 0.75
cylinder as equal, although in reality the need to make room for other
internal organs means there is a difference in total volume between the right and left lobes of the
The angle between the two
child cylinders is the bifurcation angle. Each bifurcation indicates the start of a new air
, beginning with the trachea numbered zero
ration is characterized by similar diameter and airflow
14
between air and blood
in 1963 and later
trachea, it consists of a series of bifurcated, roughly
cylindrical elements in which the parent cylinder divides into two child cylinders of smaller
sectional area of each child branch is decreased by a factor of 0.75
cylinder as equal, although in reality the need to make room for other
internal organs means there is a difference in total volume between the right and left lobes of the
The angle between the two
child cylinders is the bifurcation angle. Each bifurcation indicates the start of a new air
, beginning with the trachea numbered zero
ration is characterized by similar diameter and airflow
between air and blood
in 1963 and later
trachea, it consists of a series of bifurcated, roughly
cylindrical elements in which the parent cylinder divides into two child cylinders of smaller
sectional area of each child branch is decreased by a factor of 0.75
cylinder as equal, although in reality the need to make room for other
internal organs means there is a difference in total volume between the right and left lobes of the
The angle between the two
child cylinders is the bifurcation angle. Each bifurcation indicates the start of a new air
, beginning with the trachea numbered zero14
ration is characterized by similar diameter and airflow
between air and blood
in 1963 and later
trachea, it consists of a series of bifurcated, roughly
cylindrical elements in which the parent cylinder divides into two child cylinders of smaller
sectional area of each child branch is decreased by a factor of 0.75
cylinder as equal, although in reality the need to make room for other
internal organs means there is a difference in total volume between the right and left lobes of the
The angle between the two
child cylinders is the bifurcation angle. Each bifurcation indicates the start of a new air
14. This system
ration is characterized by similar diameter and airflow
between air and blood
in 1963 and later
trachea, it consists of a series of bifurcated, roughly
cylindrical elements in which the parent cylinder divides into two child cylinders of smaller
sectional area of each child branch is decreased by a factor of 0.75
cylinder as equal, although in reality the need to make room for other
internal organs means there is a difference in total volume between the right and left lobes of the
The angle between the two
child cylinders is the bifurcation angle. Each bifurcation indicates the start of a new air
. This system
ration is characterized by similar diameter and airflow
between air and blood
in 1963 and later
trachea, it consists of a series of bifurcated, roughly
cylindrical elements in which the parent cylinder divides into two child cylinders of smaller
sectional area of each child branch is decreased by a factor of 0.7529
cylinder as equal, although in reality the need to make room for other
internal organs means there is a difference in total volume between the right and left lobes of the
The angle between the two
child cylinders is the bifurcation angle. Each bifurcation indicates the start of a new air
. This system
ration is characterized by similar diameter and airflow
between air and blood
in 1963 and later
trachea, it consists of a series of bifurcated, roughly
cylindrical elements in which the parent cylinder divides into two child cylinders of smaller
29
cylinder as equal, although in reality the need to make room for other
internal organs means there is a difference in total volume between the right and left lobes of the
The angle between the two
child cylinders is the bifurcation angle. Each bifurcation indicates the start of a new air-
. This system
ration is characterized by similar diameter and airflow
between air and blood
in 1963 and later
trachea, it consists of a series of bifurcated, roughly
cylindrical elements in which the parent cylinder divides into two child cylinders of smaller
29). This
cylinder as equal, although in reality the need to make room for other
internal organs means there is a difference in total volume between the right and left lobes of the
The angle between the two
-way
. This system
ration is characterized by similar diameter and airflow
between air and blood
in 1963 and later
trachea, it consists of a series of bifurcated, roughly
cylindrical elements in which the parent cylinder divides into two child cylinders of smaller
). This
cylinder as equal, although in reality the need to make room for other
internal organs means there is a difference in total volume between the right and left lobes of the
The angle between the two
way
. This system
ration is characterized by similar diameter and airflow
between air and blood
). This
cylinder as equal, although in reality the need to make room for other
internal organs means there is a difference in total volume between the right and left lobes of the
The angle between the two
. This system
ration is characterized by similar diameter and airflow
between air and blood
). This
internal organs means there is a difference in total volume between the right and left lobes of the
The angle between the two
. This system
). This
internal organs means there is a difference in total volume between the right and left lobes of the
. This system
internal organs means there is a difference in total volume between the right and left lobes of the

18
Table 2.3 contains the average diameters and air velocities for different parts of the lungs.
The airflow velocities for each subsequent generation are larger than half the value of the
preceding generation due to the accompanying reduction in airway diameter. The overall result is
a system which maximizes airflow while minimizing airflow resistance. This, in turn, reduces the
amount of energy, or “work”, required for breathing. Computation fluid dynamics (CFD) studies
on tidal breathing within the lungs have confirmed this.16
Table 2.3: Dimensions and air velocities within the lungs15
Bioaerosol formation: Upper airway model
Bioaerosols form from the ALF, however the exact mechanism and origin within the
pulmonary system remains controversial. Two basic mechanisms have been proposed, one taking
place in the upper airways, the other in the lower. The former employs a shear-driven model to
describe the process, in which surface-shearing of the ALF induces wave formation and
propagation, potentially leading to instabilities and shedding of droplets18
(see Figure 2.6). This
process may occur whenever air is flowing across the ALF, although the likelihood of forming
instabilities varies with surface tension, viscoelasticity and the applied shear force (resulting
Diameter Length Typical Air
Part Number (mm) (mm) Velocity (m/s)
Nasal Airways 5-9 9
Mouth 1 20 70 3.2
Pharynx 1 30 30 1.4
Trachea 1 18 120 4.4
Two Main Bronchi 2 13 37 3.7
Lobar Bronchi 5 8 28 4
Segmental Bronchi 18 5 60 2.9
Bronchioles 504 2 20 0.6
Secondary Bronchioles 3024 1 15 0.4
Terminal Bronchioles 12100 0.7 5 0.2

19
from the air velocity at the interface). Hence, coughing and sneezing, in which much higher air
velocities occur, are more likely to produce droplets (and in greater numbers) compared to tidal
breathing.
Figure 2.6: Droplet generation through shearing-induced wave formation
Furthermore, turbulence, characterized by chaotic and rapid variation in air flow patterns,
can increase wave formation and drive the growth of instabilities. Reynolds Number (Re) is a

dimensionless parameter used to describe flow conditions. It is a ratio of the inertial to viscous
forces acting on the fluid (equa
fluid flows with Re greater than 4000, however transitory turbulence is observed for Re as low as
2000.
2100. This is near the lower threshold of the transitory flow regime, indicating both laminar and
turbulent flows are possible. For cough air flow, which involves much higher velocities, Re is
greater than 7000, so fully developed turbulent flow is
readily formed during coughing compared to tidal breathing. In the lower airways, air flow
velocities are significantly smaller than they are in the upper airways, and the Reynolds Number
is of order unity or less,
due to describing cough and sneeze actions (which are expiratory); however, this may not be the
case for tidal air flows. Experimental
Asthma
present for tidal air flow or cough air flow were measured, indicated peak wall shear stresses
dimensionless parameter used to describe flow conditions. It is a ratio of the inertial to viscous
forces acting on the fluid (equa
fluid flows with Re greater than 4000, however transitory turbulence is observed for Re as low as
Where:
For body temperature (37
2100. This is near the lower threshold of the transitory flow regime, indicating both laminar and
turbulent flows are possible. For cough air flow, which involves much higher velocities, Re is
greater than 7000, so fully developed turbulent flow is
readily formed during coughing compared to tidal breathing. In the lower airways, air flow
velocities are significantly smaller than they are in the upper airways, and the Reynolds Number
is of order unity or less,
The shear
due to describing cough and sneeze actions (which are expiratory); however, this may not be the
case for tidal air flows. Experimental
Asthma32
present for tidal air flow or cough air flow were measured, indicated peak wall shear stresses
dimensionless parameter used to describe flow conditions. It is a ratio of the inertial to viscous
forces acting on the fluid (equa
fluid flows with Re greater than 4000, however transitory turbulence is observed for Re as low as
Where:
For body temperature (37
2100. This is near the lower threshold of the transitory flow regime, indicating both laminar and
turbulent flows are possible. For cough air flow, which involves much higher velocities, Re is
greater than 7000, so fully developed turbulent flow is
readily formed during coughing compared to tidal breathing. In the lower airways, air flow
velocities are significantly smaller than they are in the upper airways, and the Reynolds Number
is of order unity or less,
The shear
due to describing cough and sneeze actions (which are expiratory); however, this may not be the
case for tidal air flows. Experimental
32) on physical models of the human trachea and bronchi, in which the wall shear stresses
present for tidal air flow or cough air flow were measured, indicated peak wall shear stresses
dimensionless parameter used to describe flow conditions. It is a ratio of the inertial to viscous
forces acting on the fluid (equa
fluid flows with Re greater than 4000, however transitory turbulence is observed for Re as low as
Where:
For body temperature (37
2100. This is near the lower threshold of the transitory flow regime, indicating both laminar and
turbulent flows are possible. For cough air flow, which involves much higher velocities, Re is
greater than 7000, so fully developed turbulent flow is
readily formed during coughing compared to tidal breathing. In the lower airways, air flow
velocities are significantly smaller than they are in the upper airways, and the Reynolds Number
is of order unity or less,
The shear
due to describing cough and sneeze actions (which are expiratory); however, this may not be the
case for tidal air flows. Experimental
) on physical models of the human trachea and bronchi, in which the wall shear stresses
present for tidal air flow or cough air flow were measured, indicated peak wall shear stresses
dimensionless parameter used to describe flow conditions. It is a ratio of the inertial to viscous
forces acting on the fluid (equa
fluid flows with Re greater than 4000, however transitory turbulence is observed for Re as low as
For body temperature (37
2100. This is near the lower threshold of the transitory flow regime, indicating both laminar and
turbulent flows are possible. For cough air flow, which involves much higher velocities, Re is
greater than 7000, so fully developed turbulent flow is
readily formed during coughing compared to tidal breathing. In the lower airways, air flow
velocities are significantly smaller than they are in the upper airways, and the Reynolds Number
is of order unity or less,
The shear-driven model has traditionally been considered an exhalation process, mostly
due to describing cough and sneeze actions (which are expiratory); however, this may not be the
case for tidal air flows. Experimental
) on physical models of the human trachea and bronchi, in which the wall shear stresses
present for tidal air flow or cough air flow were measured, indicated peak wall shear stresses
dimensionless parameter used to describe flow conditions. It is a ratio of the inertial to viscous
forces acting on the fluid (equa
fluid flows with Re greater than 4000, however transitory turbulence is observed for Re as low as
For body temperature (37
2100. This is near the lower threshold of the transitory flow regime, indicating both laminar and
turbulent flows are possible. For cough air flow, which involves much higher velocities, Re is
greater than 7000, so fully developed turbulent flow is
readily formed during coughing compared to tidal breathing. In the lower airways, air flow
velocities are significantly smaller than they are in the upper airways, and the Reynolds Number
is of order unity or less,
driven model has traditionally been considered an exhalation process, mostly
due to describing cough and sneeze actions (which are expiratory); however, this may not be the
case for tidal air flows. Experimental
) on physical models of the human trachea and bronchi, in which the wall shear stresses
present for tidal air flow or cough air flow were measured, indicated peak wall shear stresses
dimensionless parameter used to describe flow conditions. It is a ratio of the inertial to viscous
forces acting on the fluid (equa
fluid flows with Re greater than 4000, however transitory turbulence is observed for Re as low as
ρ
U = Mean fluid velocity
D = Characteristic length/diameter of geometry
µ
For body temperature (37
2100. This is near the lower threshold of the transitory flow regime, indicating both laminar and
turbulent flows are possible. For cough air flow, which involves much higher velocities, Re is
greater than 7000, so fully developed turbulent flow is
readily formed during coughing compared to tidal breathing. In the lower airways, air flow
velocities are significantly smaller than they are in the upper airways, and the Reynolds Number
is of order unity or less,
driven model has traditionally been considered an exhalation process, mostly
due to describing cough and sneeze actions (which are expiratory); however, this may not be the
case for tidal air flows. Experimental
) on physical models of the human trachea and bronchi, in which the wall shear stresses
present for tidal air flow or cough air flow were measured, indicated peak wall shear stresses
dimensionless parameter used to describe flow conditions. It is a ratio of the inertial to viscous
forces acting on the fluid (equa
fluid flows with Re greater than 4000, however transitory turbulence is observed for Re as low as
ρ = Density of fluid (
U = Mean fluid velocity
D = Characteristic length/diameter of geometry
µ
For body temperature (37
2100. This is near the lower threshold of the transitory flow regime, indicating both laminar and
turbulent flows are possible. For cough air flow, which involves much higher velocities, Re is
greater than 7000, so fully developed turbulent flow is
readily formed during coughing compared to tidal breathing. In the lower airways, air flow
velocities are significantly smaller than they are in the upper airways, and the Reynolds Number
is of order unity or less, so minimal shearing is expected.
driven model has traditionally been considered an exhalation process, mostly
due to describing cough and sneeze actions (which are expiratory); however, this may not be the
case for tidal air flows. Experimental
) on physical models of the human trachea and bronchi, in which the wall shear stresses
present for tidal air flow or cough air flow were measured, indicated peak wall shear stresses
dimensionless parameter used to describe flow conditions. It is a ratio of the inertial to viscous
forces acting on the fluid (equa
fluid flows with Re greater than 4000, however transitory turbulence is observed for Re as low as
= Density of fluid (
U = Mean fluid velocity
D = Characteristic length/diameter of geometry
= Viscosity of fluid (
For body temperature (37
2100. This is near the lower threshold of the transitory flow regime, indicating both laminar and
turbulent flows are possible. For cough air flow, which involves much higher velocities, Re is
greater than 7000, so fully developed turbulent flow is
readily formed during coughing compared to tidal breathing. In the lower airways, air flow
velocities are significantly smaller than they are in the upper airways, and the Reynolds Number
so minimal shearing is expected.
driven model has traditionally been considered an exhalation process, mostly
due to describing cough and sneeze actions (which are expiratory); however, this may not be the
case for tidal air flows. Experimental
) on physical models of the human trachea and bronchi, in which the wall shear stresses
present for tidal air flow or cough air flow were measured, indicated peak wall shear stresses
dimensionless parameter used to describe flow conditions. It is a ratio of the inertial to viscous
forces acting on the fluid (equation I). Fully developed turbulent air flow is typically observed in
fluid flows with Re greater than 4000, however transitory turbulence is observed for Re as low as
= Density of fluid (
U = Mean fluid velocity
D = Characteristic length/diameter of geometry
= Viscosity of fluid (
For body temperature (37
2100. This is near the lower threshold of the transitory flow regime, indicating both laminar and
turbulent flows are possible. For cough air flow, which involves much higher velocities, Re is
greater than 7000, so fully developed turbulent flow is
readily formed during coughing compared to tidal breathing. In the lower airways, air flow
velocities are significantly smaller than they are in the upper airways, and the Reynolds Number
so minimal shearing is expected.
driven model has traditionally been considered an exhalation process, mostly
due to describing cough and sneeze actions (which are expiratory); however, this may not be the
case for tidal air flows. Experimental
) on physical models of the human trachea and bronchi, in which the wall shear stresses
present for tidal air flow or cough air flow were measured, indicated peak wall shear stresses
dimensionless parameter used to describe flow conditions. It is a ratio of the inertial to viscous
tion I). Fully developed turbulent air flow is typically observed in
fluid flows with Re greater than 4000, however transitory turbulence is observed for Re as low as
= Density of fluid (
U = Mean fluid velocity
D = Characteristic length/diameter of geometry
= Viscosity of fluid (
For body temperature (37oC) tidal air flow through the trachea, Re is approx
2100. This is near the lower threshold of the transitory flow regime, indicating both laminar and
turbulent flows are possible. For cough air flow, which involves much higher velocities, Re is
greater than 7000, so fully developed turbulent flow is
readily formed during coughing compared to tidal breathing. In the lower airways, air flow
velocities are significantly smaller than they are in the upper airways, and the Reynolds Number
so minimal shearing is expected.
driven model has traditionally been considered an exhalation process, mostly
due to describing cough and sneeze actions (which are expiratory); however, this may not be the
case for tidal air flows. Experimental
) on physical models of the human trachea and bronchi, in which the wall shear stresses
present for tidal air flow or cough air flow were measured, indicated peak wall shear stresses
dimensionless parameter used to describe flow conditions. It is a ratio of the inertial to viscous
tion I). Fully developed turbulent air flow is typically observed in
fluid flows with Re greater than 4000, however transitory turbulence is observed for Re as low as
= Density of fluid (
U = Mean fluid velocity
D = Characteristic length/diameter of geometry
= Viscosity of fluid (
C) tidal air flow through the trachea, Re is approx
2100. This is near the lower threshold of the transitory flow regime, indicating both laminar and
turbulent flows are possible. For cough air flow, which involves much higher velocities, Re is
greater than 7000, so fully developed turbulent flow is
readily formed during coughing compared to tidal breathing. In the lower airways, air flow
velocities are significantly smaller than they are in the upper airways, and the Reynolds Number
so minimal shearing is expected.
driven model has traditionally been considered an exhalation process, mostly
due to describing cough and sneeze actions (which are expiratory); however, this may not be the
case for tidal air flows. Experimental studies performed by Chowdhary et al. (1999, Journal of
) on physical models of the human trachea and bronchi, in which the wall shear stresses
present for tidal air flow or cough air flow were measured, indicated peak wall shear stresses
dimensionless parameter used to describe flow conditions. It is a ratio of the inertial to viscous
tion I). Fully developed turbulent air flow is typically observed in
fluid flows with Re greater than 4000, however transitory turbulence is observed for Re as low as
= Density of fluid (
U = Mean fluid velocity
D = Characteristic length/diameter of geometry
= Viscosity of fluid (
C) tidal air flow through the trachea, Re is approx
2100. This is near the lower threshold of the transitory flow regime, indicating both laminar and
turbulent flows are possible. For cough air flow, which involves much higher velocities, Re is
greater than 7000, so fully developed turbulent flow is
readily formed during coughing compared to tidal breathing. In the lower airways, air flow
velocities are significantly smaller than they are in the upper airways, and the Reynolds Number
so minimal shearing is expected.
driven model has traditionally been considered an exhalation process, mostly
due to describing cough and sneeze actions (which are expiratory); however, this may not be the
studies performed by Chowdhary et al. (1999, Journal of
) on physical models of the human trachea and bronchi, in which the wall shear stresses
present for tidal air flow or cough air flow were measured, indicated peak wall shear stresses
dimensionless parameter used to describe flow conditions. It is a ratio of the inertial to viscous
tion I). Fully developed turbulent air flow is typically observed in
fluid flows with Re greater than 4000, however transitory turbulence is observed for Re as low as
= Density of fluid (ρ
U = Mean fluid velocity
D = Characteristic length/diameter of geometry
= Viscosity of fluid (
C) tidal air flow through the trachea, Re is approx
2100. This is near the lower threshold of the transitory flow regime, indicating both laminar and
turbulent flows are possible. For cough air flow, which involves much higher velocities, Re is
greater than 7000, so fully developed turbulent flow is
readily formed during coughing compared to tidal breathing. In the lower airways, air flow
velocities are significantly smaller than they are in the upper airways, and the Reynolds Number
so minimal shearing is expected.
driven model has traditionally been considered an exhalation process, mostly
due to describing cough and sneeze actions (which are expiratory); however, this may not be the
studies performed by Chowdhary et al. (1999, Journal of
) on physical models of the human trachea and bronchi, in which the wall shear stresses
present for tidal air flow or cough air flow were measured, indicated peak wall shear stresses
dimensionless parameter used to describe flow conditions. It is a ratio of the inertial to viscous
tion I). Fully developed turbulent air flow is typically observed in
fluid flows with Re greater than 4000, however transitory turbulence is observed for Re as low as
ρAir
U = Mean fluid velocity
D = Characteristic length/diameter of geometry
= Viscosity of fluid (µ
C) tidal air flow through the trachea, Re is approx
2100. This is near the lower threshold of the transitory flow regime, indicating both laminar and
turbulent flows are possible. For cough air flow, which involves much higher velocities, Re is
greater than 7000, so fully developed turbulent flow is
readily formed during coughing compared to tidal breathing. In the lower airways, air flow
velocities are significantly smaller than they are in the upper airways, and the Reynolds Number
so minimal shearing is expected.
driven model has traditionally been considered an exhalation process, mostly
due to describing cough and sneeze actions (which are expiratory); however, this may not be the
studies performed by Chowdhary et al. (1999, Journal of
) on physical models of the human trachea and bronchi, in which the wall shear stresses
present for tidal air flow or cough air flow were measured, indicated peak wall shear stresses
dimensionless parameter used to describe flow conditions. It is a ratio of the inertial to viscous
tion I). Fully developed turbulent air flow is typically observed in
fluid flows with Re greater than 4000, however transitory turbulence is observed for Re as low as
Air
U = Mean fluid velocity
D = Characteristic length/diameter of geometry
µ
C) tidal air flow through the trachea, Re is approx
2100. This is near the lower threshold of the transitory flow regime, indicating both laminar and
turbulent flows are possible. For cough air flow, which involves much higher velocities, Re is
greater than 7000, so fully developed turbulent flow is
readily formed during coughing compared to tidal breathing. In the lower airways, air flow
velocities are significantly smaller than they are in the upper airways, and the Reynolds Number
so minimal shearing is expected.
driven model has traditionally been considered an exhalation process, mostly
due to describing cough and sneeze actions (which are expiratory); however, this may not be the
studies performed by Chowdhary et al. (1999, Journal of
) on physical models of the human trachea and bronchi, in which the wall shear stresses
present for tidal air flow or cough air flow were measured, indicated peak wall shear stresses 20
dimensionless parameter used to describe flow conditions. It is a ratio of the inertial to viscous
tion I). Fully developed turbulent air flow is typically observed in
fluid flows with Re greater than 4000, however transitory turbulence is observed for Re as low as
Air( 37
D = Characteristic length/diameter of geometry
µAir
C) tidal air flow through the trachea, Re is approx
2100. This is near the lower threshold of the transitory flow regime, indicating both laminar and
turbulent flows are possible. For cough air flow, which involves much higher velocities, Re is
greater than 7000, so fully developed turbulent flow is
readily formed during coughing compared to tidal breathing. In the lower airways, air flow
velocities are significantly smaller than they are in the upper airways, and the Reynolds Number
so minimal shearing is expected.
driven model has traditionally been considered an exhalation process, mostly
due to describing cough and sneeze actions (which are expiratory); however, this may not be the
studies performed by Chowdhary et al. (1999, Journal of
) on physical models of the human trachea and bronchi, in which the wall shear stresses
present for tidal air flow or cough air flow were measured, indicated peak wall shear stresses 20
dimensionless parameter used to describe flow conditions. It is a ratio of the inertial to viscous
tion I). Fully developed turbulent air flow is typically observed in
fluid flows with Re greater than 4000, however transitory turbulence is observed for Re as low as
( 37
D = Characteristic length/diameter of geometry
Air
C) tidal air flow through the trachea, Re is approx
2100. This is near the lower threshold of the transitory flow regime, indicating both laminar and
turbulent flows are possible. For cough air flow, which involves much higher velocities, Re is
greater than 7000, so fully developed turbulent flow is
readily formed during coughing compared to tidal breathing. In the lower airways, air flow
velocities are significantly smaller than they are in the upper airways, and the Reynolds Number
so minimal shearing is expected.
driven model has traditionally been considered an exhalation process, mostly
due to describing cough and sneeze actions (which are expiratory); however, this may not be the
studies performed by Chowdhary et al. (1999, Journal of
) on physical models of the human trachea and bronchi, in which the wall shear stresses
present for tidal air flow or cough air flow were measured, indicated peak wall shear stresses 20
dimensionless parameter used to describe flow conditions. It is a ratio of the inertial to viscous
tion I). Fully developed turbulent air flow is typically observed in
fluid flows with Re greater than 4000, however transitory turbulence is observed for Re as low as
( 37
D = Characteristic length/diameter of geometry
Air(37
C) tidal air flow through the trachea, Re is approx
2100. This is near the lower threshold of the transitory flow regime, indicating both laminar and
turbulent flows are possible. For cough air flow, which involves much higher velocities, Re is
greater than 7000, so fully developed turbulent flow is
readily formed during coughing compared to tidal breathing. In the lower airways, air flow
velocities are significantly smaller than they are in the upper airways, and the Reynolds Number
so minimal shearing is expected.
driven model has traditionally been considered an exhalation process, mostly
due to describing cough and sneeze actions (which are expiratory); however, this may not be the
studies performed by Chowdhary et al. (1999, Journal of
) on physical models of the human trachea and bronchi, in which the wall shear stresses
present for tidal air flow or cough air flow were measured, indicated peak wall shear stresses
dimensionless parameter used to describe flow conditions. It is a ratio of the inertial to viscous
tion I). Fully developed turbulent air flow is typically observed in
fluid flows with Re greater than 4000, however transitory turbulence is observed for Re as low as
( 37
D = Characteristic length/diameter of geometry
(37
C) tidal air flow through the trachea, Re is approx
2100. This is near the lower threshold of the transitory flow regime, indicating both laminar and
turbulent flows are possible. For cough air flow, which involves much higher velocities, Re is
greater than 7000, so fully developed turbulent flow is
readily formed during coughing compared to tidal breathing. In the lower airways, air flow
velocities are significantly smaller than they are in the upper airways, and the Reynolds Number
so minimal shearing is expected.
driven model has traditionally been considered an exhalation process, mostly
due to describing cough and sneeze actions (which are expiratory); however, this may not be the
studies performed by Chowdhary et al. (1999, Journal of
) on physical models of the human trachea and bronchi, in which the wall shear stresses
present for tidal air flow or cough air flow were measured, indicated peak wall shear stresses
dimensionless parameter used to describe flow conditions. It is a ratio of the inertial to viscous
tion I). Fully developed turbulent air flow is typically observed in
fluid flows with Re greater than 4000, however transitory turbulence is observed for Re as low as
( 37oC) = 1.14 kg/m
D = Characteristic length/diameter of geometry
(37
C) tidal air flow through the trachea, Re is approx
2100. This is near the lower threshold of the transitory flow regime, indicating both laminar and
turbulent flows are possible. For cough air flow, which involves much higher velocities, Re is
greater than 7000, so fully developed turbulent flow is
readily formed during coughing compared to tidal breathing. In the lower airways, air flow
velocities are significantly smaller than they are in the upper airways, and the Reynolds Number
so minimal shearing is expected.
driven model has traditionally been considered an exhalation process, mostly
due to describing cough and sneeze actions (which are expiratory); however, this may not be the
studies performed by Chowdhary et al. (1999, Journal of
) on physical models of the human trachea and bronchi, in which the wall shear stresses
present for tidal air flow or cough air flow were measured, indicated peak wall shear stresses
dimensionless parameter used to describe flow conditions. It is a ratio of the inertial to viscous
tion I). Fully developed turbulent air flow is typically observed in
fluid flows with Re greater than 4000, however transitory turbulence is observed for Re as low as
C) = 1.14 kg/m
D = Characteristic length/diameter of geometry
(37o
C) tidal air flow through the trachea, Re is approx
2100. This is near the lower threshold of the transitory flow regime, indicating both laminar and
turbulent flows are possible. For cough air flow, which involves much higher velocities, Re is
greater than 7000, so fully developed turbulent flow is
readily formed during coughing compared to tidal breathing. In the lower airways, air flow
velocities are significantly smaller than they are in the upper airways, and the Reynolds Number
so minimal shearing is expected.
driven model has traditionally been considered an exhalation process, mostly
due to describing cough and sneeze actions (which are expiratory); however, this may not be the
studies performed by Chowdhary et al. (1999, Journal of
) on physical models of the human trachea and bronchi, in which the wall shear stresses
present for tidal air flow or cough air flow were measured, indicated peak wall shear stresses
dimensionless parameter used to describe flow conditions. It is a ratio of the inertial to viscous
tion I). Fully developed turbulent air flow is typically observed in
fluid flows with Re greater than 4000, however transitory turbulence is observed for Re as low as
C) = 1.14 kg/m
D = Characteristic length/diameter of geometry
oC) = 1.9E
C) tidal air flow through the trachea, Re is approx
2100. This is near the lower threshold of the transitory flow regime, indicating both laminar and
turbulent flows are possible. For cough air flow, which involves much higher velocities, Re is
greater than 7000, so fully developed turbulent flow is
readily formed during coughing compared to tidal breathing. In the lower airways, air flow
velocities are significantly smaller than they are in the upper airways, and the Reynolds Number
so minimal shearing is expected.
driven model has traditionally been considered an exhalation process, mostly
due to describing cough and sneeze actions (which are expiratory); however, this may not be the
studies performed by Chowdhary et al. (1999, Journal of
) on physical models of the human trachea and bronchi, in which the wall shear stresses
present for tidal air flow or cough air flow were measured, indicated peak wall shear stresses
dimensionless parameter used to describe flow conditions. It is a ratio of the inertial to viscous
tion I). Fully developed turbulent air flow is typically observed in
fluid flows with Re greater than 4000, however transitory turbulence is observed for Re as low as
C) = 1.14 kg/m
D = Characteristic length/diameter of geometry
C) = 1.9E
C) tidal air flow through the trachea, Re is approx
2100. This is near the lower threshold of the transitory flow regime, indicating both laminar and
turbulent flows are possible. For cough air flow, which involves much higher velocities, Re is
expected. As a result, droplets are more
readily formed during coughing compared to tidal breathing. In the lower airways, air flow
velocities are significantly smaller than they are in the upper airways, and the Reynolds Number
driven model has traditionally been considered an exhalation process, mostly
due to describing cough and sneeze actions (which are expiratory); however, this may not be the
studies performed by Chowdhary et al. (1999, Journal of
) on physical models of the human trachea and bronchi, in which the wall shear stresses
present for tidal air flow or cough air flow were measured, indicated peak wall shear stresses
dimensionless parameter used to describe flow conditions. It is a ratio of the inertial to viscous
tion I). Fully developed turbulent air flow is typically observed in
fluid flows with Re greater than 4000, however transitory turbulence is observed for Re as low as
C) = 1.14 kg/m
D = Characteristic length/diameter of geometry
C) = 1.9E-5 kg/m*sec)
C) tidal air flow through the trachea, Re is approx
2100. This is near the lower threshold of the transitory flow regime, indicating both laminar and
turbulent flows are possible. For cough air flow, which involves much higher velocities, Re is
expected. As a result, droplets are more
readily formed during coughing compared to tidal breathing. In the lower airways, air flow
velocities are significantly smaller than they are in the upper airways, and the Reynolds Number
driven model has traditionally been considered an exhalation process, mostly
due to describing cough and sneeze actions (which are expiratory); however, this may not be the
studies performed by Chowdhary et al. (1999, Journal of
) on physical models of the human trachea and bronchi, in which the wall shear stresses
present for tidal air flow or cough air flow were measured, indicated peak wall shear stresses
dimensionless parameter used to describe flow conditions. It is a ratio of the inertial to viscous
tion I). Fully developed turbulent air flow is typically observed in
fluid flows with Re greater than 4000, however transitory turbulence is observed for Re as low as
C) = 1.14 kg/m
D = Characteristic length/diameter of geometry
5 kg/m*sec)
C) tidal air flow through the trachea, Re is approx
2100. This is near the lower threshold of the transitory flow regime, indicating both laminar and
turbulent flows are possible. For cough air flow, which involves much higher velocities, Re is
expected. As a result, droplets are more
readily formed during coughing compared to tidal breathing. In the lower airways, air flow
velocities are significantly smaller than they are in the upper airways, and the Reynolds Number
driven model has traditionally been considered an exhalation process, mostly
due to describing cough and sneeze actions (which are expiratory); however, this may not be the
studies performed by Chowdhary et al. (1999, Journal of
) on physical models of the human trachea and bronchi, in which the wall shear stresses
present for tidal air flow or cough air flow were measured, indicated peak wall shear stresses
dimensionless parameter used to describe flow conditions. It is a ratio of the inertial to viscous
tion I). Fully developed turbulent air flow is typically observed in
fluid flows with Re greater than 4000, however transitory turbulence is observed for Re as low as
C) = 1.14 kg/m3)
D = Characteristic length/diameter of geometry
5 kg/m*sec)
C) tidal air flow through the trachea, Re is approx
2100. This is near the lower threshold of the transitory flow regime, indicating both laminar and
turbulent flows are possible. For cough air flow, which involves much higher velocities, Re is
expected. As a result, droplets are more
readily formed during coughing compared to tidal breathing. In the lower airways, air flow
velocities are significantly smaller than they are in the upper airways, and the Reynolds Number
driven model has traditionally been considered an exhalation process, mostly
due to describing cough and sneeze actions (which are expiratory); however, this may not be the
studies performed by Chowdhary et al. (1999, Journal of
) on physical models of the human trachea and bronchi, in which the wall shear stresses
present for tidal air flow or cough air flow were measured, indicated peak wall shear stresses
dimensionless parameter used to describe flow conditions. It is a ratio of the inertial to viscous
tion I). Fully developed turbulent air flow is typically observed in
fluid flows with Re greater than 4000, however transitory turbulence is observed for Re as low as
)
D = Characteristic length/diameter of geometry
5 kg/m*sec)
C) tidal air flow through the trachea, Re is approx
2100. This is near the lower threshold of the transitory flow regime, indicating both laminar and
turbulent flows are possible. For cough air flow, which involves much higher velocities, Re is
expected. As a result, droplets are more
readily formed during coughing compared to tidal breathing. In the lower airways, air flow
velocities are significantly smaller than they are in the upper airways, and the Reynolds Number
driven model has traditionally been considered an exhalation process, mostly
due to describing cough and sneeze actions (which are expiratory); however, this may not be the
studies performed by Chowdhary et al. (1999, Journal of
) on physical models of the human trachea and bronchi, in which the wall shear stresses
present for tidal air flow or cough air flow were measured, indicated peak wall shear stresses
dimensionless parameter used to describe flow conditions. It is a ratio of the inertial to viscous
tion I). Fully developed turbulent air flow is typically observed in
fluid flows with Re greater than 4000, however transitory turbulence is observed for Re as low as
5 kg/m*sec)
C) tidal air flow through the trachea, Re is approx
2100. This is near the lower threshold of the transitory flow regime, indicating both laminar and
turbulent flows are possible. For cough air flow, which involves much higher velocities, Re is
expected. As a result, droplets are more
readily formed during coughing compared to tidal breathing. In the lower airways, air flow
velocities are significantly smaller than they are in the upper airways, and the Reynolds Number
driven model has traditionally been considered an exhalation process, mostly
due to describing cough and sneeze actions (which are expiratory); however, this may not be the
studies performed by Chowdhary et al. (1999, Journal of
) on physical models of the human trachea and bronchi, in which the wall shear stresses
present for tidal air flow or cough air flow were measured, indicated peak wall shear stresses
(
dimensionless parameter used to describe flow conditions. It is a ratio of the inertial to viscous
tion I). Fully developed turbulent air flow is typically observed in
fluid flows with Re greater than 4000, however transitory turbulence is observed for Re as low as
5 kg/m*sec)
C) tidal air flow through the trachea, Re is approx
2100. This is near the lower threshold of the transitory flow regime, indicating both laminar and
turbulent flows are possible. For cough air flow, which involves much higher velocities, Re is
expected. As a result, droplets are more
readily formed during coughing compared to tidal breathing. In the lower airways, air flow
velocities are significantly smaller than they are in the upper airways, and the Reynolds Number
driven model has traditionally been considered an exhalation process, mostly
due to describing cough and sneeze actions (which are expiratory); however, this may not be the
studies performed by Chowdhary et al. (1999, Journal of
) on physical models of the human trachea and bronchi, in which the wall shear stresses
present for tidal air flow or cough air flow were measured, indicated peak wall shear stresses
(I
dimensionless parameter used to describe flow conditions. It is a ratio of the inertial to viscous
tion I). Fully developed turbulent air flow is typically observed in
fluid flows with Re greater than 4000, however transitory turbulence is observed for Re as low as
5 kg/m*sec)
C) tidal air flow through the trachea, Re is approx
2100. This is near the lower threshold of the transitory flow regime, indicating both laminar and
turbulent flows are possible. For cough air flow, which involves much higher velocities, Re is
expected. As a result, droplets are more
readily formed during coughing compared to tidal breathing. In the lower airways, air flow
velocities are significantly smaller than they are in the upper airways, and the Reynolds Number
driven model has traditionally been considered an exhalation process, mostly
due to describing cough and sneeze actions (which are expiratory); however, this may not be the
studies performed by Chowdhary et al. (1999, Journal of
) on physical models of the human trachea and bronchi, in which the wall shear stresses
present for tidal air flow or cough air flow were measured, indicated peak wall shear stresses
I)
dimensionless parameter used to describe flow conditions. It is a ratio of the inertial to viscous
tion I). Fully developed turbulent air flow is typically observed in
fluid flows with Re greater than 4000, however transitory turbulence is observed for Re as low as
5 kg/m*sec)
C) tidal air flow through the trachea, Re is approx
2100. This is near the lower threshold of the transitory flow regime, indicating both laminar and
turbulent flows are possible. For cough air flow, which involves much higher velocities, Re is
expected. As a result, droplets are more
readily formed during coughing compared to tidal breathing. In the lower airways, air flow
velocities are significantly smaller than they are in the upper airways, and the Reynolds Number
driven model has traditionally been considered an exhalation process, mostly
due to describing cough and sneeze actions (which are expiratory); however, this may not be the
studies performed by Chowdhary et al. (1999, Journal of
) on physical models of the human trachea and bronchi, in which the wall shear stresses
present for tidal air flow or cough air flow were measured, indicated peak wall shear stresses
)
dimensionless parameter used to describe flow conditions. It is a ratio of the inertial to viscous
tion I). Fully developed turbulent air flow is typically observed in
fluid flows with Re greater than 4000, however transitory turbulence is observed for Re as low as
5 kg/m*sec)
C) tidal air flow through the trachea, Re is approx
2100. This is near the lower threshold of the transitory flow regime, indicating both laminar and
turbulent flows are possible. For cough air flow, which involves much higher velocities, Re is
expected. As a result, droplets are more
readily formed during coughing compared to tidal breathing. In the lower airways, air flow
velocities are significantly smaller than they are in the upper airways, and the Reynolds Number
driven model has traditionally been considered an exhalation process, mostly
due to describing cough and sneeze actions (which are expiratory); however, this may not be the
studies performed by Chowdhary et al. (1999, Journal of
) on physical models of the human trachea and bronchi, in which the wall shear stresses
present for tidal air flow or cough air flow were measured, indicated peak wall shear stresses
dimensionless parameter used to describe flow conditions. It is a ratio of the inertial to viscous
tion I). Fully developed turbulent air flow is typically observed in
fluid flows with Re greater than 4000, however transitory turbulence is observed for Re as low as
C) tidal air flow through the trachea, Re is approximately
2100. This is near the lower threshold of the transitory flow regime, indicating both laminar and
turbulent flows are possible. For cough air flow, which involves much higher velocities, Re is
expected. As a result, droplets are more
readily formed during coughing compared to tidal breathing. In the lower airways, air flow
velocities are significantly smaller than they are in the upper airways, and the Reynolds Number
driven model has traditionally been considered an exhalation process, mostly
due to describing cough and sneeze actions (which are expiratory); however, this may not be the
studies performed by Chowdhary et al. (1999, Journal of
) on physical models of the human trachea and bronchi, in which the wall shear stresses
present for tidal air flow or cough air flow were measured, indicated peak wall shear stresses
dimensionless parameter used to describe flow conditions. It is a ratio of the inertial to viscous
tion I). Fully developed turbulent air flow is typically observed in
fluid flows with Re greater than 4000, however transitory turbulence is observed for Re as low as
imately
2100. This is near the lower threshold of the transitory flow regime, indicating both laminar and
turbulent flows are possible. For cough air flow, which involves much higher velocities, Re is
expected. As a result, droplets are more
velocities are significantly smaller than they are in the upper airways, and the Reynolds Number
driven model has traditionally been considered an exhalation process, mostly
due to describing cough and sneeze actions (which are expiratory); however, this may not be the
studies performed by Chowdhary et al. (1999, Journal of
) on physical models of the human trachea and bronchi, in which the wall shear stresses
present for tidal air flow or cough air flow were measured, indicated peak wall shear stresses
dimensionless parameter used to describe flow conditions. It is a ratio of the inertial to viscous
tion I). Fully developed turbulent air flow is typically observed in
fluid flows with Re greater than 4000, however transitory turbulence is observed for Re as low as
2100. This is near the lower threshold of the transitory flow regime, indicating both laminar and
turbulent flows are possible. For cough air flow, which involves much higher velocities, Re is
expected. As a result, droplets are more
velocities are significantly smaller than they are in the upper airways, and the Reynolds Number
driven model has traditionally been considered an exhalation process, mostly
due to describing cough and sneeze actions (which are expiratory); however, this may not be the
studies performed by Chowdhary et al. (1999, Journal of
) on physical models of the human trachea and bronchi, in which the wall shear stresses
dimensionless parameter used to describe flow conditions. It is a ratio of the inertial to viscous
tion I). Fully developed turbulent air flow is typically observed in
fluid flows with Re greater than 4000, however transitory turbulence is observed for Re as low as
2100. This is near the lower threshold of the transitory flow regime, indicating both laminar and
expected. As a result, droplets are more
velocities are significantly smaller than they are in the upper airways, and the Reynolds Number
driven model has traditionally been considered an exhalation process, mostly
due to describing cough and sneeze actions (which are expiratory); however, this may not be the
) on physical models of the human trachea and bronchi, in which the wall shear stresses
tion I). Fully developed turbulent air flow is typically observed in
fluid flows with Re greater than 4000, however transitory turbulence is observed for Re as low as
2100. This is near the lower threshold of the transitory flow regime, indicating both laminar and
velocities are significantly smaller than they are in the upper airways, and the Reynolds Number
due to describing cough and sneeze actions (which are expiratory); however, this may not be the
) on physical models of the human trachea and bronchi, in which the wall shear stresses
tion I). Fully developed turbulent air flow is typically observed in
fluid flows with Re greater than 4000, however transitory turbulence is observed for Re as low as
) on physical models of the human trachea and bronchi, in which the wall shear stresses

21
were found along the inner wall just past the first and second bifurcation for tidal air flow.
Coughing, on the other hand, is an expiratory process, with peak air flow rates as high as 12
L/sec, and during this process, interfacial shearing peaked within the trachea, as it is coupled to
fully developed turbulent air flow. CFD models of the airways during tidal air flow (performed
by A. Green in 200317
and Y. Wang et al. in 200933
) yielded similar results, and indicate that
maximal surface shearing may occur during inhalation. These studies suggest that bioaerosol
formation for tidal air flow may occur proximal to the first bifurcations and be an inhalation-
stage process. If this is the case, then the bifurcation angle is expected to influence droplet
formation. Furthermore, as an inhalation-stage process, there are ramifications in terms of auto-
infection (the process of transmitting an infection deeper into the host’s pulmonary system). This
will be an important topic in the upcoming discussion of the lower airway model.
The experiments on air-shearing of mayonnaise in a rectangular channel performed by
Basser et al. in 198934
serve as a guide to the relevance of physical properties on the formation of
wave-instabilities. When mayonnaise – which is a stiff, non-Newtonian fluid – was placed on
polyethylene, an oily sub-layer formed between the two. The critical air speed required to induce
instabilities was reduced by half when the sub-layer was present, indicating the significance of
having both viscous and elastic elements present. This importance was confirmed in the
computational work performed by Moriarty and Grotberg,18
in which an elastic solid upper layer
was modeled with a Newtonian sub-layer beneath. Hence, the viscoelastic properties of the ALF
are expected to be extremely relevant to bioaerosol formation.
Basser et al. excluded surface tension in their analysis, concluding that their system was
analogous to wind-water waves in which gravity would dominate any surface tension effects.

22
This analogy does not translate well, as it assumes a deep fluid (in which the ratio of relevant
wavelengths to depth is very small), whereas in the case of the ALF, the wavelengths must at
least equal the size (diameter) of the droplets produced (less than 10 microns for bioaerosols),
compared to a depth between 10-70 microns. This suggests the potential for surface tension
effects to be relevant, and indeed, Moriarty and Grotberg found that adding a surface tension
term to their model did significantly alter the results (compared to excluding it). However, once
accounted for, reasonable changes in the value of the surface tension (from a physiological
viewpoint) did not continue to significantly alter the outcome, particularly compared to changes
resulting from the addition of a viscous sub-layer. Hence, changes in the surface tension in the
upper airways are not expected to play a major role in bioaerosol formation.
Bioaerosol formation: Lower airway model
The second mechanism for bioaerosol generation, proposed by Johnson and Morawska,
occurs in the lower airways, and involves droplets shedding from ruptured films (which form
through the re-opening of collapsed bronchioles during tidal breathing19
). The basic process
occurs in four stages and is shown in Figure 2.7. In stage one the bronchiole has collapsed at the
end of the previous expiratory phase. In stage two, inhalation has started and the bronchiole
begins to open. ALF forms a bridge stretched across the bronchiole. In stage three, the
bronchiole has completely opened, producing a bubble/film of ALF across the interior which
subsequently breaks, generating droplets that are immediately entrained in the air stream. In
stage four, the expiratory phase begins, the droplets are expelled, and the bronchiole begins to
collapse again. The process is surface-tension dominated20
– determining the capillary number
(Ca, equation II), which is a dimensionless ratio of viscous forces to surface tension forces,
yields a value of 0.2 (the zero-shear viscosity of mucus was used as an estimation of fluid

viscosity). Surfactant proteins in the ALF reduce surface tension (which is necessary to prevent
alveolar collapse)
bronchioles open. The number of droplets produced is a
bronchioles and the frequency of their collapse. Some estimates of bronchiole collapse indicate
that on average less than 10% of total bronchioles are prone to collapse
amounts are currently unknown.
Where:
Figure 2.7
viscosity). Surfactant proteins in the ALF reduce surface tension (which is necessary to prevent
alveolar collapse)
bronchioles open. The number of droplets produced is a
bronchioles and the frequency of their collapse. Some estimates of bronchiole collapse indicate
that on average less than 10% of total bronchioles are prone to collapse
amounts are currently unknown.
Figure 2.7
viscosity). Surfactant proteins in the ALF reduce surface tension (which is necessary to prevent
alveolar collapse) –
bronchioles open. The number of droplets produced is a
bronchioles and the frequency of their collapse. Some estimates of bronchiole collapse indicate
that on average less than 10% of total bronchioles are prone to collapse
amounts are currently unknown.
Figure 2.7
viscosity). Surfactant proteins in the ALF reduce surface tension (which is necessary to prevent
– the reduced surface tension enables easy formation of thin films as the
bronchioles open. The number of droplets produced is a
bronchioles and the frequency of their collapse. Some estimates of bronchiole collapse indicate
that on average less than 10% of total bronchioles are prone to collapse
amounts are currently unknown.
Figure 2.7
viscosity). Surfactant proteins in the ALF reduce surface tension (which is necessary to prevent
the reduced surface tension enables easy formation of thin films as the
bronchioles open. The number of droplets produced is a
bronchioles and the frequency of their collapse. Some estimates of bronchiole collapse indicate
that on average less than 10% of total bronchioles are prone to collapse
amounts are currently unknown.
µ
U = Velocity
γ
Figure 2.7
viscosity). Surfactant proteins in the ALF reduce surface tension (which is necessary to prevent
the reduced surface tension enables easy formation of thin films as the
bronchioles open. The number of droplets produced is a
bronchioles and the frequency of their collapse. Some estimates of bronchiole collapse indicate
that on average less than 10% of total bronchioles are prone to collapse
amounts are currently unknown.
µ
U = Velocity
γ = Surface tension
Figure 2.7: Stage
viscosity). Surfactant proteins in the ALF reduce surface tension (which is necessary to prevent
the reduced surface tension enables easy formation of thin films as the
bronchioles open. The number of droplets produced is a
bronchioles and the frequency of their collapse. Some estimates of bronchiole collapse indicate
that on average less than 10% of total bronchioles are prone to collapse
amounts are currently unknown.
= Fluid viscosity (Estimated from zero
U = Velocity
= Surface tension
: Stage
viscosity). Surfactant proteins in the ALF reduce surface tension (which is necessary to prevent
the reduced surface tension enables easy formation of thin films as the
bronchioles open. The number of droplets produced is a
bronchioles and the frequency of their collapse. Some estimates of bronchiole collapse indicate
that on average less than 10% of total bronchioles are prone to collapse
amounts are currently unknown.
= Fluid viscosity (Estimated from zero
U = Velocity
= Surface tension
: Stage-wise progression of droplet generation in lower airway (bronchioles)
viscosity). Surfactant proteins in the ALF reduce surface tension (which is necessary to prevent
the reduced surface tension enables easy formation of thin films as the
bronchioles open. The number of droplets produced is a
bronchioles and the frequency of their collapse. Some estimates of bronchiole collapse indicate
that on average less than 10% of total bronchioles are prone to collapse
amounts are currently unknown.
= Fluid viscosity (Estimated from zero
U = Velocity
= Surface tension
wise progression of droplet generation in lower airway (bronchioles)
viscosity). Surfactant proteins in the ALF reduce surface tension (which is necessary to prevent
the reduced surface tension enables easy formation of thin films as the
bronchioles open. The number of droplets produced is a
bronchioles and the frequency of their collapse. Some estimates of bronchiole collapse indicate
that on average less than 10% of total bronchioles are prone to collapse
= Fluid viscosity (Estimated from zero
wise progression of droplet generation in lower airway (bronchioles)
23
viscosity). Surfactant proteins in the ALF reduce surface tension (which is necessary to prevent
the reduced surface tension enables easy formation of thin films as the
bronchioles open. The number of droplets produced is a
bronchioles and the frequency of their collapse. Some estimates of bronchiole collapse indicate
that on average less than 10% of total bronchioles are prone to collapse
= Fluid viscosity (Estimated from zero
wise progression of droplet generation in lower airway (bronchioles)
viscosity). Surfactant proteins in the ALF reduce surface tension (which is necessary to prevent
the reduced surface tension enables easy formation of thin films as the
bronchioles open. The number of droplets produced is a function of the number of collapsed
bronchioles and the frequency of their collapse. Some estimates of bronchiole collapse indicate
that on average less than 10% of total bronchioles are prone to collapse
= Fluid viscosity (Estimated from zero
wise progression of droplet generation in lower airway (bronchioles)
viscosity). Surfactant proteins in the ALF reduce surface tension (which is necessary to prevent
the reduced surface tension enables easy formation of thin films as the
function of the number of collapsed
bronchioles and the frequency of their collapse. Some estimates of bronchiole collapse indicate
that on average less than 10% of total bronchioles are prone to collapse
= Fluid viscosity (Estimated from zero-
wise progression of droplet generation in lower airway (bronchioles)
viscosity). Surfactant proteins in the ALF reduce surface tension (which is necessary to prevent
the reduced surface tension enables easy formation of thin films as the
function of the number of collapsed
bronchioles and the frequency of their collapse. Some estimates of bronchiole collapse indicate
that on average less than 10% of total bronchioles are prone to collapse
-shear viscosity)
wise progression of droplet generation in lower airway (bronchioles)
viscosity). Surfactant proteins in the ALF reduce surface tension (which is necessary to prevent
the reduced surface tension enables easy formation of thin films as the
function of the number of collapsed
bronchioles and the frequency of their collapse. Some estimates of bronchiole collapse indicate
that on average less than 10% of total bronchioles are prone to collapse
shear viscosity)
wise progression of droplet generation in lower airway (bronchioles)
viscosity). Surfactant proteins in the ALF reduce surface tension (which is necessary to prevent
the reduced surface tension enables easy formation of thin films as the
function of the number of collapsed
bronchioles and the frequency of their collapse. Some estimates of bronchiole collapse indicate
that on average less than 10% of total bronchioles are prone to collapse21
shear viscosity)
wise progression of droplet generation in lower airway (bronchioles)
(
viscosity). Surfactant proteins in the ALF reduce surface tension (which is necessary to prevent
the reduced surface tension enables easy formation of thin films as the
function of the number of collapsed
bronchioles and the frequency of their collapse. Some estimates of bronchiole collapse indicate
21
shear viscosity)
wise progression of droplet generation in lower airway (bronchioles)
(II
viscosity). Surfactant proteins in the ALF reduce surface tension (which is necessary to prevent
the reduced surface tension enables easy formation of thin films as the
function of the number of collapsed
bronchioles and the frequency of their collapse. Some estimates of bronchiole collapse indicate
21, however exact
shear viscosity)
wise progression of droplet generation in lower airway (bronchioles)
II)
viscosity). Surfactant proteins in the ALF reduce surface tension (which is necessary to prevent
the reduced surface tension enables easy formation of thin films as the
function of the number of collapsed
bronchioles and the frequency of their collapse. Some estimates of bronchiole collapse indicate
, however exact
shear viscosity)
wise progression of droplet generation in lower airway (bronchioles)
)
viscosity). Surfactant proteins in the ALF reduce surface tension (which is necessary to prevent
the reduced surface tension enables easy formation of thin films as the
function of the number of collapsed
bronchioles and the frequency of their collapse. Some estimates of bronchiole collapse indicate
, however exact
shear viscosity)
wise progression of droplet generation in lower airway (bronchioles)
viscosity). Surfactant proteins in the ALF reduce surface tension (which is necessary to prevent
the reduced surface tension enables easy formation of thin films as the
function of the number of collapsed
bronchioles and the frequency of their collapse. Some estimates of bronchiole collapse indicate
, however exact
wise progression of droplet generation in lower airway (bronchioles)19
viscosity). Surfactant proteins in the ALF reduce surface tension (which is necessary to prevent
the reduced surface tension enables easy formation of thin films as the
function of the number of collapsed
bronchioles and the frequency of their collapse. Some estimates of bronchiole collapse indicate
, however exact
19
viscosity). Surfactant proteins in the ALF reduce surface tension (which is necessary to prevent
the reduced surface tension enables easy formation of thin films as the
function of the number of collapsed
bronchioles and the frequency of their collapse. Some estimates of bronchiole collapse indicate
viscosity). Surfactant proteins in the ALF reduce surface tension (which is necessary to prevent
function of the number of collapsed
bronchioles and the frequency of their collapse. Some estimates of bronchiole collapse indicate
viscosity). Surfactant proteins in the ALF reduce surface tension (which is necessary to prevent
bronchioles and the frequency of their collapse. Some estimates of bronchiole collapse indicate
viscosity). Surfactant proteins in the ALF reduce surface tension (which is necessary to prevent
bronchioles and the frequency of their collapse. Some estimates of bronchiole collapse indicate
viscosity). Surfactant proteins in the ALF reduce surface tension (which is necessary to prevent
bronchioles and the frequency of their collapse. Some estimates of bronchiole collapse indicate

24
Support for this model is largely empirical, with several studies examining either
expelled breath condensate or droplet number as a function of various breathing patterns.
Johnson and Morawska, for their 2009 study, used an aerodynamic particle sizer to determine the
droplet concentration and size expelled from 13 healthy volunteers. The subjects were directed to
perform several different breathing maneuvers and the resulting droplet data was compared.
They reported a decrease in droplet concentration (compared to normal breathing) when the
subjects inhaled normally and then held their breath before exhaling, with the decrease tracking
with the length of time the subjects held their breath. This suggests droplet formation occurs
during inhalation, and that droplet settling occurs while breath is held. Furthermore, rapid tidal
breathing generated more droplets only when inhalation speed was increased. This was taken as
further evidence that bioaerosol formation during tidal breathing must be an inhalation process,
and that the mechanism must be film-rupture; however this assumed that the shear-driven
mechanism in the upper airway was an exhalation-only process (for tidal breathing). While true
for coughing or sneezing, this is not likely to be the case for tidal air flows, as discussed
previously. Thus, both mechanisms remain theoretically possible, and more evidence is needed
to discard one or the other.
Droplet transport:
Droplets, no matter where they form in the lungs, will vary in size and their diameters
will range from hundreds of nanometers to tens of microns. These droplets are immediately
subject to a number of forces and processes, including transport and gravitational settling.
Droplet evaporation is not expected to occur within the pulmonary system because it is a moist,
humid environment (relative humidity approaching 100%). Outside the lungs, evaporation can
occur and will depend on the specific environmental conditions. As evaporation occurs, droplet

diameter decreases, so that larger droplets can shrink to become aerosols. Critical particle
diameter
to salt content. In terms of transportation, the two most likely methods are diffusion and
advection (by the air stream). The Péclet number (Pe) is a dimensionless ra
advection (due to bulk fluid flow) to the rate of diffusion (equation III). The larger the value for
Pe, the more dominant advection is compared to diffusion, and vice versa for values smaller than
one. A simple order of magnitude analys
estimate of Pe as follows:
Where:
Diffusivity can be calculated as follows:
Where:
diameter decreases, so that larger droplets can shrink to become aerosols. Critical particle
diameter can be reached and will depend on the composition of the droplets, especially in regards
to salt content. In terms of transportation, the two most likely methods are diffusion and
advection (by the air stream). The Péclet number (Pe) is a dimensionless ra
advection (due to bulk fluid flow) to the rate of diffusion (equation III). The larger the value for
Pe, the more dominant advection is compared to diffusion, and vice versa for values smaller than
one. A simple order of magnitude analys
estimate of Pe as follows:
Where:
Diffusivity can be calculated as follows:
Where:
diameter decreases, so that larger droplets can shrink to become aerosols. Critical particle
can be reached and will depend on the composition of the droplets, especially in regards
to salt content. In terms of transportation, the two most likely methods are diffusion and
advection (by the air stream). The Péclet number (Pe) is a dimensionless ra
advection (due to bulk fluid flow) to the rate of diffusion (equation III). The larger the value for
Pe, the more dominant advection is compared to diffusion, and vice versa for values smaller than
one. A simple order of magnitude analys
estimate of Pe as follows:
Where:
Diffusivity can be calculated as follows:
diameter decreases, so that larger droplets can shrink to become aerosols. Critical particle
can be reached and will depend on the composition of the droplets, especially in regards
to salt content. In terms of transportation, the two most likely methods are diffusion and
advection (by the air stream). The Péclet number (Pe) is a dimensionless ra
advection (due to bulk fluid flow) to the rate of diffusion (equation III). The larger the value for
Pe, the more dominant advection is compared to diffusion, and vice versa for values smaller than
one. A simple order of magnitude analys
estimate of Pe as follows:
l = Transport length scale
U = Mean air velocity
D = Diffusivity
Diffusivity can be calculated as follows:
k
T = Temperat
µ
d = Droplet diameter
diameter decreases, so that larger droplets can shrink to become aerosols. Critical particle
can be reached and will depend on the composition of the droplets, especially in regards
to salt content. In terms of transportation, the two most likely methods are diffusion and
advection (by the air stream). The Péclet number (Pe) is a dimensionless ra
advection (due to bulk fluid flow) to the rate of diffusion (equation III). The larger the value for
Pe, the more dominant advection is compared to diffusion, and vice versa for values smaller than
one. A simple order of magnitude analys
estimate of Pe as follows:
l = Transport length scale
U = Mean air velocity
D = Diffusivity
Diffusivity can be calculated as follows:
kb
T = Temperat
µ
d = Droplet diameter
diameter decreases, so that larger droplets can shrink to become aerosols. Critical particle
can be reached and will depend on the composition of the droplets, especially in regards
to salt content. In terms of transportation, the two most likely methods are diffusion and
advection (by the air stream). The Péclet number (Pe) is a dimensionless ra
advection (due to bulk fluid flow) to the rate of diffusion (equation III). The larger the value for
Pe, the more dominant advection is compared to diffusion, and vice versa for values smaller than
one. A simple order of magnitude analys
estimate of Pe as follows:
l = Transport length scale
U = Mean air velocity
D = Diffusivity
Diffusivity can be calculated as follows:
b
T = Temperat
= Viscosity of the bulk media
d = Droplet diameter
diameter decreases, so that larger droplets can shrink to become aerosols. Critical particle
can be reached and will depend on the composition of the droplets, especially in regards
to salt content. In terms of transportation, the two most likely methods are diffusion and
advection (by the air stream). The Péclet number (Pe) is a dimensionless ra
advection (due to bulk fluid flow) to the rate of diffusion (equation III). The larger the value for
Pe, the more dominant advection is compared to diffusion, and vice versa for values smaller than
one. A simple order of magnitude analys
estimate of Pe as follows:
l = Transport length scale
U = Mean air velocity
D = Diffusivity
Diffusivity can be calculated as follows:
= Boltzmann’s Constant
T = Temperat
= Viscosity of the bulk media
d = Droplet diameter
diameter decreases, so that larger droplets can shrink to become aerosols. Critical particle
can be reached and will depend on the composition of the droplets, especially in regards
to salt content. In terms of transportation, the two most likely methods are diffusion and
advection (by the air stream). The Péclet number (Pe) is a dimensionless ra
advection (due to bulk fluid flow) to the rate of diffusion (equation III). The larger the value for
Pe, the more dominant advection is compared to diffusion, and vice versa for values smaller than
one. A simple order of magnitude analys
l = Transport length scale
U = Mean air velocity
D = Diffusivity
Diffusivity can be calculated as follows:
= Boltzmann’s Constant
T = Temperature
= Viscosity of the bulk media
d = Droplet diameter
diameter decreases, so that larger droplets can shrink to become aerosols. Critical particle
can be reached and will depend on the composition of the droplets, especially in regards
to salt content. In terms of transportation, the two most likely methods are diffusion and
advection (by the air stream). The Péclet number (Pe) is a dimensionless ra
advection (due to bulk fluid flow) to the rate of diffusion (equation III). The larger the value for
Pe, the more dominant advection is compared to diffusion, and vice versa for values smaller than
one. A simple order of magnitude analys
l = Transport length scale
U = Mean air velocity
D = Diffusivity
Diffusivity can be calculated as follows:
= Boltzmann’s Constant
ure
= Viscosity of the bulk media
d = Droplet diameter
diameter decreases, so that larger droplets can shrink to become aerosols. Critical particle
can be reached and will depend on the composition of the droplets, especially in regards
to salt content. In terms of transportation, the two most likely methods are diffusion and
advection (by the air stream). The Péclet number (Pe) is a dimensionless ra
advection (due to bulk fluid flow) to the rate of diffusion (equation III). The larger the value for
Pe, the more dominant advection is compared to diffusion, and vice versa for values smaller than
one. A simple order of magnitude analys
l = Transport length scale
U = Mean air velocity
Diffusivity can be calculated as follows:
= Boltzmann’s Constant
= Viscosity of the bulk media
d = Droplet diameter
diameter decreases, so that larger droplets can shrink to become aerosols. Critical particle
can be reached and will depend on the composition of the droplets, especially in regards
to salt content. In terms of transportation, the two most likely methods are diffusion and
advection (by the air stream). The Péclet number (Pe) is a dimensionless ra
advection (due to bulk fluid flow) to the rate of diffusion (equation III). The larger the value for
Pe, the more dominant advection is compared to diffusion, and vice versa for values smaller than
one. A simple order of magnitude analysis of droplets within the pulmonary system leads to an
l = Transport length scale
U = Mean air velocity
Diffusivity can be calculated as follows:
= Boltzmann’s Constant
= Viscosity of the bulk media
d = Droplet diameter
diameter decreases, so that larger droplets can shrink to become aerosols. Critical particle
can be reached and will depend on the composition of the droplets, especially in regards
to salt content. In terms of transportation, the two most likely methods are diffusion and
advection (by the air stream). The Péclet number (Pe) is a dimensionless ra
advection (due to bulk fluid flow) to the rate of diffusion (equation III). The larger the value for
Pe, the more dominant advection is compared to diffusion, and vice versa for values smaller than
is of droplets within the pulmonary system leads to an
l = Transport length scale
U = Mean air velocity
Diffusivity can be calculated as follows:
= Boltzmann’s Constant
= Viscosity of the bulk media
diameter decreases, so that larger droplets can shrink to become aerosols. Critical particle
can be reached and will depend on the composition of the droplets, especially in regards
to salt content. In terms of transportation, the two most likely methods are diffusion and
advection (by the air stream). The Péclet number (Pe) is a dimensionless ra
advection (due to bulk fluid flow) to the rate of diffusion (equation III). The larger the value for
Pe, the more dominant advection is compared to diffusion, and vice versa for values smaller than
is of droplets within the pulmonary system leads to an
l = Transport length scale
Diffusivity can be calculated as follows:
= Boltzmann’s Constant
= Viscosity of the bulk media
25
diameter decreases, so that larger droplets can shrink to become aerosols. Critical particle
can be reached and will depend on the composition of the droplets, especially in regards
to salt content. In terms of transportation, the two most likely methods are diffusion and
advection (by the air stream). The Péclet number (Pe) is a dimensionless ra
advection (due to bulk fluid flow) to the rate of diffusion (equation III). The larger the value for
Pe, the more dominant advection is compared to diffusion, and vice versa for values smaller than
is of droplets within the pulmonary system leads to an
l = Transport length scale
= Boltzmann’s Constant
= Viscosity of the bulk media
25
diameter decreases, so that larger droplets can shrink to become aerosols. Critical particle
can be reached and will depend on the composition of the droplets, especially in regards
to salt content. In terms of transportation, the two most likely methods are diffusion and
advection (by the air stream). The Péclet number (Pe) is a dimensionless ra
advection (due to bulk fluid flow) to the rate of diffusion (equation III). The larger the value for
Pe, the more dominant advection is compared to diffusion, and vice versa for values smaller than
is of droplets within the pulmonary system leads to an
= Boltzmann’s Constant
= Viscosity of the bulk media
diameter decreases, so that larger droplets can shrink to become aerosols. Critical particle
can be reached and will depend on the composition of the droplets, especially in regards
to salt content. In terms of transportation, the two most likely methods are diffusion and
advection (by the air stream). The Péclet number (Pe) is a dimensionless ra
advection (due to bulk fluid flow) to the rate of diffusion (equation III). The larger the value for
Pe, the more dominant advection is compared to diffusion, and vice versa for values smaller than
is of droplets within the pulmonary system leads to an
(
(
diameter decreases, so that larger droplets can shrink to become aerosols. Critical particle
can be reached and will depend on the composition of the droplets, especially in regards
to salt content. In terms of transportation, the two most likely methods are diffusion and
advection (by the air stream). The Péclet number (Pe) is a dimensionless ra
advection (due to bulk fluid flow) to the rate of diffusion (equation III). The larger the value for
Pe, the more dominant advection is compared to diffusion, and vice versa for values smaller than
is of droplets within the pulmonary system leads to an
(III
(IV
diameter decreases, so that larger droplets can shrink to become aerosols. Critical particle
can be reached and will depend on the composition of the droplets, especially in regards
to salt content. In terms of transportation, the two most likely methods are diffusion and
advection (by the air stream). The Péclet number (Pe) is a dimensionless ra
advection (due to bulk fluid flow) to the rate of diffusion (equation III). The larger the value for
Pe, the more dominant advection is compared to diffusion, and vice versa for values smaller than
is of droplets within the pulmonary system leads to an
III
IV
diameter decreases, so that larger droplets can shrink to become aerosols. Critical particle
can be reached and will depend on the composition of the droplets, especially in regards
to salt content. In terms of transportation, the two most likely methods are diffusion and
advection (by the air stream). The Péclet number (Pe) is a dimensionless ra
advection (due to bulk fluid flow) to the rate of diffusion (equation III). The larger the value for
Pe, the more dominant advection is compared to diffusion, and vice versa for values smaller than
is of droplets within the pulmonary system leads to an
III)
IV)
diameter decreases, so that larger droplets can shrink to become aerosols. Critical particle
can be reached and will depend on the composition of the droplets, especially in regards
to salt content. In terms of transportation, the two most likely methods are diffusion and
advection (by the air stream). The Péclet number (Pe) is a dimensionless ra
advection (due to bulk fluid flow) to the rate of diffusion (equation III). The larger the value for
Pe, the more dominant advection is compared to diffusion, and vice versa for values smaller than
is of droplets within the pulmonary system leads to an
)
)
diameter decreases, so that larger droplets can shrink to become aerosols. Critical particle
can be reached and will depend on the composition of the droplets, especially in regards
to salt content. In terms of transportation, the two most likely methods are diffusion and
advection (by the air stream). The Péclet number (Pe) is a dimensionless ra
advection (due to bulk fluid flow) to the rate of diffusion (equation III). The larger the value for
Pe, the more dominant advection is compared to diffusion, and vice versa for values smaller than
is of droplets within the pulmonary system leads to an
diameter decreases, so that larger droplets can shrink to become aerosols. Critical particle
can be reached and will depend on the composition of the droplets, especially in regards
to salt content. In terms of transportation, the two most likely methods are diffusion and
advection (by the air stream). The Péclet number (Pe) is a dimensionless ratio of the rate of
advection (due to bulk fluid flow) to the rate of diffusion (equation III). The larger the value for
Pe, the more dominant advection is compared to diffusion, and vice versa for values smaller than
is of droplets within the pulmonary system leads to an
diameter decreases, so that larger droplets can shrink to become aerosols. Critical particle
can be reached and will depend on the composition of the droplets, especially in regards
to salt content. In terms of transportation, the two most likely methods are diffusion and
tio of the rate of
advection (due to bulk fluid flow) to the rate of diffusion (equation III). The larger the value for
Pe, the more dominant advection is compared to diffusion, and vice versa for values smaller than
is of droplets within the pulmonary system leads to an
diameter decreases, so that larger droplets can shrink to become aerosols. Critical particle
can be reached and will depend on the composition of the droplets, especially in regards
tio of the rate of
advection (due to bulk fluid flow) to the rate of diffusion (equation III). The larger the value for
Pe, the more dominant advection is compared to diffusion, and vice versa for values smaller than
is of droplets within the pulmonary system leads to an
can be reached and will depend on the composition of the droplets, especially in regards
advection (due to bulk fluid flow) to the rate of diffusion (equation III). The larger the value for
Pe, the more dominant advection is compared to diffusion, and vice versa for values smaller than
can be reached and will depend on the composition of the droplets, especially in regards
Pe, the more dominant advection is compared to diffusion, and vice versa for values smaller than
26
Diffusivity is inversely proportional to droplet size (larger droplets result in greater
surface drag forces, reducing mobility), and will remain constant throughout the pulmonary
system (for a given droplet size); therefore Pe should be proportional to droplet size. The length
scales of interest are on the order of millimeters to centimeters (based on the diameter of the
airways and the total length of the pulmonary system). The lowest mean air velocity occurs in
the terminal airway generations – because Pe varies linearly with velocity, it will be minimized
when velocity is at a minimum (for fixed diffusivity and length scale). Pe was calculated for a
range of droplet sizes and length scales: the results are shown in Table 2.4. Advection is
dominant for all conditions throughout the pulmonary system, which indicates that respiratory air
flow rates are extremely relevant to droplet transport.
Table 2.4: Pe for a range of droplet sizes
Similarly, the gravitational settling rate can be determined as a function of droplet size.
Figure 2.8 shows the forces acting on a spherical droplet in stagnant air. Using Stoke’s law to
determine the drag force acting on the droplet as a function of settling velocity (equation V), and
equating that to the gravitational force acting on the particle as a function of droplet diameter
(equation VI) the settling velocity can be determined as a function of droplet diameter (equation
VII). Calculating the settling velocity for a range of droplet sizes (shown in Figure 2.9) indicates
settling velocities become negligibly small for droplets with diameters less than 10 micron.
Droplet Diameter
(µm) 0.1 1 10 100
0.1 O(105) O(10
6) O(10
7) O(10
8)
1 O(106) O(10
7) O(10
8) O(10
9)
10 O(107) O(10
8) O(10
9) O(10
10)
Length Scale (mm)

Where:
Where:
Where:
Where:Where:Where:Where:
µ
d = Droplet diameter
u
m
g = Gravitational acceleration
ρ
V
µ
d = Droplet diameter
us
md
g = Gravitational acceleration
ρd
Vd
= Viscosity of the bulk media
d = Droplet diameter
= Settling velocity
d
g = Gravitational acceleration
d = Droplet density
d
= Viscosity of the bulk media
d = Droplet diameter
= Settling velocity
= Droplet mass
g = Gravitational acceleration
= Droplet density
= Droplet volume
= Viscosity of the bulk media
d = Droplet diameter
= Settling velocity
= Droplet mass
g = Gravitational acceleration
= Droplet density
= Droplet volume
Figure 2.
= Viscosity of the bulk media
d = Droplet diameter
= Settling velocity
= Droplet mass
g = Gravitational acceleration
= Droplet density
= Droplet volume
Figure 2.
= Viscosity of the bulk media
d = Droplet diameter
= Settling velocity
= Droplet mass
g = Gravitational acceleration
= Droplet density
= Droplet volume
Figure 2.
= Viscosity of the bulk media
d = Droplet diameter
= Settling velocity
= Droplet mass
g = Gravitational acceleration
= Droplet density
= Droplet volume
Figure 2.
= Viscosity of the bulk media
d = Droplet diameter
= Settling velocity
= Droplet mass
g = Gravitational acceleration
= Droplet density
= Droplet volume
Figure 2.
= Viscosity of the bulk media
d = Droplet diameter
= Settling velocity
= Droplet mass
g = Gravitational acceleration
= Droplet density
= Droplet volume
Figure 2.
= Viscosity of the bulk media
d = Droplet diameter
= Settling velocity
= Droplet mass
g = Gravitational acceleration
= Droplet density
= Droplet volume
Figure 2.
= Viscosity of the bulk media
d = Droplet diameter
= Settling velocity
= Droplet mass
g = Gravitational acceleration
= Droplet density
= Droplet volume
Figure 2.8
= Viscosity of the bulk media
d = Droplet diameter
= Settling velocity
= Droplet mass
g = Gravitational acceleration
= Droplet density
= Droplet volume
8: Schematic of forces acting on settling droplet
= Viscosity of the bulk media
d = Droplet diameter
= Settling velocity
= Droplet mass
g = Gravitational acceleration
= Droplet density
= Droplet volume
: Schematic of forces acting on settling droplet
= Viscosity of the bulk media
d = Droplet diameter
= Settling velocity
= Droplet mass
g = Gravitational acceleration
= Droplet density
= Droplet volume
: Schematic of forces acting on settling droplet
= Viscosity of the bulk media
d = Droplet diameter
= Settling velocity
= Droplet mass
g = Gravitational acceleration
= Droplet density
= Droplet volume
: Schematic of forces acting on settling droplet
= Viscosity of the bulk media
d = Droplet diameter
= Settling velocity
= Droplet mass
g = Gravitational acceleration
= Droplet density
= Droplet volume
: Schematic of forces acting on settling droplet
= Viscosity of the bulk media
d = Droplet diameter
= Settling velocity
= Droplet mass
g = Gravitational acceleration
= Droplet density
= Droplet volume
: Schematic of forces acting on settling droplet
= Viscosity of the bulk media
d = Droplet diameter
= Settling velocity
g = Gravitational acceleration
= Droplet density
= Droplet volume
: Schematic of forces acting on settling droplet
= Viscosity of the bulk media
d = Droplet diameter
= Settling velocity
g = Gravitational acceleration
= Droplet density
= Droplet volume
: Schematic of forces acting on settling droplet
= Viscosity of the bulk media
g = Gravitational acceleration
: Schematic of forces acting on settling droplet
= Viscosity of the bulk media
g = Gravitational acceleration
: Schematic of forces acting on settling droplet
= Viscosity of the bulk media
g = Gravitational acceleration
27
: Schematic of forces acting on settling droplet
= Viscosity of the bulk media
g = Gravitational acceleration
27
: Schematic of forces acting on settling droplet
= Viscosity of the bulk media
g = Gravitational acceleration
27
: Schematic of forces acting on settling droplet
= Viscosity of the bulk media
g = Gravitational acceleration
: Schematic of forces acting on settling droplet
= Viscosity of the bulk media
g = Gravitational acceleration
: Schematic of forces acting on settling droplet
= Viscosity of the bulk media
g = Gravitational acceleration
: Schematic of forces acting on settling droplet
= Viscosity of the bulk media
: Schematic of forces acting on settling droplet
= Viscosity of the bulk media
: Schematic of forces acting on settling droplet
: Schematic of forces acting on settling droplet: Schematic of forces acting on settling droplet
: Schematic of forces acting on settling droplet
: Schematic of forces acting on settling droplet
s
: Schematic of forces acting on settling droplet
s
: Schematic of forces acting on settling droplet
: Schematic of forces acting on settling droplet: Schematic of forces acting on settling droplet: Schematic of forces acting on settling droplet: Schematic of forces acting on settling droplet: Schematic of forces acting on settling droplet: Schematic of forces acting on settling droplet: Schematic of forces acting on settling droplet
(
(VII
: Schematic of forces acting on settling droplet
(V
VII
: Schematic of forces acting on settling droplet
V)
VII
: Schematic of forces acting on settling droplet
)
VII
: Schematic of forces acting on settling droplet
VII)
: Schematic of forces acting on settling droplet
: Schematic of forces acting on settling droplet
: Schematic of forces acting on settling droplet
((VIVIVIVI)

28
Figure 2.9: Settling velocity as a function of droplet diameter
Once formed, larger droplets (> 10 microns) will settle back to the ALF quickly, whereas
smaller droplets will remain entrained within the air stream. In order for transmission to occur,
however, the droplets must first escape the lungs. This occurs during the expiratory phase, which
typically lasts from one to three seconds, so the droplets must be transported from their point of
origin to the nasal airways or mouth and out to the environment within that period of time. A
rough estimate of escape time can be determined from the length the droplets must travel through
each airway generation and the mean air velocity within that generation. The total length droplets
formed in the upper airways must travel to escape is between 0.22 meters and 0.29 meters.
Traveling at the mean air velocity for each airway generation, they would require less than 0.1
seconds to traverse the total distance. Droplets formed in the lower airways must travel an
additional 0.02 – 0.1 meters (for a total distance between 0.24 meters and 0.39 meters). The time

29
required for these droplets to escape is less than 0.6 seconds. Droplets are therefore theoretically
capable of escaping the pulmonary system (from either point of origin) during the expiratory
phase of tidal breathing. During a cough or sneeze much higher air velocities are achieved,
therefore droplets are expected to escape to the environment in even less time compared to tidal
breathing.
Conclusion:
Two primary mechanisms for droplet formation during tidal breathing were discussed: an
upper airway and a lower airway model. Investigation of published experimental and
computational data indicated the upper airway model may actually be an inhalation-process. If
true, droplet formation is likely to be a function of bifurcation angle. Furthermore, published
research thought to support the lower airway model would actually fit the new upper airway
model as well, so that neither model can be confirmed or denied, therefore droplets may
potentially form in either the upper or lower airways. These droplets are composed of ALF along
with anything residing in or on the ALF, including pathogens. In this way, pathogens captured in
these droplets are capable of escaping to the surrounding environment. Upon reaching the
environment, large droplets will settle or evaporate, decreasing their size until they reach a
critical equilibrium diameter (which is a function of their composition). At these small sizes (a
few nanometers to a few microns in diameter) the rate at which they settle, due to gravity, is
virtually insignificant. Instead, they will remain airborne – transported along air currents where
they may eventually be inhaled by other individuals, and result in an infection.

30
References:
1. Wathes, C. M.; Cox, C. B. (1995). Bioaerosols handbook.
2. Williams, R.; Rankin, N; Smith, T; Galler, D; Seakins, P (1996) Crit Care Med 24: 1920-1929
3. Knowles, M. R.; Boucher, R. C. (2002) J Clin Invest. 109(5): 571–577
4. http://www.lungusa.org/asthmasteroids
5. Mescher, A. L. (2010) Junqueira’s Basic Histology: Text and Atlas, 12e, Ch. 17
6. Delmotte, P.; Sanderson, M. J. (2006) Am. J. Respir. Cell Mol. Biol. 10: 1165
7. Jeffery, P. K.; Reid, L. M. (1977). The respiratory mucus membrane. Respiratory defense mechanisms.
Part I: 193–245.
8. Takishima, T.; Shimura, S. (1994) Airway Secretion: Physiological bases for the control of mucous
hypersecretion, Ch. 6: 224-225
9. Takishima, T.; Shimura, S. (1994) Airway Secretion: Physiological bases for the control of mucous
hypersecretion, Ch. 2
10. Lai, S. K.; Wang, Y.; Wirtz, D.; Hanes, J. (2009) Advanced Drug Delivery Reviews 61(2): 86-100
11. Ogra, P. L.; Mestecky, J.; Lamm, M. E.; Strober, W.; Bienenstock, J.; McGhee, J. R. (1999) Mucosal
Immunology: 43-64
12. Rogers, D. F.; Lethem, M. I. (1997) Airway Mucus: Basic Mechanisms and Clinical Perspectives, Ch. 6:
119-122
13. Notter, R. H. (2000) Lung Surfactants, Ch. 6
14. Thurlbeck, W. M.; Churg, A. M. (1995) Pathology of the lung, 2e, Ch. 3: 90-94
15. Zeng, X. M.; Martin, G.; Marriott, C. (2001) Particulate Interactions in Dry Powder Formulations of
Inhalation
16. Mihaescu, M.; Murugappan, S.; Gutmark, E.; Donnelly, L. F.; Khosla, S.; Kalra, M. (2008) Ann Otol
Rhinol Laryngol 117(4): 303-309
17. Green, A. S. (2004) Journal of Biomechanics 37(5): 661-667
18. Moriarty, J. A.; Grotberg, J. B. (1999) J. Fluid Mech. 387: 1-22
19. Johnson, G.; Morawska, L. (2009) J Aerosol Med Pulm Drug Deliv. 22:1-9.
20. Hazel, A. L.; Heil, M. (2005) Proc R. Soc. 461: 1847-1868
21. Macklem, P. T.; Proctor, D. F.; Hogg, J. C. (1970) Respir Phsysiol.8:191–203
22. Israelachvili, J. (1991) Intermolecular and Surface Forces
23. Johnson GR and Morawska L: The mechanism of breath aerosol formation. J Aerosol Med Pulm Drug
Deliv. 2009;22:1-9.
24. Gebhart, J.; Anselm, J.; Heyder, J.; Stahlhofen, W. (1988) J. Aerosol Med. 1: 196-197
25. Morawska L, Johnson GR, Ristovski ZD, Hargreaves M, Mengersen K, Corbett S, Chao CYH, Li Y, and
Katoshevski D: Size distribution and sites of origin of droplets expelled from the human respiratory tract
during expiratory activities. J Aerosol Sci. 2009;40:256-269
26. Kataoka, I.; Ishii, M.; Mishima, K. (1982) J. Fluids Eng. 105: 230-238
27. Blanchard, D. (1963) Progr. Oceanogr. 1: 73-202
28. Engel, L.; Grassino, A.; Anthonisen, N. (1975) J. Appl. Physiol. 38:1117-1125
29. Haskin, P.; Goodman, L. (1982) AJR 139: 879-882
30. Weibel, E. (1963) Morphometry of the human lung
31. Hinds, W. (1982) Aerosol technology: properties, behavior and measurements of airborne particles
32. Chowdhary, R.; Singh, V.; Tattersfield, A.; Sharma, S.; Subir, K.; Gupta, A. (1999) Journal of Asthma
36(5): 419-426
33. Wang, Y.; Liu, Y.; Sun, X.; Yu, S.; Gao, F. (2009) Acta Mech Sin 25: 737-746
34. Basser, P.; McMahon, T.; Griffith, P. (1989) J. Biomech. Eng. 111: 288-297
31
Chapter 3: Bioaerosol generation – in vitro models
Introduction:
The first hypothesis of this thesis is:
Droplet generation during tidal breathing can occur in both the
upper airways (via surface shear) and lower airways (via film
rupture) during inhalation, and will vary with bifurcation angle
in the upper airways.
To address this hypothesis, novel in vitro models were developed which were designed to
replicate the conditions within the pulmonary system that occur during droplet formation (via the
two potential mechanisms proposed in the literature). A cough model was developed as well and
is expected to produce the largest number of droplets (via shearing) due to the much higher air
velocities present. Experiments were performed with each system to examine droplet production
in terms of number and size.
Background:
In chapter 2, bioaerosol transport through the pulmonary system was shown to be
technically feasible. Two major mechanisms for droplet generation during tidal breathing were
identified from the literature: films or plugs of ALF rupturing in the lower airways (Johnson and
Morawska, 200918
); and surface shearing of ALF in the upper airways (Moriarty and Grotberg,
199917
). While the role of surface shearing in droplets generated via coughing or sneezing is
widely accepted, for tidal breathing air flow rates recent studies18-20
of exhaled droplets as a
function of breathing pattern have reported circumstantial evidence favoring droplet formation as
an inhalation process. This was taken to mean that the lower airway is the more probable source
of exhaled droplets; however, evidence was presented in chapter 2 suggesting that wall shear
stress in the upper airways may peak during inhalation subsequent to bifurcations in the first few
32
generations of the airways, indicating the possibility that the shear-driven mechanism for droplet
generation may also be an inhalation process (and therefore in agreement with the expelled
droplet data). If this is the case, then the bifurcation angle is expected to influence droplet
formation in the upper airway model (due to shifting the peak air velocity closer to the inner
wall, thereby increasing wall shear stress), and forms the basis for the first hypothesis of this
thesis.
Optical Particle Counting Systems:
To test the mechanisms for bioaerosol generation discussed in chapter 2, the first
requirement is a means to determine when droplets are present and in what numbers (as well as
both their size and size distribution). As discussed previously, the presence of small droplets was
expected even in the 1940s (Duguid21
) but thought to be insignificant, mostly due to the inability
to observe them. This persisted until the 1990s, after the development of optical particle counters
(OPCs), which were employed by Papineni and Rosenthal22
to measure expelled droplets. They
found that the number of small droplets vastly exceeded the number of larger droplets and paved
the way for a deeper understanding of airborne transmission.
OPCs come in many shapes and sizes, but the basic mechanism involves measuring laser
light that has been blocked or scattered by particles passing through the beam1. Refraction and
diffraction are used to measure the size and number of particles (Figure 3.1). To produce
accurate, repeatable results, they operate at fixed air flow rates as a closed system. Limitations of
this method involve the optical particle concentration: if the number of particles per volume of
air is too great, secondary and tertiary scattering can skew the results (or the intensity may
become too low); too few particles per volume and insufficient scattering may occur.

33
Figure 3.1: Optical particle detector array2
Many commercially available OPCs used for medical and device research operate at flow
rates equivalent to peak respiratory rates (such as 1 CFM or 28.3 sLPM). When activated, they
measure continuously in real-time (sampling times are typically in the 1-3 millisecond
range).Vacuum pumps are used to maintain air flow at the specified flow rate (and are often
controlled by software which constantly monitors and adjusts for pressure drops which may
occur upstream during sampling). These OPCs work well provided they can sample from
continuously supplied air. As a consequence, they are well-suited for use in systems operating at
tidal breathing flow rates, but require a more sophisticated setup to work with cough-air systems
(in which air flow rate varies rapidly and achieves a peak value many times that of tidal
breathing). To that end, the Exhalair bioaerosol measurement system (pictured in Figure 3.2) was
created by Pulmatrix, Inc (Lexington, MA). The system uses an Airnet optical particle counter
(from Particle Measuring Systems, Boulder, CO) coupled to a vacuum pump along with a flow

34
meter and is specifically designed to measure droplets in exhaled tidal- and cough-air while
simultaneously measuring the air flow rate.
Figure 3.2: Exhalair system for measuring droplets in exhaled air (Pulmatrix, Inc.)
Exhaled air is sampled at 28.3 sLPM – if supply air flow rate is greater than the sampling
rate, excess air is diverted through one-way valves and exhausted through an ultra-low
penetration air (ULPA) filter (designed to remove greater than 99% of particles greater than 120
nm in size); if less, the sample air is mixed with ULPA filtered, “clean” air at a known ratio. This
is advantageous in that it enables accurate droplet measurement for a variety of breathing
patterns (i.e. tidal breathing at varying rates/volumes, cough-air flows, etc.), however it does
require the assumption that droplets within the exhaled air are well-mixed, so that sampling a
portion of said air remains an accurate assessment of overall droplet number.
Lower Airway Model Development:
As described in Chapter 2, the lower airway mechanism of droplet generation involves
the reopening of collapsed bronchioles, producing a thin film that subsequently breaks into fine
particles. The droplets are created only during the re-opening stage (as the bronchiole expands),

35
therefore mimicking this step is the minimum requirement of a bench-top system. This was
accomplished utilizing conical tubes with a maximum diameter equal to that of the fully dilated
bronchioles and a minimum diameter selected such that a liquid meniscus or film can be created
by careful sample loading. The minimum diameter was also used as an orifice to control the air
flow rate through each tube. Figure 3.3 is a schematic diagram of this system: multiple tubes are
used to prevent the need for additional clean air when measuring with the OPC (the system was
designed to operate at 28.3 sLPM), which would dilute the sample air stream. A total of 96 tubes
were used in a parallel flow configuration, to maintain an equal pressure drop across each tube.
Figure 3.3: Schematic diagram of lower airway droplet system
One-way valves were employed at the entrance and exit of the otherwise closed system
containing the simulated bronchiole tubes to prevent air flow in the reverse direction. The tubes

36
were spaced about three tube-lengths (60 mm) from the entrance and exit, to reduce center-to-
edge variations in pressure drop and air flow. The tubes are the only passage between the upper
and lower halves of the chamber, which were otherwise completely sealed from each other.
Sample loading was accomplished via pipette, with care taken to ensure a film/plug was formed
in each tube prior to starting the experiment. Capillary forces were sufficient to prevent the
sample from draining (by gravity) from the lower end of each tube.
During operation, a vacuum pump (from the OPC) creates a pressure drop across the
entire system to achieve an overall air flow rate of 28.3 sLPM. Air is drawn into the lower
chamber through an ULPA filtration system to prevent contamination from the environment,
then passes through the tubes and ultimately into the OPC. Each tube experiences an equivalent
pressure drop due to their parallel configuration and spacing from the container walls. Along
with air, the sample film is driven upwards through the tube. Due to the conical shape of the
tube, the film expands as it moves, mimicking the film expansion that occurs within the
expanding bronchioles in vivo, until it reaches a critical thickness/area and breaks, shedding
droplets which are entrained within the air stream and drawn out to the OPC.
Upper Airway Model Development:
The upper airway model describes a shear-driven mechanism for droplet generation.
Shear stresses along the ALF are proportional to the velocity of the air passing over it, so shear
stress is expected to be highest in the upper airways and trachea, where the velocity peaks. Early
in vitro systems to study cough-generated shear forces on the ALF were created by King et al. in
the 1980s with the initial motivation to study how shearing from air flow was involved in mucus
transport and clearance3,4
. These studies used a simulated cough system consisting of a

37
rectangular channel in which mucus or mucus simulants were placed as a thin layer coating the
bottom of the channel. The dimensions of the channel were such that the cross-sectional area (but
not shape) was similar to that of the human trachea. Air was forced through the channel by
generating a high pressure bolus of air upstream to produce flow rates matching those in the
trachea of humans during coughing. A schematic of this system is shown in Figure 3.4
Figure 3.4: Schematic of King’s simulated cough system – (1) Air tank;(2)
Solenoid valve; (3) Laminar flow element;(4) Pneuomotachograph;(5) Trough
(model trachea);(6) Differential pressure transducer7
This model was adapted for use in studying droplet generation from cough shearing by
Edwards and Watanabe et al.6,7
by adding a collection vessel on the outlet and sampling with an
OPC. An ULPA filter was also added prior to the trough to prevent particle contamination from
upstream components. The collection vessel was basically a chamber-and-piston setup with
variable volume. This acted to contain the cough-air exhaled from the trough, but meant that the
air remained stagnant for several minutes while the OPC sampled the entire cough volume at a
fixed volumetric flow rate (28.3 sLPM). Droplet deposition along the walls of the container over
the duration of time spent sampling the exhaled air could potentially result in lower
measurements of total droplets produced. Furthermore, the square cross-section of the trough and
the use of laminar flow elements altered the air-flow profile experienced by the mucus, and could

38
significantly influence droplet production, potentially resulting in a poor “fit” to the real
pulmonary system. To compensate for these factors, the system was overhauled to create a new
and improved simulated cough system.
Simulated Cough System:
The collection vessel was eliminated in the new simulated cough system – it was replaced
by real-time sampling via an Exhalair. The air tank at the inlet of the system was replaced by a
Breathing Simulator (MH Custom Design and Mfg., Midvale, UT), which is capable of
generating specific, repeatable air-flow profiles. The simulated cough profile fed to the Breathing
Simulator was generated from a mathematical model developed by Chen et al.8 to fit data
collected from volunteers. The final flow profile used is shown in Figure 3.5, with a peak flow
rate of 6 liters per second (360 sLPM), a total duration of just under 0.4 seconds and a total
volume of approximately 1 liter. Cough air exiting the trough was sampled by the Exhalair
system at 28.3 sLPM, with excess air exhausting to an ULPA filter.
Figure 3.5: Cough-air flow profile

39
Figure 3.6: (a) Modified cough-trough (b) Cross-sectional schematic of modified cough-trough
The rectangular-channel trough was replaced with a nearly-cylindrical geometry (with a
flattened section, see Figure 3.6). The primarily cylindrical geometry was used to reduce artifacts
in air flow caused by the corners of the rectangular channel (compared to within the pulmonary
system). The diameter of the cylindrical portion is equal to that of the trachea during a cough,
which is smaller than for tidal breathing because the trachea constricts immediately prior to
coughing (to further increase air velocities and thereby increase shear forces and clearance9). The
flattened portion was incorporated to maintain a more uniform height of the mucus sample,
which is spread over a fixed area at fixed volume. The exposed sample area is approximately 10
cm2 or about 20% of the surface area of the human trachea. The final system is shown in Figure
3.7.
Figure 3.7: Simulated Cough System - (1) Breathing simulator; (2) ULPA
filter; (3) Modified trough; (4) Exhalair; (5) Exhaust ULPA filter
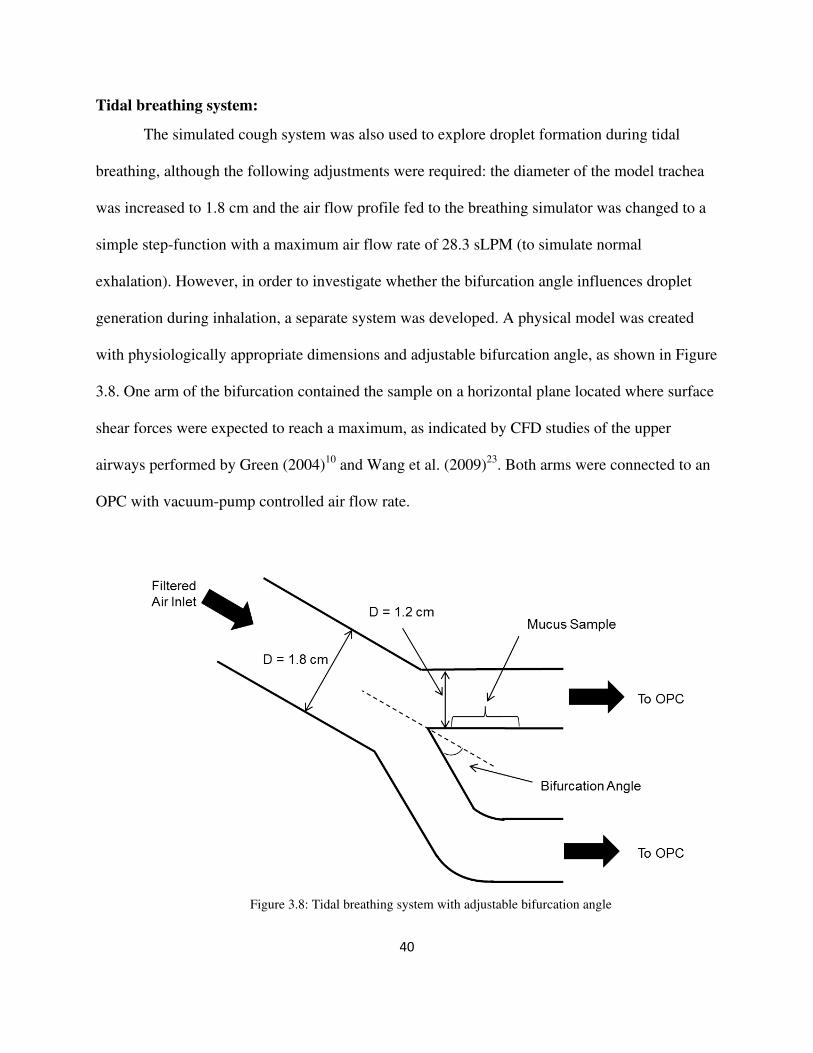
40
Tidal breathing system:
The simulated cough system was also used to explore droplet formation during tidal
breathing, although the following adjustments were required: the diameter of the model trachea
was increased to 1.8 cm and the air flow profile fed to the breathing simulator was changed to a
simple step-function with a maximum air flow rate of 28.3 sLPM (to simulate normal
exhalation). However, in order to investigate whether the bifurcation angle influences droplet
generation during inhalation, a separate system was developed. A physical model was created
with physiologically appropriate dimensions and adjustable bifurcation angle, as shown in Figure
3.8. One arm of the bifurcation contained the sample on a horizontal plane located where surface
shear forces were expected to reach a maximum, as indicated by CFD studies of the upper
airways performed by Green (2004)10
and Wang et al. (2009)23
. Both arms were connected to an
OPC with vacuum-pump controlled air flow rate.
Figure 3.8: Tidal breathing system with adjustable bifurcation angle
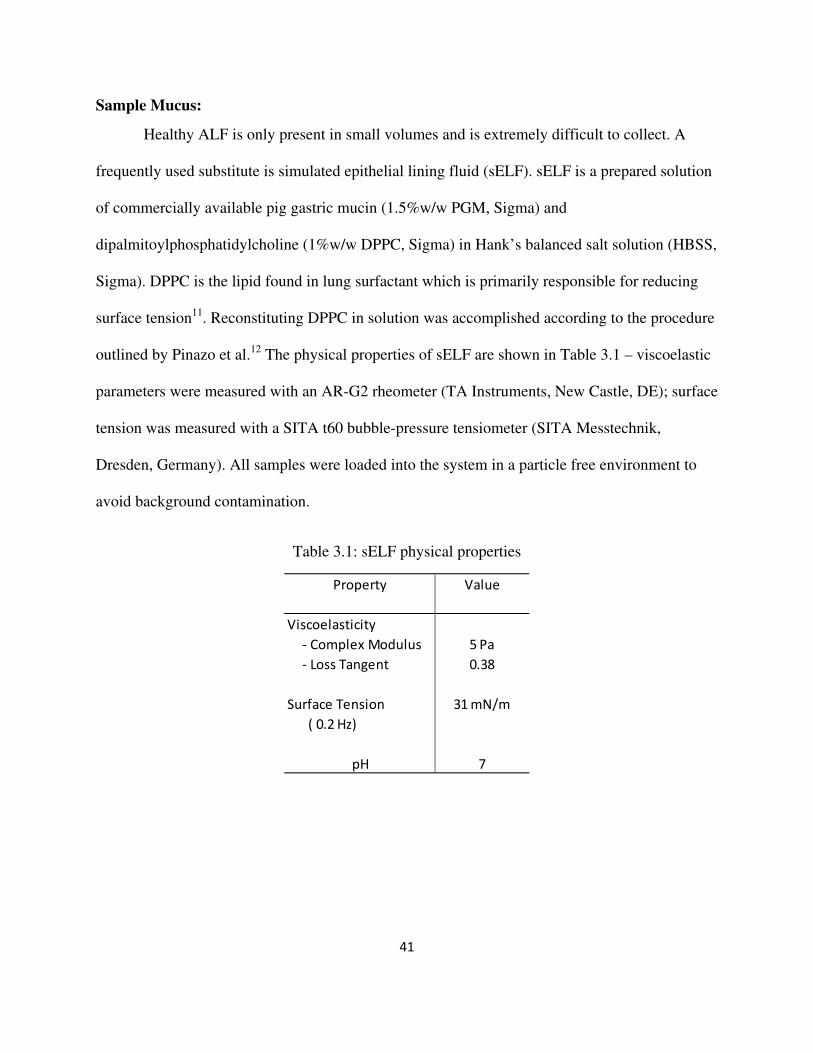
41
Sample Mucus:
Healthy ALF is only present in small volumes and is extremely difficult to collect. A
frequently used substitute is simulated epithelial lining fluid (sELF). sELF is a prepared solution
of commercially available pig gastric mucin (1.5%w/w PGM, Sigma) and
dipalmitoylphosphatidylcholine (1%w/w DPPC, Sigma) in Hank’s balanced salt solution (HBSS,
Sigma). DPPC is the lipid found in lung surfactant which is primarily responsible for reducing
surface tension11
. Reconstituting DPPC in solution was accomplished according to the procedure
outlined by Pinazo et al.12
The physical properties of sELF are shown in Table 3.1 – viscoelastic
parameters were measured with an AR-G2 rheometer (TA Instruments, New Castle, DE); surface
tension was measured with a SITA t60 bubble-pressure tensiometer (SITA Messtechnik,
Dresden, Germany). All samples were loaded into the system in a particle free environment to
avoid background contamination.
Table 3.1: sELF physical properties
Property Value
Viscoelasticity
- Complex Modulus 5 Pa
- Loss Tangent 0.38
Surface Tension 31 mN/m
( 0.2 Hz)
pH 7

42
Results:
Results for each system are presented as droplet concentration (the total number of
droplets per liter of sample air – and per tube/bronchiole for the lower airway model) and are
shown in Figure 3.9. Coughing produced the largest concentration of droplets (122 per liter of air
+/- 20), as expected. Reported measurements of droplets produced by cough from healthy
volunteers vary, ranging from several hundred to a few thousand per liter13,14
; however this
includes contributions from the mouth and pharynx. Furthermore, the exposed sample interfacial
area in the simulated cough system is approximately 20% of that in the human trachea. On a per
area basis, the simulated cough system produced 12.2 droplets per liter per square centimeter,
compared to approximately 15.4 per liter per square centimeter for healthy human volunteers,13
which is reasonably good agreement.
Figure 3.9: Cumulative droplets per liter of air produced by each system

43
The lower airway system produced an average of 11 +/- 3 droplets per liter of air per
tube. Reported droplet numbers produced via tidal breathing by healthy volunteers varies widely
within the literature, with concentrations ranging between 1 and several thousand, even between
different individuals.6,13,14
This makes a direct comparison difficult, however Edwards et al.
(PNAS, 2004)6 found that between 20% and 30% of the subjects in their study if expelled
droplets produced significantly more droplets than the rest of the study group. They defined this
group as “super-producers” (characterized as producing greater than 500 droplets per liter air).
Using this cut-off as a guide, a minimum of 46 bronchioles simultaneously collapsing and
expanding would be needed to reach the threshold of super-producing. This represents
approximately 10% of the total number of bronchioles in healthy adults.
Adapting the simulated cough system for tidal breathing resulted in zero droplets. This
was consistent with the results from the bifurcation system as an approximation for a zero degree
bifurcation angle. The bifurcation system results are shown in Figure 3.10 (adjusted to a per
exposed surface area basis) – droplet concentrations decreased as bifurcation angle decreased
and vice versa. For adults, the average bifurcation angle of the bronchi (as measured by
radiographs) is 30 +/- 6 degrees.15
Bioaerosol concentrations increased significantly for
bifurcation angles between 35 and 40 degrees, and approached the threshold for super-producing
(~18 droplets per liter per square centimeter) around 38 degrees. This suggests that critical air
velocity at the ALF interface is achieved for a bifurcation angle between 35 and 40 degrees.
Based on these results, a small portion of the population, much less than 20%, is expected to fall
into the super-producer category based on bifurcation angle alone.
44
Figure 3.10: Bifurcation system results: Droplets per liter air per square centimeter exposed ALF
Conclusion:
In vitro systems were developed to replicate conditions for bioaerosol formation and
measure the number of droplets formed according to the mechanisms discussed in chapter 2: a
lower airway system designed to mimic bronchiole expansion and film rupturing; a shear-driven
trachea model for both tidal and cough air flow patterns; and a shear-driven model of the first
bifurcation with variable bifurcation angle. The shear-driven cough model produced the highest
concentration of droplets, as expected, and was in reasonable agreement with data reported in the
literature.
Droplet formation was shown to depend on bifurcation angle for the shear driven model
at tidal air flow rates, with no droplets measured from the trachea model. This supports the first

45
hypothesis, which states that bioaerosol generation in the upper airways for tidal airflows occurs
during inhalation. This is actually consistent with the expelled droplet data produced by Johnson
and Morawska (2009)18
and Almstrand et al. (2010)19
which indicated that droplets were more
likely to be produced during inhalation (they concluded this meant the lower airway model was
therefore the real mechanism however these findings suggest that is not the only possibility).
This has ramifications for auto-infection as well: bioaerosol formation occurring in the upper
airways during inhalation can yield droplet deposition deeper in the lungs (especially for larger
droplets, greater than 10 microns in diameter). This can potentially move an existing or
developing infection deeper within the pulmonary system.
While both tidal air flow systems examined were capable of producing sufficient droplets
to meet the threshold for super-producing, the conditions under which either case was observed
is unlikely to occur by itself in enough of the population to adequately explain the results
reported by Edwards et al6. For instance, the results from the bifurcation system indicate that the
angle required to surpass the droplet concentration threshold for super-producing was 45
degrees, which is greater than two standard deviations above the mean bifurcation angle.
However, if the results from both the lower airway system and the upper airway system are taken
together, a number of combined solutions become plausible. Super-producers may have some
combination of both airway geometry (e.g. large bifurcation angle at the bronchi) and collapsing
bronchioles which results in their large bioaerosol numbers. Alternatively, it may be that some
super-producers are due to being outliers in terms of bifurcation angle, while others are due to
having a large number of collapsing bronchioles. The combined total from all of these
possibilities may then match the percentage of the population observed in Edwards’ study.

46
References:
1. Jaenicke, R. (1971) J. Aerosol Sci.3(2): 95-111
2. http://www.particlecounters.org/
3. King, M.;Brock, G.; Lundell, C. (1985) J. Appl. Physiol. 58: 1776-1782
4. Chang, H.; Weber, M.; King, M. (1988) J. Appl. Physiol. 65(3): 1203-9
5. Soland, V.; Brock, G.; King, M. (1987) J. Appl. Physiol. 63(2): 707-712
6. Edwards, D.; Man, J.; Brand, P.; Katsra, J.; Sommerer, K.; Stone, H.; Nardell, E.; Scheuch, G.; (2004)
Proc. Natl. Acad. Sci. 101(50): 17383-17388
7. Watanabe, W.; Thomas, M.; Clarke, R.; Klibanov, A.; Langer, R.; Katstra, J.; Fuller, G.; Griel, L.; Fiegel,
J.; Edwards, D. (2007) J. Colloid Interface. Sci. 307(1): 71-78
8. Gupta, J.; Lin, C.; Chen, Q. (2009) Indoor Air 19: 517-525
9. McCool, F. (2006) Chest 129(1): 485-535
10. Green, A. S. (2004) Journal of Biomechanics 37(5): 661-667
11. Notter, R. (2000) Lung Surfactants Ch. 6: 129-149, Ch. 8: 171-203
12. Pinazo, A.; Wen, X.; Liao, Y.; Prosser, A.; Franses, E. (2002) Langmuir 18: 8888-8896
13. Fabian, P.; Brain, J.; Houseman, E.; Milton, D. (2011) J Aerosol Med Pulm Drug Deliv. 24(3):137-47
14. Morawska, L.; Johnson, G.; Ristovski, Z.; Hargreaves, M.; Mengersen, K.; Corbett, S.; Chao, C.; Li, Y.;
Katoshevski, D. (2009) Aerosol Sci. 40: 256–269
15. Haskin, P.; Goodman, L. (1982) AJR 139: 879-882
16. Hsu, S.; Strohl, K.; Jamieson, A. (1994) J Appl. Physiol. 76(6): 2481-2489
17. Moriarty, J. A.; Grotberg, J. B. (1999) J. Fluid Mech. 387: 1-22
18. Johnson, G.; Morawska, L. (2009) J Aerosol Med Pulm Drug Deliv. 22:1-9.
19. Almstrand, A.; Bake, B.; Ljungstrom, E.; Larsson, P.; Bredberg, A.; Mirgorodskaya, E.; Olin, A. (2010) J
Appl Physiol.108:584-588
20. Haslbeck, K.; Schwarz, K.; Hohlfeld, J.; Seume, J.; Koch, W. (2010) J Aerosol Sci. 41:429-438
21. Duguid, J. (1946) British Medical Journal 265-268
22. Papineni, R.; Rosenthal, J. (1997) J Aerosol Med. 10(2):105-116
23. Wang, Y.; Liu, Y.; Sun, X.; Yu, S.; Gao, F. (2009) Acta Mech Sin 25: 737-746

47
Chapter 4: Mucus rheology, response to salt addition, and resultant droplet formation
Introduction:
In chapter 3, bench-top systems for droplet generation were created and compared to
existing literature for validation. As the overall focus remains on bioaerosols and methods to
prevent their formation, the next step involves investigating the second hypothesis of this thesis,
which states:
Mucus viscoelasticity will influence droplet formation by shear
forces, with increased stiffness yielding fewer droplets in total.
This hypothesis will be explored by examining the physical properties of the airway
lining fluid (ALF), the role those properties play in droplet formation, and the means of altering
those properties to reduce or prevent droplet generation. The properties of interest are the surface
tension at the air-ALF interface and the viscoelasticity of mucus. However, based on the
theoretical work performed by Moriarty and Grotberg16
as well as the experimental results
published by Edwards et al.17
and Watanabe et al.18
changes in surface tension, which tends to
act as a stabilizing force, do not significantly influence droplet formation (for the range of
physiologically relevant surface tension values, as found in the upper airways). Furthermore, as
Edwards et al. reported, changes in viscoelasticity appeared to reduce expelled droplet numbers.
Mucus viscoelasticity is therefore of primary interest.
Background:
Mucus is the primary component of ALF, and provides a protective coating which
maintains hydration and serves as a physical barrier to foreign material. It can be found in the
pulmonary system, eyes, gastrointestinal tract and other moist, sensitive areas of the body1. It is
composed primarily of water and mucin macromolecules and is characterized by its viscoelastic

48
response to shear forces, demonstrating thixotropic behavior. This response is a function of its
composition, and is specifically tuned to optimize the protective properties of mucus. Collection
of adequate quantities of healthy pulmonary mucus has generally proven a major challenge, as it
is produced in low volume, and covers the surface area of the pulmonary system. Typically, it
has been obtained through sputum induction, which involves inhalation of salt-containing
aerosols which alter its physical properties. Therefore substitutes for healthy pulmonary mucus
have been investigated, including animal-derived sources and human cell culture models.3
Comparisons have also been made to disease-state pulmonary mucus (e.g. chronic obstructive
pulmonary disorder (COPD), cystic fibrosis (CF), etc.).4,5
Numerous studies have been performed on the viscoelasticity of mucus (healthy when
possible, as well as diseased state) and mucus substitutes. In particular, Lutz et al. (1973)19
, King
et al. (1977)20
, Crowther et al. (1984)2and Lethem et al. (1990)
21 contributed to the development
of methods for measuring mucus viscoelasticity as well as characterizing its properties. Their
work formed the foundation for investigating the changes in disease-state mucus and mucus
functionality. For example, Lethem examined the properties of CF mucus and determined how
the observed changes in viscoelasticity were the result of variations in the glycoprotein network.
Crowther and Marriott demonstrated the viscoelastic sensitivity to ion concentration of pig
gastric mucus, in particular cations such as calcium (although they only looked at very small ion
concentrations).They saw an increase in viscoelasticity in response to calcium exposure2, and
posited a charge-shielding mechanism to explain it13
. This is of particular relevance to the
current work, as ions present a means of altering mucus viscoelasticity. However, the
concentration range will be expanded and applied to whichever mucus source is found to be most

suitable. Once that is accomplished, bioaerosol formation as a function of mucus viscoelasticity
can then be measured using the simulated cough machine developed in chapter 3.
Mucus
MUC5b and MUC5ac in pulmonary mucus). The fluid properties of mucus arises from the
interaction of these molecules: non
produce a macroscopic network in constant flux which can also elastically deform under stress,
storing potential energy in a mechanical “spring
can act as a pseudo
chains are also in motion relative to each other and this motion gives rise to viscous flow. Hence,
mucus exhibits behaviors similar to both viscous fluids and elastic solids.
suitable. Once that is accomplished, bioaerosol formation as a function of mucus viscoelasticity
can then be measured using the simulated cough machine developed in chapter 3.
an
As discussed in chapter 2, mucus is comprised of chain
MUC5b and MUC5ac in pulmonary mucus). The fluid properties of mucus arises from the
interaction of these molecules: non
produce a macroscopic network in constant flux which can also elastically deform under stress,
storing potential energy in a mechanical “spring
can act as a pseudo
chains are also in motion relative to each other and this motion gives rise to viscous flow. Hence,
mucus exhibits behaviors similar to both viscous fluids and elastic solids.
suitable. Once that is accomplished, bioaerosol formation as a function of mucus viscoelasticity
can then be measured using the simulated cough machine developed in chapter 3.
and viscoelasticity
As discussed in chapter 2, mucus is comprised of chain
MUC5b and MUC5ac in pulmonary mucus). The fluid properties of mucus arises from the
interaction of these molecules: non
produce a macroscopic network in constant flux which can also elastically deform under stress,
storing potential energy in a mechanical “spring
can act as a pseudo
chains are also in motion relative to each other and this motion gives rise to viscous flow. Hence,
mucus exhibits behaviors similar to both viscous fluids and elastic solids.
suitable. Once that is accomplished, bioaerosol formation as a function of mucus viscoelasticity
can then be measured using the simulated cough machine developed in chapter 3.
d viscoelasticity
As discussed in chapter 2, mucus is comprised of chain
MUC5b and MUC5ac in pulmonary mucus). The fluid properties of mucus arises from the
interaction of these molecules: non
produce a macroscopic network in constant flux which can also elastically deform under stress,
storing potential energy in a mechanical “spring
can act as a pseudo-
chains are also in motion relative to each other and this motion gives rise to viscous flow. Hence,
mucus exhibits behaviors similar to both viscous fluids and elastic solids.
suitable. Once that is accomplished, bioaerosol formation as a function of mucus viscoelasticity
can then be measured using the simulated cough machine developed in chapter 3.
d viscoelasticity
As discussed in chapter 2, mucus is comprised of chain
MUC5b and MUC5ac in pulmonary mucus). The fluid properties of mucus arises from the
interaction of these molecules: non
produce a macroscopic network in constant flux which can also elastically deform under stress,
storing potential energy in a mechanical “spring
-spring, so that e
chains are also in motion relative to each other and this motion gives rise to viscous flow. Hence,
mucus exhibits behaviors similar to both viscous fluids and elastic solids.
suitable. Once that is accomplished, bioaerosol formation as a function of mucus viscoelasticity
can then be measured using the simulated cough machine developed in chapter 3.
d viscoelasticity
As discussed in chapter 2, mucus is comprised of chain
MUC5b and MUC5ac in pulmonary mucus). The fluid properties of mucus arises from the
interaction of these molecules: non
produce a macroscopic network in constant flux which can also elastically deform under stress,
storing potential energy in a mechanical “spring
spring, so that e
chains are also in motion relative to each other and this motion gives rise to viscous flow. Hence,
mucus exhibits behaviors similar to both viscous fluids and elastic solids.
Figure 4.1: (a) O
chains (c) Stretched mucin chains
suitable. Once that is accomplished, bioaerosol formation as a function of mucus viscoelasticity
can then be measured using the simulated cough machine developed in chapter 3.
d viscoelasticity:
As discussed in chapter 2, mucus is comprised of chain
MUC5b and MUC5ac in pulmonary mucus). The fluid properties of mucus arises from the
interaction of these molecules: non
produce a macroscopic network in constant flux which can also elastically deform under stress,
storing potential energy in a mechanical “spring
spring, so that e
chains are also in motion relative to each other and this motion gives rise to viscous flow. Hence,
mucus exhibits behaviors similar to both viscous fluids and elastic solids.
Figure 4.1: (a) O
chains (c) Stretched mucin chains
suitable. Once that is accomplished, bioaerosol formation as a function of mucus viscoelasticity
can then be measured using the simulated cough machine developed in chapter 3.
:
As discussed in chapter 2, mucus is comprised of chain
MUC5b and MUC5ac in pulmonary mucus). The fluid properties of mucus arises from the
interaction of these molecules: non
produce a macroscopic network in constant flux which can also elastically deform under stress,
storing potential energy in a mechanical “spring
spring, so that e
chains are also in motion relative to each other and this motion gives rise to viscous flow. Hence,
mucus exhibits behaviors similar to both viscous fluids and elastic solids.
Figure 4.1: (a) O
chains (c) Stretched mucin chains
suitable. Once that is accomplished, bioaerosol formation as a function of mucus viscoelasticity
can then be measured using the simulated cough machine developed in chapter 3.
As discussed in chapter 2, mucus is comprised of chain
MUC5b and MUC5ac in pulmonary mucus). The fluid properties of mucus arises from the
interaction of these molecules: non-
produce a macroscopic network in constant flux which can also elastically deform under stress,
storing potential energy in a mechanical “spring
spring, so that e
chains are also in motion relative to each other and this motion gives rise to viscous flow. Hence,
mucus exhibits behaviors similar to both viscous fluids and elastic solids.
Figure 4.1: (a) Overall mucin network (b)
chains (c) Stretched mucin chains
suitable. Once that is accomplished, bioaerosol formation as a function of mucus viscoelasticity
can then be measured using the simulated cough machine developed in chapter 3.
As discussed in chapter 2, mucus is comprised of chain
MUC5b and MUC5ac in pulmonary mucus). The fluid properties of mucus arises from the
-covalent bonds, disulfide br
produce a macroscopic network in constant flux which can also elastically deform under stress,
storing potential energy in a mechanical “spring
spring, so that energy is stored across the entire network; however the mucin
chains are also in motion relative to each other and this motion gives rise to viscous flow. Hence,
mucus exhibits behaviors similar to both viscous fluids and elastic solids.
verall mucin network (b)
chains (c) Stretched mucin chains
suitable. Once that is accomplished, bioaerosol formation as a function of mucus viscoelasticity
can then be measured using the simulated cough machine developed in chapter 3.
As discussed in chapter 2, mucus is comprised of chain
MUC5b and MUC5ac in pulmonary mucus). The fluid properties of mucus arises from the
covalent bonds, disulfide br
produce a macroscopic network in constant flux which can also elastically deform under stress,
storing potential energy in a mechanical “spring
nergy is stored across the entire network; however the mucin
chains are also in motion relative to each other and this motion gives rise to viscous flow. Hence,
mucus exhibits behaviors similar to both viscous fluids and elastic solids.
verall mucin network (b)
chains (c) Stretched mucin chains
49
suitable. Once that is accomplished, bioaerosol formation as a function of mucus viscoelasticity
can then be measured using the simulated cough machine developed in chapter 3.
As discussed in chapter 2, mucus is comprised of chain
MUC5b and MUC5ac in pulmonary mucus). The fluid properties of mucus arises from the
covalent bonds, disulfide br
produce a macroscopic network in constant flux which can also elastically deform under stress,
storing potential energy in a mechanical “spring-like” fashion (Figure 4.1). Each mucin chain
nergy is stored across the entire network; however the mucin
chains are also in motion relative to each other and this motion gives rise to viscous flow. Hence,
mucus exhibits behaviors similar to both viscous fluids and elastic solids.
verall mucin network (b)
chains (c) Stretched mucin chains
49
suitable. Once that is accomplished, bioaerosol formation as a function of mucus viscoelasticity
can then be measured using the simulated cough machine developed in chapter 3.
As discussed in chapter 2, mucus is comprised of chain
MUC5b and MUC5ac in pulmonary mucus). The fluid properties of mucus arises from the
covalent bonds, disulfide br
produce a macroscopic network in constant flux which can also elastically deform under stress,
like” fashion (Figure 4.1). Each mucin chain
nergy is stored across the entire network; however the mucin
chains are also in motion relative to each other and this motion gives rise to viscous flow. Hence,
mucus exhibits behaviors similar to both viscous fluids and elastic solids.
verall mucin network (b)
chains (c) Stretched mucin chains (
suitable. Once that is accomplished, bioaerosol formation as a function of mucus viscoelasticity
can then be measured using the simulated cough machine developed in chapter 3.
As discussed in chapter 2, mucus is comprised of chain
MUC5b and MUC5ac in pulmonary mucus). The fluid properties of mucus arises from the
covalent bonds, disulfide br
produce a macroscopic network in constant flux which can also elastically deform under stress,
like” fashion (Figure 4.1). Each mucin chain
nergy is stored across the entire network; however the mucin
chains are also in motion relative to each other and this motion gives rise to viscous flow. Hence,
mucus exhibits behaviors similar to both viscous fluids and elastic solids.
verall mucin network (b)
(storing energy elastically
suitable. Once that is accomplished, bioaerosol formation as a function of mucus viscoelasticity
can then be measured using the simulated cough machine developed in chapter 3.
As discussed in chapter 2, mucus is comprised of chain
MUC5b and MUC5ac in pulmonary mucus). The fluid properties of mucus arises from the
covalent bonds, disulfide br
produce a macroscopic network in constant flux which can also elastically deform under stress,
like” fashion (Figure 4.1). Each mucin chain
nergy is stored across the entire network; however the mucin
chains are also in motion relative to each other and this motion gives rise to viscous flow. Hence,
mucus exhibits behaviors similar to both viscous fluids and elastic solids.
verall mucin network (b)
storing energy elastically
suitable. Once that is accomplished, bioaerosol formation as a function of mucus viscoelasticity
can then be measured using the simulated cough machine developed in chapter 3.
As discussed in chapter 2, mucus is comprised of chain
MUC5b and MUC5ac in pulmonary mucus). The fluid properties of mucus arises from the
covalent bonds, disulfide br
produce a macroscopic network in constant flux which can also elastically deform under stress,
like” fashion (Figure 4.1). Each mucin chain
nergy is stored across the entire network; however the mucin
chains are also in motion relative to each other and this motion gives rise to viscous flow. Hence,
mucus exhibits behaviors similar to both viscous fluids and elastic solids.
verall mucin network (b) “Relaxed”
storing energy elastically
suitable. Once that is accomplished, bioaerosol formation as a function of mucus viscoelasticity
can then be measured using the simulated cough machine developed in chapter 3.
As discussed in chapter 2, mucus is comprised of chain
MUC5b and MUC5ac in pulmonary mucus). The fluid properties of mucus arises from the
covalent bonds, disulfide br
produce a macroscopic network in constant flux which can also elastically deform under stress,
like” fashion (Figure 4.1). Each mucin chain
nergy is stored across the entire network; however the mucin
chains are also in motion relative to each other and this motion gives rise to viscous flow. Hence,
mucus exhibits behaviors similar to both viscous fluids and elastic solids.
“Relaxed”
storing energy elastically
suitable. Once that is accomplished, bioaerosol formation as a function of mucus viscoelasticity
can then be measured using the simulated cough machine developed in chapter 3.
As discussed in chapter 2, mucus is comprised of chain-
MUC5b and MUC5ac in pulmonary mucus). The fluid properties of mucus arises from the
covalent bonds, disulfide br
produce a macroscopic network in constant flux which can also elastically deform under stress,
like” fashion (Figure 4.1). Each mucin chain
nergy is stored across the entire network; however the mucin
chains are also in motion relative to each other and this motion gives rise to viscous flow. Hence,
mucus exhibits behaviors similar to both viscous fluids and elastic solids.
“Relaxed”
storing energy elastically
suitable. Once that is accomplished, bioaerosol formation as a function of mucus viscoelasticity
can then be measured using the simulated cough machine developed in chapter 3.
-like glycoproteins (specifically
MUC5b and MUC5ac in pulmonary mucus). The fluid properties of mucus arises from the
covalent bonds, disulfide bridges and simple entanglement
produce a macroscopic network in constant flux which can also elastically deform under stress,
like” fashion (Figure 4.1). Each mucin chain
nergy is stored across the entire network; however the mucin
chains are also in motion relative to each other and this motion gives rise to viscous flow. Hence,
mucus exhibits behaviors similar to both viscous fluids and elastic solids.
“Relaxed”
storing energy elastically
suitable. Once that is accomplished, bioaerosol formation as a function of mucus viscoelasticity
can then be measured using the simulated cough machine developed in chapter 3.
like glycoproteins (specifically
MUC5b and MUC5ac in pulmonary mucus). The fluid properties of mucus arises from the
idges and simple entanglement
produce a macroscopic network in constant flux which can also elastically deform under stress,
like” fashion (Figure 4.1). Each mucin chain
nergy is stored across the entire network; however the mucin
chains are also in motion relative to each other and this motion gives rise to viscous flow. Hence,
mucus exhibits behaviors similar to both viscous fluids and elastic solids.
mucin
storing energy elastically)
suitable. Once that is accomplished, bioaerosol formation as a function of mucus viscoelasticity
can then be measured using the simulated cough machine developed in chapter 3.
like glycoproteins (specifically
MUC5b and MUC5ac in pulmonary mucus). The fluid properties of mucus arises from the
idges and simple entanglement
produce a macroscopic network in constant flux which can also elastically deform under stress,
like” fashion (Figure 4.1). Each mucin chain
nergy is stored across the entire network; however the mucin
chains are also in motion relative to each other and this motion gives rise to viscous flow. Hence,
mucus exhibits behaviors similar to both viscous fluids and elastic solids.
)
suitable. Once that is accomplished, bioaerosol formation as a function of mucus viscoelasticity
can then be measured using the simulated cough machine developed in chapter 3.
like glycoproteins (specifically
MUC5b and MUC5ac in pulmonary mucus). The fluid properties of mucus arises from the
idges and simple entanglement
produce a macroscopic network in constant flux which can also elastically deform under stress,
like” fashion (Figure 4.1). Each mucin chain
nergy is stored across the entire network; however the mucin
chains are also in motion relative to each other and this motion gives rise to viscous flow. Hence,
mucus exhibits behaviors similar to both viscous fluids and elastic solids.
suitable. Once that is accomplished, bioaerosol formation as a function of mucus viscoelasticity
can then be measured using the simulated cough machine developed in chapter 3.
like glycoproteins (specifically
MUC5b and MUC5ac in pulmonary mucus). The fluid properties of mucus arises from the
idges and simple entanglement
produce a macroscopic network in constant flux which can also elastically deform under stress,
like” fashion (Figure 4.1). Each mucin chain
nergy is stored across the entire network; however the mucin
chains are also in motion relative to each other and this motion gives rise to viscous flow. Hence,
suitable. Once that is accomplished, bioaerosol formation as a function of mucus viscoelasticity
like glycoproteins (specifically
idges and simple entanglement
produce a macroscopic network in constant flux which can also elastically deform under stress,
nergy is stored across the entire network; however the mucin
chains are also in motion relative to each other and this motion gives rise to viscous flow. Hence,
suitable. Once that is accomplished, bioaerosol formation as a function of mucus viscoelasticity
nergy is stored across the entire network; however the mucin
chains are also in motion relative to each other and this motion gives rise to viscous flow. Hence,
nergy is stored across the entire network; however the mucin
chains are also in motion relative to each other and this motion gives rise to viscous flow. Hence,
50
When a shear stress is applied to the mucin network, the mucin chains are stretched,
creating strain. The mucins may also slide along each other, dis-entangling and flowing in the
direction of the stress, reducing tension in the system. Over a longer period of time, the inter-
mucin bonds may break (and reform), which further reduces overall strain. If the applied stress is
removed, the system can relax; however the final state will differ from the pre-stress state
depending on the relative amounts of elastic deformation and flow, as well as the overall time-
scale. In other words, the applied stress will be correlated with both the strain (as in an elastic
solid) and the rate of strain (as in a viscous, or Newtonian, fluid). The study of such complex
fluid flow is called rheology. Rheometers are used to measure the viscoelastic properties of
materials. Samples are loaded into a particular geometry which is attached to the rheometer:
there are many types of geometries, including plate/plate, cone and plate, and couette, each of
which consists of at least two components and which is designed to apply shear force to the
sample. An example of a cone and plate geometry is shown in Figure 4.2.
Figure 4.2: Cone and plate geometry

51
As in Figure 4.2, sample is loaded between the cone and plate, and care is taken to insure
that no air bubbles or gaps are present, nor that any excess material is outside the diameter of the
cone. The cone is rotated with respect to the plate and the applied stress (the torque on the
spindle attached to the cone over the interfacial area) is measured along with the rotational
displacement. Strain is calculated as the displacement distance divided by the sample height: one
advantage of the cone and plate geometry is that the sample is subjected to uniform strain (for a
fixed displacement angle, the displacement length is a function of radius, and the sample height
is designed to be a function of radius as well, resulting in uniform strain).
The rheometer can be operated in two basic modes: a rotational or direct shear mode in
which the cone is rotated at a set speed or to a set displacement; and an oscillatory mode, in
which the cone oscillates back and forth with a particular frequency. The former is used to
generate information about how the sample responds to fixed stress, strain, or shear rate – for
example, the shear-thinning behavior of mucus is observed with this method – but it may be
destructive to the sample’s networked structure. The latter is used to ascertain the importance of
time-scales and measure viscoelastic properties without permanently altering the network
structure. During an oscillatory experiment, a sinusoidal stress or strain is applied to the sample
and the resulting strain/stress is measured (an example is shown in Figure 4.3). The phase lag
between the stress and strain curves is dependent on the sample type: a Newtonian fluid would
be 90 degrees out of phase, whereas an ideal, elastic solid would be perfectly in-phase. The
phase lag for complex (non-Newtonian) fluids will fall somewhere between 0 and 90 degrees.
The viscoelasticity of the sample can then be quantified as a complex number, defined as the
complex (dynamic) modulus, G* (equation III), with phase angle δ.

Figure 4.3: Example of sinusoidal applied stress and strain (at frequency Figure 4.3: Example of sinusoidal applied stress and strain (at frequency Figure 4.3: Example of sinusoidal applied stress and strain (at frequency Figure 4.3: Example of sinusoidal applied stress and strain (at frequency Figure 4.3: Example of sinusoidal applied stress and strain (at frequency Figure 4.3: Example of sinusoidal applied stress and strain (at frequency Figure 4.3: Example of sinusoidal applied stress and strain (at frequency Figure 4.3: Example of sinusoidal applied stress and strain (at frequency Figure 4.3: Example of sinusoidal applied stress and strain (at frequency Figure 4.3: Example of sinusoidal applied stress and strain (at frequency Figure 4.3: Example of sinusoidal applied stress and strain (at frequency Figure 4.3: Example of sinusoidal applied stress and strain (at frequency Figure 4.3: Example of sinusoidal applied stress and strain (at frequency Figure 4.3: Example of sinusoidal applied stress and strain (at frequency Figure 4.3: Example of sinusoidal applied stress and strain (at frequency Figure 4.3: Example of sinusoidal applied stress and strain (at frequency Figure 4.3: Example of sinusoidal applied stress and strain (at frequency Figure 4.3: Example of sinusoidal applied stress and strain (at frequency Figure 4.3: Example of sinusoidal applied stress and strain (at frequency Figure 4.3: Example of sinusoidal applied stress and strain (at frequency Figure 4.3: Example of sinusoidal applied stress and strain (at frequency Figure 4.3: Example of sinusoidal applied stress and strain (at frequency Figure 4.3: Example of sinusoidal applied stress and strain (at frequency Figure 4.3: Example of sinusoidal applied stress and strain (at frequency Figure 4.3: Example of sinusoidal applied stress and strain (at frequency Figure 4.3: Example of sinusoidal applied stress and strain (at frequency Figure 4.3: Example of sinusoidal applied stress and strain (at frequency Figure 4.3: Example of sinusoidal applied stress and strain (at frequency Figure 4.3: Example of sinusoidal applied stress and strain (at frequency Figure 4.3: Example of sinusoidal applied stress and strain (at frequency Figure 4.3: Example of sinusoidal applied stress and strain (at frequency Figure 4.3: Example of sinusoidal applied stress and strain (at frequency Figure 4.3: Example of sinusoidal applied stress and strain (at frequency Figure 4.3: Example of sinusoidal applied stress and strain (at frequency
52
Figure 4.3: Example of sinusoidal applied stress and strain (at frequency
52
Figure 4.3: Example of sinusoidal applied stress and strain (at frequency
52
Figure 4.3: Example of sinusoidal applied stress and strain (at frequency
Figure 4.3: Example of sinusoidal applied stress and strain (at frequency
Figure 4.3: Example of sinusoidal applied stress and strain (at frequency Figure 4.3: Example of sinusoidal applied stress and strain (at frequency Figure 4.3: Example of sinusoidal applied stress and strain (at frequency Figure 4.3: Example of sinusoidal applied stress and strain (at frequency Figure 4.3: Example of sinusoidal applied stress and strain (at frequency
Figure 4.3: Example of sinusoidal applied stress and strain (at frequency
Figure 4.3: Example of sinusoidal applied stress and strain (at frequency
Figure 4.3: Example of sinusoidal applied stress and strain (at frequency Figure 4.3: Example of sinusoidal applied stress and strain (at frequency
Figure 4.3: Example of sinusoidal applied stress and strain (at frequency
Figure 4.3: Example of sinusoidal applied stress and strain (at frequency Figure 4.3: Example of sinusoidal applied stress and strain (at frequency Figure 4.3: Example of sinusoidal applied stress and strain (at frequency Figure 4.3: Example of sinusoidal applied stress and strain (at frequency Figure 4.3: Example of sinusoidal applied stress and strain (at frequency Figure 4.3: Example of sinusoidal applied stress and strain (at frequency Figure 4.3: Example of sinusoidal applied stress and strain (at frequency
Figure 4.3: Example of sinusoidal applied stress and strain (at frequency
Figure 4.3: Example of sinusoidal applied stress and strain (at frequency Figure 4.3: Example of sinusoidal applied stress and strain (at frequency ωω) with phase lag) with phase lag
) with phase lag
) with phase lag) with phase lag) with phase lag) with phase lag) with phase lag
(
(
(
(
(
) with phase lag
(III
(IV
(V
(VI
(I
(II
) with phase lag
III
IV
V
VI
I)
II)
) with phase lag
III)
IV)
V)
VI)
)
)
) with phase lag
)
)
)
)
) with phase lag
) with phase lag

Where:
(equation IV) which is a measure of the elastic response of the sample; and the loss modulus, G”
(equation V) whi
terms results in equation (VI). The magnitude of G
system (i.e. its resistance to deformation), and the ratio of G” to G’ (equation
amount of energy dissipated by the material to that stored when deformed.
Mucus sources:
through sputum induction via hypertonic salts
on mucus exposure to cations
were selected from the following categories: mimetic gels (designed to mimic mucus); animal
derived muci
The components of equation (III) can be further defined as the storage modulus, G’
(equation IV) which is a measure of the elastic response of the sample; and the loss modulus, G”
(equation V) whi
terms results in equation (VI). The magnitude of G
system (i.e. its resistance to deformation), and the ratio of G” to G’ (equation
amount of energy dissipated by the material to that stored when deformed.
Mucus sources:
Due to the difficulty in acquiring healthy pulmonary mucus, which is typically obtained
through sputum induction via hypertonic salts
on mucus exposure to cations
were selected from the following categories: mimetic gels (designed to mimic mucus); animal
derived mucins; and human s
The components of equation (III) can be further defined as the storage modulus, G’
(equation IV) which is a measure of the elastic response of the sample; and the loss modulus, G”
(equation V) whi
terms results in equation (VI). The magnitude of G
system (i.e. its resistance to deformation), and the ratio of G” to G’ (equation
amount of energy dissipated by the material to that stored when deformed.
Mucus sources:
Due to the difficulty in acquiring healthy pulmonary mucus, which is typically obtained
through sputum induction via hypertonic salts
on mucus exposure to cations
were selected from the following categories: mimetic gels (designed to mimic mucus); animal
ns; and human s
σ
ε
δ
ω
t = Time
G* = Co
G’ = Storage Modulus
G” = Loss Modulus
The components of equation (III) can be further defined as the storage modulus, G’
(equation IV) which is a measure of the elastic response of the sample; and the loss modulus, G”
(equation V) whi
terms results in equation (VI). The magnitude of G
system (i.e. its resistance to deformation), and the ratio of G” to G’ (equation
amount of energy dissipated by the material to that stored when deformed.
Mucus sources:
Due to the difficulty in acquiring healthy pulmonary mucus, which is typically obtained
through sputum induction via hypertonic salts
on mucus exposure to cations
were selected from the following categories: mimetic gels (designed to mimic mucus); animal
ns; and human s
σ
ε = Strain
δ = Phase Lag
ω
t = Time
G* = Co
G’ = Storage Modulus
G” = Loss Modulus
The components of equation (III) can be further defined as the storage modulus, G’
(equation IV) which is a measure of the elastic response of the sample; and the loss modulus, G”
(equation V) whi
terms results in equation (VI). The magnitude of G
system (i.e. its resistance to deformation), and the ratio of G” to G’ (equation
amount of energy dissipated by the material to that stored when deformed.
Mucus sources:
Due to the difficulty in acquiring healthy pulmonary mucus, which is typically obtained
through sputum induction via hypertonic salts
on mucus exposure to cations
were selected from the following categories: mimetic gels (designed to mimic mucus); animal
ns; and human s
= Stress
= Strain
= Phase Lag
= Frequency
t = Time
G* = Co
G’ = Storage Modulus
G” = Loss Modulus
The components of equation (III) can be further defined as the storage modulus, G’
(equation IV) which is a measure of the elastic response of the sample; and the loss modulus, G”
(equation V) which is a measure of its viscous response. Rewriting equation (III) with these
terms results in equation (VI). The magnitude of G
system (i.e. its resistance to deformation), and the ratio of G” to G’ (equation
amount of energy dissipated by the material to that stored when deformed.
Due to the difficulty in acquiring healthy pulmonary mucus, which is typically obtained
through sputum induction via hypertonic salts
on mucus exposure to cations
were selected from the following categories: mimetic gels (designed to mimic mucus); animal
ns; and human s
= Stress
= Strain
= Phase Lag
= Frequency
t = Time
G* = Co
G’ = Storage Modulus
G” = Loss Modulus
The components of equation (III) can be further defined as the storage modulus, G’
(equation IV) which is a measure of the elastic response of the sample; and the loss modulus, G”
ch is a measure of its viscous response. Rewriting equation (III) with these
terms results in equation (VI). The magnitude of G
system (i.e. its resistance to deformation), and the ratio of G” to G’ (equation
amount of energy dissipated by the material to that stored when deformed.
Due to the difficulty in acquiring healthy pulmonary mucus, which is typically obtained
through sputum induction via hypertonic salts
on mucus exposure to cations
were selected from the following categories: mimetic gels (designed to mimic mucus); animal
ns; and human s
= Stress
= Strain
= Phase Lag
= Frequency
t = Time
G* = Complex Modulus
G’ = Storage Modulus
G” = Loss Modulus
The components of equation (III) can be further defined as the storage modulus, G’
(equation IV) which is a measure of the elastic response of the sample; and the loss modulus, G”
ch is a measure of its viscous response. Rewriting equation (III) with these
terms results in equation (VI). The magnitude of G
system (i.e. its resistance to deformation), and the ratio of G” to G’ (equation
amount of energy dissipated by the material to that stored when deformed.
Due to the difficulty in acquiring healthy pulmonary mucus, which is typically obtained
through sputum induction via hypertonic salts
on mucus exposure to cations
were selected from the following categories: mimetic gels (designed to mimic mucus); animal
ns; and human s
= Stress
= Strain
= Phase Lag
= Frequency
mplex Modulus
G’ = Storage Modulus
G” = Loss Modulus
The components of equation (III) can be further defined as the storage modulus, G’
(equation IV) which is a measure of the elastic response of the sample; and the loss modulus, G”
ch is a measure of its viscous response. Rewriting equation (III) with these
terms results in equation (VI). The magnitude of G
system (i.e. its resistance to deformation), and the ratio of G” to G’ (equation
amount of energy dissipated by the material to that stored when deformed.
Due to the difficulty in acquiring healthy pulmonary mucus, which is typically obtained
through sputum induction via hypertonic salts
on mucus exposure to cations
were selected from the following categories: mimetic gels (designed to mimic mucus); animal
ns; and human s
= Phase Lag
= Frequency
mplex Modulus
G’ = Storage Modulus
G” = Loss Modulus
The components of equation (III) can be further defined as the storage modulus, G’
(equation IV) which is a measure of the elastic response of the sample; and the loss modulus, G”
ch is a measure of its viscous response. Rewriting equation (III) with these
terms results in equation (VI). The magnitude of G
system (i.e. its resistance to deformation), and the ratio of G” to G’ (equation
amount of energy dissipated by the material to that stored when deformed.
Due to the difficulty in acquiring healthy pulmonary mucus, which is typically obtained
through sputum induction via hypertonic salts
on mucus exposure to cations
were selected from the following categories: mimetic gels (designed to mimic mucus); animal
ns; and human sources. Table 4.1
= Frequency
mplex Modulus
G’ = Storage Modulus
G” = Loss Modulus
The components of equation (III) can be further defined as the storage modulus, G’
(equation IV) which is a measure of the elastic response of the sample; and the loss modulus, G”
ch is a measure of its viscous response. Rewriting equation (III) with these
terms results in equation (VI). The magnitude of G
system (i.e. its resistance to deformation), and the ratio of G” to G’ (equation
amount of energy dissipated by the material to that stored when deformed.
Due to the difficulty in acquiring healthy pulmonary mucus, which is typically obtained
through sputum induction via hypertonic salts
on mucus exposure to cations –
were selected from the following categories: mimetic gels (designed to mimic mucus); animal
ources. Table 4.1
mplex Modulus
G’ = Storage Modulus
G” = Loss Modulus
The components of equation (III) can be further defined as the storage modulus, G’
(equation IV) which is a measure of the elastic response of the sample; and the loss modulus, G”
ch is a measure of its viscous response. Rewriting equation (III) with these
terms results in equation (VI). The magnitude of G
system (i.e. its resistance to deformation), and the ratio of G” to G’ (equation
amount of energy dissipated by the material to that stored when deformed.
Due to the difficulty in acquiring healthy pulmonary mucus, which is typically obtained
through sputum induction via hypertonic salts
–
were selected from the following categories: mimetic gels (designed to mimic mucus); animal
ources. Table 4.1
mplex Modulus
G’ = Storage Modulus
G” = Loss Modulus
The components of equation (III) can be further defined as the storage modulus, G’
(equation IV) which is a measure of the elastic response of the sample; and the loss modulus, G”
ch is a measure of its viscous response. Rewriting equation (III) with these
terms results in equation (VI). The magnitude of G
system (i.e. its resistance to deformation), and the ratio of G” to G’ (equation
amount of energy dissipated by the material to that stored when deformed.
Due to the difficulty in acquiring healthy pulmonary mucus, which is typically obtained
through sputum induction via hypertonic salts
alternative mucus sources were investigated. Alternative sources
were selected from the following categories: mimetic gels (designed to mimic mucus); animal
ources. Table 4.1
mplex Modulus
G’ = Storage Modulus
The components of equation (III) can be further defined as the storage modulus, G’
(equation IV) which is a measure of the elastic response of the sample; and the loss modulus, G”
ch is a measure of its viscous response. Rewriting equation (III) with these
terms results in equation (VI). The magnitude of G
system (i.e. its resistance to deformation), and the ratio of G” to G’ (equation
amount of energy dissipated by the material to that stored when deformed.
Due to the difficulty in acquiring healthy pulmonary mucus, which is typically obtained
through sputum induction via hypertonic salts
alternative mucus sources were investigated. Alternative sources
were selected from the following categories: mimetic gels (designed to mimic mucus); animal
ources. Table 4.1
mplex Modulus
The components of equation (III) can be further defined as the storage modulus, G’
(equation IV) which is a measure of the elastic response of the sample; and the loss modulus, G”
ch is a measure of its viscous response. Rewriting equation (III) with these
terms results in equation (VI). The magnitude of G
system (i.e. its resistance to deformation), and the ratio of G” to G’ (equation
amount of energy dissipated by the material to that stored when deformed.
Due to the difficulty in acquiring healthy pulmonary mucus, which is typically obtained
through sputum induction via hypertonic salts
alternative mucus sources were investigated. Alternative sources
were selected from the following categories: mimetic gels (designed to mimic mucus); animal
ources. Table 4.1
The components of equation (III) can be further defined as the storage modulus, G’
(equation IV) which is a measure of the elastic response of the sample; and the loss modulus, G”
ch is a measure of its viscous response. Rewriting equation (III) with these
terms results in equation (VI). The magnitude of G
system (i.e. its resistance to deformation), and the ratio of G” to G’ (equation
amount of energy dissipated by the material to that stored when deformed.
Due to the difficulty in acquiring healthy pulmonary mucus, which is typically obtained
through sputum induction via hypertonic salts6
alternative mucus sources were investigated. Alternative sources
were selected from the following categories: mimetic gels (designed to mimic mucus); animal
ources. Table 4.1
The components of equation (III) can be further defined as the storage modulus, G’
(equation IV) which is a measure of the elastic response of the sample; and the loss modulus, G”
ch is a measure of its viscous response. Rewriting equation (III) with these
terms results in equation (VI). The magnitude of G
system (i.e. its resistance to deformation), and the ratio of G” to G’ (equation
amount of energy dissipated by the material to that stored when deformed.
Due to the difficulty in acquiring healthy pulmonary mucus, which is typically obtained
6
alternative mucus sources were investigated. Alternative sources
were selected from the following categories: mimetic gels (designed to mimic mucus); animal
ources. Table 4.1
53
The components of equation (III) can be further defined as the storage modulus, G’
(equation IV) which is a measure of the elastic response of the sample; and the loss modulus, G”
ch is a measure of its viscous response. Rewriting equation (III) with these
terms results in equation (VI). The magnitude of G
system (i.e. its resistance to deformation), and the ratio of G” to G’ (equation
amount of energy dissipated by the material to that stored when deformed.
Due to the difficulty in acquiring healthy pulmonary mucus, which is typically obtained
–
alternative mucus sources were investigated. Alternative sources
were selected from the following categories: mimetic gels (designed to mimic mucus); animal
lists the viscoelastic properties of healthy human
53
The components of equation (III) can be further defined as the storage modulus, G’
(equation IV) which is a measure of the elastic response of the sample; and the loss modulus, G”
ch is a measure of its viscous response. Rewriting equation (III) with these
terms results in equation (VI). The magnitude of G
system (i.e. its resistance to deformation), and the ratio of G” to G’ (equation
amount of energy dissipated by the material to that stored when deformed.
Due to the difficulty in acquiring healthy pulmonary mucus, which is typically obtained
a proces
alternative mucus sources were investigated. Alternative sources
were selected from the following categories: mimetic gels (designed to mimic mucus); animal
lists the viscoelastic properties of healthy human
The components of equation (III) can be further defined as the storage modulus, G’
(equation IV) which is a measure of the elastic response of the sample; and the loss modulus, G”
ch is a measure of its viscous response. Rewriting equation (III) with these
terms results in equation (VI). The magnitude of G*
system (i.e. its resistance to deformation), and the ratio of G” to G’ (equation
amount of energy dissipated by the material to that stored when deformed.
Due to the difficulty in acquiring healthy pulmonary mucus, which is typically obtained
a proces
alternative mucus sources were investigated. Alternative sources
were selected from the following categories: mimetic gels (designed to mimic mucus); animal
lists the viscoelastic properties of healthy human
The components of equation (III) can be further defined as the storage modulus, G’
(equation IV) which is a measure of the elastic response of the sample; and the loss modulus, G”
ch is a measure of its viscous response. Rewriting equation (III) with these
*
system (i.e. its resistance to deformation), and the ratio of G” to G’ (equation
amount of energy dissipated by the material to that stored when deformed.
Due to the difficulty in acquiring healthy pulmonary mucus, which is typically obtained
a proces
alternative mucus sources were investigated. Alternative sources
were selected from the following categories: mimetic gels (designed to mimic mucus); animal
lists the viscoelastic properties of healthy human
The components of equation (III) can be further defined as the storage modulus, G’
(equation IV) which is a measure of the elastic response of the sample; and the loss modulus, G”
ch is a measure of its viscous response. Rewriting equation (III) with these
is a measure of the overall “stiffness” of the
system (i.e. its resistance to deformation), and the ratio of G” to G’ (equation
amount of energy dissipated by the material to that stored when deformed.
Due to the difficulty in acquiring healthy pulmonary mucus, which is typically obtained
a process which would invalidate further testing
alternative mucus sources were investigated. Alternative sources
were selected from the following categories: mimetic gels (designed to mimic mucus); animal
lists the viscoelastic properties of healthy human
The components of equation (III) can be further defined as the storage modulus, G’
(equation IV) which is a measure of the elastic response of the sample; and the loss modulus, G”
ch is a measure of its viscous response. Rewriting equation (III) with these
is a measure of the overall “stiffness” of the
system (i.e. its resistance to deformation), and the ratio of G” to G’ (equation
amount of energy dissipated by the material to that stored when deformed.
Due to the difficulty in acquiring healthy pulmonary mucus, which is typically obtained
s which would invalidate further testing
alternative mucus sources were investigated. Alternative sources
were selected from the following categories: mimetic gels (designed to mimic mucus); animal
lists the viscoelastic properties of healthy human
The components of equation (III) can be further defined as the storage modulus, G’
(equation IV) which is a measure of the elastic response of the sample; and the loss modulus, G”
ch is a measure of its viscous response. Rewriting equation (III) with these
is a measure of the overall “stiffness” of the
system (i.e. its resistance to deformation), and the ratio of G” to G’ (equation
Due to the difficulty in acquiring healthy pulmonary mucus, which is typically obtained
s which would invalidate further testing
alternative mucus sources were investigated. Alternative sources
were selected from the following categories: mimetic gels (designed to mimic mucus); animal
lists the viscoelastic properties of healthy human
The components of equation (III) can be further defined as the storage modulus, G’
(equation IV) which is a measure of the elastic response of the sample; and the loss modulus, G”
ch is a measure of its viscous response. Rewriting equation (III) with these
is a measure of the overall “stiffness” of the
system (i.e. its resistance to deformation), and the ratio of G” to G’ (equation VII) quantifies the
Due to the difficulty in acquiring healthy pulmonary mucus, which is typically obtained
s which would invalidate further testing
alternative mucus sources were investigated. Alternative sources
were selected from the following categories: mimetic gels (designed to mimic mucus); animal
lists the viscoelastic properties of healthy human
The components of equation (III) can be further defined as the storage modulus, G’
(equation IV) which is a measure of the elastic response of the sample; and the loss modulus, G”
ch is a measure of its viscous response. Rewriting equation (III) with these
is a measure of the overall “stiffness” of the
VII) quantifies the
Due to the difficulty in acquiring healthy pulmonary mucus, which is typically obtained
s which would invalidate further testing
alternative mucus sources were investigated. Alternative sources
were selected from the following categories: mimetic gels (designed to mimic mucus); animal
lists the viscoelastic properties of healthy human
(
The components of equation (III) can be further defined as the storage modulus, G’
(equation IV) which is a measure of the elastic response of the sample; and the loss modulus, G”
ch is a measure of its viscous response. Rewriting equation (III) with these
is a measure of the overall “stiffness” of the
VII) quantifies the
Due to the difficulty in acquiring healthy pulmonary mucus, which is typically obtained
s which would invalidate further testing
alternative mucus sources were investigated. Alternative sources
were selected from the following categories: mimetic gels (designed to mimic mucus); animal
lists the viscoelastic properties of healthy human
(VII
The components of equation (III) can be further defined as the storage modulus, G’
(equation IV) which is a measure of the elastic response of the sample; and the loss modulus, G”
ch is a measure of its viscous response. Rewriting equation (III) with these
is a measure of the overall “stiffness” of the
VII) quantifies the
Due to the difficulty in acquiring healthy pulmonary mucus, which is typically obtained
s which would invalidate further testing
alternative mucus sources were investigated. Alternative sources
were selected from the following categories: mimetic gels (designed to mimic mucus); animal
lists the viscoelastic properties of healthy human
VII
The components of equation (III) can be further defined as the storage modulus, G’
(equation IV) which is a measure of the elastic response of the sample; and the loss modulus, G”
ch is a measure of its viscous response. Rewriting equation (III) with these
is a measure of the overall “stiffness” of the
VII) quantifies the
Due to the difficulty in acquiring healthy pulmonary mucus, which is typically obtained
s which would invalidate further testing
alternative mucus sources were investigated. Alternative sources
were selected from the following categories: mimetic gels (designed to mimic mucus); animal
lists the viscoelastic properties of healthy human
VII)
The components of equation (III) can be further defined as the storage modulus, G’
(equation IV) which is a measure of the elastic response of the sample; and the loss modulus, G”
ch is a measure of its viscous response. Rewriting equation (III) with these
is a measure of the overall “stiffness” of the
VII) quantifies the
Due to the difficulty in acquiring healthy pulmonary mucus, which is typically obtained
s which would invalidate further testing
alternative mucus sources were investigated. Alternative sources
were selected from the following categories: mimetic gels (designed to mimic mucus); animal
lists the viscoelastic properties of healthy human
)
The components of equation (III) can be further defined as the storage modulus, G’
(equation IV) which is a measure of the elastic response of the sample; and the loss modulus, G”
ch is a measure of its viscous response. Rewriting equation (III) with these
is a measure of the overall “stiffness” of the
VII) quantifies the
Due to the difficulty in acquiring healthy pulmonary mucus, which is typically obtained
s which would invalidate further testing
alternative mucus sources were investigated. Alternative sources
were selected from the following categories: mimetic gels (designed to mimic mucus); animal
lists the viscoelastic properties of healthy human
(equation IV) which is a measure of the elastic response of the sample; and the loss modulus, G”
is a measure of the overall “stiffness” of the
VII) quantifies the
Due to the difficulty in acquiring healthy pulmonary mucus, which is typically obtained
s which would invalidate further testing
alternative mucus sources were investigated. Alternative sources
were selected from the following categories: mimetic gels (designed to mimic mucus); animal-
lists the viscoelastic properties of healthy human
(equation IV) which is a measure of the elastic response of the sample; and the loss modulus, G”
is a measure of the overall “stiffness” of the
VII) quantifies the
Due to the difficulty in acquiring healthy pulmonary mucus, which is typically obtained
s which would invalidate further testing
alternative mucus sources were investigated. Alternative sources
lists the viscoelastic properties of healthy human
(equation IV) which is a measure of the elastic response of the sample; and the loss modulus, G”
is a measure of the overall “stiffness” of the
VII) quantifies the
s which would invalidate further testing
alternative mucus sources were investigated. Alternative sources
lists the viscoelastic properties of healthy human
(equation IV) which is a measure of the elastic response of the sample; and the loss modulus, G”
s which would invalidate further testing
alternative mucus sources were investigated. Alternative sources
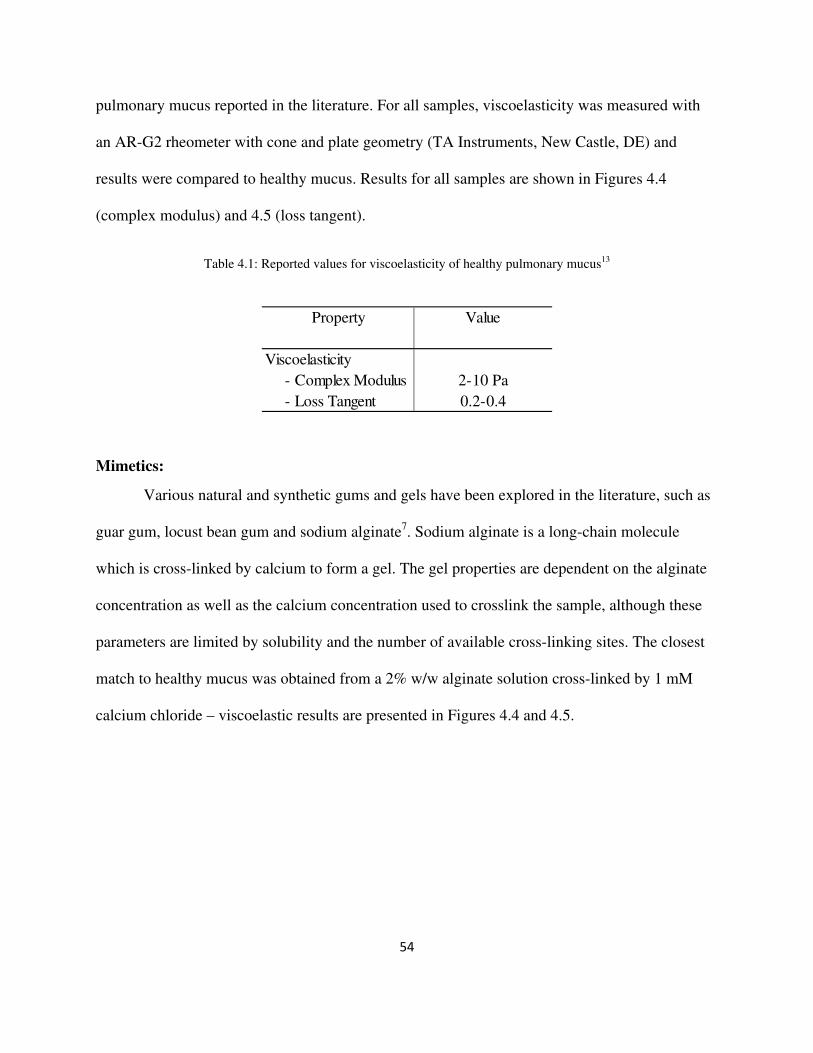
54
pulmonary mucus reported in the literature. For all samples, viscoelasticity was measured with
an AR-G2 rheometer with cone and plate geometry (TA Instruments, New Castle, DE) and
results were compared to healthy mucus. Results for all samples are shown in Figures 4.4
(complex modulus) and 4.5 (loss tangent).
Table 4.1: Reported values for viscoelasticity of healthy pulmonary mucus13
Mimetics:
Various natural and synthetic gums and gels have been explored in the literature, such as
guar gum, locust bean gum and sodium alginate7. Sodium alginate is a long-chain molecule
which is cross-linked by calcium to form a gel. The gel properties are dependent on the alginate
concentration as well as the calcium concentration used to crosslink the sample, although these
parameters are limited by solubility and the number of available cross-linking sites. The closest
match to healthy mucus was obtained from a 2% w/w alginate solution cross-linked by 1 mM
calcium chloride – viscoelastic results are presented in Figures 4.4 and 4.5.
Property Value
Viscoelasticity
- Complex Modulus 2-10 Pa
- Loss Tangent 0.2-0.4
55
Figure 4.4: Complex modulus (magnitude) for alternative mucus sources
Figure 4.5: Loss tangent values for alternative mucus samples

Figure 4.6
viscoelastic “states” (i.e. matching viscoelastic properties under specific conditions). Their
response to cha
agents and other compounds will not match the response of mucus to those same changes.
Animal
gastric and cervical mucins extracted from pigs or cows. Similar for humans, pulmonary sources
are low volume, and therefore rarely considered. Purified bovine submaxillary mucin
(MP Bio, Solon, OH) are commercially available as lyophilized powders, as are porcine gastric
mucins (PGM) (Sigma Aldrich, St. Lois, MO), although the specific procedures used for
processing the samples were not released by the manufacturers. Addit
mucus was collected from freshly harvested pig stomachs and purified following procedures
outlined in reference 8. Results are shown in Figures 4.
healthy human mucus, and the commercially ava
Ultimately, due to different chemical
Figure 4.6
viscoelastic “states” (i.e. matching viscoelastic properties under specific conditions). Their
response to cha
agents and other compounds will not match the response of mucus to those same changes.
Animal-
Many
gastric and cervical mucins extracted from pigs or cows. Similar for humans, pulmonary sources
are low volume, and therefore rarely considered. Purified bovine submaxillary mucin
(MP Bio, Solon, OH) are commercially available as lyophilized powders, as are porcine gastric
mucins (PGM) (Sigma Aldrich, St. Lois, MO), although the specific procedures used for
processing the samples were not released by the manufacturers. Addit
mucus was collected from freshly harvested pig stomachs and purified following procedures
outlined in reference 8. Results are shown in Figures 4.
healthy human mucus, and the commercially ava
Ultimately, due to different chemical
Figure 4.6
viscoelastic “states” (i.e. matching viscoelastic properties under specific conditions). Their
response to cha
agents and other compounds will not match the response of mucus to those same changes.
-derived
Many
gastric and cervical mucins extracted from pigs or cows. Similar for humans, pulmonary sources
are low volume, and therefore rarely considered. Purified bovine submaxillary mucin
(MP Bio, Solon, OH) are commercially available as lyophilized powders, as are porcine gastric
mucins (PGM) (Sigma Aldrich, St. Lois, MO), although the specific procedures used for
processing the samples were not released by the manufacturers. Addit
mucus was collected from freshly harvested pig stomachs and purified following procedures
outlined in reference 8. Results are shown in Figures 4.
healthy human mucus, and the commercially ava
Ultimately, due to different chemical
Figure 4.6) and interaction dynamics, mimetics are only a useful comparison for particular
viscoelastic “states” (i.e. matching viscoelastic properties under specific conditions). Their
response to cha
agents and other compounds will not match the response of mucus to those same changes.
derived
Many
gastric and cervical mucins extracted from pigs or cows. Similar for humans, pulmonary sources
are low volume, and therefore rarely considered. Purified bovine submaxillary mucin
(MP Bio, Solon, OH) are commercially available as lyophilized powders, as are porcine gastric
mucins (PGM) (Sigma Aldrich, St. Lois, MO), although the specific procedures used for
processing the samples were not released by the manufacturers. Addit
mucus was collected from freshly harvested pig stomachs and purified following procedures
outlined in reference 8. Results are shown in Figures 4.
healthy human mucus, and the commercially ava
Ultimately, due to different chemical
) and interaction dynamics, mimetics are only a useful comparison for particular
viscoelastic “states” (i.e. matching viscoelastic properties under specific conditions). Their
response to cha
agents and other compounds will not match the response of mucus to those same changes.
derived
Many different animal sources of mucus have been explored, including submaxillary,
gastric and cervical mucins extracted from pigs or cows. Similar for humans, pulmonary sources
are low volume, and therefore rarely considered. Purified bovine submaxillary mucin
(MP Bio, Solon, OH) are commercially available as lyophilized powders, as are porcine gastric
mucins (PGM) (Sigma Aldrich, St. Lois, MO), although the specific procedures used for
processing the samples were not released by the manufacturers. Addit
mucus was collected from freshly harvested pig stomachs and purified following procedures
outlined in reference 8. Results are shown in Figures 4.
healthy human mucus, and the commercially ava
Ultimately, due to different chemical
) and interaction dynamics, mimetics are only a useful comparison for particular
viscoelastic “states” (i.e. matching viscoelastic properties under specific conditions). Their
response to changes in the conditions (varying frequency, for example) or to the addition of ionic
agents and other compounds will not match the response of mucus to those same changes.
derived
different animal sources of mucus have been explored, including submaxillary,
gastric and cervical mucins extracted from pigs or cows. Similar for humans, pulmonary sources
are low volume, and therefore rarely considered. Purified bovine submaxillary mucin
(MP Bio, Solon, OH) are commercially available as lyophilized powders, as are porcine gastric
mucins (PGM) (Sigma Aldrich, St. Lois, MO), although the specific procedures used for
processing the samples were not released by the manufacturers. Addit
mucus was collected from freshly harvested pig stomachs and purified following procedures
outlined in reference 8. Results are shown in Figures 4.
healthy human mucus, and the commercially ava
Ultimately, due to different chemical
) and interaction dynamics, mimetics are only a useful comparison for particular
viscoelastic “states” (i.e. matching viscoelastic properties under specific conditions). Their
nges in the conditions (varying frequency, for example) or to the addition of ionic
agents and other compounds will not match the response of mucus to those same changes.
sources
different animal sources of mucus have been explored, including submaxillary,
gastric and cervical mucins extracted from pigs or cows. Similar for humans, pulmonary sources
are low volume, and therefore rarely considered. Purified bovine submaxillary mucin
(MP Bio, Solon, OH) are commercially available as lyophilized powders, as are porcine gastric
mucins (PGM) (Sigma Aldrich, St. Lois, MO), although the specific procedures used for
processing the samples were not released by the manufacturers. Addit
mucus was collected from freshly harvested pig stomachs and purified following procedures
outlined in reference 8. Results are shown in Figures 4.
healthy human mucus, and the commercially ava
Ultimately, due to different chemical
) and interaction dynamics, mimetics are only a useful comparison for particular
viscoelastic “states” (i.e. matching viscoelastic properties under specific conditions). Their
nges in the conditions (varying frequency, for example) or to the addition of ionic
agents and other compounds will not match the response of mucus to those same changes.
sources:
different animal sources of mucus have been explored, including submaxillary,
gastric and cervical mucins extracted from pigs or cows. Similar for humans, pulmonary sources
are low volume, and therefore rarely considered. Purified bovine submaxillary mucin
(MP Bio, Solon, OH) are commercially available as lyophilized powders, as are porcine gastric
mucins (PGM) (Sigma Aldrich, St. Lois, MO), although the specific procedures used for
processing the samples were not released by the manufacturers. Addit
mucus was collected from freshly harvested pig stomachs and purified following procedures
outlined in reference 8. Results are shown in Figures 4.
healthy human mucus, and the commercially ava
Ultimately, due to different chemical
) and interaction dynamics, mimetics are only a useful comparison for particular
viscoelastic “states” (i.e. matching viscoelastic properties under specific conditions). Their
nges in the conditions (varying frequency, for example) or to the addition of ionic
agents and other compounds will not match the response of mucus to those same changes.
:
different animal sources of mucus have been explored, including submaxillary,
gastric and cervical mucins extracted from pigs or cows. Similar for humans, pulmonary sources
are low volume, and therefore rarely considered. Purified bovine submaxillary mucin
(MP Bio, Solon, OH) are commercially available as lyophilized powders, as are porcine gastric
mucins (PGM) (Sigma Aldrich, St. Lois, MO), although the specific procedures used for
processing the samples were not released by the manufacturers. Addit
mucus was collected from freshly harvested pig stomachs and purified following procedures
outlined in reference 8. Results are shown in Figures 4.
healthy human mucus, and the commercially ava
Ultimately, due to different chemical
) and interaction dynamics, mimetics are only a useful comparison for particular
viscoelastic “states” (i.e. matching viscoelastic properties under specific conditions). Their
nges in the conditions (varying frequency, for example) or to the addition of ionic
agents and other compounds will not match the response of mucus to those same changes.
Figure 4.
different animal sources of mucus have been explored, including submaxillary,
gastric and cervical mucins extracted from pigs or cows. Similar for humans, pulmonary sources
are low volume, and therefore rarely considered. Purified bovine submaxillary mucin
(MP Bio, Solon, OH) are commercially available as lyophilized powders, as are porcine gastric
mucins (PGM) (Sigma Aldrich, St. Lois, MO), although the specific procedures used for
processing the samples were not released by the manufacturers. Addit
mucus was collected from freshly harvested pig stomachs and purified following procedures
outlined in reference 8. Results are shown in Figures 4.
healthy human mucus, and the commercially ava
Ultimately, due to different chemical
) and interaction dynamics, mimetics are only a useful comparison for particular
viscoelastic “states” (i.e. matching viscoelastic properties under specific conditions). Their
nges in the conditions (varying frequency, for example) or to the addition of ionic
agents and other compounds will not match the response of mucus to those same changes.
Figure 4.6
different animal sources of mucus have been explored, including submaxillary,
gastric and cervical mucins extracted from pigs or cows. Similar for humans, pulmonary sources
are low volume, and therefore rarely considered. Purified bovine submaxillary mucin
(MP Bio, Solon, OH) are commercially available as lyophilized powders, as are porcine gastric
mucins (PGM) (Sigma Aldrich, St. Lois, MO), although the specific procedures used for
processing the samples were not released by the manufacturers. Addit
mucus was collected from freshly harvested pig stomachs and purified following procedures
outlined in reference 8. Results are shown in Figures 4.
healthy human mucus, and the commercially ava
Ultimately, due to different chemical
) and interaction dynamics, mimetics are only a useful comparison for particular
viscoelastic “states” (i.e. matching viscoelastic properties under specific conditions). Their
nges in the conditions (varying frequency, for example) or to the addition of ionic
agents and other compounds will not match the response of mucus to those same changes.
6: Chemical structure of sodium alginate
different animal sources of mucus have been explored, including submaxillary,
gastric and cervical mucins extracted from pigs or cows. Similar for humans, pulmonary sources
are low volume, and therefore rarely considered. Purified bovine submaxillary mucin
(MP Bio, Solon, OH) are commercially available as lyophilized powders, as are porcine gastric
mucins (PGM) (Sigma Aldrich, St. Lois, MO), although the specific procedures used for
processing the samples were not released by the manufacturers. Addit
mucus was collected from freshly harvested pig stomachs and purified following procedures
outlined in reference 8. Results are shown in Figures 4.
healthy human mucus, and the commercially ava
Ultimately, due to different chemical
) and interaction dynamics, mimetics are only a useful comparison for particular
viscoelastic “states” (i.e. matching viscoelastic properties under specific conditions). Their
nges in the conditions (varying frequency, for example) or to the addition of ionic
agents and other compounds will not match the response of mucus to those same changes.
: Chemical structure of sodium alginate
different animal sources of mucus have been explored, including submaxillary,
gastric and cervical mucins extracted from pigs or cows. Similar for humans, pulmonary sources
are low volume, and therefore rarely considered. Purified bovine submaxillary mucin
(MP Bio, Solon, OH) are commercially available as lyophilized powders, as are porcine gastric
mucins (PGM) (Sigma Aldrich, St. Lois, MO), although the specific procedures used for
processing the samples were not released by the manufacturers. Addit
mucus was collected from freshly harvested pig stomachs and purified following procedures
outlined in reference 8. Results are shown in Figures 4.
healthy human mucus, and the commercially ava
structures (alginate’s chemical
) and interaction dynamics, mimetics are only a useful comparison for particular
viscoelastic “states” (i.e. matching viscoelastic properties under specific conditions). Their
nges in the conditions (varying frequency, for example) or to the addition of ionic
agents and other compounds will not match the response of mucus to those same changes.
: Chemical structure of sodium alginate
different animal sources of mucus have been explored, including submaxillary,
gastric and cervical mucins extracted from pigs or cows. Similar for humans, pulmonary sources
are low volume, and therefore rarely considered. Purified bovine submaxillary mucin
(MP Bio, Solon, OH) are commercially available as lyophilized powders, as are porcine gastric
mucins (PGM) (Sigma Aldrich, St. Lois, MO), although the specific procedures used for
processing the samples were not released by the manufacturers. Addit
mucus was collected from freshly harvested pig stomachs and purified following procedures
outlined in reference 8. Results are shown in Figures 4.
healthy human mucus, and the commercially ava
56
structures (alginate’s chemical
) and interaction dynamics, mimetics are only a useful comparison for particular
viscoelastic “states” (i.e. matching viscoelastic properties under specific conditions). Their
nges in the conditions (varying frequency, for example) or to the addition of ionic
agents and other compounds will not match the response of mucus to those same changes.
: Chemical structure of sodium alginate
different animal sources of mucus have been explored, including submaxillary,
gastric and cervical mucins extracted from pigs or cows. Similar for humans, pulmonary sources
are low volume, and therefore rarely considered. Purified bovine submaxillary mucin
(MP Bio, Solon, OH) are commercially available as lyophilized powders, as are porcine gastric
mucins (PGM) (Sigma Aldrich, St. Lois, MO), although the specific procedures used for
processing the samples were not released by the manufacturers. Addit
mucus was collected from freshly harvested pig stomachs and purified following procedures
outlined in reference 8. Results are shown in Figures 4.
healthy human mucus, and the commercially available PGM was only moderately better. The
56
structures (alginate’s chemical
) and interaction dynamics, mimetics are only a useful comparison for particular
viscoelastic “states” (i.e. matching viscoelastic properties under specific conditions). Their
nges in the conditions (varying frequency, for example) or to the addition of ionic
agents and other compounds will not match the response of mucus to those same changes.
: Chemical structure of sodium alginate
different animal sources of mucus have been explored, including submaxillary,
gastric and cervical mucins extracted from pigs or cows. Similar for humans, pulmonary sources
are low volume, and therefore rarely considered. Purified bovine submaxillary mucin
(MP Bio, Solon, OH) are commercially available as lyophilized powders, as are porcine gastric
mucins (PGM) (Sigma Aldrich, St. Lois, MO), although the specific procedures used for
processing the samples were not released by the manufacturers. Addit
mucus was collected from freshly harvested pig stomachs and purified following procedures
outlined in reference 8. Results are shown in Figures 4.
ilable PGM was only moderately better. The
structures (alginate’s chemical
) and interaction dynamics, mimetics are only a useful comparison for particular
viscoelastic “states” (i.e. matching viscoelastic properties under specific conditions). Their
nges in the conditions (varying frequency, for example) or to the addition of ionic
agents and other compounds will not match the response of mucus to those same changes.
: Chemical structure of sodium alginate
different animal sources of mucus have been explored, including submaxillary,
gastric and cervical mucins extracted from pigs or cows. Similar for humans, pulmonary sources
are low volume, and therefore rarely considered. Purified bovine submaxillary mucin
(MP Bio, Solon, OH) are commercially available as lyophilized powders, as are porcine gastric
mucins (PGM) (Sigma Aldrich, St. Lois, MO), although the specific procedures used for
processing the samples were not released by the manufacturers. Addit
mucus was collected from freshly harvested pig stomachs and purified following procedures
outlined in reference 8. Results are shown in Figures 4.4
ilable PGM was only moderately better. The
structures (alginate’s chemical
) and interaction dynamics, mimetics are only a useful comparison for particular
viscoelastic “states” (i.e. matching viscoelastic properties under specific conditions). Their
nges in the conditions (varying frequency, for example) or to the addition of ionic
agents and other compounds will not match the response of mucus to those same changes.
: Chemical structure of sodium alginate
different animal sources of mucus have been explored, including submaxillary,
gastric and cervical mucins extracted from pigs or cows. Similar for humans, pulmonary sources
are low volume, and therefore rarely considered. Purified bovine submaxillary mucin
(MP Bio, Solon, OH) are commercially available as lyophilized powders, as are porcine gastric
mucins (PGM) (Sigma Aldrich, St. Lois, MO), although the specific procedures used for
processing the samples were not released by the manufacturers. Addit
mucus was collected from freshly harvested pig stomachs and purified following procedures
4
ilable PGM was only moderately better. The
structures (alginate’s chemical
) and interaction dynamics, mimetics are only a useful comparison for particular
viscoelastic “states” (i.e. matching viscoelastic properties under specific conditions). Their
nges in the conditions (varying frequency, for example) or to the addition of ionic
agents and other compounds will not match the response of mucus to those same changes.
: Chemical structure of sodium alginate
different animal sources of mucus have been explored, including submaxillary,
gastric and cervical mucins extracted from pigs or cows. Similar for humans, pulmonary sources
are low volume, and therefore rarely considered. Purified bovine submaxillary mucin
(MP Bio, Solon, OH) are commercially available as lyophilized powders, as are porcine gastric
mucins (PGM) (Sigma Aldrich, St. Lois, MO), although the specific procedures used for
processing the samples were not released by the manufacturers. Addit
mucus was collected from freshly harvested pig stomachs and purified following procedures
and 4.
ilable PGM was only moderately better. The
structures (alginate’s chemical
) and interaction dynamics, mimetics are only a useful comparison for particular
viscoelastic “states” (i.e. matching viscoelastic properties under specific conditions). Their
nges in the conditions (varying frequency, for example) or to the addition of ionic
agents and other compounds will not match the response of mucus to those same changes.
: Chemical structure of sodium alginate
different animal sources of mucus have been explored, including submaxillary,
gastric and cervical mucins extracted from pigs or cows. Similar for humans, pulmonary sources
are low volume, and therefore rarely considered. Purified bovine submaxillary mucin
(MP Bio, Solon, OH) are commercially available as lyophilized powders, as are porcine gastric
mucins (PGM) (Sigma Aldrich, St. Lois, MO), although the specific procedures used for
processing the samples were not released by the manufacturers. Addit
mucus was collected from freshly harvested pig stomachs and purified following procedures
and 4.5
ilable PGM was only moderately better. The
structures (alginate’s chemical
) and interaction dynamics, mimetics are only a useful comparison for particular
viscoelastic “states” (i.e. matching viscoelastic properties under specific conditions). Their
nges in the conditions (varying frequency, for example) or to the addition of ionic
agents and other compounds will not match the response of mucus to those same changes.
: Chemical structure of sodium alginate
different animal sources of mucus have been explored, including submaxillary,
gastric and cervical mucins extracted from pigs or cows. Similar for humans, pulmonary sources
are low volume, and therefore rarely considered. Purified bovine submaxillary mucin
(MP Bio, Solon, OH) are commercially available as lyophilized powders, as are porcine gastric
mucins (PGM) (Sigma Aldrich, St. Lois, MO), although the specific procedures used for
processing the samples were not released by the manufacturers. Addit
mucus was collected from freshly harvested pig stomachs and purified following procedures
5. BSM was the poorest match to
ilable PGM was only moderately better. The
structures (alginate’s chemical
) and interaction dynamics, mimetics are only a useful comparison for particular
viscoelastic “states” (i.e. matching viscoelastic properties under specific conditions). Their
nges in the conditions (varying frequency, for example) or to the addition of ionic
agents and other compounds will not match the response of mucus to those same changes.
: Chemical structure of sodium alginate
different animal sources of mucus have been explored, including submaxillary,
gastric and cervical mucins extracted from pigs or cows. Similar for humans, pulmonary sources
are low volume, and therefore rarely considered. Purified bovine submaxillary mucin
(MP Bio, Solon, OH) are commercially available as lyophilized powders, as are porcine gastric
mucins (PGM) (Sigma Aldrich, St. Lois, MO), although the specific procedures used for
processing the samples were not released by the manufacturers. Addit
mucus was collected from freshly harvested pig stomachs and purified following procedures
. BSM was the poorest match to
ilable PGM was only moderately better. The
structures (alginate’s chemical
) and interaction dynamics, mimetics are only a useful comparison for particular
viscoelastic “states” (i.e. matching viscoelastic properties under specific conditions). Their
nges in the conditions (varying frequency, for example) or to the addition of ionic
agents and other compounds will not match the response of mucus to those same changes.
: Chemical structure of sodium alginate16
different animal sources of mucus have been explored, including submaxillary,
gastric and cervical mucins extracted from pigs or cows. Similar for humans, pulmonary sources
are low volume, and therefore rarely considered. Purified bovine submaxillary mucin
(MP Bio, Solon, OH) are commercially available as lyophilized powders, as are porcine gastric
mucins (PGM) (Sigma Aldrich, St. Lois, MO), although the specific procedures used for
processing the samples were not released by the manufacturers. Addit
mucus was collected from freshly harvested pig stomachs and purified following procedures
. BSM was the poorest match to
ilable PGM was only moderately better. The
structures (alginate’s chemical
) and interaction dynamics, mimetics are only a useful comparison for particular
viscoelastic “states” (i.e. matching viscoelastic properties under specific conditions). Their
nges in the conditions (varying frequency, for example) or to the addition of ionic
agents and other compounds will not match the response of mucus to those same changes.
16
different animal sources of mucus have been explored, including submaxillary,
gastric and cervical mucins extracted from pigs or cows. Similar for humans, pulmonary sources
are low volume, and therefore rarely considered. Purified bovine submaxillary mucin
(MP Bio, Solon, OH) are commercially available as lyophilized powders, as are porcine gastric
mucins (PGM) (Sigma Aldrich, St. Lois, MO), although the specific procedures used for
processing the samples were not released by the manufacturers. Additionally, porcine gastric
mucus was collected from freshly harvested pig stomachs and purified following procedures
. BSM was the poorest match to
ilable PGM was only moderately better. The
structures (alginate’s chemical
) and interaction dynamics, mimetics are only a useful comparison for particular
viscoelastic “states” (i.e. matching viscoelastic properties under specific conditions). Their
nges in the conditions (varying frequency, for example) or to the addition of ionic
agents and other compounds will not match the response of mucus to those same changes.
different animal sources of mucus have been explored, including submaxillary,
gastric and cervical mucins extracted from pigs or cows. Similar for humans, pulmonary sources
are low volume, and therefore rarely considered. Purified bovine submaxillary mucin
(MP Bio, Solon, OH) are commercially available as lyophilized powders, as are porcine gastric
mucins (PGM) (Sigma Aldrich, St. Lois, MO), although the specific procedures used for
ionally, porcine gastric
mucus was collected from freshly harvested pig stomachs and purified following procedures
. BSM was the poorest match to
ilable PGM was only moderately better. The
structures (alginate’s chemical structure is shown in
) and interaction dynamics, mimetics are only a useful comparison for particular
viscoelastic “states” (i.e. matching viscoelastic properties under specific conditions). Their
nges in the conditions (varying frequency, for example) or to the addition of ionic
agents and other compounds will not match the response of mucus to those same changes.
different animal sources of mucus have been explored, including submaxillary,
gastric and cervical mucins extracted from pigs or cows. Similar for humans, pulmonary sources
are low volume, and therefore rarely considered. Purified bovine submaxillary mucin
(MP Bio, Solon, OH) are commercially available as lyophilized powders, as are porcine gastric
mucins (PGM) (Sigma Aldrich, St. Lois, MO), although the specific procedures used for
ionally, porcine gastric
mucus was collected from freshly harvested pig stomachs and purified following procedures
. BSM was the poorest match to
ilable PGM was only moderately better. The
structure is shown in
) and interaction dynamics, mimetics are only a useful comparison for particular
viscoelastic “states” (i.e. matching viscoelastic properties under specific conditions). Their
nges in the conditions (varying frequency, for example) or to the addition of ionic
agents and other compounds will not match the response of mucus to those same changes.
different animal sources of mucus have been explored, including submaxillary,
gastric and cervical mucins extracted from pigs or cows. Similar for humans, pulmonary sources
are low volume, and therefore rarely considered. Purified bovine submaxillary mucins (BSM)
(MP Bio, Solon, OH) are commercially available as lyophilized powders, as are porcine gastric
mucins (PGM) (Sigma Aldrich, St. Lois, MO), although the specific procedures used for
ionally, porcine gastric
mucus was collected from freshly harvested pig stomachs and purified following procedures
. BSM was the poorest match to
ilable PGM was only moderately better. The
structure is shown in
) and interaction dynamics, mimetics are only a useful comparison for particular
viscoelastic “states” (i.e. matching viscoelastic properties under specific conditions). Their
nges in the conditions (varying frequency, for example) or to the addition of ionic
agents and other compounds will not match the response of mucus to those same changes.
different animal sources of mucus have been explored, including submaxillary,
gastric and cervical mucins extracted from pigs or cows. Similar for humans, pulmonary sources
s (BSM)
(MP Bio, Solon, OH) are commercially available as lyophilized powders, as are porcine gastric
ionally, porcine gastric
mucus was collected from freshly harvested pig stomachs and purified following procedures
. BSM was the poorest match to
ilable PGM was only moderately better. The
structure is shown in
) and interaction dynamics, mimetics are only a useful comparison for particular
viscoelastic “states” (i.e. matching viscoelastic properties under specific conditions). Their
nges in the conditions (varying frequency, for example) or to the addition of ionic
different animal sources of mucus have been explored, including submaxillary,
gastric and cervical mucins extracted from pigs or cows. Similar for humans, pulmonary sources
s (BSM)
(MP Bio, Solon, OH) are commercially available as lyophilized powders, as are porcine gastric
ionally, porcine gastric
mucus was collected from freshly harvested pig stomachs and purified following procedures
. BSM was the poorest match to
ilable PGM was only moderately better. The
structure is shown in
nges in the conditions (varying frequency, for example) or to the addition of ionic
gastric and cervical mucins extracted from pigs or cows. Similar for humans, pulmonary sources
s (BSM)
(MP Bio, Solon, OH) are commercially available as lyophilized powders, as are porcine gastric
. BSM was the poorest match to
ilable PGM was only moderately better. The
structure is shown in
nges in the conditions (varying frequency, for example) or to the addition of ionic
gastric and cervical mucins extracted from pigs or cows. Similar for humans, pulmonary sources
(MP Bio, Solon, OH) are commercially available as lyophilized powders, as are porcine gastric
. BSM was the poorest match to
structure is shown in
nges in the conditions (varying frequency, for example) or to the addition of ionic
gastric and cervical mucins extracted from pigs or cows. Similar for humans, pulmonary sources
. BSM was the poorest match to
structure is shown in
nges in the conditions (varying frequency, for example) or to the addition of ionic
gastric and cervical mucins extracted from pigs or cows. Similar for humans, pulmonary sources

57
freshly purified PGM was a strong match, but unfortunately the collection process was
prohibitively time-intensive for the amount of material produced (3-4 weeks were required to
produce a few hundred milligrams of final product).
Human sources:
Two human-based sources of pulmonary mucus were examined: mucus secreted from
Calu-3 cells (which are cultured from human airway epithelial cells)9; and sputum obtained from
patients suffering from chronic obstructive pulmonary disorder (COPD). Calu-3 cell cultures
produced a few hundred microliters of mucus on a weekly basis, so several cultures were
harvested concurrently and the secretions pooled over time to produce useable quantities. COPD
is characterized by excessive production of pulmonary mucus (with volumes exceeding tens of
milliliters per day from a single individual). Unlike in cystic fibrosis (CF), in which much
thicker, stiffer mucus is produced, COPD mucus has been found to more closely match healthy
mucus10
. Sputum samples were collected by a third party and provided for research purposes: 10
patients provided a sputum sample daily for five days. All samples were kept frozen at -80oC
until needed, at which point individual samples were thawed for testing as needed. Results are
included in Figures 4.4 and 4.5: Calu-3 secretions were a poor match for healthy mucus;
however, as expected, COPD sputum was a very strong match. COPD was selected for further
characterization and experimentation.
Large variations in viscoelasticity were observed between COPD sputum samples
provided by different individuals, specifically in the complex modulus (inter-patient sample data
is shown in Figure 4.7). The mean value for complex modulus across all samples was 5.3 Pa.
The relative standard deviation (RSD) was 58.6%. Much less variation was observed in the loss

58
tangent (mean: 0.253; RSD: 17.98%). Variations between samples provided by the same
individual on different days were observed as well, however they tended to be smaller than the
range observed across different individuals. Figure 4.8 shows the RSD in the complex modulus
across samples collected over multiple days for each individual.
Figure 4.7: Inter-patient viscoelasticity in COPD sputum – (a) Magnitude of complex modulus; (b) Loss tangent
Figure 4.8: Intra-patient variation in COPD sputum – (a) RSD of complex modulus; (b) RSD of Loss tangent

59
As a result of the observed variation, samples were pre-screened and selected for
viscoelastic parameters: samples were accepted for further testing provided the mean complex
modulus was within one standard deviation of the overall sample mean (between 3 and 6 Pa).
Samples outside this range were considered outliers for the purposes of further experimentation.
Furthermore, for studies involving the effect of salt exposure, viscoelastic parameters were
normalized against their baseline (untreated) values to aid in comparing results.
Bulk additives:
In order to explore the effect of cations on mucus viscoelasticity, different salts were
added in bulk to COPD sputum samples at varying concentrations and the resulting
viscoelasticity was measured. Four salts were investigated: calcium chloride, magnesium
chloride, sodium chloride and potassium chloride (all obtained from Sigma Aldrich). Calcium
and magnesium are divalent cations; sodium and potassium are monovalent cations. Results are
shown in Figures 4.9 and 4.10: at low cation concentrations, decreases in the loss tangent and
increases in the complex modulus (compared to baseline values) were observed. The effect was
greater for the divalent cations compared to the monovalent cations. These changes indicate
increased gel stiffness arising from increasing elasticity (larger complex modulus, smaller loss
tangent). However, as the concentration was increased the response was reversed and ultimately
the overall stiffness decreased, with greater losses in the storage moduli than loss moduli
(smaller complex modulus, larger loss tangent). Variation in the results was reasonably large,
typically between 10 and 20% RSD, with a few outliers, but this reflects the baseline variation in
the sputum samples themselves in addition to any experimental error.

60
Figure 4.9: Normalized complex modulus versus cation concentration
Figure 4.10: Normalized loss tangent versus cation concentration

shielding (Figure 4.1
and cause repulsion bet
negative charge between the mucin arms, reducing repulsion and allowing the mucins to
associate more closely. This, in turn, allows for a higher entanglement density in the mucin
netwo
mucins continue to contract and ultimately condense into their pre
the network.
Results
treated COPD sputum samples were also used in the simulated cough system developed in
chapter 3. The
fixed area. Cough
air stream was sampled at 28.3 sLMP by an exhalair system for particle measur
droplets produced were assumed to be well
Figure 4.1
shielding (Figure 4.1
and cause repulsion bet
negative charge between the mucin arms, reducing repulsion and allowing the mucins to
associate more closely. This, in turn, allows for a higher entanglement density in the mucin
network, which results in increased stiffness. However, as the cation concentration increases, the
mucins continue to contract and ultimately condense into their pre
the network.
Results
treated COPD sputum samples were also used in the simulated cough system developed in
chapter 3. The
fixed area. Cough
air stream was sampled at 28.3 sLMP by an exhalair system for particle measur
droplets produced were assumed to be well
Figure 4.1
shielding (Figure 4.1
and cause repulsion bet
negative charge between the mucin arms, reducing repulsion and allowing the mucins to
associate more closely. This, in turn, allows for a higher entanglement density in the mucin
rk, which results in increased stiffness. However, as the cation concentration increases, the
mucins continue to contract and ultimately condense into their pre
the network.
Results
treated COPD sputum samples were also used in the simulated cough system developed in
chapter 3. The
fixed area. Cough
air stream was sampled at 28.3 sLMP by an exhalair system for particle measur
droplets produced were assumed to be well
Figure 4.1
The observed increases in stiffness at low cationic concentrations are the result of charge
shielding (Figure 4.1
and cause repulsion bet
negative charge between the mucin arms, reducing repulsion and allowing the mucins to
associate more closely. This, in turn, allows for a higher entanglement density in the mucin
rk, which results in increased stiffness. However, as the cation concentration increases, the
mucins continue to contract and ultimately condense into their pre
the network.
Figure 4.1
Results:
In order to investigate the role of mucus viscoelasticity in bioaerosol formation, the salt
treated COPD sputum samples were also used in the simulated cough system developed in
chapter 3. The
fixed area. Cough
air stream was sampled at 28.3 sLMP by an exhalair system for particle measur
droplets produced were assumed to be well
Figure 4.1
The observed increases in stiffness at low cationic concentrations are the result of charge
shielding (Figure 4.1
and cause repulsion bet
negative charge between the mucin arms, reducing repulsion and allowing the mucins to
associate more closely. This, in turn, allows for a higher entanglement density in the mucin
rk, which results in increased stiffness. However, as the cation concentration increases, the
mucins continue to contract and ultimately condense into their pre
the network.
Figure 4.1
:
In order to investigate the role of mucus viscoelasticity in bioaerosol formation, the salt
treated COPD sputum samples were also used in the simulated cough system developed in
chapter 3. The
fixed area. Cough
air stream was sampled at 28.3 sLMP by an exhalair system for particle measur
droplets produced were assumed to be well
Figure 4.1
The observed increases in stiffness at low cationic concentrations are the result of charge
shielding (Figure 4.1
and cause repulsion bet
negative charge between the mucin arms, reducing repulsion and allowing the mucins to
associate more closely. This, in turn, allows for a higher entanglement density in the mucin
rk, which results in increased stiffness. However, as the cation concentration increases, the
mucins continue to contract and ultimately condense into their pre
the network.
Figure 4.1
In order to investigate the role of mucus viscoelasticity in bioaerosol formation, the salt
treated COPD sputum samples were also used in the simulated cough system developed in
chapter 3. The
fixed area. Cough
air stream was sampled at 28.3 sLMP by an exhalair system for particle measur
droplets produced were assumed to be well
Figure 4.12
The observed increases in stiffness at low cationic concentrations are the result of charge
shielding (Figure 4.1
and cause repulsion bet
negative charge between the mucin arms, reducing repulsion and allowing the mucins to
associate more closely. This, in turn, allows for a higher entanglement density in the mucin
rk, which results in increased stiffness. However, as the cation concentration increases, the
mucins continue to contract and ultimately condense into their pre
the network.
Figure 4.1
In order to investigate the role of mucus viscoelasticity in bioaerosol formation, the salt
treated COPD sputum samples were also used in the simulated cough system developed in
chapter 3. The
fixed area. Cough
air stream was sampled at 28.3 sLMP by an exhalair system for particle measur
droplets produced were assumed to be well
2, however large variability was observed for virtually all samples. In general, the
The observed increases in stiffness at low cationic concentrations are the result of charge
shielding (Figure 4.1
and cause repulsion bet
negative charge between the mucin arms, reducing repulsion and allowing the mucins to
associate more closely. This, in turn, allows for a higher entanglement density in the mucin
rk, which results in increased stiffness. However, as the cation concentration increases, the
mucins continue to contract and ultimately condense into their pre
the network.11
Figure 4.1
In order to investigate the role of mucus viscoelasticity in bioaerosol formation, the salt
treated COPD sputum samples were also used in the simulated cough system developed in
chapter 3. The
fixed area. Cough
air stream was sampled at 28.3 sLMP by an exhalair system for particle measur
droplets produced were assumed to be well
, however large variability was observed for virtually all samples. In general, the
The observed increases in stiffness at low cationic concentrations are the result of charge
shielding (Figure 4.1
and cause repulsion bet
negative charge between the mucin arms, reducing repulsion and allowing the mucins to
associate more closely. This, in turn, allows for a higher entanglement density in the mucin
rk, which results in increased stiffness. However, as the cation concentration increases, the
mucins continue to contract and ultimately condense into their pre
11
Figure 4.1
In order to investigate the role of mucus viscoelasticity in bioaerosol formation, the salt
treated COPD sputum samples were also used in the simulated cough system developed in
chapter 3. The
fixed area. Cough
air stream was sampled at 28.3 sLMP by an exhalair system for particle measur
droplets produced were assumed to be well
, however large variability was observed for virtually all samples. In general, the
The observed increases in stiffness at low cationic concentrations are the result of charge
shielding (Figure 4.1
and cause repulsion bet
negative charge between the mucin arms, reducing repulsion and allowing the mucins to
associate more closely. This, in turn, allows for a higher entanglement density in the mucin
rk, which results in increased stiffness. However, as the cation concentration increases, the
mucins continue to contract and ultimately condense into their pre
11-14
Figure 4.1
In order to investigate the role of mucus viscoelasticity in bioaerosol formation, the salt
treated COPD sputum samples were also used in the simulated cough system developed in
chapter 3. The
fixed area. Cough
air stream was sampled at 28.3 sLMP by an exhalair system for particle measur
droplets produced were assumed to be well
, however large variability was observed for virtually all samples. In general, the
The observed increases in stiffness at low cationic concentrations are the result of charge
shielding (Figure 4.1
and cause repulsion bet
negative charge between the mucin arms, reducing repulsion and allowing the mucins to
associate more closely. This, in turn, allows for a higher entanglement density in the mucin
rk, which results in increased stiffness. However, as the cation concentration increases, the
mucins continue to contract and ultimately condense into their pre
14
Figure 4.1
In order to investigate the role of mucus viscoelasticity in bioaerosol formation, the salt
treated COPD sputum samples were also used in the simulated cough system developed in
samples were loaded by syringe in a particle free bio
fixed area. Cough
air stream was sampled at 28.3 sLMP by an exhalair system for particle measur
droplets produced were assumed to be well
, however large variability was observed for virtually all samples. In general, the
The observed increases in stiffness at low cationic concentrations are the result of charge
shielding (Figure 4.1
and cause repulsion bet
negative charge between the mucin arms, reducing repulsion and allowing the mucins to
associate more closely. This, in turn, allows for a higher entanglement density in the mucin
rk, which results in increased stiffness. However, as the cation concentration increases, the
mucins continue to contract and ultimately condense into their pre
14
Figure 4.11
In order to investigate the role of mucus viscoelasticity in bioaerosol formation, the salt
treated COPD sputum samples were also used in the simulated cough system developed in
samples were loaded by syringe in a particle free bio
fixed area. Cough
air stream was sampled at 28.3 sLMP by an exhalair system for particle measur
droplets produced were assumed to be well
, however large variability was observed for virtually all samples. In general, the
The observed increases in stiffness at low cationic concentrations are the result of charge
shielding (Figure 4.1
and cause repulsion bet
negative charge between the mucin arms, reducing repulsion and allowing the mucins to
associate more closely. This, in turn, allows for a higher entanglement density in the mucin
rk, which results in increased stiffness. However, as the cation concentration increases, the
mucins continue to contract and ultimately condense into their pre
1: Example of increased mucin inter
In order to investigate the role of mucus viscoelasticity in bioaerosol formation, the salt
treated COPD sputum samples were also used in the simulated cough system developed in
samples were loaded by syringe in a particle free bio
fixed area. Cough-
air stream was sampled at 28.3 sLMP by an exhalair system for particle measur
droplets produced were assumed to be well
, however large variability was observed for virtually all samples. In general, the
The observed increases in stiffness at low cationic concentrations are the result of charge
shielding (Figure 4.1
and cause repulsion bet
negative charge between the mucin arms, reducing repulsion and allowing the mucins to
associate more closely. This, in turn, allows for a higher entanglement density in the mucin
rk, which results in increased stiffness. However, as the cation concentration increases, the
mucins continue to contract and ultimately condense into their pre
: Example of increased mucin inter
In order to investigate the role of mucus viscoelasticity in bioaerosol formation, the salt
treated COPD sputum samples were also used in the simulated cough system developed in
samples were loaded by syringe in a particle free bio
-equivalent air flow was generated by a breathing simulator, and the resulting
air stream was sampled at 28.3 sLMP by an exhalair system for particle measur
droplets produced were assumed to be well
, however large variability was observed for virtually all samples. In general, the
The observed increases in stiffness at low cationic concentrations are the result of charge
shielding (Figure 4.1
and cause repulsion bet
negative charge between the mucin arms, reducing repulsion and allowing the mucins to
associate more closely. This, in turn, allows for a higher entanglement density in the mucin
rk, which results in increased stiffness. However, as the cation concentration increases, the
mucins continue to contract and ultimately condense into their pre
: Example of increased mucin inter
In order to investigate the role of mucus viscoelasticity in bioaerosol formation, the salt
treated COPD sputum samples were also used in the simulated cough system developed in
samples were loaded by syringe in a particle free bio
equivalent air flow was generated by a breathing simulator, and the resulting
air stream was sampled at 28.3 sLMP by an exhalair system for particle measur
droplets produced were assumed to be well
, however large variability was observed for virtually all samples. In general, the
The observed increases in stiffness at low cationic concentrations are the result of charge
shielding (Figure 4.11
and cause repulsion bet
negative charge between the mucin arms, reducing repulsion and allowing the mucins to
associate more closely. This, in turn, allows for a higher entanglement density in the mucin
rk, which results in increased stiffness. However, as the cation concentration increases, the
mucins continue to contract and ultimately condense into their pre
: Example of increased mucin inter
In order to investigate the role of mucus viscoelasticity in bioaerosol formation, the salt
treated COPD sputum samples were also used in the simulated cough system developed in
samples were loaded by syringe in a particle free bio
equivalent air flow was generated by a breathing simulator, and the resulting
air stream was sampled at 28.3 sLMP by an exhalair system for particle measur
droplets produced were assumed to be well
, however large variability was observed for virtually all samples. In general, the
The observed increases in stiffness at low cationic concentrations are the result of charge
1)
and cause repulsion bet
negative charge between the mucin arms, reducing repulsion and allowing the mucins to
associate more closely. This, in turn, allows for a higher entanglement density in the mucin
rk, which results in increased stiffness. However, as the cation concentration increases, the
mucins continue to contract and ultimately condense into their pre
: Example of increased mucin inter
In order to investigate the role of mucus viscoelasticity in bioaerosol formation, the salt
treated COPD sputum samples were also used in the simulated cough system developed in
samples were loaded by syringe in a particle free bio
equivalent air flow was generated by a breathing simulator, and the resulting
air stream was sampled at 28.3 sLMP by an exhalair system for particle measur
droplets produced were assumed to be well
, however large variability was observed for virtually all samples. In general, the
The observed increases in stiffness at low cationic concentrations are the result of charge
)1
and cause repulsion between mucins, but the presence of positively charged cations shields the
negative charge between the mucin arms, reducing repulsion and allowing the mucins to
associate more closely. This, in turn, allows for a higher entanglement density in the mucin
rk, which results in increased stiffness. However, as the cation concentration increases, the
mucins continue to contract and ultimately condense into their pre
: Example of increased mucin inter
In order to investigate the role of mucus viscoelasticity in bioaerosol formation, the salt
treated COPD sputum samples were also used in the simulated cough system developed in
samples were loaded by syringe in a particle free bio
equivalent air flow was generated by a breathing simulator, and the resulting
air stream was sampled at 28.3 sLMP by an exhalair system for particle measur
droplets produced were assumed to be well
, however large variability was observed for virtually all samples. In general, the
The observed increases in stiffness at low cationic concentrations are the result of charge
13
ween mucins, but the presence of positively charged cations shields the
negative charge between the mucin arms, reducing repulsion and allowing the mucins to
associate more closely. This, in turn, allows for a higher entanglement density in the mucin
rk, which results in increased stiffness. However, as the cation concentration increases, the
mucins continue to contract and ultimately condense into their pre
: Example of increased mucin inter
In order to investigate the role of mucus viscoelasticity in bioaerosol formation, the salt
treated COPD sputum samples were also used in the simulated cough system developed in
samples were loaded by syringe in a particle free bio
equivalent air flow was generated by a breathing simulator, and the resulting
air stream was sampled at 28.3 sLMP by an exhalair system for particle measur
droplets produced were assumed to be well
, however large variability was observed for virtually all samples. In general, the
The observed increases in stiffness at low cationic concentrations are the result of charge
3. Sialic acids attached to the mucin backbones are negatively charged
ween mucins, but the presence of positively charged cations shields the
negative charge between the mucin arms, reducing repulsion and allowing the mucins to
associate more closely. This, in turn, allows for a higher entanglement density in the mucin
rk, which results in increased stiffness. However, as the cation concentration increases, the
mucins continue to contract and ultimately condense into their pre
: Example of increased mucin inter
In order to investigate the role of mucus viscoelasticity in bioaerosol formation, the salt
treated COPD sputum samples were also used in the simulated cough system developed in
samples were loaded by syringe in a particle free bio
equivalent air flow was generated by a breathing simulator, and the resulting
air stream was sampled at 28.3 sLMP by an exhalair system for particle measur
droplets produced were assumed to be well
, however large variability was observed for virtually all samples. In general, the
The observed increases in stiffness at low cationic concentrations are the result of charge
. Sialic acids attached to the mucin backbones are negatively charged
ween mucins, but the presence of positively charged cations shields the
negative charge between the mucin arms, reducing repulsion and allowing the mucins to
associate more closely. This, in turn, allows for a higher entanglement density in the mucin
rk, which results in increased stiffness. However, as the cation concentration increases, the
mucins continue to contract and ultimately condense into their pre
: Example of increased mucin inter
In order to investigate the role of mucus viscoelasticity in bioaerosol formation, the salt
treated COPD sputum samples were also used in the simulated cough system developed in
samples were loaded by syringe in a particle free bio
equivalent air flow was generated by a breathing simulator, and the resulting
air stream was sampled at 28.3 sLMP by an exhalair system for particle measur
droplets produced were assumed to be well-
, however large variability was observed for virtually all samples. In general, the
The observed increases in stiffness at low cationic concentrations are the result of charge
. Sialic acids attached to the mucin backbones are negatively charged
ween mucins, but the presence of positively charged cations shields the
negative charge between the mucin arms, reducing repulsion and allowing the mucins to
associate more closely. This, in turn, allows for a higher entanglement density in the mucin
rk, which results in increased stiffness. However, as the cation concentration increases, the
mucins continue to contract and ultimately condense into their pre
: Example of increased mucin inter
In order to investigate the role of mucus viscoelasticity in bioaerosol formation, the salt
treated COPD sputum samples were also used in the simulated cough system developed in
samples were loaded by syringe in a particle free bio
equivalent air flow was generated by a breathing simulator, and the resulting
air stream was sampled at 28.3 sLMP by an exhalair system for particle measur
-mixed with the air stream. Results are shown in
, however large variability was observed for virtually all samples. In general, the
The observed increases in stiffness at low cationic concentrations are the result of charge
. Sialic acids attached to the mucin backbones are negatively charged
ween mucins, but the presence of positively charged cations shields the
negative charge between the mucin arms, reducing repulsion and allowing the mucins to
associate more closely. This, in turn, allows for a higher entanglement density in the mucin
rk, which results in increased stiffness. However, as the cation concentration increases, the
mucins continue to contract and ultimately condense into their pre
: Example of increased mucin inter
In order to investigate the role of mucus viscoelasticity in bioaerosol formation, the salt
treated COPD sputum samples were also used in the simulated cough system developed in
samples were loaded by syringe in a particle free bio
equivalent air flow was generated by a breathing simulator, and the resulting
air stream was sampled at 28.3 sLMP by an exhalair system for particle measur
mixed with the air stream. Results are shown in
, however large variability was observed for virtually all samples. In general, the
The observed increases in stiffness at low cationic concentrations are the result of charge
. Sialic acids attached to the mucin backbones are negatively charged
ween mucins, but the presence of positively charged cations shields the
negative charge between the mucin arms, reducing repulsion and allowing the mucins to
associate more closely. This, in turn, allows for a higher entanglement density in the mucin
rk, which results in increased stiffness. However, as the cation concentration increases, the
mucins continue to contract and ultimately condense into their pre
: Example of increased mucin interaction as a result of cation
In order to investigate the role of mucus viscoelasticity in bioaerosol formation, the salt
treated COPD sputum samples were also used in the simulated cough system developed in
samples were loaded by syringe in a particle free bio
equivalent air flow was generated by a breathing simulator, and the resulting
air stream was sampled at 28.3 sLMP by an exhalair system for particle measur
mixed with the air stream. Results are shown in
, however large variability was observed for virtually all samples. In general, the
61
The observed increases in stiffness at low cationic concentrations are the result of charge
. Sialic acids attached to the mucin backbones are negatively charged
ween mucins, but the presence of positively charged cations shields the
negative charge between the mucin arms, reducing repulsion and allowing the mucins to
associate more closely. This, in turn, allows for a higher entanglement density in the mucin
rk, which results in increased stiffness. However, as the cation concentration increases, the
mucins continue to contract and ultimately condense into their pre
action as a result of cation
In order to investigate the role of mucus viscoelasticity in bioaerosol formation, the salt
treated COPD sputum samples were also used in the simulated cough system developed in
samples were loaded by syringe in a particle free bio
equivalent air flow was generated by a breathing simulator, and the resulting
air stream was sampled at 28.3 sLMP by an exhalair system for particle measur
mixed with the air stream. Results are shown in
, however large variability was observed for virtually all samples. In general, the
The observed increases in stiffness at low cationic concentrations are the result of charge
. Sialic acids attached to the mucin backbones are negatively charged
ween mucins, but the presence of positively charged cations shields the
negative charge between the mucin arms, reducing repulsion and allowing the mucins to
associate more closely. This, in turn, allows for a higher entanglement density in the mucin
rk, which results in increased stiffness. However, as the cation concentration increases, the
mucins continue to contract and ultimately condense into their pre-
action as a result of cation
In order to investigate the role of mucus viscoelasticity in bioaerosol formation, the salt
treated COPD sputum samples were also used in the simulated cough system developed in
samples were loaded by syringe in a particle free bio
equivalent air flow was generated by a breathing simulator, and the resulting
air stream was sampled at 28.3 sLMP by an exhalair system for particle measur
mixed with the air stream. Results are shown in
, however large variability was observed for virtually all samples. In general, the
The observed increases in stiffness at low cationic concentrations are the result of charge
. Sialic acids attached to the mucin backbones are negatively charged
ween mucins, but the presence of positively charged cations shields the
negative charge between the mucin arms, reducing repulsion and allowing the mucins to
associate more closely. This, in turn, allows for a higher entanglement density in the mucin
rk, which results in increased stiffness. However, as the cation concentration increases, the
-release state, disintegrating
action as a result of cation
In order to investigate the role of mucus viscoelasticity in bioaerosol formation, the salt
treated COPD sputum samples were also used in the simulated cough system developed in
samples were loaded by syringe in a particle free bio
equivalent air flow was generated by a breathing simulator, and the resulting
air stream was sampled at 28.3 sLMP by an exhalair system for particle measur
mixed with the air stream. Results are shown in
, however large variability was observed for virtually all samples. In general, the
The observed increases in stiffness at low cationic concentrations are the result of charge
. Sialic acids attached to the mucin backbones are negatively charged
ween mucins, but the presence of positively charged cations shields the
negative charge between the mucin arms, reducing repulsion and allowing the mucins to
associate more closely. This, in turn, allows for a higher entanglement density in the mucin
rk, which results in increased stiffness. However, as the cation concentration increases, the
release state, disintegrating
action as a result of cation-
In order to investigate the role of mucus viscoelasticity in bioaerosol formation, the salt
treated COPD sputum samples were also used in the simulated cough system developed in
samples were loaded by syringe in a particle free bio-
equivalent air flow was generated by a breathing simulator, and the resulting
air stream was sampled at 28.3 sLMP by an exhalair system for particle measur
mixed with the air stream. Results are shown in
, however large variability was observed for virtually all samples. In general, the
The observed increases in stiffness at low cationic concentrations are the result of charge
. Sialic acids attached to the mucin backbones are negatively charged
ween mucins, but the presence of positively charged cations shields the
negative charge between the mucin arms, reducing repulsion and allowing the mucins to
associate more closely. This, in turn, allows for a higher entanglement density in the mucin
rk, which results in increased stiffness. However, as the cation concentration increases, the
release state, disintegrating
-induced charge
In order to investigate the role of mucus viscoelasticity in bioaerosol formation, the salt
treated COPD sputum samples were also used in the simulated cough system developed in
-hood and then spread over a
equivalent air flow was generated by a breathing simulator, and the resulting
air stream was sampled at 28.3 sLMP by an exhalair system for particle measur
mixed with the air stream. Results are shown in
, however large variability was observed for virtually all samples. In general, the
The observed increases in stiffness at low cationic concentrations are the result of charge
. Sialic acids attached to the mucin backbones are negatively charged
ween mucins, but the presence of positively charged cations shields the
negative charge between the mucin arms, reducing repulsion and allowing the mucins to
associate more closely. This, in turn, allows for a higher entanglement density in the mucin
rk, which results in increased stiffness. However, as the cation concentration increases, the
release state, disintegrating
induced charge
In order to investigate the role of mucus viscoelasticity in bioaerosol formation, the salt
treated COPD sputum samples were also used in the simulated cough system developed in
hood and then spread over a
equivalent air flow was generated by a breathing simulator, and the resulting
air stream was sampled at 28.3 sLMP by an exhalair system for particle measurement. Any
mixed with the air stream. Results are shown in
, however large variability was observed for virtually all samples. In general, the
The observed increases in stiffness at low cationic concentrations are the result of charge
. Sialic acids attached to the mucin backbones are negatively charged
ween mucins, but the presence of positively charged cations shields the
negative charge between the mucin arms, reducing repulsion and allowing the mucins to
associate more closely. This, in turn, allows for a higher entanglement density in the mucin
rk, which results in increased stiffness. However, as the cation concentration increases, the
release state, disintegrating
induced charge
In order to investigate the role of mucus viscoelasticity in bioaerosol formation, the salt
treated COPD sputum samples were also used in the simulated cough system developed in
hood and then spread over a
equivalent air flow was generated by a breathing simulator, and the resulting
ement. Any
mixed with the air stream. Results are shown in
, however large variability was observed for virtually all samples. In general, the
The observed increases in stiffness at low cationic concentrations are the result of charge
. Sialic acids attached to the mucin backbones are negatively charged
ween mucins, but the presence of positively charged cations shields the
negative charge between the mucin arms, reducing repulsion and allowing the mucins to
associate more closely. This, in turn, allows for a higher entanglement density in the mucin
rk, which results in increased stiffness. However, as the cation concentration increases, the
release state, disintegrating
induced charge-
In order to investigate the role of mucus viscoelasticity in bioaerosol formation, the salt
treated COPD sputum samples were also used in the simulated cough system developed in
hood and then spread over a
equivalent air flow was generated by a breathing simulator, and the resulting
ement. Any
mixed with the air stream. Results are shown in
, however large variability was observed for virtually all samples. In general, the
The observed increases in stiffness at low cationic concentrations are the result of charge
. Sialic acids attached to the mucin backbones are negatively charged
ween mucins, but the presence of positively charged cations shields the
negative charge between the mucin arms, reducing repulsion and allowing the mucins to
associate more closely. This, in turn, allows for a higher entanglement density in the mucin
rk, which results in increased stiffness. However, as the cation concentration increases, the
release state, disintegrating
-shielding
In order to investigate the role of mucus viscoelasticity in bioaerosol formation, the salt
treated COPD sputum samples were also used in the simulated cough system developed in
hood and then spread over a
equivalent air flow was generated by a breathing simulator, and the resulting
ement. Any
mixed with the air stream. Results are shown in
, however large variability was observed for virtually all samples. In general, the
The observed increases in stiffness at low cationic concentrations are the result of charge
. Sialic acids attached to the mucin backbones are negatively charged
ween mucins, but the presence of positively charged cations shields the
negative charge between the mucin arms, reducing repulsion and allowing the mucins to
associate more closely. This, in turn, allows for a higher entanglement density in the mucin
rk, which results in increased stiffness. However, as the cation concentration increases, the
release state, disintegrating
shielding
In order to investigate the role of mucus viscoelasticity in bioaerosol formation, the salt
treated COPD sputum samples were also used in the simulated cough system developed in
hood and then spread over a
equivalent air flow was generated by a breathing simulator, and the resulting
ement. Any
mixed with the air stream. Results are shown in
, however large variability was observed for virtually all samples. In general, the
The observed increases in stiffness at low cationic concentrations are the result of charge
. Sialic acids attached to the mucin backbones are negatively charged
ween mucins, but the presence of positively charged cations shields the
associate more closely. This, in turn, allows for a higher entanglement density in the mucin
rk, which results in increased stiffness. However, as the cation concentration increases, the
release state, disintegrating
In order to investigate the role of mucus viscoelasticity in bioaerosol formation, the salt
treated COPD sputum samples were also used in the simulated cough system developed in
hood and then spread over a
equivalent air flow was generated by a breathing simulator, and the resulting
ement. Any
mixed with the air stream. Results are shown in
, however large variability was observed for virtually all samples. In general, the
The observed increases in stiffness at low cationic concentrations are the result of charge
. Sialic acids attached to the mucin backbones are negatively charged
ween mucins, but the presence of positively charged cations shields the
rk, which results in increased stiffness. However, as the cation concentration increases, the
release state, disintegrating
In order to investigate the role of mucus viscoelasticity in bioaerosol formation, the salt
hood and then spread over a
equivalent air flow was generated by a breathing simulator, and the resulting
The observed increases in stiffness at low cationic concentrations are the result of charge
. Sialic acids attached to the mucin backbones are negatively charged
ween mucins, but the presence of positively charged cations shields the
rk, which results in increased stiffness. However, as the cation concentration increases, the
release state, disintegrating
In order to investigate the role of mucus viscoelasticity in bioaerosol formation, the salt-
hood and then spread over a
equivalent air flow was generated by a breathing simulator, and the resulting
The observed increases in stiffness at low cationic concentrations are the result of charge
ween mucins, but the presence of positively charged cations shields the
rk, which results in increased stiffness. However, as the cation concentration increases, the
-
hood and then spread over a
equivalent air flow was generated by a breathing simulator, and the resulting
The observed increases in stiffness at low cationic concentrations are the result of charge-
rk, which results in increased stiffness. However, as the cation concentration increases, the
hood and then spread over a
-
rk, which results in increased stiffness. However, as the cation concentration increases, the
hood and then spread over a

62
droplet concentration tended to decrease at low cation concentration and then rise significantly as
cation concentrations were increased. The largest decreases were observed for the divalent
cations (calcium and magnesium). This appears to match the viscoelastic response to cation
concentration previously observed.
Figure 4.12: Droplet concentration versus bulk sample cation concentration
Comparing droplet concentration to the normalized complex modulus for each sample
indicates a strong inverse correlation (correlation coefficient of -0.96) between particle
generation and viscoelasticity (Figure 4.13), with over 90% (R2 greater than 0.9) of the variance
in droplet concentration accounted for by the normalized complex modulus. However, as
previously discussed, the intra-sample variability in both parameters is still quite large.

63
Figure 4.13: Scatterplot of droplet concentration versus normalized complex modulus (n ≥ 3 for all samples)
To determine whether the intra-sample variability would significantly alter the results, the
data from every individual experiment (rather than the average over multiple replicates) was
pooled and the droplet concentration versus complex modulus was plotted (Figure 4.14).
Unsurprisingly, the sample noise can be seen as a direct influence on the variance (R2 of 0.79) as
well as the overall correlation strength (correlation coefficient of -0.89), which is still strong. The
same overall trend is still apparent.

64
Figure 4.14: Scatterplot of droplet concentration versus complex modulus for individual experiments
Conclusion:
After extensive exploration of available alternatives to healthy human pulmonary mucus,
COPD sputum was selected as the best viscoelastic substitute. Freshly purified and reconstituted
PGM was also a reasonable fit; however time and manufacturing constraints limited its
availability. Inter- and intra-patient variability in the viscoelasticity of the COPD sputum
samples were examined, along with the bulk addition of various salts: normalization was used to
determine and compare changes in viscoelasticity.
Changes in viscoelasticity were observed as a result of salt exposure: the magnitude and
direction of such changes were dependent on cation concentration as well as cation valency. This

65
response was consistent (at low cation concentration) with the work performed by Crowther and
Marriott, and is attributed to the same charge-shielding mechanism they proposed. The treated
and untreated samples were also used in a simulated cough system to measure droplet
production. Droplet concentration was found to be inversely correlated with the complex
modulus of the sample. These results confirm the second hypothesis: that altering the
viscoelasticity of mucus (in this case through addition of cationic agents) would influence shear-
induced bioaerosol generation.

66
References:
1. Lai, S.; Wang, Y.; Wirtz, D.; Hanes, J (2008) Adv. Drug Deliv. Rev. 61(2): 86-100
2. Crowther, S.; Marriott, C. (1984) J. Pharm. Pharmacol. 36(1): 21-26
3. Tippe, A.; Korbel, R.; Ziesenis, A.; Heyder, J. (1998) Scand. J. Clin. Lab. Invest. 58(3): 259-264
4. Galabert, C.; Jacquot, J.;Zahm, J.; Puchelle, E. (1987) Int. J. Clin. Chem. 164: 139-149
5. Lopez-Vidriero, M.; Reid, L. (1978) Br. Med. Bull. 34: 63-74
6. Sims, D.; Westfall, J.; Kiorpes, A.; Horne, M. (1991) Biotech. Histochem. 66: 173-180
7. Zayas, G.; Dimitry, J.; Zayas, A.; O’Brien, D.; King, M. (2005) BMC Pulm. Med. 5: 11
8. Gong, D.; Turner, B.; Bhaskar, K.; LaMont, J. (1990) Am. J. Physiol. 259: 681-686
9. Lehr, C. (2002) Cell Culture Models of Biological Barriers: In vitro Test Systems for Drug absorption and
Delivery Ch. 13: 211-227
10. Rogers, D.; Lethem, M. (1997) Airway Mucus: Basic Mechanisms and Clinical Perspectives, Ch.11-12:
275-326
11. Verdugo, P.; Deyrup-Olsen, I.; Aitken, M.; Villalon, M.; Johnson, D. (1987) J. Dent. Res. 66(2): 506-508
12. Marriott, C.; Litt, M. (1978) J. Pharm. Pharmacol. 30: 9p
13. Marriott, C.; Shih, C.; Litt, M. (1979) Biorheology 16(4-5): 331-337
14. Lai, S.; Wang, Y.;Cone, R.;Wirtz, D.; Hanes, J. (2009) PLoS One 4(1): 4294
15. Macklem, P. T.; Proctor, D. F.; Hogg, J. C. (1970) Respir Phsysiol.8:191–203
16. Moriarty, J.; Grotberg, J. (1999) J. Fluid Mech. 397: 1–22
17. Edwards, D.; Man, J.; Brand, P.; Katstra, J.; Sommerer, K.; Stone, H.; Nardell, E.; Scheuch, G.
(2004)PNAS 101(50): 17383-17388
18. Watanabe, W.; Thomas, M.; Clarke, R.; Klibanov, A.; Langer, R.; Katstra, K.;Fuller, G.; Griele, L.; Fiegel,
J.; Edwards, D. (2007)J Colloid Interface Sci. 307(1): 71–78
19. Lutz, R.; Litt, M.; Chakrin, L. (1973) Rheology of biological systems 119
20. King, M.; Macklem, P. (1977) J. Appl. Physiol. 42: 797-802
21. Lethem, M.; James, S.; Marriott, C. (1990) Am. Rev. Respir. Dis. 142: 1053-1058

67
Chapter 5: Preventing bioaerosol transport by modifying mucus viscoelasticity
Introduction:
In Chapter 4, a correlation between mucus viscoelasticity and droplets generated by
cough-induced surface-shearing was established and confirmed the second hypothesis. Mucus
viscoelasticity was modified through cationic exposure. These results were in agreement with
published work performed by Edwards et al.9, Watanabe et al.
10 and Clarke et al.
11 and can be
applied in vitro to determine how modifying mucus viscoelasticity influences the transport of
pathogens via bioaerosols. Pathogen transport will be established for both bacteria and viruses,
after which the effect of cationic treatment of infected mucus will be explored in order to test the
third hypothesis, which states:
Reducing the number of bioaerosols generated decreases the
probability of pathogen transport, and therefore the
transmission of infection.
Calcium was selected as the appropriate cation to modify the viscoelasticity of COPD
sputum based upon the increased sensitivity observed in the previous chapter. This will be
investigated using a modified version of the simulated cough system previously developed.
Background:
Attempts to collect pathogen from expelled droplets have advanced significantly from the
large-droplet impaction studies of Duguid12
in the 1940s. Modern methods include impactors,
which are designed such that the air flow path enters through one end of the device and must
curve sharply to pass around a large dish or plate (or a series of plates), before exiting out the
other end. This creates the potential for inertial impaction (onto the plate) of particles within the
air stream that are too aerodynamically large to follow the air flow path around the dish. Multiple

68
stages with varying size cut-offs can be used to determine the size distribution. Liquid impingers
operate in a similar fashion, but particles are collected in liquid, rather than deposited directly
onto plates.
Airborne transmission has been successfully demonstrated between animals: in 1962
Riley et al.13
published a study in which guinea pigs that were exposed to air from a tuberculosis
ward became infected. Autopsies of the infected guinea pigs revealed that only a single
infectious droplet was necessary to initiate infection. In 2011, A. Nalca and D. Nichols14
published results demonstrating bioaerosol transmission of rabbit pox between healthy and
infected rabbits. Unpublished work by members of Pulmatrix15
, Inc. has also shown disease
transmission by aerosol in cattle and pigs, as well as a reduction in transmission via cationic
treatment, however no direct measurements of the properties of the animals’ airway mucus was
possible. Hence the need for an in vitro system to monitor pathogen transmission under
controlled settings in which the mucus properties can be measured and treatment effects
analyzed.
Test system development:
The simulated cough system presented in chapters 3 and 4 was modified as follows: the
Exhalair system (for measuring droplet number and size) was replaced by a single-stage viable
Anderson Cascade Impactor (viable-ACI, Thermo Scientific, Waltham, MA). Viable-ACIs can
be single- or multi-stage, and are used to characterize the number, aerodynamic size and size
distribution of airborne, biologically-active particles. The impactor was placed approximately 15
centimeters downstream from the pseudo-trachea with a trap between them to prevent sample
material from being pushed into the impactor. A schematic of the complete system is shown in
Figure 5.1. An ULPA filter was placed after the impactor to collect any droplets which did not
deposit and remained airborne.
a petri dish, co
in the impactor. The cough maneuver was then initiated: any droplets formed travel to the
impactor, where they may contaminate the receptor material within the petri dish. A
the petri dish was removed and the receptor material was either placed directly into an incubator
(agar plates) or removed and placed over cell cultures (cell media). These were subsequently
observed for the presence of pathogens.
Figure 5.1. An ULPA filter was placed after the impactor to collect any droplets which did not
deposit and remained airborne.
The mucus sample was loaded into the pseudo
a petri dish, co
in the impactor. The cough maneuver was then initiated: any droplets formed travel to the
impactor, where they may contaminate the receptor material within the petri dish. A
the petri dish was removed and the receptor material was either placed directly into an incubator
(agar plates) or removed and placed over cell cultures (cell media). These were subsequently
observed for the presence of pathogens.
Figure 5.1:
Filter; (3) Pseudo
Figure 5.1. An ULPA filter was placed after the impactor to collect any droplets which did not
deposit and remained airborne.
The mucus sample was loaded into the pseudo
a petri dish, containing appropriate receptor material, such as agar gel or cell media, was placed
in the impactor. The cough maneuver was then initiated: any droplets formed travel to the
impactor, where they may contaminate the receptor material within the petri dish. A
the petri dish was removed and the receptor material was either placed directly into an incubator
(agar plates) or removed and placed over cell cultures (cell media). These were subsequently
observed for the presence of pathogens.
Figure 5.1:
Filter; (3) Pseudo
Figure 5.1. An ULPA filter was placed after the impactor to collect any droplets which did not
deposit and remained airborne.
The mucus sample was loaded into the pseudo
ntaining appropriate receptor material, such as agar gel or cell media, was placed
in the impactor. The cough maneuver was then initiated: any droplets formed travel to the
impactor, where they may contaminate the receptor material within the petri dish. A
the petri dish was removed and the receptor material was either placed directly into an incubator
(agar plates) or removed and placed over cell cultures (cell media). These were subsequently
observed for the presence of pathogens.
Figure 5.1: Schematic of experimental transmission system: (1) Breathing Simulator;(2) ULPA
Filter; (3) Pseudo
Figure 5.1. An ULPA filter was placed after the impactor to collect any droplets which did not
deposit and remained airborne.
The mucus sample was loaded into the pseudo
ntaining appropriate receptor material, such as agar gel or cell media, was placed
in the impactor. The cough maneuver was then initiated: any droplets formed travel to the
impactor, where they may contaminate the receptor material within the petri dish. A
the petri dish was removed and the receptor material was either placed directly into an incubator
(agar plates) or removed and placed over cell cultures (cell media). These were subsequently
observed for the presence of pathogens.
Schematic of experimental transmission system: (1) Breathing Simulator;(2) ULPA
Filter; (3) Pseudo-trachea; (4) Impactor; (5)
Figure 5.1. An ULPA filter was placed after the impactor to collect any droplets which did not
deposit and remained airborne.
The mucus sample was loaded into the pseudo
ntaining appropriate receptor material, such as agar gel or cell media, was placed
in the impactor. The cough maneuver was then initiated: any droplets formed travel to the
impactor, where they may contaminate the receptor material within the petri dish. A
the petri dish was removed and the receptor material was either placed directly into an incubator
(agar plates) or removed and placed over cell cultures (cell media). These were subsequently
observed for the presence of pathogens.
Schematic of experimental transmission system: (1) Breathing Simulator;(2) ULPA
trachea; (4) Impactor; (5)
Figure 5.1. An ULPA filter was placed after the impactor to collect any droplets which did not
The mucus sample was loaded into the pseudo
ntaining appropriate receptor material, such as agar gel or cell media, was placed
in the impactor. The cough maneuver was then initiated: any droplets formed travel to the
impactor, where they may contaminate the receptor material within the petri dish. A
the petri dish was removed and the receptor material was either placed directly into an incubator
(agar plates) or removed and placed over cell cultures (cell media). These were subsequently
Schematic of experimental transmission system: (1) Breathing Simulator;(2) ULPA
trachea; (4) Impactor; (5)
69
Figure 5.1. An ULPA filter was placed after the impactor to collect any droplets which did not
The mucus sample was loaded into the pseudo
ntaining appropriate receptor material, such as agar gel or cell media, was placed
in the impactor. The cough maneuver was then initiated: any droplets formed travel to the
impactor, where they may contaminate the receptor material within the petri dish. A
the petri dish was removed and the receptor material was either placed directly into an incubator
(agar plates) or removed and placed over cell cultures (cell media). These were subsequently
Schematic of experimental transmission system: (1) Breathing Simulator;(2) ULPA
trachea; (4) Impactor; (5) Contaminated
Figure 5.1. An ULPA filter was placed after the impactor to collect any droplets which did not
The mucus sample was loaded into the pseudo
ntaining appropriate receptor material, such as agar gel or cell media, was placed
in the impactor. The cough maneuver was then initiated: any droplets formed travel to the
impactor, where they may contaminate the receptor material within the petri dish. A
the petri dish was removed and the receptor material was either placed directly into an incubator
(agar plates) or removed and placed over cell cultures (cell media). These were subsequently
Schematic of experimental transmission system: (1) Breathing Simulator;(2) ULPA
Contaminated
Figure 5.1. An ULPA filter was placed after the impactor to collect any droplets which did not
The mucus sample was loaded into the pseudo-
ntaining appropriate receptor material, such as agar gel or cell media, was placed
in the impactor. The cough maneuver was then initiated: any droplets formed travel to the
impactor, where they may contaminate the receptor material within the petri dish. A
the petri dish was removed and the receptor material was either placed directly into an incubator
(agar plates) or removed and placed over cell cultures (cell media). These were subsequently
Schematic of experimental transmission system: (1) Breathing Simulator;(2) ULPA
Contaminated
Figure 5.1. An ULPA filter was placed after the impactor to collect any droplets which did not
-trachea within a particle free biohood, and
ntaining appropriate receptor material, such as agar gel or cell media, was placed
in the impactor. The cough maneuver was then initiated: any droplets formed travel to the
impactor, where they may contaminate the receptor material within the petri dish. A
the petri dish was removed and the receptor material was either placed directly into an incubator
(agar plates) or removed and placed over cell cultures (cell media). These were subsequently
Schematic of experimental transmission system: (1) Breathing Simulator;(2) ULPA
Contaminated
Figure 5.1. An ULPA filter was placed after the impactor to collect any droplets which did not
trachea within a particle free biohood, and
ntaining appropriate receptor material, such as agar gel or cell media, was placed
in the impactor. The cough maneuver was then initiated: any droplets formed travel to the
impactor, where they may contaminate the receptor material within the petri dish. A
the petri dish was removed and the receptor material was either placed directly into an incubator
(agar plates) or removed and placed over cell cultures (cell media). These were subsequently
Schematic of experimental transmission system: (1) Breathing Simulator;(2) ULPA
Contaminated petri dish with agar/media
Figure 5.1. An ULPA filter was placed after the impactor to collect any droplets which did not
trachea within a particle free biohood, and
ntaining appropriate receptor material, such as agar gel or cell media, was placed
in the impactor. The cough maneuver was then initiated: any droplets formed travel to the
impactor, where they may contaminate the receptor material within the petri dish. A
the petri dish was removed and the receptor material was either placed directly into an incubator
(agar plates) or removed and placed over cell cultures (cell media). These were subsequently
Schematic of experimental transmission system: (1) Breathing Simulator;(2) ULPA
petri dish with agar/media
Figure 5.1. An ULPA filter was placed after the impactor to collect any droplets which did not
trachea within a particle free biohood, and
ntaining appropriate receptor material, such as agar gel or cell media, was placed
in the impactor. The cough maneuver was then initiated: any droplets formed travel to the
impactor, where they may contaminate the receptor material within the petri dish. Afterwards,
the petri dish was removed and the receptor material was either placed directly into an incubator
(agar plates) or removed and placed over cell cultures (cell media). These were subsequently
Schematic of experimental transmission system: (1) Breathing Simulator;(2) ULPA
petri dish with agar/media
Figure 5.1. An ULPA filter was placed after the impactor to collect any droplets which did not
trachea within a particle free biohood, and
ntaining appropriate receptor material, such as agar gel or cell media, was placed
in the impactor. The cough maneuver was then initiated: any droplets formed travel to the
fterwards,
the petri dish was removed and the receptor material was either placed directly into an incubator
(agar plates) or removed and placed over cell cultures (cell media). These were subsequently
Schematic of experimental transmission system: (1) Breathing Simulator;(2) ULPA
Figure 5.1. An ULPA filter was placed after the impactor to collect any droplets which did not
trachea within a particle free biohood, and
ntaining appropriate receptor material, such as agar gel or cell media, was placed
in the impactor. The cough maneuver was then initiated: any droplets formed travel to the
fterwards,
the petri dish was removed and the receptor material was either placed directly into an incubator
(agar plates) or removed and placed over cell cultures (cell media). These were subsequently
Figure 5.1. An ULPA filter was placed after the impactor to collect any droplets which did not
trachea within a particle free biohood, and
ntaining appropriate receptor material, such as agar gel or cell media, was placed
fterwards,
the petri dish was removed and the receptor material was either placed directly into an incubator
trachea within a particle free biohood, and
ntaining appropriate receptor material, such as agar gel or cell media, was placed
the petri dish was removed and the receptor material was either placed directly into an incubator
trachea within a particle free biohood, and
ntaining appropriate receptor material, such as agar gel or cell media, was placed
the petri dish was removed and the receptor material was either placed directly into an incubator
trachea within a particle free biohood, and

70
Method development:
COPD sputum was used for all mucus samples. All calcium-treated mucus samples were
exposed to a final concentration of 116 mM calcium, which corresponded to the largest increase
in complex modulus and largest decrease in loss tangent (Figure 5.2). The viscoelasticity of all
samples (calcium-treated and untreated) was measured prior to each experiment to confirm
agreement with previous results.
An unknown bacterium was present in the raw mucus samples. Plating “neat” sputum on
chocolate agar and incubating at 32oC for 24 hours resulted in the observation of hundreds of
CFU. Sputum was serially diluted with phosphate buffered saline and plated. CFUs of the
unknown bacteria were observed down to a dilution of 1:1000. Calcium-treated sputum yielded
similar results, indicating that there was no direct effect of calcium-treatment (at the selected
concentration) on bacteria quantity; however treatment with an anti-bacterial Penicillin-
Streptomycin (“pen-strep”) solution was able to eliminate the observed bacteria.
The presence of native bacteria in the sputum samples prevented direct addition of known
bacteria for experimental purposes, as all results would be contaminated by the native bacteria.
However, treatment of the mucus with pen-strep was not a functional solution. An effective dose
required too large a volume and produced a diluting effect on the mucus samples. It would also
have required that any subsequently added bacteria be resistant to both penicillin and
streptomycin.

71
Figure 5.2: Changes in COPD sputum viscoelasticity resulting from calcium treatment
The native bacteria did present an opportunity to test the system for proof-of-concept
with a simple positive/negative outcome (i.e. bacteria is either present or not present for a given
mucus sample or condition). Three conditions were tested: no mucus (to check for background
contamination), untreated mucus (to establish positive bacterial transport) and calcium-treated
mucus (to determine effectiveness of cationic treatment). Each sample was loaded into the
pseudo-trachea and spread over a fixed area before initiating the cough. Chocolate agar plates
were used in the impactor to collect droplets (and enable the growth of any bacteria that reached
them). The plates were incubated at 32oC for up to 48 hours post-exposure. They were then
observed for bacterial growth and CFUs were counted by hand. Results are shown in Figure 5.3.

72
Figure 5.3: CFU of native bacteria observed 48 hours after cough exposure
As expected, when no mucus was used, no bacteria were observed on the agar plates,
confirming a clean, uncontaminated background. When untreated mucus was tested, a small
number of CFU were observed (5.2±1.9 CFU), indicating that at least a few bacteria were
successfully transported via droplets and thereby providing a positive control for the system.
When the mucus was treated with calcium, fewer CFU were observed (0.2±0.45 CFU) – four out
of five replicates did not show any CFU at 48 hours. A t-test confirmed that the difference
observed between the sample groups is statistically significant (p < 0.0024). Hence, the proof-of-
concept for the simulated cough and impactor system was successful; furthermore, cationic
treatment of mucus (to increase viscoelasticity) was demonstrated to reduce bacterial transport
via airborne droplets.

73
Viral Transport:
Human rhinovirus (HRV) was used to examine viral transport: it was selected due to its
prevalence as well its robustness. HRVs are considered the primary cause of the common cold,
and are amongst the most common viral pathogens in humans. They can infect both the upper
and lower respiratory tract, although they are primarily an upper respiratory tract disease. HRVs
grow optimally at 31-33oC (which is the typical temperature in the upper airways). They are
extremely small, with a diameter of approximately 30 nanometers.4
The first step in an HRV infection begins when the virus attaches to Inter-Cellular
Adhesion Molecule 1 (ICAM-1), a surface protein found on epithelial cells (Figure 5.4). This
attachment occurs rapidly after exposure, typically occurring within 15 minutes, and causes a
conformational change in the virus which triggers the release and transport of viral RNA into the
cell,5 however, symptoms do not typically appear for another 1 to 4 days after infection. HRV
remains functionally intact in solution, at room temperature, for over an hour. This is significant,
as it allows sufficient time for sample preparation and experimentation (as compared to
influenza, which degrades much more rapidly and would require accelerated experimental
protocols).

cultures of an HRV
were exposed to HRV at varyi
and subsequently observed for cell death over 96 hours. This resulted in a set of data involving
the time
e
time of death post
calcium treatment would directly influence HRV activity, HRV was add
of CaCl
was then directly added to HRV
with the equivalent reference standard, ind
of CaCl
cultures of an HRV
were exposed to HRV at varyi
and subsequently observed for cell death over 96 hours. This resulted in a set of data involving
the time
experiments to approximate the amount of virus that cells had been exposed to (using only the
time of death post
calcium treatment would directly influence HRV activity, HRV was add
of CaCl
was then directly added to HRV
with the equivalent reference standard, ind
of CaCl
cultures of an HRV
were exposed to HRV at varyi
and subsequently observed for cell death over 96 hours. This resulted in a set of data involving
the time
xperiments to approximate the amount of virus that cells had been exposed to (using only the
time of death post
calcium treatment would directly influence HRV activity, HRV was add
of CaCl
was then directly added to HRV
with the equivalent reference standard, ind
of CaCl
In order to create a reference standard for cell death following viral exposure, cell
cultures of an HRV
were exposed to HRV at varyi
and subsequently observed for cell death over 96 hours. This resulted in a set of data involving
the time-
xperiments to approximate the amount of virus that cells had been exposed to (using only the
time of death post
calcium treatment would directly influence HRV activity, HRV was add
of CaCl2
was then directly added to HRV
with the equivalent reference standard, ind
of CaCl2
In order to create a reference standard for cell death following viral exposure, cell
cultures of an HRV
were exposed to HRV at varyi
and subsequently observed for cell death over 96 hours. This resulted in a set of data involving
-to
xperiments to approximate the amount of virus that cells had been exposed to (using only the
time of death post
calcium treatment would directly influence HRV activity, HRV was add
2 in cell culture media and incubated at room temperature for 15 minutes. The solution
was then directly added to HRV
with the equivalent reference standard, ind
2.
In order to create a reference standard for cell death following viral exposure, cell
cultures of an HRV
were exposed to HRV at varyi
and subsequently observed for cell death over 96 hours. This resulted in a set of data involving
to
xperiments to approximate the amount of virus that cells had been exposed to (using only the
time of death post
calcium treatment would directly influence HRV activity, HRV was add
in cell culture media and incubated at room temperature for 15 minutes. The solution
was then directly added to HRV
with the equivalent reference standard, ind
In order to create a reference standard for cell death following viral exposure, cell
cultures of an HRV
were exposed to HRV at varyi
and subsequently observed for cell death over 96 hours. This resulted in a set of data involving
to-
xperiments to approximate the amount of virus that cells had been exposed to (using only the
time of death post
calcium treatment would directly influence HRV activity, HRV was add
in cell culture media and incubated at room temperature for 15 minutes. The solution
was then directly added to HRV
with the equivalent reference standard, ind
In order to create a reference standard for cell death following viral exposure, cell
cultures of an HRV
were exposed to HRV at varyi
and subsequently observed for cell death over 96 hours. This resulted in a set of data involving
-death of cell cultures at known MoI which could be referenced against future
xperiments to approximate the amount of virus that cells had been exposed to (using only the
time of death post
calcium treatment would directly influence HRV activity, HRV was add
in cell culture media and incubated at room temperature for 15 minutes. The solution
was then directly added to HRV
with the equivalent reference standard, ind
In order to create a reference standard for cell death following viral exposure, cell
cultures of an HRV
were exposed to HRV at varyi
and subsequently observed for cell death over 96 hours. This resulted in a set of data involving
death of cell cultures at known MoI which could be referenced against future
xperiments to approximate the amount of virus that cells had been exposed to (using only the
time of death post-
calcium treatment would directly influence HRV activity, HRV was add
in cell culture media and incubated at room temperature for 15 minutes. The solution
was then directly added to HRV
with the equivalent reference standard, ind
In order to create a reference standard for cell death following viral exposure, cell
cultures of an HRV
were exposed to HRV at varyi
and subsequently observed for cell death over 96 hours. This resulted in a set of data involving
death of cell cultures at known MoI which could be referenced against future
xperiments to approximate the amount of virus that cells had been exposed to (using only the
-exposure). Results are included in
calcium treatment would directly influence HRV activity, HRV was add
in cell culture media and incubated at room temperature for 15 minutes. The solution
was then directly added to HRV
with the equivalent reference standard, ind
In order to create a reference standard for cell death following viral exposure, cell
cultures of an HRV-
were exposed to HRV at varyi
and subsequently observed for cell death over 96 hours. This resulted in a set of data involving
death of cell cultures at known MoI which could be referenced against future
xperiments to approximate the amount of virus that cells had been exposed to (using only the
exposure). Results are included in
calcium treatment would directly influence HRV activity, HRV was add
in cell culture media and incubated at room temperature for 15 minutes. The solution
was then directly added to HRV
with the equivalent reference standard, ind
Figure 5.
In order to create a reference standard for cell death following viral exposure, cell
-sensitized HeLa phenotype (selected for increased expression of ICAM
were exposed to HRV at varyi
and subsequently observed for cell death over 96 hours. This resulted in a set of data involving
death of cell cultures at known MoI which could be referenced against future
xperiments to approximate the amount of virus that cells had been exposed to (using only the
exposure). Results are included in
calcium treatment would directly influence HRV activity, HRV was add
in cell culture media and incubated at room temperature for 15 minutes. The solution
was then directly added to HRV
with the equivalent reference standard, ind
Figure 5.
In order to create a reference standard for cell death following viral exposure, cell
sensitized HeLa phenotype (selected for increased expression of ICAM
were exposed to HRV at varyi
and subsequently observed for cell death over 96 hours. This resulted in a set of data involving
death of cell cultures at known MoI which could be referenced against future
xperiments to approximate the amount of virus that cells had been exposed to (using only the
exposure). Results are included in
calcium treatment would directly influence HRV activity, HRV was add
in cell culture media and incubated at room temperature for 15 minutes. The solution
was then directly added to HRV
with the equivalent reference standard, ind
Figure 5.4
In order to create a reference standard for cell death following viral exposure, cell
sensitized HeLa phenotype (selected for increased expression of ICAM
were exposed to HRV at varyi
and subsequently observed for cell death over 96 hours. This resulted in a set of data involving
death of cell cultures at known MoI which could be referenced against future
xperiments to approximate the amount of virus that cells had been exposed to (using only the
exposure). Results are included in
calcium treatment would directly influence HRV activity, HRV was add
in cell culture media and incubated at room temperature for 15 minutes. The solution
was then directly added to HRV
with the equivalent reference standard, ind
4: HRV at
In order to create a reference standard for cell death following viral exposure, cell
sensitized HeLa phenotype (selected for increased expression of ICAM
were exposed to HRV at varyi
and subsequently observed for cell death over 96 hours. This resulted in a set of data involving
death of cell cultures at known MoI which could be referenced against future
xperiments to approximate the amount of virus that cells had been exposed to (using only the
exposure). Results are included in
calcium treatment would directly influence HRV activity, HRV was add
in cell culture media and incubated at room temperature for 15 minutes. The solution
was then directly added to HRV
with the equivalent reference standard, ind
: HRV at
In order to create a reference standard for cell death following viral exposure, cell
sensitized HeLa phenotype (selected for increased expression of ICAM
were exposed to HRV at varying multiplicity of infection (MoI)
and subsequently observed for cell death over 96 hours. This resulted in a set of data involving
death of cell cultures at known MoI which could be referenced against future
xperiments to approximate the amount of virus that cells had been exposed to (using only the
exposure). Results are included in
calcium treatment would directly influence HRV activity, HRV was add
in cell culture media and incubated at room temperature for 15 minutes. The solution
was then directly added to HRV
with the equivalent reference standard, ind
: HRV at
In order to create a reference standard for cell death following viral exposure, cell
sensitized HeLa phenotype (selected for increased expression of ICAM
ng multiplicity of infection (MoI)
and subsequently observed for cell death over 96 hours. This resulted in a set of data involving
death of cell cultures at known MoI which could be referenced against future
xperiments to approximate the amount of virus that cells had been exposed to (using only the
exposure). Results are included in
calcium treatment would directly influence HRV activity, HRV was add
in cell culture media and incubated at room temperature for 15 minutes. The solution
was then directly added to HRV-sensitized HeLa cell cultures. Cell death followed in accordance
with the equivalent reference standard, ind
: HRV at
In order to create a reference standard for cell death following viral exposure, cell
sensitized HeLa phenotype (selected for increased expression of ICAM
ng multiplicity of infection (MoI)
and subsequently observed for cell death over 96 hours. This resulted in a set of data involving
death of cell cultures at known MoI which could be referenced against future
xperiments to approximate the amount of virus that cells had been exposed to (using only the
exposure). Results are included in
calcium treatment would directly influence HRV activity, HRV was add
in cell culture media and incubated at room temperature for 15 minutes. The solution
sensitized HeLa cell cultures. Cell death followed in accordance
with the equivalent reference standard, ind
: HRV attached to a cell via
In order to create a reference standard for cell death following viral exposure, cell
sensitized HeLa phenotype (selected for increased expression of ICAM
ng multiplicity of infection (MoI)
and subsequently observed for cell death over 96 hours. This resulted in a set of data involving
death of cell cultures at known MoI which could be referenced against future
xperiments to approximate the amount of virus that cells had been exposed to (using only the
exposure). Results are included in
calcium treatment would directly influence HRV activity, HRV was add
in cell culture media and incubated at room temperature for 15 minutes. The solution
sensitized HeLa cell cultures. Cell death followed in accordance
with the equivalent reference standard, ind
tached to a cell via
In order to create a reference standard for cell death following viral exposure, cell
sensitized HeLa phenotype (selected for increased expression of ICAM
ng multiplicity of infection (MoI)
and subsequently observed for cell death over 96 hours. This resulted in a set of data involving
death of cell cultures at known MoI which could be referenced against future
xperiments to approximate the amount of virus that cells had been exposed to (using only the
exposure). Results are included in
calcium treatment would directly influence HRV activity, HRV was add
in cell culture media and incubated at room temperature for 15 minutes. The solution
sensitized HeLa cell cultures. Cell death followed in accordance
with the equivalent reference standard, indicating that the HRV remained active in the presence
tached to a cell via
In order to create a reference standard for cell death following viral exposure, cell
sensitized HeLa phenotype (selected for increased expression of ICAM
ng multiplicity of infection (MoI)
and subsequently observed for cell death over 96 hours. This resulted in a set of data involving
death of cell cultures at known MoI which could be referenced against future
xperiments to approximate the amount of virus that cells had been exposed to (using only the
exposure). Results are included in
calcium treatment would directly influence HRV activity, HRV was add
in cell culture media and incubated at room temperature for 15 minutes. The solution
sensitized HeLa cell cultures. Cell death followed in accordance
icating that the HRV remained active in the presence
74
tached to a cell via
In order to create a reference standard for cell death following viral exposure, cell
sensitized HeLa phenotype (selected for increased expression of ICAM
ng multiplicity of infection (MoI)
and subsequently observed for cell death over 96 hours. This resulted in a set of data involving
death of cell cultures at known MoI which could be referenced against future
xperiments to approximate the amount of virus that cells had been exposed to (using only the
exposure). Results are included in
calcium treatment would directly influence HRV activity, HRV was add
in cell culture media and incubated at room temperature for 15 minutes. The solution
sensitized HeLa cell cultures. Cell death followed in accordance
icating that the HRV remained active in the presence
the surface protein
In order to create a reference standard for cell death following viral exposure, cell
sensitized HeLa phenotype (selected for increased expression of ICAM
ng multiplicity of infection (MoI)
and subsequently observed for cell death over 96 hours. This resulted in a set of data involving
death of cell cultures at known MoI which could be referenced against future
xperiments to approximate the amount of virus that cells had been exposed to (using only the
Table 5.1
calcium treatment would directly influence HRV activity, HRV was add
in cell culture media and incubated at room temperature for 15 minutes. The solution
sensitized HeLa cell cultures. Cell death followed in accordance
icating that the HRV remained active in the presence
the surface protein
In order to create a reference standard for cell death following viral exposure, cell
sensitized HeLa phenotype (selected for increased expression of ICAM
ng multiplicity of infection (MoI)
and subsequently observed for cell death over 96 hours. This resulted in a set of data involving
death of cell cultures at known MoI which could be referenced against future
xperiments to approximate the amount of virus that cells had been exposed to (using only the
Table 5.1. Additionally, to test whether
calcium treatment would directly influence HRV activity, HRV was add
in cell culture media and incubated at room temperature for 15 minutes. The solution
sensitized HeLa cell cultures. Cell death followed in accordance
icating that the HRV remained active in the presence
the surface protein
In order to create a reference standard for cell death following viral exposure, cell
sensitized HeLa phenotype (selected for increased expression of ICAM
ng multiplicity of infection (MoI)
and subsequently observed for cell death over 96 hours. This resulted in a set of data involving
death of cell cultures at known MoI which could be referenced against future
xperiments to approximate the amount of virus that cells had been exposed to (using only the
. Additionally, to test whether
calcium treatment would directly influence HRV activity, HRV was add
in cell culture media and incubated at room temperature for 15 minutes. The solution
sensitized HeLa cell cultures. Cell death followed in accordance
icating that the HRV remained active in the presence
the surface protein
In order to create a reference standard for cell death following viral exposure, cell
sensitized HeLa phenotype (selected for increased expression of ICAM
ng multiplicity of infection (MoI) –
and subsequently observed for cell death over 96 hours. This resulted in a set of data involving
death of cell cultures at known MoI which could be referenced against future
xperiments to approximate the amount of virus that cells had been exposed to (using only the
. Additionally, to test whether
calcium treatment would directly influence HRV activity, HRV was add
in cell culture media and incubated at room temperature for 15 minutes. The solution
sensitized HeLa cell cultures. Cell death followed in accordance
icating that the HRV remained active in the presence
the surface protein
In order to create a reference standard for cell death following viral exposure, cell
sensitized HeLa phenotype (selected for increased expression of ICAM
–
and subsequently observed for cell death over 96 hours. This resulted in a set of data involving
death of cell cultures at known MoI which could be referenced against future
xperiments to approximate the amount of virus that cells had been exposed to (using only the
. Additionally, to test whether
calcium treatment would directly influence HRV activity, HRV was add
in cell culture media and incubated at room temperature for 15 minutes. The solution
sensitized HeLa cell cultures. Cell death followed in accordance
icating that the HRV remained active in the presence
the surface protein
In order to create a reference standard for cell death following viral exposure, cell
sensitized HeLa phenotype (selected for increased expression of ICAM
the ratio of virions to cells
and subsequently observed for cell death over 96 hours. This resulted in a set of data involving
death of cell cultures at known MoI which could be referenced against future
xperiments to approximate the amount of virus that cells had been exposed to (using only the
. Additionally, to test whether
calcium treatment would directly influence HRV activity, HRV was add
in cell culture media and incubated at room temperature for 15 minutes. The solution
sensitized HeLa cell cultures. Cell death followed in accordance
icating that the HRV remained active in the presence
ICAM
In order to create a reference standard for cell death following viral exposure, cell
sensitized HeLa phenotype (selected for increased expression of ICAM
the ratio of virions to cells
and subsequently observed for cell death over 96 hours. This resulted in a set of data involving
death of cell cultures at known MoI which could be referenced against future
xperiments to approximate the amount of virus that cells had been exposed to (using only the
. Additionally, to test whether
calcium treatment would directly influence HRV activity, HRV was added to 116 mM solutions
in cell culture media and incubated at room temperature for 15 minutes. The solution
sensitized HeLa cell cultures. Cell death followed in accordance
icating that the HRV remained active in the presence
ICAM
In order to create a reference standard for cell death following viral exposure, cell
sensitized HeLa phenotype (selected for increased expression of ICAM
the ratio of virions to cells
and subsequently observed for cell death over 96 hours. This resulted in a set of data involving
death of cell cultures at known MoI which could be referenced against future
xperiments to approximate the amount of virus that cells had been exposed to (using only the
. Additionally, to test whether
ed to 116 mM solutions
in cell culture media and incubated at room temperature for 15 minutes. The solution
sensitized HeLa cell cultures. Cell death followed in accordance
icating that the HRV remained active in the presence
ICAM-
In order to create a reference standard for cell death following viral exposure, cell
sensitized HeLa phenotype (selected for increased expression of ICAM
the ratio of virions to cells
and subsequently observed for cell death over 96 hours. This resulted in a set of data involving
death of cell cultures at known MoI which could be referenced against future
xperiments to approximate the amount of virus that cells had been exposed to (using only the
. Additionally, to test whether
ed to 116 mM solutions
in cell culture media and incubated at room temperature for 15 minutes. The solution
sensitized HeLa cell cultures. Cell death followed in accordance
icating that the HRV remained active in the presence
-1.
In order to create a reference standard for cell death following viral exposure, cell
sensitized HeLa phenotype (selected for increased expression of ICAM
the ratio of virions to cells
and subsequently observed for cell death over 96 hours. This resulted in a set of data involving
death of cell cultures at known MoI which could be referenced against future
xperiments to approximate the amount of virus that cells had been exposed to (using only the
. Additionally, to test whether
ed to 116 mM solutions
in cell culture media and incubated at room temperature for 15 minutes. The solution
sensitized HeLa cell cultures. Cell death followed in accordance
icating that the HRV remained active in the presence
1.6
In order to create a reference standard for cell death following viral exposure, cell
sensitized HeLa phenotype (selected for increased expression of ICAM
the ratio of virions to cells
and subsequently observed for cell death over 96 hours. This resulted in a set of data involving
death of cell cultures at known MoI which could be referenced against future
xperiments to approximate the amount of virus that cells had been exposed to (using only the
. Additionally, to test whether
ed to 116 mM solutions
in cell culture media and incubated at room temperature for 15 minutes. The solution
sensitized HeLa cell cultures. Cell death followed in accordance
icating that the HRV remained active in the presence
6
In order to create a reference standard for cell death following viral exposure, cell
sensitized HeLa phenotype (selected for increased expression of ICAM
the ratio of virions to cells
and subsequently observed for cell death over 96 hours. This resulted in a set of data involving
death of cell cultures at known MoI which could be referenced against future
xperiments to approximate the amount of virus that cells had been exposed to (using only the
. Additionally, to test whether
ed to 116 mM solutions
in cell culture media and incubated at room temperature for 15 minutes. The solution
sensitized HeLa cell cultures. Cell death followed in accordance
icating that the HRV remained active in the presence
In order to create a reference standard for cell death following viral exposure, cell
sensitized HeLa phenotype (selected for increased expression of ICAM
the ratio of virions to cells
and subsequently observed for cell death over 96 hours. This resulted in a set of data involving
xperiments to approximate the amount of virus that cells had been exposed to (using only the
. Additionally, to test whether
ed to 116 mM solutions
in cell culture media and incubated at room temperature for 15 minutes. The solution
sensitized HeLa cell cultures. Cell death followed in accordance
icating that the HRV remained active in the presence
sensitized HeLa phenotype (selected for increased expression of ICAM-
the ratio of virions to cells
and subsequently observed for cell death over 96 hours. This resulted in a set of data involving
xperiments to approximate the amount of virus that cells had been exposed to (using only the
. Additionally, to test whether
ed to 116 mM solutions
in cell culture media and incubated at room temperature for 15 minutes. The solution
sensitized HeLa cell cultures. Cell death followed in accordance
icating that the HRV remained active in the presence
-1)
the ratio of virions to cells
and subsequently observed for cell death over 96 hours. This resulted in a set of data involving
xperiments to approximate the amount of virus that cells had been exposed to (using only the
. Additionally, to test whether
ed to 116 mM solutions
in cell culture media and incubated at room temperature for 15 minutes. The solution
sensitized HeLa cell cultures. Cell death followed in accordance
icating that the HRV remained active in the presence
1)
the ratio of virions to cells –
and subsequently observed for cell death over 96 hours. This resulted in a set of data involving
xperiments to approximate the amount of virus that cells had been exposed to (using only the
. Additionally, to test whether
ed to 116 mM solutions
in cell culture media and incubated at room temperature for 15 minutes. The solution
sensitized HeLa cell cultures. Cell death followed in accordance
icating that the HRV remained active in the presence
1)
–
and subsequently observed for cell death over 96 hours. This resulted in a set of data involving
xperiments to approximate the amount of virus that cells had been exposed to (using only the
ed to 116 mM solutions
in cell culture media and incubated at room temperature for 15 minutes. The solution
sensitized HeLa cell cultures. Cell death followed in accordance
icating that the HRV remained active in the presence
1)
and subsequently observed for cell death over 96 hours. This resulted in a set of data involving
ed to 116 mM solutions
sensitized HeLa cell cultures. Cell death followed in accordance
icating that the HRV remained active in the presence
ed to 116 mM solutions
sensitized HeLa cell cultures. Cell death followed in accordance
icating that the HRV remained active in the presence
sensitized HeLa cell cultures. Cell death followed in accordance

75
Results:
Calcium-treated and untreated sputum samples were spiked with approximately 107 HRV
(Rhinovirus 16, ATCC, Manassas, VA) virions and gently agitated for 10 minutes to allow for
complete mixing. No changes were observed in mucus viscoelasticity within 30 minutes of virus
exposure (which was the length of time needed to prepare the samples, then load and run the
simulated cough system). Magnesium fortified cell-culture media was placed in petri dishes and
loaded into the impactor. After cough exposure, the contaminated media was placed on HRV-
sensitized HeLa cell-cultures. The following conditions were tested: untreated sputum without
virus (“neat”); untreated sputum with virus; and calcium-treated sputum with virus. Exposed
cells were incubated at 32oC for 96 hours post-exposure, and assessed visually (via microscopy)
every 24 hours for cell death; results are shown in Table 5.1.
Table 5.1: HeLa cell culture response to cough-contaminated media over 96 hours
No cell death was observed for mucus samples without HRV, or for calcium-treated
mucus samples with HRV. Untreated mucus with HRV showed partial cell death by 72 hours,
76
and complete cell death by 96 hours. Comparing this result to the reference standards yields
similar behavior for an initial MoI of 0.00002, which translates to 100 HRV virions. Combining
this value with the droplet data for untreated mucus (Chapter 4) yields an estimated 0.76 virions
per droplet (or approximately 3 virions per 4 droplets).
Conclusion:
The simulated cough system was modified to include a single-stage impactor in order to
collect droplets produced by cough. Such impactors were developed to analyze the number and
size of airborne contaminates: they utilize inertial impaction to deposit droplets onto plates or
into cell-culture media. The modifications were designed to allow the detection of pathogens
transported as small droplets (which were generated via a simulated cough maneuver). Using
bacteria already present within the COPD sputum as proof-of-concept, the system was shown to
functionally transport these bacteria via cough-induced droplets. Additionally, calcium-treatment
of the mucus successfully prevented or reduced such transport.
Viral transport was then examined by adding HRV to calcium-treated and untreated
mucus and testing them within the simulated cough system. Transport was confirmed by
monitoring HRV-sensitized HeLa cells for death after exposure to cough-contaminated media.
Complete cell death was observed for the untreated mucus samples at 96 hours post-exposure,
which corresponds to a MoI of 0.00002. No cell death was observed for calcium-treated mucus
samples, indicating the successful prevention of airborne infection transmission. These data,
along with the results discussed in Chapter 4, confirm the third hypothesis, indicating that
airborne transmission of infectious disease can be reduced or eliminated through cationic

77
modification of the viscoelastic properties of mucus in such a way as to reduce or prevent droplet
formation.

78
References:
1. Lai, S.; Wang, Y.; Wirtz, D.; Hanes, J (2008) Adv. Drug Deliv. Rev. 61(2): 86-100
2. Foss, S.; Keppel, J. (1999) Resp. Care 44(12): 1474-1485
3. Gustin, K.; Belser, J.; Wadford, D.; Pearce, M.; Katz, J.; Tumpey, T.; Maines, T. (2011) PNAS 108(20):
8432-8437
4. Abraham, G.; Colonno, R. (1984) Journal of Virology 51(2): 340-345
5. Lessler, J.; Reich, N.; Brookmeyer, R.; Perl, T.; Nelson, K.; Cummings, D. (2009) The Lancet Journal of
Infectious Diseases 9(5); 291-300
6. jin-lab.org/wiki/research
7. Qian, J.; Hospodsky, D.; Yamamoto, N.; Nazaroff, W.; Peccia, J. (2012) Indoor Airdoi: 10.1111/j.1600-
0668.2012.00769.x
8. Yang, Y.; Sze-To, G.; Chao, C. (2012) J. Aerosol Sci. Tech. 46: 1-12
9. Edwards, D.; Man, J.; Brand, P.; Katstra, J.; Sommerer, K.; Stone, H.; Nardell, E.; Scheuch, G.
(2004)PNAS 101(50): 17383-17388
10. Watanabe, W.; Thomas, M.; Clarke, R.; Klibanov, A.; Langer, R.; Katstra, K.;Fuller, G.; Griele, L.; Fiegel,
J.; Edwards, D. (2007)J Colloid Interface Sci. 307(1): 71–78
11. Clarke, R.; Katstra, J.;Man, J.;Dehaan, W.;Edwards, D.;Griel, L. (2005)American J Infection Control33(5):
85
12. Duguid, J. (1946) British Medical Journal 265-268
13. Riley, R.; Mills, C.; O'Grady, F. (1962)Am Rev Respir Dis 84:511-525
14. Nalca, A.; Nichols, D. (2011) J Gen Virol. 92: 31-35
15. Discussions with Clarke, R.; Sung, J.; Lipp, M.; and Edwards, D.
79
Chapter 6: Conclusions and further work
Introduction:
The goal of this research has been to study the formation and transport of pathogen-laden
droplets from the human pulmonary system, and to investigate the impact of mucus
viscoelasticity on that formation. This was accomplished through the exploration of a series of
related hypotheses, which were tested through the development of bench-top models for in vitro
assessments of the relevant processes. As the role of bioaerosols in infection transmission
becomes increasingly prominent, new ways of thinking about the problem and new tools for
combating it are needed. The motivation behind this work is clear: to prevent airborne
transmission of infectious diseases (as bioaerosols) by providing the tools necessary to reliably
screen source-treatment methods.
Three hypotheses were examined:
iv) Droplet generation during tidal breathing can occur in both the
upper airways (via surface shear) and lower airways (via film
rupture) during inhalation, and will vary with bifurcation angle
in the upper airways.
v) Mucus viscoelasticity will influence droplet formation by shear
forces, with increased stiffness yielding fewer droplets in total.
vi) Reducing the number of bioaerosols generated decreases the
probability of pathogen transport, and therefore the
transmission of infection.

80
These three hypotheses were confirmed empirically, utilizing novel in vitro systems
designed to mimic the physiological conditions of droplet generation. The first hypothesis tells
us that bioaerosol formation during tidal breathing is more complex than recent published studies
on expired droplets suggest, and may require treating both upper and lower airway sources, both
of which can occur during inhalation. It also raises questions about the role of bioaerosols in
auto-infection. The second hypothesis confirms that altering the physical properties of mucus is
an effective method for reducing bioaerosol load. Finally, the third hypothesis shows that
targeting bioaerosol formation can effectively prevent or reduce airborne transmission by small
droplets.
The small droplet hypothesis itself was established through a review of the relevant
literature, and states that small droplets (less than a few microns in diameter) are generated in the
airways, and exhaled to the environment, where they may persist until they are inhaled by others.
These small droplets are produced in significantly greater quantity than larger droplets, as
initially reported by Papineni and Rosenthal (1997)1, in contrast with the previously accepted
notions of expelled droplets. These droplets are composed of airway lining fluid (ALF) and may
contain pathogens and other material present in the airways. When inhaled, these droplets can
deposit within the pulmonary system, where pathogens can establish a new infection.
Formation and transport mechanisms:
Two potential mechanisms for droplet formation were investigated: the long-held theory
involving shear-induced wave-instabilities at the surface of the ALF in the upper airways, as
demonstrated computationally by Moriarty and Grotberg (1999)2; and film rupture within
expanding bronchioles in the lower airways (a process which occurs during inhalation), as

81
proposed by Johnson and Morawska (2009)3. The former is applicable to both tidal breathing and
coughing. The latter has recently come to prominence due to research on expelled droplet
number as a function of tidal breathing pattern, which supports the theory that droplets are
formed during inhalation.
Most studies on droplet generation in the upper airways have focused on the exhalation
phase of tidal breathing, however based on the experiments performed by Chowdhary et al.
(1999)4 and the computational analyses of tidal air flow in the lungs made by Green (2003)
5 and
Wang et al. (2009)6, which showed that, for tidal breathing, peak wall shear stress can occur
along the inner wall directly past the first and second bifurcations during inhalation, the first
hypothesis was developed. These studies indicate that droplet formation during tidal breathing in
the upper airways is more likely to occur during inhalation, which not only has implications for
auto-infection, but also suggests that the expelled droplet data reported by Johnson and
Morawska may be applicable to both the lower and the upper airway mechanisms. Regardless,
the largest number of droplets is observed during coughing, as a result of the much larger air
velocities present (which increase wall shear stress and turbulence). Turbulence produces air
flow velocities perpendicular to the primary airflow direction, which results in perturbations of
the ALF and can drive wave-instability formation.
The droplets that are formed range in size from nanometers to microns. A brief analysis
of the system indicated that convective transport of these droplets dominated diffusive transport,
confirming the importance of respiration flow rates. Gravitational settling was also shown to be
negligible for droplets less than a few microns in diameter. Both droplet generation mechanisms

82
were demonstrated to be technically feasible based on droplet size, transport and time-to-escape
the lungs.
In vitro model development:
To explore the proposed droplet generation mechanisms, in vitro models were developed,
including separate systems for tidal breathing and cough air flows. These models all utilized
optical particle counters (OPCs) to measure droplet size and number. Droplet generation was
expected to occur in both models, although the number of droplets formed during tidal breathing
was hypothesized to vary with bifurcation angle if it were an inhalation-based process. The
simulated cough system was based off of research on mucus cough-clearance performed by King
et al.7, in which a pseudo-trachea was created to model upper airway conditions. This design was
modified for droplet generation by Watanabe et al.8 and further refined for the present research.
First-pass measurements of the lower and upper airway models (under tidal breathing
conditions) indicated that droplets were formed through both mechanisms. Additionally droplet
number dependence on bifurcation angle was observed, thus confirming the first hypothesis. The
simulated cough system produced the largest number of droplets, in line with expectations. The
model results were in reasonable agreement with in vivo data reported in the literature (when
exposed interfacial area and air volume were accounted for). The threshold for tidal breathing
“super-producers”, as defined by Edwards et al.9, could be met through a number of possibilities:
airway geometry (bifurcation angle), number and frequency of bronchiole collapse, altered ALF
physical properties or some combination of upper and lower airway mechanisms operating in
tandem - the specific combination may even vary by individual.

83
Mucus viscoelasticity - cationic response and effect on droplet formation:
Based on the research of Edwards et al.9 on droplet generation, as well as the work of
Marriott10
on mucus viscoelasticity, cationic treatment of mucus was used to investigate the
effect of viscoelasticity on shear-driven droplet formation. The simulated cough system was
chosen based on the large number of droplets produced and the expectation that the larger shear
forces present during a cough represent a more strenuous test environment (and that any results
should therefore carry over to the upper airway tidal breathing model). Due to the difficulty in
acquiring healthy, human pulmonary mucus, several alternative sources were investigated. Based
on comparisons to literature-reported viscoelastic properties of healthy mucus, COPD sputum
was selected as the best choice. Published studies on the addition of cations to mucus
demonstrated that altered viscoelasticity as a result. This was confirmed for the sputum samples,
and used to test the second hypothesis: that the viscoelasticity of mucus would directly influence
the number of droplets formed by surface shearing (specifically that increased stiffness would
reduce the total number of droplets).
Salt was added in bulk to the sputum at varying concentrations and the viscoelastic
properties were measured. Four salts were investigated: CaCl2, MgCl2, KCl, and NaCl. At low
cation concentrations, a decrease in the loss tangent and an increase in the complex modulus
(compared to baseline values) were observed. The effect was greater for the divalent cations (Ca,
Mg) compared to the monovalent cations (K, Na). These changes indicate increased overall
mucus stiffness, and confirmed that cationic exposure alters mucus viscoelasticity. However, as
the concentration was increased the response was reversed and ultimately the overall stiffness
decreased (the loss tangent increased while the complex modulus decreased). Increased stiffness
at low cation concentrations is the result of charge-shielding, as proposed by Marriott10
, which

84
causes a higher entanglement density in the mucin network (an effect that was greater for
divalent cations compared to monovalent cations).
Cation-treated and untreated samples were placed in the simulated cough system and the
number of droplets produced was measured. Overall, increased mucus stiffness resulted in a
lower total number of droplets, while decreased stiffness yielded a larger number of droplets, in
confirmation of the second hypothesis.
Pathogen transport and transport prevention:
The third hypothesis stated that decreasing the total number of shear-induced droplets
(through any method, including altered mucus viscoelasticity) would reduce the opportunity for
pathogen transmission. A modified viable Anderson Cascade Impactor (viable-ACI) was
attached to the in vitro cough system in order to measure pathogen transport via droplets:
droplets generated in the cough system impact a petri dish (containing chocolate-agar or cell
culture media) within the viable ACI, transferring any pathogens contained within.
Untreated (“neat”) COPD sputum contained culturable bacteria which could be observed
on agar-media plates within 48 hours (incubated). After exposure to cough-air (along with any
droplets present), the petri dishes were removed from the viable-ACI, incubated for 48 hours and
then observed for the presence of colony forming units (CFUs). For neat sputum, CFUs were
detected in the cough-exposed plates, however for calcium-treated sputum, virtually no CFUs
were seen. The calcium-treated sputum was directly plated as a control measure, and CFUs were
observed at the low (isotonic) calcium concentration. Hence, bacteria were successfully
transferred through the system as bioaerosols, and reduced droplet production (as a result of a
cation-induced increase in mucus viscoelasticity) corresponded to reduced bacterial transport.

85
A similar experiment was performed with rhinovirus: the agar-media plates were
replaced with plates containing cell-culture media. Untreated and treated sputum was spiked with
rhinovirus at known concentrations and tested within the cough system. The cough-exposed
media was then placed over rhinovirus-sensitized HeLa cells, which were observed for signs of
cell-death up to 96 hours post-exposure. As a control, an untreated sputum sample with no virus
added was also tested. The calcium treated sputum samples and the untreated sputum samples
without virus both resulted in no observable cell death; however, for the untreated sputum
sample with rhinovirus, exposed cell cultures first showed signs of death at 72 hours.
Comparison to viral concentration reference data (generated from direct exposure of cells at
varying virus concentrations) indicated a multiplicity of infection (MoI – ratio of virus to cells)
of approximately 0.00002 for the untreated sputum samples, which indicates the initial presence
of approximately 100 HRV virions (which is a little under 1 virion per droplet). This confirmed
the third hypothesis.
Implications:
Taken together, the work confirmed that pathogens can be transported as bioaerosols
(small droplets formed via ALF surface shearing in the upper airways); that the number of
droplets formed is related to mucus viscoelasticity; and that mucus viscoelasticity can be altered
by cationic addition. Tools were created to enable relatively rapid in vitro assessments of
transmission prevention by modifying the properties of the ALF source, which was demonstrated
to be an effective route for preventing pathogen transport.
As noted by Roy and Milton (2004)11
, the need for these tools and for a deeper
understanding of airborne transmission in general is especially important for policy development

86
and design of hospitals and other public, indoor settings. There are also obvious applications in
biodefense and other quarantine environments, where reducing airborne infection transmission
would be of primary importance. However, there exist less critical, non-medical applications,
such as particle-free laboratories, where super-producers exhaling droplets (regardless of
pathogen presence) could be treated to prevent contamination of the lab environment.
Open questions:
The root cause behind super-producers remains an open question: several possible
explanations were considered (upper versus lower airway sources, airway geometry, ALF
physical properties), but all were demonstrated to be at least moderately feasible, and none stood
out as an obvious choice. The most probable explanation is that some combination of these
factors is involved, and varies from person to person and even over time for the same person,
however more work is needed to further identify and isolate the individual contributing factors.
Continued studies observing droplet output from the general population along with
measurements of health-status and airway geometry would be needed to determine correlates
between super-producers and the potential causes listed above.
Further questions remain regarding differences in the transport behavior of different
pathogens. For instance, at what point does pathogen size begin to play a role? Obviously very
large bacteria with sizes over a few microns are likely to simply settle out rather than remain
airborne, but for pathogens less than a micron in size, is there a point at which they begin to
influence droplet aerodynamics in such a way as to alter transport potential? Furthermore, does
their physical structure (shape, surface proteins/filaments, etc.) play a role as well? The bench-

87
top models developed for this work could be used to explore a range of different pathogens (as
well as specifically modified strains of those pathogens) to probe these remaining questions.
Future work:
With respect to infectious disease transmission and prevention, further research would
involve several different routes. First and foremost, the transport experiments should be repeated
with other bacteria and viruses – influenza, for example, would be a possible next step. This
would be useful in addressing the questions posed previously regarding pathogen size and
structure as well as provide further validation of the bench-top models.
Assays for more accurately quantifying the amount of bacteria or virus transported are
needed to improve pathogen per droplet estimates. For example, RT-PCR might be used to
measure virus concentration in cough-exposed media. This information would be useful in
determining the virulence or “infectiousness” of specific pathogens when coupled to in vivo
transmission data.
Finally, the bench-top systems should be adapted to include animal exposure models: by
placing healthy animals downstream of bench-top bioaerosol sources (so as to allow exposure to
contaminated airborne droplets only and prevent any other form of contact) direct airborne
transmission and prevention could be observed. Existing influenza strains for different species
(such as mice, pigs or ferrets) could be used to probe effects of varying breathing patterns,
airway geometry and virulence.

88
References:
15. Papineni, R.; Rosenthal, J. (1997) J Aerosol Med. 10(2):105-116
16. Moriarty, J.; Grotberg, J. (1999) J. Fluid Mech. 397: 1–22.
17. Johnson, G.; Morawska, L. (2009)J Aerosol Med Pulm Drug Deliv. 22:1-9.
18. Chowdhary, R.; Singh, V.; Tattersfield, A.; Sharma, S.; Subir, K.; Gupta, A. (1999) Journal of Asthma
36(5): 419-426
19. Green, A. S. (2004) Journal of Biomechanics 37(5): 661-667
20. Wang, Y.; Liu, Y.; Sun, X.; Yu, S.; Gao, F. (2009) Acta Mech Sin 25: 737-746
21. King, M.; Brock, G.; Lundell, C. (1985) J. Appl. Physiol. 58: 1776-1782
22. Watanabe, W.; Thomas, M.; Clarke, R.; Klibanov, A.; Langer, R.; Katstra, K.;Fuller, G.; Griele, L.; Fiegel,
J.; Edwards, D. (2007) J Colloid Interface Sci. 307(1): 71–78
23. Edwards, D.; Man, J.; Brand, P.; Katstra, J.; Sommerer, K.; Stone, H.; Nardell, E.; Scheuch, G.
(2004)PNAS 101(50): 17383-17388
24. Marriott, C.; Shih, C.; Litt, M. (1979) Biorheology 16(4-5): 331-337
25. Roy, C.; Milton, D. (2004) N. Engl. J. Med. 350:1741-1744