air pollution with exhaust particles at four metro construction sites in copenhagen
DESCRIPTION
To investigate potential air pollution from metro construction sites CMT (Copenhagen Metro Team) decided to hire the Danish Ecocouncil to measure and assess work related exposure of employees to ultrafine exhaust particles from construction equipment and to measure and assess possible pollution of the external environment outside four metro construction sites in Copenhagen, Denmark.TRANSCRIPT
Air pollution with exhaust particles
at four metro construction sites in Copenhagen
Project manager: Dr. Kaare Press-Kristensen, senior advisor, air quality. Danish Ecocouncil, Blegdamsvej 4B, 2200 Kbh. N, Denmark.
November, 2012

1
Background To investigate potential air pollution from metro construction sites CMT (Copenhagen Metro Team)
decided to hire the Danish Ecocouncil to measure and assess work related exposure of employees to
ultrafine exhaust particles from construction equipment and to measure and assess possible pollution
of the external environment outside four metro construction sites in Copenhagen, Denmark.
Exhaust particles are mainly ultrafine particles (PM0.1) i.e. particles with diameter less than 0.1 micro
metres measured in numbers of particles per cm3. Exhaust particles can be removed by particulate
filters. Equipment arriving without particulate filters are (as a main principle) retrofitted with filters
or denied access to the construction sites. About 80 % of construction equipment (> 75 kW) at the
sites are retrofitted with filters. However, two types of construction equipment (secant piles rig: SR-
100/480kW and Hydromill Equipment: SC-120/600kW) are not retrofitted with particulate filters
due to technical aspects. This equipment is estimated to use around 50 % of the diesel at the sites.
Objectives The main objectives were to measure and assess work related exposure of employees to ultrafine
particles from construction equipment and to measure and assess possible pollution of the external
environment outside four metro construction sites in Copenhagen.
Measurements Ultrafine particles were measured with P-Trak’s (Model 8525 Ultrafine Particle Counter).
Wind data was measured with a Speetech WindMate 350 and based on local observations.
The following measurements were performed:
1) Four employee exposure measurements each of about four hours i.e. about 16 hours in total at
two sites: Aksel Møllers Have and Sønder Boulevard.
2) One measurement close to and 20, 25, 35 and 40 metres from the closest of two secant piles
rigs without particulate filters at the site: Aksel Møllers Have.
3) Measurements just above/outside the fence and 5 metres from the following four sites: Aksel
Møllers Have, Sønder Boulevard, Marmorkirken and Frederiksberg Allé (screening on each
side and detailed measurements in the wind direction).
4) Background measurements next to the nearest larger street, next to nearest larger street but
100 metres from the construction site and at the unpolluted (upwind) side of the sites: Aksel
Møllers Have, Sønder Boulevard, Marmorkirken and Frederiksberg Allé.
As reference, measurements of employee exposure are compared to employee exposure in
Copenhagen Airport. Measurements of possible pollution of the external environment outside the
sites are compared to background pollution from local traffic and on streets with heavy traffic in
Copenhagen. This provides a clear indicator of the pollution levels.

2
Variables Wind direction and speed is complex at construction sites in cities and emissions from construction
equipment are fluctuating significantly depending on the actual load of the equipment. The resulting
uncertainties were reduced by mapping local wind data before and during pollution measurements
and by performing more measurements and using longer measuring intervals than originally planned.
Furthermore, measurements were only performed during local wind speeds below 5 metres per
second. The results are thereby believed to give a good overall picture of air pollution from the sites
and employee exposure. These uncertainties could be reduced further by more measurements.
Results Overview of the four metro construction sites and an equipment list is in appendix 1. Abbreviations,
AMH: Aksel Møllers Have, SBV: Sønder Boulevard, MMK Marmorkirken and FBA: Frederiksberg
Allé, CPH: Copenhagen Airport, m/s: metres per second and part.: Particles.
Employee exposure Four employee exposure measurements each of about four hours i.e. about 16 hours in total at two
sites: Aksel Møllers Have and Sønder Boulevard were performed 19th October 2012. The official
wind data from the city Kastrup near the sea (and close to Copenhagen) were 4-5 m/s from south and
south-east. The local wind speed at the sites was significant lower.
The employee exposure measurements were performed as close to the employees as possible without
disrupting their work. Table 1 shows results from the employee exposure measurements at the sites
compared to similar exposure measurements from employees working inside Copenhagen Airport.
Table 1
Location / Function Date Time Total time (Hours: Min.)
Average (Part./cm3)
Max. ½-hour (Part./cm3)
SBV / Workman 19.10.2012 09.38 – 13.23 03:45 36,800 104,700
AMH, Workman 19.10.2012 11.23 – 14.15 02:52 24,200 45,900
AMH, Workman 19.10.2012 14.42 - 17.39 02:57 23,700 56,500
AMH, Workman 19.10.2012 14.46 – 17.32 02:46 17,000 32,300
Average of metro site measurements 25,400 59,900
CPH / Baggage handler 21.01.2011 10:55 - 14:24 03:29 40,400 75,000
CPH / Baggage handler 27.01.2011 10:55 - 14:24 03.29 82,800 140,200
CPH / Baggage handler 02.02.2011 06:55 - 15:13 08:18 75,000 104,100
CPH / Baggage handler 04.02.2011 10:29 - 14:42 04:13 32,400 55,500
CPH / Baggage handler 15.02.2011 06:57 - 12:59 06:02 95,000 213,900
CPH / Baggage handler 16.02.2011 06:55 - 13:29 06:34 82,000 220,000
CPH / Workman 25.01.2011 08:00 - 13:46 05:46 52,500 120,800
Average of airport measurements 65,700 132,800
Rush hour on larger city streets 40-45,000 50-60,000
SBV: Metro site at Sønder Boulevard, AMH: Metro site at Aksel Møllers Have, CPH: The yard in Copenhagen Airport.

3
From Table 1 it can be seen that the employees at the metro sites on average are exposed to well
below half the ultrafine particles when compared to employees in CPH. The average exposure at the
metro sites is significantly lower than the rush hour pollution on a larger city street. However, the
measurement taken at SBV reached a high maximum half hour peak of 104,700 particles per cm3.
This value is in connection with smoke generated from the use of a blowtorch for 5-10 minutes.
Several employees were watching from a close distance without any reason as showed in Picture 1.
Picture 1
Figure 1 shows employee exposure at SBV compared to employee exposure in CPH. From the figure
it is clear that smoke generated from 5-10 minutes use of a blowtorch contributes significantly to the
employee exposure at the metro site. The average exposure at SBV is 36,800 particles per cm3 while
the average in CPH is 95,600 particles per cm3. The average exposure at SBV would be reduced by
approximately 25 % to 27,700 particles per cm3 if employees maintain a distance from where a
blowtorch is being used instead of standing in the vicinity of it.
Figure 1

4
Aksel Møllers Have Detailed measurements of ultrafine particles at AMH were performed November 6th 2012. The wind
data recorded from Kastrup were 6 m/s from south and south-west. The wind speed at the site
(surrounded by a tall fence and tall buildings) was about ½ m/s from south.
Figure 2 shows a conceptual model of the measurements at AMH (not to scale).
Figure 2
Picture 2 illustrates the measurements around Rig A and downwind of the rigs.
Picture 2
25 35
North
~ ½ m/s
Wind direction
Rig A Rig B
Go
dth
åb
svej
Fen
ce
20 40

5
Air pollution with ultrafine exhaust particles was screened around (5-7 metres distance) the secant
piles rig A (Picture 2). The screening measurements were performed 1 to 5 metres above ground
level (the exhaust pipe of a secant piles rig is around 4 metres above ground). In the main plume of
smoke 5 m above ground level there were measured up to 500,000 particles per cm3 (max. range of
the P-Trak). Outside the main plume of smoke no significant air pollution from the secant piles rig
was observed.
On the basis of the screening measurements and the wind direction it was decided to take further
measurements at 20, 25, 35 and 40 metres (end of the construction site) downwind of the secant piles
rig B (cf. Figure 2) thereby catching the main plume of smoke from both the secant piles rigs and the
excavators used in close proximity. Each distance was measured for about 15-20 minutes, i.e. 900-
1,200 measurements (measurements each second).
However, the main plume of smoke was higher than 5 metres above ground level at a distance of 20-
25 metres downwind of rig B. Therefore could not be measured adequately from the ground.
However, this was overcome by climbing the scaffold close to the fence surrounding the site,
enabling measurement of the main plume of smoke, which was approximately to 6 metres above
ground and downwind of rig B. This could be considered a worst case situation when taking into
account all the active equipment combined with the extremely low wind speed
Picture 3 shows the measurements from the scaffold close to the end of the site i.e. 35 and 40 metres
downwind of rig B (cf. Figure 2). Wind speed was measured every half hour and did not change
significantly i.e. about ½ m/s from south.
Picture 3
6
0
20000
40000
60000
80000
100000
0 10 20 30 40 50
Par
ticl
es
pe
r cm
3
Meters downwind secant piles rig B
Ultrafine particles vs. distance from rig B
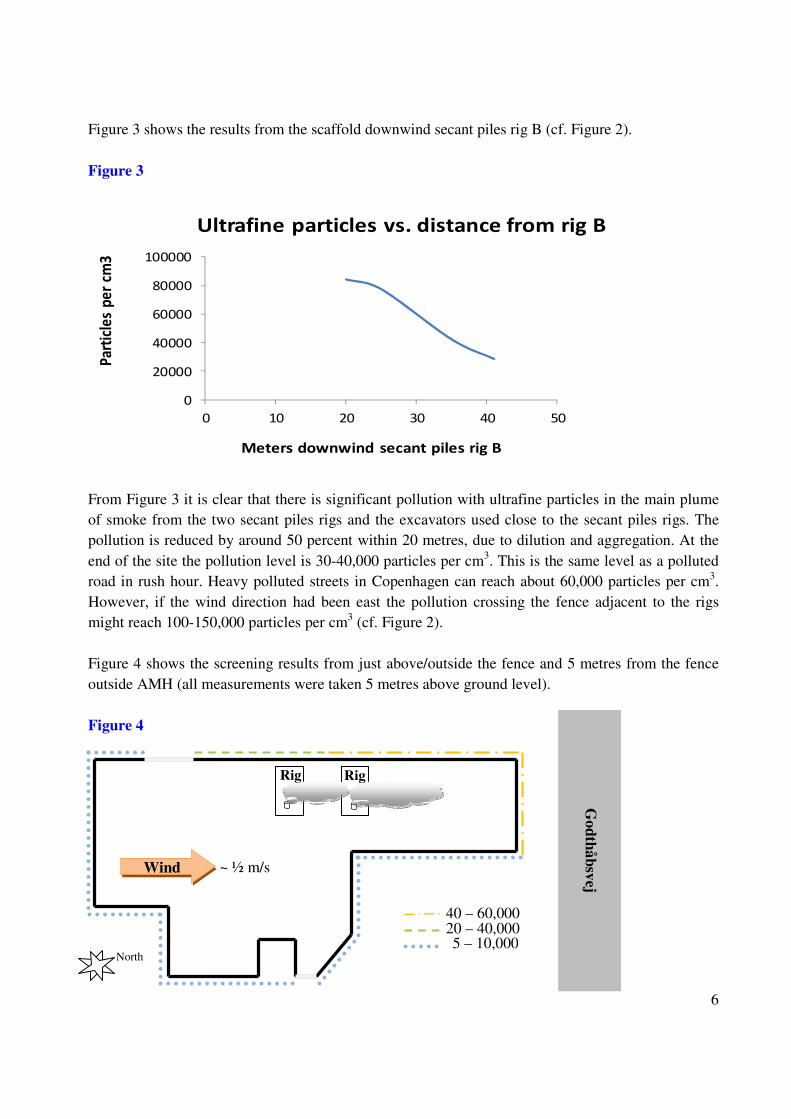
Figure 3 shows the results from the scaffold downwind secant piles rig B (cf. Figure 2).
Figure 3
From Figure 3 it is clear that there is significant pollution with ultrafine particles in the main plume
of smoke from the two secant piles rigs and the excavators used close to the secant piles rigs. The
pollution is reduced by around 50 percent within 20 metres, due to dilution and aggregation. At the
end of the site the pollution level is 30-40,000 particles per cm3. This is the same level as a polluted
road in rush hour. Heavy polluted streets in Copenhagen can reach about 60,000 particles per cm3.
However, if the wind direction had been east the pollution crossing the fence adjacent to the rigs
might reach 100-150,000 particles per cm3 (cf. Figure 2).
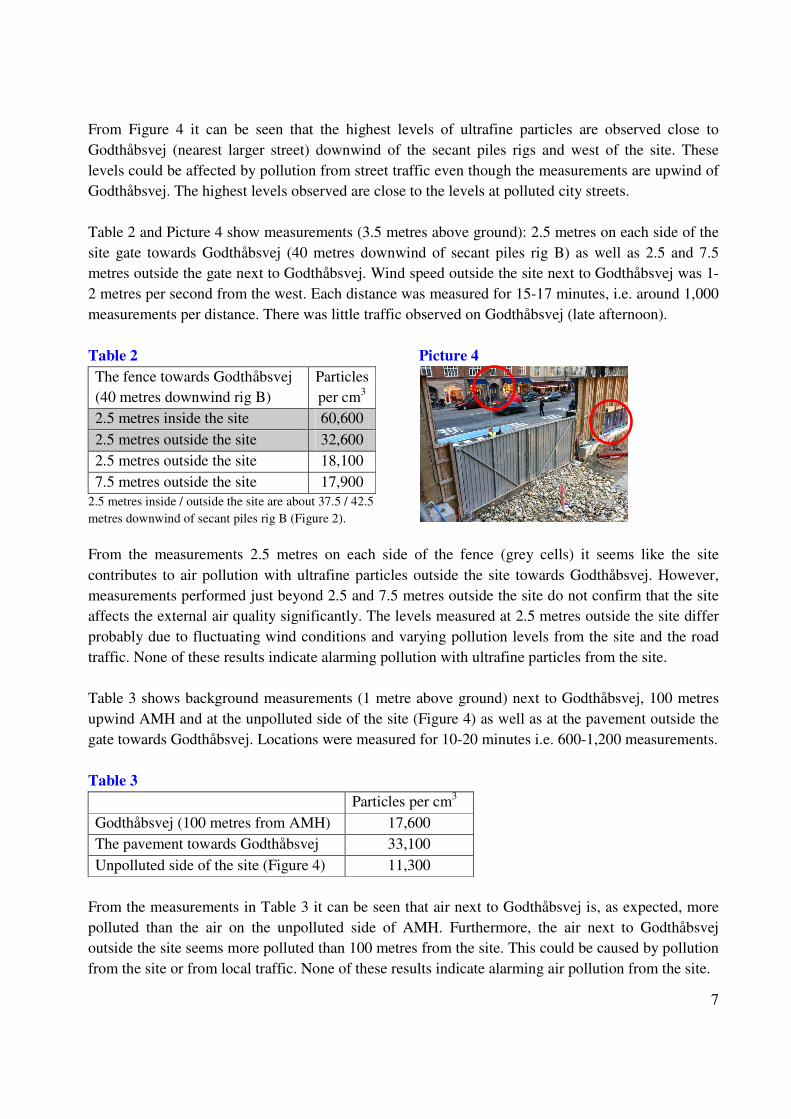
Figure 4 shows the screening results from just above/outside the fence and 5 metres from the fence
outside AMH (all measurements were taken 5 metres above ground level).
Figure 4
Go
dth
åb
svej
40 – 60,000 20 – 40,000 5 – 10,000
North
~ ½ m/s Wind
Rig Rig
7
From Figure 4 it can be seen that the highest levels of ultrafine particles are observed close to
Godthåbsvej (nearest larger street) downwind of the secant piles rigs and west of the site. These
levels could be affected by pollution from street traffic even though the measurements are upwind of
Godthåbsvej. The highest levels observed are close to the levels at polluted city streets.
Table 2 and Picture 4 show measurements (3.5 metres above ground): 2.5 metres on each side of the
site gate towards Godthåbsvej (40 metres downwind of secant piles rig B) as well as 2.5 and 7.5
metres outside the gate next to Godthåbsvej. Wind speed outside the site next to Godthåbsvej was 1-
2 metres per second from the west. Each distance was measured for 15-17 minutes, i.e. around 1,000
measurements per distance. There was little traffic observed on Godthåbsvej (late afternoon).
Table 2 Picture 4
The fence towards Godthåbsvej
(40 metres downwind rig B)
Particles
per cm3
2.5 metres inside the site 60,600
2.5 metres outside the site 32,600
2.5 metres outside the site 18,100
7.5 metres outside the site 17,900
2.5 metres inside / outside the site are about 37.5 / 42.5
metres downwind of secant piles rig B (Figure 2).
From the measurements 2.5 metres on each side of the fence (grey cells) it seems like the site
contributes to air pollution with ultrafine particles outside the site towards Godthåbsvej. However,
measurements performed just beyond 2.5 and 7.5 metres outside the site do not confirm that the site
affects the external air quality significantly. The levels measured at 2.5 metres outside the site differ
probably due to fluctuating wind conditions and varying pollution levels from the site and the road
traffic. None of these results indicate alarming pollution with ultrafine particles from the site.
Table 3 shows background measurements (1 metre above ground) next to Godthåbsvej, 100 metres
upwind AMH and at the unpolluted side of the site (Figure 4) as well as at the pavement outside the
gate towards Godthåbsvej. Locations were measured for 10-20 minutes i.e. 600-1,200 measurements.
Table 3
Particles per cm3
Godthåbsvej (100 metres from AMH) 17,600
The pavement towards Godthåbsvej 33,100
Unpolluted side of the site (Figure 4) 11,300
From the measurements in Table 3 it can be seen that air next to Godthåbsvej is, as expected, more
polluted than the air on the unpolluted side of AMH. Furthermore, the air next to Godthåbsvej
outside the site seems more polluted than 100 metres from the site. This could be caused by pollution
from the site or from local traffic. None of these results indicate alarming air pollution from the site.

8
Frederiksberg Allé, Sønder Boulevard and Marmorkirken Measurements of ultrafine particles outside FBA, SBV and MMK were performed November 8th
2012. The wind data from Kastrup were 6-8 m/s from west. The wind speed at the construction sites
was lower and from other directions due to shelter-effects from local tall buildings.
Figure 5 shows the screening results from just above/outside the fence and 5 metres from the fence
outside FBA, SBV and MMK (all measurements were taken 5 metres above ground level).
Figure 5
SBV: High levels were seen both at location B and C.
From Figure 5 it can be seen that the highest levels of ultrafine particles are observed downwind of
the sites at FBA and SBV. However, at MMK the highest levels are observed just next to the site
parallel to the measured wind direction. This pollution must be assumed to originate from MMK
since there are no local pollution sources next to the site. This could be explained by complex local
wind directions caused by tall buildings surrounding MMK. At SBV high levels were seen both at
location B and C.
In general there were no significant differences between measurements just above/outside the fence
and 5 metres from the fence. However, at one specific spot downwind of SBV there was observed a
significantly higher pollution just above/outside the fence when compared to 5 metres from the
fence. This was probably caused by specific local conditions (e.g. wind turbulence etc).

9
Picture 5 shows measurements above/outside the fence to SBV (left: location C) and measurements
downwind of SBV at 5 metres above ground level and at inhalation height (right: location B).
Picture 5
Table 4 shows the measurements at the most polluted side of the three sites just above/outside the
fence and 3-5 metres downwind (away from) the fence (5 metres above ground). Each distance was
measured for 10-30 minutes, i.e. 600-1,800 measurements.
Table 4
Above/outside the fence 5 metres away from the fence Local wind speed
FBA 13,000 a) 14,200 a) 2-3 m/s from south
SBV 26,500 b) 14,200 b) 2-3 m/s from south-west
MMK 21,400 21,000 c) 1 m/s from north-west
a) Not much activity was observed at the site (the secant piles rig seemed turned off).
b) Measured at position C outside SBV (cf. Figure 5 and Picture 5).
c) Only possible to measure 3.7 metres away from the fence.
There was no significant air pollution observed at FBA. This is likely due to the secant piles rig was
turned off. Hence, no further measurements were performed at FBA. The measurements from SBV
and MMK indicate some pollution from the sites. It seems that the pollution from MMK is trapped
between the site fence and the surrounding buildings. However, none of these results indicate
alarming pollution with ultrafine particles from the sites.
Table 5 shows background measurements from the unpolluted side of SBV and MMK (Figure 5) and
from the streets Sønder Boulevard and Bredgade about 100 metres from the two construction sites
(1 m above ground). All locations were measured for 30 minutes, i.e. 1,800 measurements.
Table 5
SBV MMK
Sønder Boulevard and Bredgade (100 metres from sites) 6,000 22,400
Unpolluted side of two construction sites (Figure 5) 5,300 9,000

10
Measurements at Bredgade and Sønder Boulevard (100 metres from MMK and SBV, respectively)
clearly illustrate the difference between a city road with little traffic and a city road with some traffic
(Bredgade). The pollution with ultrafine particles at Bredgade seems comparable to the pollution
measured from the sites just above/outside the fence (Table 4). However, when comparing the levels
from the unpolluted side of the two sites with the levels just above/outside the fence in Table 4 it is
obvious that the sites affect the external environment. But the pollution of the external environment
does not seem to reach a higher level than that from a street like Bredgade in the early evening.
Extra measurements were performed at SBV to investigate the pollution at location B (cf. Figure 5
and Picture 5 right) and inside the entrance to MMK, where a distinct smell of diesel exhaust was
detected. Table 6 shows measurements at point B (15-30 minutes, i.e. 1,000-2,000 measurements).
Table 6
Time Part. per cm3
SBV: 3.6 metres above ground 5 metres from location B 14:30 – 14:47 87,200
SBV: 3.6 metres above ground 15 metres from location B 14:29 – 14:46 57,300
SBV: 5 metres above ground 10 metres from location B 12:14 – 12:27 70,100
SBV: Inhalation height about 10 metres from location B 12:13 – 12:26 85,400
SBV: 5 metres above ground 10 metres from location B 12:14 – 12:42 43,500
SBV: Inhalation height about 10 metres from location B 12:13 – 12:41 51,000
From the measurements taken 3.6 metres above ground, it can be seen that the concentration is
reduced by about 30,000 particles per cm3 over a distance of 10 metres. This is the same reduction as
observed in Figure 3. The reduction is due to dilution and aggregation. The concentration recorded
10 metres from the entrance was reduced significantly during the period 12:26-12:42. Therefore the
measurements taken 10 metres from the entrance were divided into two time intervals to enable
comparison with the measurements from 3.6 metres above ground. Hence, pollution downwind of
the site can reach levels above the rush hour traffic at the most polluted streets in Copenhagen.
However, pollution will be reduced significantly 50 metres away from the site.
Table 7 and Picture 6 show measurements from the entrance (G at Figure 5) to MMK 3.6 metres
above ground. Measurements were performed for about 30 minutes, i.e. about 2,000 measurements.
Table 7 Picture 6
Part. per cm3
MMK inside the entrance 204,400
5 metres downwind the entrance 46,500
Both measurements 3.6 metres above ground
The measurements inside the entrance to MMK show very high pollution with ultrafine particles.
According to a workman from the site this pollution was caused by a diesel generator used at the site.
This information was not investigated further.

11
Conclusion The measured average employee exposure to ultrafine particles at the investigated metro construction
sites is not alarming compared to similar professions. However, high half hour peaks appear. These
peaks can be directly related to welding, blowtorching and/or the smell of diesel exhaust.
The measurements downwind of two secant piles rigs without particulate filters at the construction
site Aksel Møllers Have show that the pollution with ultrafine exhaust particles crossing the site
fence about 40 metres downwind of the rigs can be 40,000 particles per cm3 in the main plume of
smoke (5-7 metres above ground). This is the same level as a polluted city road in the rush hour.
However, the pollution could be much higher if the main plume of smoke crosses the site fence close
to the rigs. The highest pollution levels measured just above/outside the fence are close to the levels
at polluted city streets in the rush hour.
The first measurements from FBA, SBV and MMK indicated that the pollution from the sites was at
the level of the street Bredgade in the early evening. However, detailed measurements at the polluted
side of SBV (location B cf. Figure 5) showed that pollution downwind of the site can reach levels
above the rush hour on the most polluted streets in Copenhagen. The same measurements indicated
that the pollution will be reduced significantly downwind of the site. Measurements inside the
entrance to MMK showed very high pollution levels that might be caused by a diesel generator at the
site (according to a workman from the site).
The overall conclusion concerning the external environment is that people living close to or passing
the sites will only be exposed to a limited pollution with ultrafine exhaust particles from the sites
compared to the pollution most of them inhale daily from traffic. In addition, the sites cause very
local pollution for a short period of time (equipment without filters are only used 6-8 months at sites)
compared to road traffic affecting hundred thousands every day in Copenhagen. However, if persons
living next to the sites open their windows towards the sites and the plume of smoke simultaneously
hits the windows (worst case) this could cause significant indoor air pollution that day.
Recommendations
1) Run a shut down the engine campaign. Much equipment is running idle at the site. This will
reduce both air pollution and diesel consumption.
2) Further investigate the possibility to reduce air pollution with exhaust particles (and NOx) by
filters, SCR or other technical installations on diesel equipment.
3) Avoid diesel generators without filters to generate electricity – use the public power supply.
4) Inform employees that they should, if possible, keep a safe distance from the smell of diesel
exhaust and smoke from welding or blowtorching.
5) Implement a mandatory safety course for existing and new employees focusing on health
problems connected to ultrafine particles at the sites and employee possibilities to reduce the
pollution and their exposure to the pollution.

Appendix 1 Maps of the four metro construction sites and equipment list for the construction sites.

�✁✂ ✄�✁☎✆
✝✞✟
✠✡✞☛ ✄✄
☞☞✌✍
✎✏✑✒
✓✔ ✕✖
✌✗
✕✎✘ ✙ ✘✚ ✘✛✜✢✣✣ ✤✜✥✦✢✣✧★ ✩✪✫✬ ✧✫✭✮✯✰✱✲✳✴✵ ✶✶✷✸✹✺✺ ✻✼✽✻ ✾✿❀❁❂❃ ❁❃❂❀❁ ❄❂❅❁ ❆❇❀❅❁
❈❉ ❊❊ ❋❈ ●❍❉ ❊●❉■❏❑▲ ▼❑◆❖▲ ■P◗❖ ■❘❙❚❯❱❲❳❨❯❙❩❨❱❬❚
❭ ❪❫❴❵❛❜❝ ❞❡❢❣❢❢❤❢✐
❥❦❧♠♥♦♣qrst
✉✈✇① ②③④ ②②① ⑤✇ ⑥⑦ ⑧①⑨⑩❶❷⑩❸❹❺❻❶❼❹❽⑩❾❿➀➀❹⑩➀
✉✈✇① ②③④ ②②① ⑤✇ ⑥⑦ ⑧①
➁➂➃ ➄➁➂➅ ➆➇➂➈➅ ➉➊➊ ➄➋➋➌ ➍➎➏➐➑ ➒➍➓➓➔➏➓
→➣➣↔↕➙➛➜➝ ➞➟➠ ➡➢➝ ➟➞➤➥➊➦ ➈ ➇➉➂➈➄➃
✬ ✩➧★ ✭➨➩➫➭➯❈ ❈ ❋➲➲
➳➵➸➺➻➼➻➺ ➼➽ ➾➚➪➪➶➽➹➚➪➘➴ ➚➪➷➬➮➚➱✃➬➽➪❐ ➮❒➱❮❐➱❰Ï
ÐÑÒÓÔÕÑÖÐ×ØÐÙÖÓ
Ú Û Ü Û ÛÝÞßÞÞàáâããâäå
æçèéêëìí é
îïððñòóññôõö÷øôùúû úùúüýú þÿ�✁✂ ✄✁☎✆ ✄✝ ✆✞ ✟✞☎✠ ✄✁✆ ✟✂ ✡✞ ✟☛☞ ✌ ✄✍☞✝ ✄✍ ✎☛ ✄✏✑ ✏✏✏✒
✓✔✔✔✕✖✖✖
✗✘✙✚✛✜✢✛✛✚✣✙✤✥✦✚ ✧★✩✥✙✚✙✚✪✚✫✬✭✮✯✰✯✱✲✯✣✘✙ ✧★✤✗✳✴✵
✶✷✸✹✺✻✼✽✾✸✽✿❀❁❂❃✸✽❄ ✿✸✿✼✻✷❅✷❆✺❇✸❆✿❈✽❆✷✸✼❉❄ ✽✷❆❄ ✿❊✽❋✽❅✼●✷✸✹✺✻✼✽❍■❂❏❅✺✼✿❑❑✿✼✻✷❅✺●✷✸✹✺✻✼✽✷❆❆✻❈✽✺✿❅▲❄ ❑✿❅✼✺❍
▼◆❖ ◆P◗❘❙❚❯❱❲❚❳❯❨ ❩❬❭❪❫❴❵❛❬❜❝❞❡❢❩❩❴❜❪❡❢❣❤❩❞❜✐❥❦❦❲❧♠❲❱ ♥♠❥♦❲♣q♠rr❚♦r❱ st❪❢❢❩ ✉✈♦♥✇r❚❧❲❚❦❳①
♣♦❙❙❦②❥❦❦❲❧r❚❳❲ ❥♦❳✇♦❱ s③❪❢❢❩❲④❛❬❣❣❞❜⑤ ⑥❛①❡❡❢❩♥❱♦♦❲⑦①✇r ✉✇⑧❲ ✉❯♦❳ s❯♦❳ ✉✇❲ s♥⑨ ♠ s❯♦❳ ✉✈♦♥ ✉✈②❯ ✉❢t❢❢❢⑦ ✉❡❪❢
❥♦❳✇♦❱ s❡❪⑩❢❩❲④❛❬❣❣❞❜⑤ ⑥❛①t⑩❢❩♥❱♦♦❲⑦①✇r ✉✇⑧❲ ✉❯♦❳ s❯♦❳ ✉✇❲ s♥⑨ ♠ s❯♦❳ ✉✈♦♥ ✉✈②❯ ✉❢t❢❢❢③ ✉③❪❢
❱④❶❩❬❜❷❣④❸❵❹❴❛⑥❛❴❩❷❞❺❻ ④❵❛❵❹⑥❴❛❞❼ ❺❞❫⑤ ❺❬❽❞❣❵❤❺❶❬❝❞ ❳♦②❾♦rq♥❲❦❳♦❳♦②②♠❙❾②♠♣✇❦❳✇r♦❲♦❧♠❲❱t⑩❢❩❩
❿➀➁➂➃➀➄➅➆➄➇➈➉➊➋➌➍➊➉➈➎➇➏➐➑➑➑➑➑➒➓➔→➣↔↕➙➛➜↔↕➙➛➝➛➔➞➙➛➓↕↕→➣➟↔➠➡➛➢↔↕➞➣↔➤➥➦↔↔➙➤ ➧➨➨ ➠➓➩↔➜➫➦↔➔➭↔➜➯➠↔➨ ➞➠↔➜
➒↔➲➔➠➛➨ ➙➛➓↕➒➞➙↔➳↔➠➵ ➸➺➻➺➼➽➾➻➚➪➾➸➶➹➪➾➻➚➪➾➘➴➷➬➮➱➱✃❐❒❮➘➴❰Ï❮Ð➮Ñ❮ÐÒÓÔÕ➱➬✃❐❒❮➳➫Ö×➳➫Ø➳➫➫➞➙↔Ù ➓➠ÚÛÜÝ
ÛÜÞÛÜß
à➻áá ➪âã➶➽➽➶äå➾➻➚➪➾æ ➼áá ➪âçà➻áá ➪âã➶➽➽➶äå➾➻➚➪➾æ ➾äè➪âç➥➔➞➢↔
➘éêëìí îïð ñòóôõïôö÷ôòëî øùîïð ñòùúëîûóù÷üóì ùóôõ
ýþÿþ�✁✂þ✄☎þ✆ �✝✞✟✂✠ÿ✠✂✡☛�☞✠✂✌ þ✂✠✆ ✂✝✆ ✠✂✁✍ ✝✞✎✏✑✂✒✠✍ þ✓ÿ✔þÿþ�✁✂✠✕✠✆ þ✂✁☎✠✓✁✖ ✟✂✠ÿ✠✂✡☛�☞✠✂✌
✗✑✓✡ý✡✆ þ✄✡✁✍ ✘✙✠✓ÿ✠✂✠ÿ☞✍✆ ✠✂☎✡��✡✝✓✝✞✁✚✠✗✑✓✡ý✡✆ þ✄✛þ✓ÿ✏✑✂✒✠✍ ✝✂✝✞✜✢✢✣✘✤✥✘✦✜
✧✚✠☎þ✆ �✞✝✂✔✝✆ ✠✓✚þ✌ ✠✓✗✑✓✡ý✡✆ þ✄✡✁✍ þ✂✠✂✠✓ÿ✠✂✠ÿ☞✍✆ ✠✂☎✡��✡✝✓✝✞✎✧✚✠★✞✞✡ý✠✝✞✁✚✠✔✡✁✍ ✏✑✂✒✠✍ ✝✂✖
✔✝✆ ✠✓✚þ✌ ✠✓✗✑✓✡ý✡✆ þ✄✡✁✍✩ ✂✠✆ ✂✝ÿ✑ý✁✡✝✓✆ ✠✂☎✡��✡✝✓✟✦✤✤✪✣✫✜✢✢✪þ✓ÿ✟✦✬✬✢✥✫✦✤✤✭✮✯✰ ✱✯✲✳ ✱✴✳✵ ✶✵✷✸ ✱✯✹ ✱✰✺✻ ✱✼✽✹ ✱✾✿✾✾✾✿❀ ❁❂✾
❃❄❅❆❇❈❉❄❊❇❋ ●❍■❏❑▲▼◆ ▲▲❑❖❏P◗❘❑ ❙❍❚❯❱❲❳❨❊❇❅❄❈❆❩ ❲❬❅ ❭❪ ❇❅❄❫ ❈❆●❪ ❇❅❄❇●❊❅❆❈❈❆❅❇❲●Þ❴Ý❵❛æ ❜ÞçÝ❝❛❞
❡❢❣❤✐❤❢❢❣❤❥❣✐❥❦❧♠♥♦❧♥♥♣q♥r♠♥s❧♥t✉
✐❣❤✐❤❢❢❣❢❤❣❢✈♥q✇✉t①❧♥♥♣q♥r♠♥s❧♥t✉
②❣❤✐❤❢❢❣❢❢❣✐②♦③❧♠①❧♥♥♣q♥r♠♥s❧♥t✉
④❣❤✐❤❢✐❣❤❢❣❤④❦⑤⑥⑦⑤⑧⑨⑩⑤❶❷❸ ❹⑤⑤❶❺❻❼❽❾⑤❼❹⑨❿⑤➀❿➁❷➂⑤❼ ❦➃♠♥s❧♥t✉
➄❣❤✐❤❢✐❣❤✐❣❤❢③♣♦♥♠q➅❧♥q①q➆♠♥s❧♥t✉
Ü➇ ➈Üà➉ ➈➸➉❜ ➊❜ã➋ ➈Ü➌ ➈➇➍Û ➈➎➏➌ ➈❛Þ❛❛❛Þ➐ ❵➑❛➑➒è➓r♦♥❲❦❥❲❱♦♥❚❲♦❝④❩❻ ❬❝❛❞❫❩❬❛❞❺❴❬❣⑤ ❺❬❽❞❣①
t⑩❢❩❩♥❯❚✇♠❲♦❯❦r♣❯✇❡❢❢❩❩♥❯❚❚✇♠❲♦❯❦r♣❯♦
➔→➣↔↕➙→➛➔➜➝➔➞➛↔➔➛➟➜➔➞➠➟➜→➙➡➢➔➜➔➞➜➤➢→➛➣↔➤➔➥➜➔→➜➜➡➢➠➙➙➛➦➔➧➨➩

�✁✂✂✄☎✆✝✞✟✞✁✠✄✡☛☞✌✍✎✏✑✍✒✏✌✍
✓✔✕✖✗✘✙✕✚✖✛✜✢✣✤✥✦✧✣★✩✪✤✫✬✭✭✮✯✰✱✮✲✳✴✲✮
✵✶✷✸✹✺✻✼✽✾✿❀❁❂❃❄
❅ ❆❇❇ ❈❉❊❊
❋● ❍■■ ❏❑▲▼◆❖P◗◗❘❙▼❚P❯❙❯▼❱❲❙
❘❳◆▼❱❨❙❱▼❙❱❩◆▼❘❳❙❙◗❯❱❨❙❘❬❭❪❫❴❵❛❜❝❞❡❪❢❣❤✐❥❦❧♠♥♦❣❧♣♦qqrst ✉✈✇①✉②③④⑤✇✉⑥⑤✈⑦②⑧⑨⑩❶❷❸❹
❺❻❼❼❽❺❾❼❿➀➁➂❻➂❼➃➄➅➆➇➈➉➊➅➋➌➍➎➏➐➑➒➏➓➔
→❱▼❙❏◆➣❘❙❳▼➣❯↔❩◆▼❘❳❙❙◗❯❱❨❙❘
→❱❳❙▼❳▼❙❱❳❖❙❲❳↕◗❱❲❳➙➛➜➝➞➟◆➠➡➢➤➥➦➝➞ ➧➨➞➠➩ ➫◗➭➯➲➳➵➸➺➻➼➽➾➚ ➪➶➹➘➴➷➴➴ ➬ ➮ ➱ ✃ ✃
❐❒❮❰❐ÏÐÑ❮ÒÏÑÓÑ❮❐❒❮❰❐ÏÐÑ❮ÒÏÑÓÑ❮ Ô Õ Õ Ö × Ö Ø Ù Ô Ú Ô Û Ü ÔÝ Þ Þ ß à ß á â Ý ã Ý ä å Ý
æ ç è é ê ç ë æ æ ç è é ê ç ë ææ ç è é ê ç ë æ ì í î í ï ð ñ ò ó ôæ ç è é ê ç ë æì í î í ï ð ñ ò ó ôæ ç è é ê ç ë æ
õ ö ÷ ø ù ÷ ú ûü ý þ ÿ � ✁ ✂ ✄ ☎ ✆ � ✝ ✞ ✁ü ý þ ÿ � ✁ ✂ ✄ ☎ ✆ � ✝ ✞ ✁õ ö ÷ ø ù ÷ ú û ✟✠✡☛☛☛☞✟✌✍✡✎✟ ✏✟✑✒✓✔✕✖✗✘✘✙✚ ✛✜✢✣✤✥✦✚✥✧✗★✑✦✕✗✙✥✩✪✔✔✗✥✔✙✥✖✩✥✓✓✥✓✗✦✘✥✪✦✚✕✦✚✔✥★✥
✫✬✗✓✥✧✪✘✘✙✔✥★✪✗✦✗✦✫✧✪✘✘✙
✙✥✔✭✗✚✥✚✔✪✦✥✮ ✯ ✯ ✰ ✱✲✳✴✵✵✶✷✸✹✺✻✼✽✶✾✿✹✺✻✼❀✾✼❀
✶✷✸✹✺✻✼✽✶✾✿✹✺✸✼❁❂❃❁❄❅❆❇❃❂❈✶✷❉✼❊❀✾✻❋●❍■❏❑▲▼ ◆▼
❖✵✵✵ P◗❘❙❚❯❱◗❘❲ ❳◗P◗❨❩ ❬ ❭ ❪ ❫ ❴ ❵ ❛❜ ❬ ❪ ❪❝ ❪ ❬ ❪ ❪
✴❞❡✵ ❢✴❣✳✵ ✮ ✯ ❤ ✱ ✱
✮ ✐ ❥ ✱ ✱❢✲✵✴❞❡❦✵✵✵ ❢❧✵❧❡ ♠♥ ♦ ♣ q q✮ ✐ ✱ ❤ ❥
✲✳❞❡❡✴❣✳
r s s t t✉✈✇①①②③④⑤⑥⑦⑧⑨②⑩❶⑤⑥⑦⑧❷⑩⑧❷
②③④⑤⑥⑦⑧⑨②⑩❶⑤⑥④⑧❷⑩⑧❷❸❹❺❻❼❽❾❿➀➁❼➂➃❽❻➄➅➆➇➈➉➊➋➋
➌①①① ➍➎➏➐➑➒➓➎➏➔ →➎➍➎➣↔ ↕ ➙ ➛ ➜ ➝ ➞ ➟➠ ↕ ➛ ➛➡ ➛ ↕ ➛ ➛
✇➢➤①➥✇➦✈① r s ➧ t t➨ ➩ ➫ ➭ ➯ ➯
s ➲ ➳ t➥✉①➵➤①➥➸✉①①➥✉✈➤① ➤✇➦✈
➺➻➼➽➾➚➪➶➹➘➾➴➷➚➽ ➬➮➱➾✃➹❐❒➶➼➶❮❰➶➚ÏÐÑÒÓÔÕÖ×ØÙÚÛÜÝÞßÞàáÙÜâÝßÝßã äâååæçèéßæÜâååâÜÝÞßÞàæÜÙÙåæêÙâëäÝÜêìÙßÜÝåâÜÝÞßæí æÜÙî
ïèéßæÜâååâÜÝÞßÞàðáÙìÝÙñ ÛÝò îÙßÜóè×ØÙÚÛÜÝÞßÞàã ÛÝëÙäâååæôè×ØÙÚÛÜÝÞßÞàõ öäâååè÷øùúûøüýþüÿ� ✁✂✄☎✆ ✂✁� ✝ÿ ✞✟✠✠✠✠✠✡☛☞✌✍✎✏✑✒✓✎✏✑✒✔✒☞✕✑✒☛✏✏✌✍✖✎✗✘✒✙✎✏✕✍✎✚
✛✜✎✎✑✚ ✢✣✣ ✗☛✤✎✓✥✜✎☞✦✎✓✧✗✎✣ ✕✗✎✓✡✎★☞✗✒✣ ✑✒☛✏✡✕✑✎✩✎✗✪ ✫✬✭✬✮✯✰✭✱✲✰✫✳✴✲✰✭✱✲✰✵✶✷✸✹✺✺✻✼✽✾✵✶✿❀✾❁✹❂✾❁❃❄❅❆✺✸✻✼✽✾✩✥❇❈✩✥❉
✩✥✥✕✑✎❊ ☛✗❋●❍■●❍❏●❍❑
▲✭▼▼ ✲◆❖✳✯✯✳P◗✰✭✱✲✰❘ ✮▼▼ ✲◆❙▲✭▼▼ ✲◆❖✳✯✯✳P◗✰✭✱✲✰❘ ✰P❚✲◆❙✛☞✕✙✎
✵❯❱❲❳❨ ❩❬❭ ❪❫❴❵❛❬❵❜❝❵❫❲❩ ❞❡❩❬❭ ❪❫❡❢❲❩❣❴❡❝❤❴❳ ❡❴❵❛
✐❥❦❥❧❨❯❥❳P❥♠ ❧❚♥♦❯♣❦♣❯◗❱❧q♣❯❲ ❥❯♣♠ ❯❚♠ ♣❯❨r ❚♥st✉❯✈♣r ❥❘❦✇❥❦❥❧❨❯♣①♣♠ ❥❯❨P♣❘❨② ♦❯♣❦♣❯◗❱❧q♣❯❲
③✉❘◗✐◗♠ ❥❳◗❨r ④⑤♣❘❦♣❯♣❦qr♠ ♣❯P◗❧❧◗❚❘❚♥❨⑥♣③✉❘◗✐◗♠ ❥❳⑦❥❘❦t✉❯✈♣r ❚❯❚♥⑧⑨⑨⑩④❶❷④❸⑧
❹⑥♣P❥♠ ❧♥❚❯✇❚♠ ♣❘⑥❥❲ ♣❘③✉❘◗✐◗♠ ❥❳◗❨r ❥❯♣❯♣❘❦♣❯♣❦qr♠ ♣❯P◗❧❧◗❚❘❚♥s❹⑥♣❺♥♥◗✐♣❚♥❨⑥♣✇◗❨r t✉❯✈♣r ❚❯②
✇❚♠ ♣❘⑥❥❲ ♣❘③✉❘◗✐◗♠ ❥❳◗❨r❻ ❯♣♠ ❯❚❦✉✐❨◗❚❘♠ ♣❯P◗❧❧◗❚❘♦❸❶❶❼⑩❽⑧⑨⑨❼❥❘❦♦❸❾❾⑨❷❽❸❶❶❿➀➁➂ ➃➁➄➅ ➃➆➇➈ ➉➆➊➋ ➃➁➌ ➃➂➍➎ ➃➏➐➌ ➃➑➒➑➑➑➒➓ ➔→➣
↔↕➙➛➜➝↔↕➞➜➟ ➠➡➢ ➤➥➦➧➨➩➫➭➦➯➲➧➥ ➳➡ ➵➯➸➺➻➼➞➜➙↕➝➛➽ ➺➾➙ ➚➪ ➜➙↕➶ ➝➛➠➹➘↕➴➾➙➜➺➠➺➷➻↕➙➛➜➠➜➠➟ ➬➛➝➝➞❏➮❏➱➱➱❑✃➱❐
❒❮❰ÏÐÏ❮❮❰❮❮❰ÏÐÑÒÓÔÕÒÔÔÖ×ØÙÚØÛÜØÝÞ
Ð❰ÏÐÏ❮Ð❰Ïß❰ÏàØáâÞÝãÜØØäáÑÞÚåáæÚÞØáçØèéÙáæÚáêÜØÜÞÝ ØÙÚØÛÜØÝÞ
ß❰ÏÐÏ❮Ð❰Ïß❰❮ßæëÜÚãÜØØäáÑÞÚåáæÚÞØáçØèéÙáæÚáêÜØÜÞÝ ØÙÚØÛÜØÝÞ
ì❰ÏÐÏ❮Ð❰Ïì❰ÏÐÑÞäÚæëÜØØäáÑÞÚåáæÚÞØáçØèéÙáæÚáêÜØÜÞÝØÙÚØÛÜØÝÞ
í❰ÏÐÏ❮Ð❰Ïì❰❮❮ÑÜÑæëÜØØäáÑÞÚåáæÚÞØáçØèéÙáæÚáêÜØÜÞÝØÙÚØÛÜØÝÞ
í❰îÐÏ❮Ð❰Ïì❰ÐìØÙÚØÛÜØÝÞ
❍ï ð❍▲ñ ð✫òó ô✫✱õ ð❍ö ðï÷● ðøùö ð➱❏➱➱➱❏ú ûüýüþ❚ÿ
�✁�✂�
✄☎✆✝✞✆✟✠✡☛✆☞☞✌✍✎✍✏✑✒✝✓☎✄✔☛✆☞☞
�✁�✂�
☛✆✕✖✔✗✘✙✖✆☎✙✔✞✄☎✔✕✔☞✚✘☎☞✕✖✘✞✆✝✔ ✆✄✄☎✖☎✘✙✆☞✆✞✔✆

�✁✂✄✄☎✆�✝✂✁✄✞✂✆✂✟✠✡✡ ☛☞✌✌ ✍✎✏✏ ✍✏✏✏✏ ✑ ✒ ✓ ✔✟ ✕ ✖ ✗ ✘ ✗ ✘ ✙ ✚ ✛ ✘ ✜ ✗ ✘ ✜
✢✢
✣✤✥✦✧✤★✩✪✫✬✤✭✦✫✧✪✮✥✦✧✫✧✪✭✦
✯✰✱✲✳✰✴✵✶✷✸✰✰✹✺✱✶✻✼✽✼✾✵✲✰✴✿❀❁❂❃❀❄❄ ✺✶✾✶✹✼❅✱✰✵✼✾✵✲✰✴✲✴❅✷❆✸✰✰✹❂❇❀❀❁❂❈❀❀❁❇❇❄❄
❉❊❋●❍■❏❑▲▼◆❖▲P❑▼◗❑❘●❏❙●❚▲❖❯◗❑❏●■❖●■❱ ❲ ❲ ❲❉✺✶✾✶✹✼❅✱✰✵✼✾✵✲✰✴✲✴❅✷❆✸✰✰✹❇❇❄❄❱ ❲ ❲ ❲ ❳ ❨ ❩ ❲❳ ❬ ❲ ❲❳ ❬ ❲ ❲❭ ❩ ❭ ❩
❪❫❴❵❴❫❛❜❝❞❴❫❡ ❢❣❣❤ ✐❥❦❧❝❴❝❴♠❴♥♦♣❛qrqstq❫❜❝
✉✈✇①②③④⑤⑥⑦⑧⑨⑩ ❶❷⑤❸❹❺❻❼⑤⑥❽⑨❶❾⑧❾❿➀ ❽❶➁⑤➂⑦❷❷➃❶⑧➄⑤❶⑧❿❾➄⑥⑤➁⑥❾⑧⑥➄⑤⑨⑤➅❺❻❼⑤⑥❽⑨❶❾⑧❾❿➃⑤⑥⑦⑧⑨⑩ ❶❷⑤➃
➆➇➈➉➊➇➋➌➍➋➎➏ ➐➑➒➓➔ ➑➐➏ →➎ ➣↔↕↕↕↕↕➙➛➜➝➞➟➠➡➢➤➟➠➡➢➥➢➜➦➡➢➛➠➠➝➞➧➟➨➩➢➫➟➠➦➞➟➭➯➲➟➟➡➭ ➳➵➵ ➨➛➸➟➤➺➲➟➜➻➟➤➼➨➟➵ ➦➨➟➤
➙➟➽➜➨➢➵ ➡➢➛➠➙➦➡➟➾➟➨➚ ➪➶➹➶➘➴➷➹➬➮➷➪➱✃➮➷➹➬➮➷❐❒❮❰ÏÐÐÑÒÓÔ❐❒ÕÖÔ×ÏØÔ×ÙÚÛÜÐ❰ÑÒÓÔ➾➺ÝÞ➾➺ß➾➺➺➦➡➟à ➛➨áâãä
âãåâãæ
ç➹èè ➮éê➱➴➴➱ëì➷➹➬➮➷í ➘èè ➮éîç➹èè ➮éê➱➴➴➱ëì➷➹➬➮➷í ➷ëï➮éî➯➜➦➫➟
❐ðñòóô õö÷ øùúûüöûýþûùòõ ÿ�õö÷ øù�✁òõ✂ú�þ✄úó �úûü
☎✆✝✆✞✟✠✆✡☛✆☞ ✞✌✍✎✠✏✝✏✠✑✒✞✓✏✠✔ ✆✠✏☞ ✠✌☞ ✏✠✟✕ ✌✍✖✗✘✠✙✏✕ ✆✚✝✛✆✝✆✞✟✠✏✜✏☞ ✆✠✟☛✏✚✟✢ ✎✠✏✝✏✠✑✒✞✓✏✠✔
✣✘✚✑☎✑☞ ✆✡✑✟✕ ✤✥✏✚✝✏✠✏✝✓✕☞ ✏✠☛✑✞✞✑✌✚✌✍✟✦✏✣✘✚✑☎✑☞ ✆✡✧✆✚✝✗✘✠✙✏✕ ✌✠✌✍★✩✩✪✤✫✬✤✭★
✮✦✏☛✆☞ ✞✍✌✠✛✌☞ ✏✚✦✆✔ ✏✚✣✘✚✑☎✑☞ ✆✡✑✟✕ ✆✠✏✠✏✚✝✏✠✏✝✓✕☞ ✏✠☛✑✞✞✑✌✚✌✍✖✮✦✏✯✍✍✑☎✏✌✍✟✦✏✛✑✟✕ ✗✘✠✙✏✕ ✌✠✢
✛✌☞ ✏✚✦✆✔ ✏✚✣✘✚✑☎✑☞ ✆✡✑✟✕✰ ✠✏☞ ✠✌✝✘☎✟✑✌✚☞ ✏✠☛✑✞✞✑✌✚✎✭✫✫✱✪✲★✩✩✱✆✚✝✎✭✳✳✩✬✲✭✫✫✴✵✶✷ ✸✶✹✺ ✸④✺✻ ✼✽✾✻ ✸✶✿ ✸✷❻❀ ✸❁❂✿ ✸❃❹❃❃❃❹❄ ❅❺❃
❆❇❈❉❊❋❆❇●❊❍ ■❏❑▲▼▲❑◆❖P◗▲❑❘ ❙❚❚❯ ❱❏❲❙❳❨❩❬●❊❈❇❭❉❪ ❨❫❈ ❴❵ ❊❈❇❛ ❋❉■❜❝❇❞❫❈❊❨■❨❡●❇❞❉■❈❛ ❊❋❇●❢❣❤❵ ❜✐
å❥ä❦❧æ♠❧♥♦♣qrsr♣♣q♣sq♣t✉✈✇①②✈①①③④
✉⑤✇①⑥✈①⑦⑧
sqrsr♣sqrsq♣⑨①④⑩⑧⑦❶✈①①③④✉⑧✇❷④②✇⑧①④❸①❹❺❻④②✇④❼✈①✈⑧⑦①❻✇①⑥✈①⑦⑧
⑨qrsr♣sqr❽q♣♣❶❾❿❿➀➁➂➃➄➅➆➁➂➇➁➈➉➊ ➋➃❿❾➌❿➁➃➈➀➇➇❾➇ ✇❷②①⑥✈①⑦⑧
❽qrsr♣sqr➍qs➍⑤❸❺①①✉④⑦⑩④❺⑩⑩⑧✇❶✈⑦⑤❸➎➏✈②➐❸④②②④✇⑩✇➑➒➑⑩➏➑❸④②➑♣♣⑨➓ ✉⑤✇①⑥✈①⑦⑧ã➔ →ãç➣ →➪➣↔ ↕➙➛↔ →ã➜ →➔➝â →➞➟➜ →❧å❧❧❧å➠ ➡➢❧➢➤ï➥
➦➧➨➩➫➭➯➲➳➵➨➸➺➻➼➼➸➸➨➫➻➩➦➽➳➼➨➸➾➚➪➚➶➹➘
➴➷➴
➬➴


�✁ ✂ ✄☎ ✆ ✝ ✞ ✟ ✠ ✄✡ ✟☛ ☞ ✌✍ ✝ ✎ ✄ ✏☛ ✂ ✞ ✑✒ ✟ ✄☛ ✞✡ ✓ ✝ ✞ ✆✒ ✍ ✔ ✕✖ ✗ ✘✙ ✚✛ ✜�������� ������ ���������������������� ���������� ��������� �����������
������������
��� ��������!�" ����������
���"����
!��"�����
#�$�%�& � '�(�)*+ ��,*- �,./ ���"��� #/00 1/2/ 13/ �������(�#/045/3 ��6�$������***' 7
#�$�%�& � '�(�)*+ ��,*- �,�0// ���"��� #/00 1/81 13/ �������(�#/045/3 ��6�$������***' 7
2�$���� � '�(�)*+ ��,*- �,�0// ���"��� #/00 1/82 13/ �������(�#/045/3 ��6�$������***' 7
2�$���� � '�(�)*+ ��,*- �,$0// ���"��� #/00 1/// 13/ �������(�#/045/3 ��6�$������***' 7
4�$�'�9 � '�(�)*+ ��,*- �,$0// ���"��� #/00 1/0# 13/ �������(�#/045/3 ��6�$������***' 7
4�$�'�9 �,*++*�-�,*-� �,�0// ���"��� #/0/ 23/4 13/ �������(�#/045/3 ��6�$������***' 7
:�$���� �*--*�-�,'� 6$/2 ��"����9� 0... 0.. 1// �������21/3 ��6�$������***' 7
8�$�;� �,*++*�-�,*-� �,�0// ���"��� #/00 1/8: 13/ �������(�#/045/3 ��6�$������***' 7
3�$�;� �,*++*�-�,*-� �,�0// ���"��� #/00 2#:0 13/ �������(�#/045/3 ��6�$������***' 7
.�$��9 � '�(�)*+ ��,*- �,$0// ���"��� #/00 1/84 13/ �������(�#/045/3 ��6�$������***' 7
.�$���& 6��<�*++� =>*)� �( �$0#/ ���"��� #/00 12/ :// '(�#8 ��6�$������***' 7
.�$���& 6��<�*++� =>*)� �( �$0#/ ���"��� #/00 108 :// '(�#8 ��6�$������***' 7