air pollution monitoring project in vietnam - gofc...
TRANSCRIPT

T H A N H T . N . N G U Y E N , H U N G Q . B U I , H U N G V . L U U , H A V . P H A M , B A N G H . P H A M
U N I V E R S I T Y O F E N G I N E E R I N G A N D T E C H N O L O G Y , V I E T N A M N A T I O N A L U N I V E R S I T Y H A N O I
Air pollution monitoring project in Vietnam
International Workshop on Air Quality in AsiaInventory, Modeling and Climate Impacts of Greenhouse Gas emissions (GHG’s) and Aerosols; Remote
sensing applications and integrated Technology
Hanoi, June 24-26, 2013
1

Outline
Introduction
Objective and Approach
Daily PM2.5 estimation
PM2.5/PM10 estimation using Landsat 8 images
Conclusion
2

Outline
Introduction
Objective and Approach
Daily PM2.5 estimation
PM2.5/PM10 estimation using Landsat 8 images
Conclusion
3

Introduction
Aerosol Optical Thickness/Aerosol Optical Depth
Particulate Matter concentration PM1/2.5/10 Direct measurements In-direct estimation
Meteorological data Aerosol
Air Quality Index
AERONET sites distributed over world
C-130 aircraft in ACE-Asia Campaign 2001 (UCAR/NSF)
MODIS instrument on Terra satellite
4

Air pollution in Vietnam5
PM1o in Hanoi, DaNang,
Hochiminh Cities from 2005 to
2009 (Source: TTKTTV Quốc
Gia, 2010; Chi cục BVMT Tp. Hồ Chí Minh, 2010)
TSP in Vietnam in urban areas from
2005 to 2009(Source: Các trạm
QT&PTMT vùng (Đất liền 1,2,3); Mạng lưới QTMT
quốc gia, 2010)
Air pollution in Vietnam6
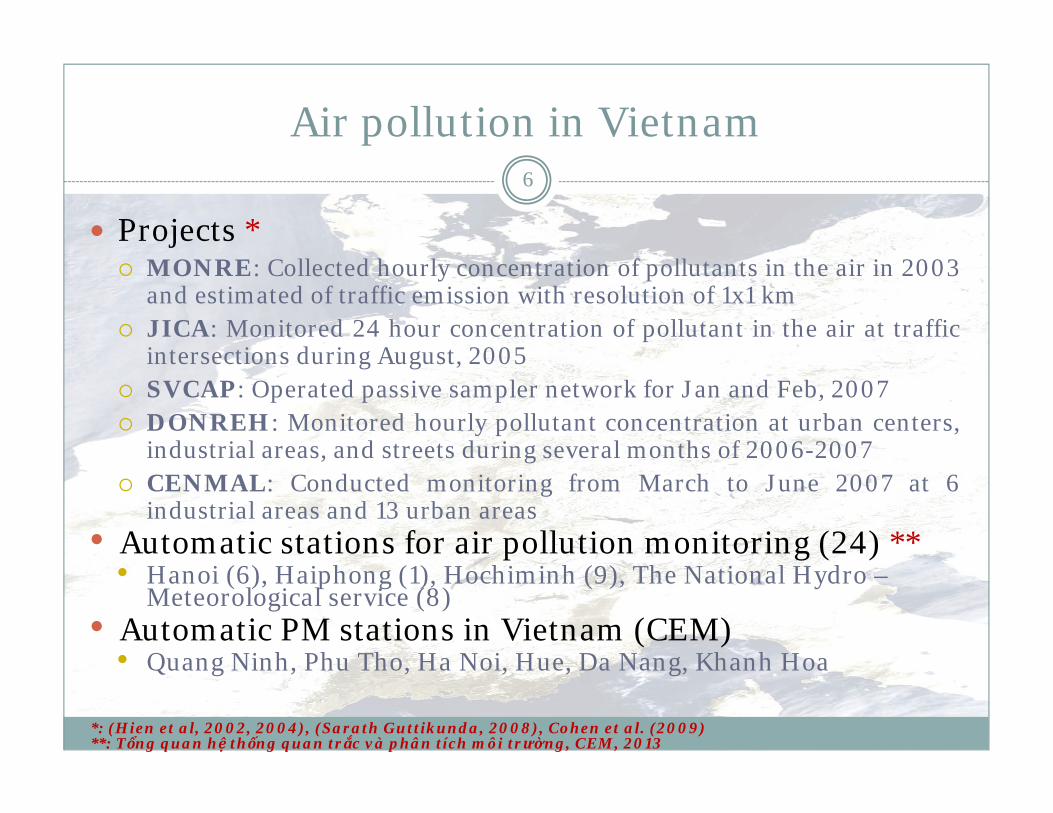
Projects * MONRE: Collected hourly concentration of pollutants in the air in 2003
and estimated of traffic emission with resolution of 1x1 km JICA: Monitored 24 hour concentration of pollutant in the air at traffic
intersections during August, 2005 SVCAP: Operated passive sampler network for Jan and Feb, 2007 DONREH: Monitored hourly pollutant concentration at urban centers,
industrial areas, and streets during several months of 2006-2007 CENMAL: Conducted monitoring from March to June 2007 at 6
industrial areas and 13 urban areas• Automatic stations for air pollution monitoring (24) **
• Hanoi (6), Haiphong (1), Hochiminh (9), The National Hydro –Meteorological service (8)
• Automatic PM stations in Vietnam (CEM)• Quang Ninh, Phu Tho, Ha Noi, Hue, Da Nang, Khanh Hoa
*: (Hien et al, 2002, 2004), (Sarath Guttikunda, 2008), Cohen et al. (2009)**: Tổng quan hệ thống quan trắc và phân tích môi trường, CEM, 2013

Outline
Introduction
Objective and Approach
Daily PM2.5 estimation
PM2.5/PM10 estimation using Landsat 8 images
Conclusion
7

Project’s Overview
8
Objective: Developing an Air pollution monitoring and warning system in Vietnam using satellite images
Leader: Thanh T.N. Nguyen
Starting Time: Jan 2014 Sponsor: VNU UET Partners:
CEM, Vietnam Environment Administration
CEMA, Hanoi Natural resources and Environmental Department
MEEO s.r.l, FE, Italy VUB, Brussel, Belgium
GIS data
‐ Administration ‐ Land Cover ‐ DEM
Data Management
Aerosol Estimation
Air Pollution Warning Generator
Report Generator
Ground‐based
Closed DB
PM2.5/10
Open DB
AOT/AOD
Open DB
Met. data
Closed DB
MODIS/NPP LandSat
Open DB
MODIS/NPP at UET
SPOT 5
Closed DB Satellite
Air Quality Monitoring's User Interface
Particulate Matter concentration Estimation
Air Quality Estimation
Spatio‐tempo Database
System Architecture

Research Objective and Approach9
Objectives Monitor PM2.5/PM10 based on satellite images Provide products at different spatial and temporal scales
Approach Estimate PM2.5
Daily basis, 10 km and 6 km (MODIS/NPP AOT ), Over Vietnam
Estimate PM2.5/PM10 using Landsat 8 images When required, 90 – 150 m for urban areas, at city scale

Outline
Introduction
Objective and Approach
Daily PM2.5 estimation
PM2.5/PM10 estimation using Landsat 8 images
Conclusion
10

Approach11
Study area: Vietnam Data: Satellite-based aerosol: MOD04/MYD04
aerosol products (daily, 10km) Satellite-based meteorological products:
MOD07/MYD07 Ground - measurements PM2.5 from 5 CEM
automatic stations Ground –measurements AOT from 7
AERONET stations Methodology: Develop PM2.5 regression model based on
aerosol and meteorological data Develop interpolation model on PM2.5 to
obtain continuing maps

MODIS AOT vs. AERONET AOT12
Data
Number of samples: 429 R = 25km, T = 30min
R2=0.79
R² = 0.7901
-0.5
0
0.5
1
1.5
2
2.5
3
3.5
4
0 0.5 1 1.5 2 2.5 3
StationBac
GiangBach Long
Vy Bac Lieu Nghia Do Nha TrangRed River
Delta Son LaNumber of
Samples 169 13 89 48 87 2 21Data acquisition
time range3/2003 -12/2009
5/2010 -6/2011
3/2003 -6/2013
12/2010 -6/2013
11/2011 -6/2013
3/2010 -6/2010
3/2012 -4/2013

Satellite- vs. Ground-based measurements13
HN HUE KH PT DNSamples 34 84 144 75 163
PM2.5-AOD 0.123 0.084 0.045 0.143 0.257
PM2.5-Temp
0.286 0.513 0.155 0.647 0.194
R2(502 samples)
PM1PM2.
5PM10
MOD07 Pressure
MOD07 Temp
CEMCEM Pres. 0.0400 0.0300 0.0069 0.05CEM Temp. 0.5300 0.5100 0.2770 0.7
MOD07MOD07 Pres. 0.01470 0.0090 0.0009MOD07 Temp. 0.4200 0.4100 0.2360
MOD04 MOD AOD 0.2370 0.2200 0.1100

PM2.5 Regression14
020406080
100120140160180
HN HUE PT DN
Number of samples over PM stations
0
5
10
15
20
25
30
35
40
Jan Feb Mar Apr May Jun Jul Aug Sep Oct Nov Dec
Number of Samples by Year
2012
2013
2014
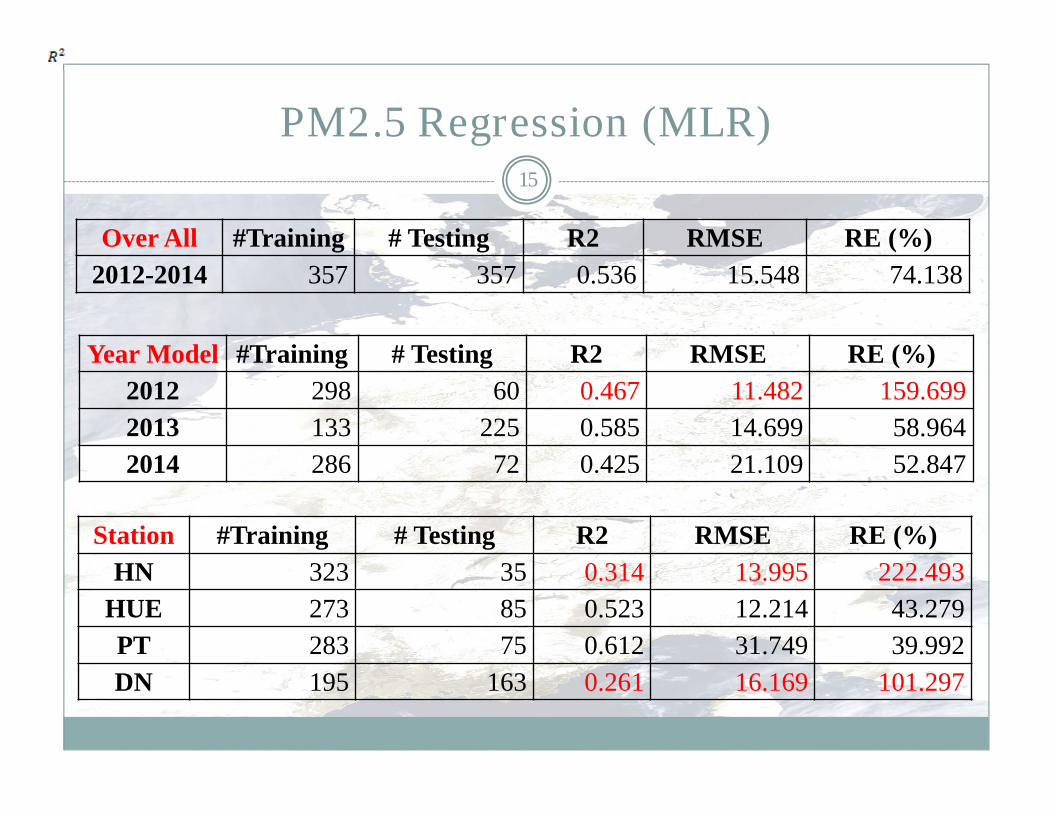
PM2.5 Regression (MLR)15
Year Model #Training # Testing R2 RMSE RE (%)2012 298 60 0.467 11.482 159.6992013 133 225 0.585 14.699 58.9642014 286 72 0.425 21.109 52.847
Station #Training # Testing R2 RMSE RE (%)HN 323 35 0.314 13.995 222.493
HUE 273 85 0.523 12.214 43.279PT 283 75 0.612 31.749 39.992DN 195 163 0.261 16.169 101.297
Over All #Training # Testing R2 RMSE RE (%)2012-2014 357 357 0.536 15.548 74.138

16
2014.024.03102012.308.0350
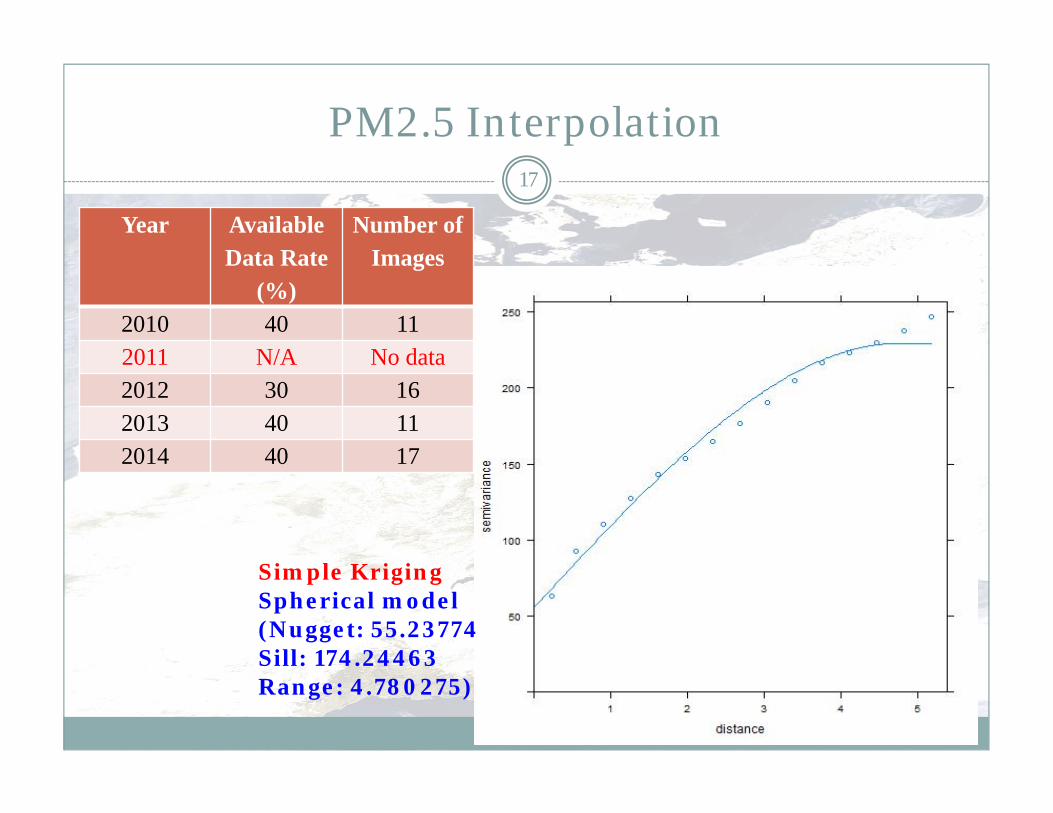
PM2.5 Interpolation17
Year Available Data Rate
(%)
Number of Images
2010 40 112011 N/A No data2012 30 162013 40 112014 40 17
Simple KrigingSpherical model (Nugget: 55.23774Sill: 174.24463Range: 4.780275)
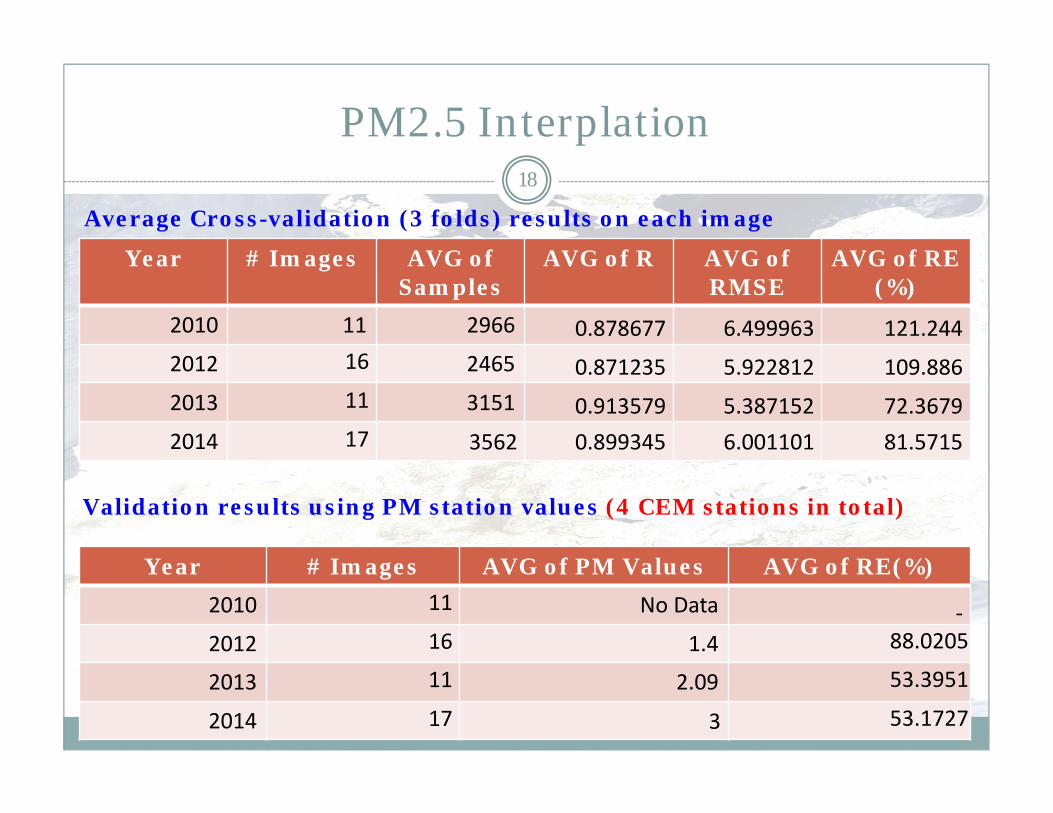
PM2.5 Interplation18
Year # Images AVG of Samples
AVG of R AVG of RMSE
AVG of RE (%)
2010 11 2966 0.878677 6.499963 121.2442012 16 2465 0.871235 5.922812 109.8862013 11 3151 0.913579 5.387152 72.36792014 17 3562 0.899345 6.001101 81.5715
Year # Images AVG of PM Values AVG of RE(%)2010 11 No Data ‐2012 16 1.4 88.0205
2013 11 2.09 53.3951
2014 17 3 53.1727
Average Cross-validation (3 folds) results on each image
Validation results using PM station values (4 CEM stations in total)

19
2014.024.03102012.308.0350
Cross Validation (3 folds) Station ValidationImage % Data R RE (%) # Data RE (%)
2012.308.0350 30% 0.918381 53.4267 2 10.26702014.024.0310 60% 0.917052 12.3272 3 18.4624

Outline
Introduction
Objective and Approach
Daily PM2.5 estimation
PM2.5/PM10 estimation using Landsat 8
images
Conclusion
20

Approach21
Develop PM2.5/PM10 estimation using Landsat 8 images Study area: Hanoi Data: LandSat 8, directly measured PM10 Methodology:
Estimating relative aerosol from LandSat 8 * Applying regression and interpolation to estimate PM10 map
using relative aerosol from Landsat 8 and measured PM10
*:Sifakis N., Mapping of Air Pollution Using SPOT Satellite Data, 1992

Relative Aerosol Estimation22
Study area: Hanoi, Vietnam Images Destination: 2014-019 Reference: 2013-160
AERONET station Nghia Do, Hanoi (Long=105.800, Lat=21.048)
Validation
AERONET Target AVG of 9 points
0.64313 0.725444 1.067241

23

Outline
Introduction
Objective and Approach
Daily PM2.5 estimation over Vietnam
PM2.5/PM10 estimation using Landsat 8 images
Conclusion
24

Conclusion25
Overview of Air pollution monitoring project in Vietnam
PM2.5 estimation using MODIS aerosol and meteorological Data Daily product at 10 km spatial resolution Moderate quality Ancillary data (DEM, LC) should be included
Relative aerosol estimation in Hanoi from LandSat 8 image Get some qualitative results Need more investigation

Q & A
T H A N K Y O U F O R Y O U R A T T E N T I O N
26