aims and scope the chinese university of hong kong china ...the role of cross-listing, foreign...
TRANSCRIPT

CYAN MAGENTA YELLOW BLACK
Volume 5 • Issue 3 • September 2012Consulting Editors
Bin Ke,
Nanyang Technological University
T.J. Wong,
The Chinese University of Hong Kong
Editors-in-ChiefJeong-Bon Kim,
City University of Hong Kong
Minghai Wei, Sun Yat-sen University
Associate EditorsDonghua Chen, Nanjing University
Yuan Ding,
China Europe International Business School
Clive S. Lennox,
Nanyang Technological University
Oliver Zhen Li,
National University of Singapore
Feng Liu, Xiamen University
Oliver Meng Rui,
The Chinese University of Hong Kong
Xijia Su,
China Europe International Business School
Editorial BoardSudipta Basu, Temple University
Jeffrey Callen, University of Toronto
Charles J.P. Chen,
China Europe International Business School
Shimin Chen,
China Europe International Business School
Shijun Cheng, University of Maryland
Zhaoyang Gu, University of Minnesota
Thomas Jeanjean, Essec Business School
Guohua Jiang, Peking University
Changjiang Lv, Fudan University
Zengquan Li,
Shanghai University of Finance and Economics
Bin Lin, Sun Yat-sen University
Gerald Lobo, University of Houston
Suresh Radhakrishnan,
University of Texas at Dallas
Yifeng Shen, Xiamen University
Dan A. Simunic,
The University of British Columbia
Herve Stolowy,
HEC Paris
Yuetang Wang, Nanjing University
Donghui Wu,
The Chinese University of Hong Kong
Liansheng Wu, Peking University
Joanna Shuang Wu,
University of Rochester
Xi Wu,
Central University of Finance and Economics
Zezhong Xiao, Cardiff University
Yu Xin, Sun Yat-sen University
Tianyu Zhang,
The Chinese University of Hong Kong
Language AdvisorJohn Nowland, City University of Hong Kong ISSN 1755-3091
Available online at www.sciencedirect.com
Production and hosting by Elsevier
China Journal ofAccountingResearch
The role of cross-listing, foreign ownership and state owner-ship in dividend policy in an emerging marketKevin C.K. Lam, Heibatollah Sami, Haiyan Zhou 199
Banking system reform, earnings quality and credit allocationXiuli Zhu, Lianjun Li, Yunkui Xue 217
Internal corporate governance and the use of IPO over-financing: Evidence from ChinaXin Xu, Yun Xia 231
An empirical study of the effect of venture capital participationon the accounting information quality of IPO firmsZhiying Hu, Weixing Cai, Jinjin Han, Rula Sa 251
5/3
Ch
ina
Jo
urn
al
of
Acco
un
ting
Researc
hV
ol.
5/3
(2012)
199–
268
EL
SE
VIE
R
Aims and Scope
The focus of the China Journal of Accounting Research is to publish theoretical and empiricalresearch papers that use contemporary research methodologies to investigate issues aboutaccounting, finance, auditing and corporate governance in China, the Greater China regionand other emerging markets. The Journal also publishes insightful commentaries aboutChina-related accounting research. The Journal encourages the application of economic andsociological theories to analyze and explain accounting issues under Chinese capital marketsaccurately and succinctly. The published research articles of the Journal will enable scholarsto extract relevant issues about accounting, finance, auditing and corporate governance relate thatto the capital markets and institutional environment of China.
China Journal of Accounting Research
Website: http://www.cnjar.comhttp://www.cb.cityu.edu.hk/research/cjar

Production and hosting by Elsevier
Radarweg 29, 1043 NX Amsterdam, The Netherlands
ISSN 1755-3091
� China Journal of Accounting Research
Founded by Sun Yat-sen University and City University of Hong Kong
Sponsored by:
Published quarterly in March, June, September, and December
All rights reserved. No part of this journal may be reproduced, stored in a retrieval system or transmitted in any means, elec-tronic, mechanical, photocopying, recording or otherwise, without the prior permission of Editorial Office of China Journal ofAccounting Research.
Notice
No responsibility is assumed by China Journal of Accounting Research nor Elsevier for any injury and/or damage to persons,property as a matter of product liability, negligence, or otherwise, or from any use or operation of any methods, products, in-structions, or ideas contained in the material herein. Although all advertising material is expected to conform to ethical stan-dards, inclusion in this publication does not constitute a guarantee or endorsement of the quality or value of such product or ofthe claims made of it by its manufacturer.
Guidelines for Manuscripts Submitted toThe China Journal of Accounting Research
The China Journal of Accounting Research ‘‘CJAR’’ (ISSN 1755-3091) publishes quarterly. It contains peer-reviewedarticles and commentaries on accounting, auditing and corporate governance issues that relate to the greater China region.
We welcome the submission of both theoretical and empirical research papers pertinent to researchers, regulators and practi-tioners. Authors should note:
1 Submissions must be original contributions and not under consideration by any other journal. The author must state the workis not submitted or published elsewhere.
2 Authors submitting articles, notes and comments will be entitled to two free copies. Each author of a book review will receivea copy of the relevant issue.
3 Authors should submit their manuscripts (in Word format) via email to [email protected]. All text, including endnotes,must be double-spaced. Authors will be notified when manuscripts are received by CJAR.
4 Authors should note:
• a cover page showing the title of the paper, the author’s name, title and affiliation, e-mail address, and any acknowledge-ment should be included.
• to promote anonymous review, author(s) should confine his/her identify (such as name, affiliation, biographical informa-tion, and acknowledgment) to the cover page only.
• supply an abstract of about 120 words, stating the study’s findings, sample and methodology in that order.
• key terms used in the text should be defined or explained as early as possible after they are first introduced.
• words in a foreign language are to be in italics.
• all citations in the text should refer to the author’s (or authors’) name and the year of publication.
Examples: ‘‘the debt contracting explanation for conservatism (Watts and Zimmerman, 1986; Basu, 1997; Ahmed et al,2002). Using the Basu (1997) asymmetric timeliness regression’’
• include a list of reference for works cited as follows:
• reference to a journal publication:
Basu, S., Waymire, G.B., 2006. Record keeping and human evolution. Accounting Horizons 20 (3), 201–229.
• reference to a book:
Watts, R.L., Zimmerman, J.L., 1986. Positive accounting theory. Prentice Hall, Englewood Cliffs, NJ.
• reference to a chapter in an edited book:
Ball, R., 2001. Infrastructure requirements for an economically efficient system of public financial reporting and disclo-sure, 127–169. In: Litan, R., Herring, R. (Editors), Brookings-Wharton Papers on Financial Services. Brookings InstitutionPress, Washington, DC.
• omit all full stops in abbreviations. Example: ‘eg’, ‘ie’, ‘Co’, ‘Ltd’, ‘etc’
• dates are in the order – date, month, year, eg ‘5 May 1975’
• quotation marks are single, but within a quotation are double.
• use endnotes rather than footnotes.
• put each table on a separate sheet; do not embed in the text but indicate where the table would best be inserted.
5 China Journal of Accounting Research copyright in works published by CJAR.
For additional information, please contact Irene Li, Department of Accountancy, City University of Hong Kong, Tat Chee Avenue,Kowloon Tong, Hong Kong. Telephone: +852 3442 7932. Fax: +852 3442 0349. E-mail: [email protected].

CHINA JOURNAL OF ACCOUNTING RESEARCH
Volume 5/3 (2012)
Available online at www.sciencedirect.com
Production and hosting by Elsevier

Consulting Editors:
Bin Ke
Nanyang Technological University
T.J. Wong
The Chinese University of Hong Kong
Editors-in-Chief
Jeong-Bon KimCity University of Hong Kong
Minghai WeiSun Yat-sen University
Associate Editors
Donghua Chen
Nanjing University
Yuan Ding
China Europe International Business School
Clive S. Lennox
Nanyang Technological University
Oliver Zhen Li
National University of Singapore
Feng Liu
Xiamen University
Oliver Meng Rui
The Chinese University of Hong Kong
Xijia Su
China Europe International Business School
Editorial Board
Sudipta Basu, Temple UniversityJeffrey Callen, University of Toronto
Charles J.P. Chen, China Europe International Business School
Shimin Chen, China Europe International Business SchoolShijun Cheng, University of Maryland
Zhaoyang Gu, University of MinnesotaThomas Jeanjean, Essec Business School
Guohua Jiang, Peking UniversityChangjiang Lv, Fudan University
Zengquan Li, Shanghai University of Finance and EconomicsBin Lin, Sun Yat-sen University
Gerald Lobo, University of HoustonSuresh Radhakrishnan, University of Texas at Dallas
Yifeng Shen, Xiamen UniversityDan A. Simunic, The University of British Columbia
Herve Stolowy, HEC ParisYuetang Wang, Nanjing University
Donghui Wu, The Chinese University of Hong KongLiansheng Wu, Peking University
Joanna Shuang Wu, University of RochesterXi Wu, Central University of Finance and Economics
Zezhong Xiao, Cardiff UniversityYu Xin, Sun Yat-sen University
Tianyu Zhang, The Chinese University of Hong Kong
Language Advisor
John Nowland, City University of Hong Kong

The role of cross-listing, foreign ownership and state ownershipin dividend policy in an emerging market
Kevin C.K. Lam a,⇑, Heibatollah Sami b, Haiyan Zhou c
a School of Accountancy, The Chinese University of Hong Kong, Hong Kongb Department of Accounting, Lehigh University, Bethlehem, PA 18015, USAc Department of Accounting and Business Law, College of Business Administration, The University of Texas - Pan American, USA
A R T I C L E I N F O
Article history:
Received 9 September 2011Accepted 25 June 2012Available online 7 September2012
JEL classification:
G30G34G35
Keywords:
Agency problemsCorporate governanceCash dividendsStock dividendsOwnership structureCross listingsEmerging markets
A B S T R A C T
In this paper, we investigate if dividend policy is influenced by ownership type.Within the dividend literature, dividends have a signaling role regardingagency costs, such that dividends may diminish insider conflicts (reduce freecash flow) or may be used to extract cash from firms (tunneling effect) – whichcould be predominant in emerging markets. We expect firms with foreign own-ership and those that are listed in overseas markets to have different dividendpolicies and practices than those that are not, and firms with more state own-ership and less individual ownership to be more likely to pay cash dividendsand less likely to pay stock dividends. Using firms from an emerging economy(China), we examine whether these effects exist in corporate dividend policyand practice. We find that both foreign ownership and cross-listing have signif-icant negative effects on cash dividends, consistent with the signaling effect andthe notion of reduced tunneling activities for firms with the ability to raise cap-ital from outside of China. Consistent with the tunneling effect, we find thatfirms with higher state ownership tend to pay higher cash dividends and lowerstock dividends, while the opposite is true for public (individual) ownership.Further analysis shows that foreign ownership mediates the effect of stateownership on dividend policy. Our results have significant implications forresearchers, investors, policy makers and regulators in emerging markets.
� 2012 China Journal of Accounting Research. Founded by Sun Yat-senUniversity and City University of Hong Kong. Production and hosting by
Elsevier B.V. All rights reserved.
1755-3091/$ - see front matter � 2012 China Journal of Accounting Research. Founded by Sun Yat-sen University and City University of
Hong Kong. Production and hosting by Elsevier B.V. All rights reserved.
http://dx.doi.org/10.1016/j.cjar.2012.06.001
⇑ Corresponding author.E-mail addresses: [email protected] (K.C.K. Lam), [email protected] (H. Sami), [email protected] (H. Zhou).
Production and hosting by Elsevier
China Journal of Accounting Research 5 (2012) 199–216
Contents lists available at SciVerse ScienceDirect
China Journal of Accounting Research
journal homepage: www.elsevier .com/locate /c jar
1. Introduction
Corporate dividend policy has attracted the interest of researchers of capital markets and corporate behav-ior for almost half a century. Today, corporate governance and ownership structure issues continue to be ofmajor interest to researchers, practitioners and policy makers, in particular following accounting scandalssuch as Enron and WorldCom in 2002 and the corresponding legislative reforms such as the Sarbanes–OxleyAct in the United States. Empirical research on corporate governance is based on the theoretical framework ofagency theory (e.g., Jensen and Meckling, 1976; Fama and Jensen, 1983), which provides a framework toexplain how to create an effective monitoring and incentive scheme under uncertainty and incomplete infor-mation. Following this line of research, the literature has argued that dividends can be used to prevent insidersfrom diverting retained earnings for their own benefit. In countries with strong investor protection, dividendsare found to play a useful role in reducing agency problems, whereas they play a less important role in coun-tries with weak investor protection (La Porta et al., 2000). China is a civil law country with weak investor pro-tection and according to the La Porta et al. (2000) model, lower dividend payout ratios are expected. However,along with dynamic changes, extremely high payout ratios have been observed in China (Chen et al., 2009). Inthis paper, we shed light on such a dilemma by focusing on whether corporate ownership structure has aninfluence on corporate dividend policies.
Corporate ownership structure could be associated with dividend policy and practice in that dividends sig-nal the extent of conflicts between majority shareholders and minority shareholders (e.g. Jensen et al., 1992).While empirical studies have documented the significant role of ownership variables in determining dividendpolicies (Thomsen, 2005; Mancinelli and Ozkan, 2006; Khan, 2006; Szilagyi and Renneboog, 2007), the resultsare quite mixed. For instance, Szilagyi and Renneboog (2007) find a positive relationship between stakehold-ers’ ownership and dividends for Dutch firms, while Thomsen (2005) and Khan (2006) find a negative relation-ship for UK firms.
In addition, the potential impact of foreign stockholder ownership has been largely neglected, especially inemerging markets where the ownership structures and institutional background are significantly different fromthose of developed economies. In a recent study, Ferguson et al. (2002) show that the disclosure policies anddisclosure behavior of Chinese firms issuing cross-listed shares on the Stock Exchange of Hong Kong (H-shares on SEHK) were very different from other SEHK-listed firms and state-owned firms incorporated inHong Kong (Red-chip shares), which they attribute to signaling incentives and cost-benefit concerns. Suchdifferences might also exist for dividend policies and practices. If dividends play a signaling role, then the factthat firms are listed overseas may have a significant influence on their dividend policies and practices com-pared to those that are not. Therefore, in an emerging market setting, we investigate whether there are signif-icant differences in dividend policies and practices between firms with cross-listed shares and/or foreignownership and those without.
Other motivations of our study come from the unique institutional setting of public firms in China. Theliterature has documented several possible motivations for public firms to pay dividends, such as to signalfirms’ future prospects to investors (e.g., Bhattacharya, 1979; John and Williams, 1985), restrain agency prob-lems by forcing firms to external capital markets with additional monitoring (Rozeff, 1982; Easterbrook,1984), reduce management’s opportunity to invest the firm’s free cash flow in projects that benefit manage-ment at shareholders’ expense (Jensen, 1986) or projects that benefit controlling shareholders at minorityshareholders’ expense (Faccio et al., 2001) and to minimize taxes (Wilkinson et al., 2001).
However, in contrast to the earlier hypothesis that dividend payments are a vehicle to constrain the agencybehavior of managers (e.g., Jensen, 1986), cash dividends are preferred by majority shareholders in emergingmarkets (Chen et al., 2009). This may occur because the firms listed in emerging markets are mostly equitycarve-outs, a term used to indicate that these firms were originally part of assets or subsidiaries of state-ownedenterprises and were chosen to be listed because they were relatively attractive to investors. Earlier literaturehas documented that Chinese firms with a controlling state shareholder are more likely to pay cash dividendsand state shareholders are more likely to surrender the exercise of stock subscription rights (Wei et al., 2004).1
1 Rights offerings are the offering to existing shareholders of rights to subscribe to common stocks.
200 K.C.K. Lam et al. / China Journal of Accounting Research 5 (2012) 199–216

Such dividend practices are similar to transferring state shares to other minority shareholders at a transferprice higher than a price under private placement (Lee and Xiao, 2004).2
In contrast, stock dividends can play a different role from cash dividends in the emerging market of China.First, firms with better prospects are more capable of signaling through stock dividend distribution, which isthe only available signaling alternative as stock splits are not allowed in China. Second, stock dividend distri-butions restrict a firm’s ability to pay cash dividends in the future, indicating that stock dividends are lesslikely to be used by state shareholders as such dividends limit their ability to obtain cash from listed companiesin the future. Furthermore, stock dividend distribution can increase the share’s liquidity and its attractivenessto investors (Lakonishok and Lev, 1987).
In summary, cash dividends and stock dividends play different roles in China. Cash dividends, coupled withnon-subscription of shares in subsequent rights offers, represent the return of cash to controlling shareholdersand such behavior is termed ‘tunneling’ in the recent literature. Stock dividends, without entailing actual cashoutflow, cannot play such a tunneling role but can be used as a credible mechanism to convey insider infor-mation to investors. China provides a unique setting for researchers to study the difference between cash div-idends and stock dividends and their determinants.
Both the policies and practices related to cash dividends and stock dividends are examined in our paper toobtain a sufficient understanding of their roles and relationships with corporate ownership structure in theemerging market of China. In addition, along with the roles of cross-listings and foreign ownership in influ-encing dividend policy, which have not been examined and are one of the aims of our paper, we also inves-tigate the effects of state-ownership and individual ownership on dividends to obtain a comprehensiveunderstanding of the different roles of various shareholders in the same setting. Finally, we control for otherfactors that are considered as determinants of dividends in the literature. These factors include firm size, lever-age, risk, growth opportunity, free cash flow and profitability (Alpa, 2005; Goergen et al., 2005).
We find that firms with higher foreign ownership and cross-listed firms are less likely to distribute cash div-idends, which are consistent with the notion of reduced tunneling activities for firms with the ability to raisecapital outside of China. We also find that firms with higher state ownership tend to pay higher cash dividendsand lower stock dividends, indicating that the tunneling effect dominates the signaling effect for firms withhigher state ownership. Furthermore, firms with higher individual ownership tend to pay higher stock divi-dends and lower cash dividends, where the signaling effect dominates.
Our paper adds to the literature by exploring the role of cross-listing and foreign ownership in determiningdividend policy. In particular, we extend the current literature by examining whether companies issuing B-shares, H-shares (in Hong Kong) or cross listed in the US or other markets follow a different policy than doc-umented in early studies on firms issuing only domestic shares (e.g., Wei et al., 2004).
In addition, our study provides updated research on the relationship between corporate ownership struc-ture and dividends. In light of the changes in regulation and ownership, we find a trend toward less cash div-idends and more stock dividends during our sample period, which is in contrast to the trend toward more cashdividends and less stock dividends found by earlier studies, such as Wei et al. (2004) with a sample period from1995 to 2000.
Finally, our paper contributes to the understanding of whether and how majority shareholders use dividendpolicies to facilitate tunneling cash to themselves. For instance, the role of state shareholders in the uniquesetting of the emerging market of China can help us obtain a better understanding of the role of governmentownership in business.
The paper is organized as follows. Section 2 discusses the regulatory requirements of dividend policy inChina, including the types of dividends and the institutional setting relevant to dividend policies. The litera-ture review and hypothesis development are included in Section 3. Section 4 discusses the sample, variablesand empirical method used in examining the association between dividend policy and corporate ownership
2 State shares were typically non-tradable during the period of our study. They could only be bought and sold through private placementwith special approval from the government. However, as discussed later in the paper, in 2005, the Chinese government launched a reformon split share structure by converting non-tradable shares (state and legal person shares) into tradable shares. Nonetheless, it has beenargued that the change has only been superficial and the shares, even after the conversion, are “de facto non-tradable shares” (Cheng et al.,2009). Moreover, the dates that these shares can be converted occur after 2006, which is outside the period of our study. Note 8 below alsoreports the results from sensitivity tests to examine the conversion effect on our analysis.
K.C.K. Lam et al. / China Journal of Accounting Research 5 (2012) 199–216 201

structure. Section 5 provides the results of our empirical analysis. Finally, Section 6 presents the conclusionsand implications.
2. Regulatory requirements of dividend policy in China
2.1. Dividend policy in China
Three general forms of dividend policies are used in public firms in China: cash dividends, stock dividendsand a combination of the two (Milonas et al., 2006). There is no mandatory dividend rule that requires a cer-tain percentage of net income or retained earnings to be paid out as dividends and listed companies areallowed to make their own dividend policies (Wei et al., 2004). However, when the board of directors of a firmproposes a distribution of dividends, the proposed dividend policy is subject to final approval at the sharehold-ers’ meeting (Milonas et al., 2006). Moreover, the details are required to be announced in designated newspa-pers along with the interim or annual report. In particular, listed firms should explicitly show the source ofdividends in their annual report (Wei et al., 2004).3
The dividend policies of listed companies have experienced significant changes since the establishment ofstock markets in China. In the early stage of the stock markets, firms tended to distribute stock dividendsrather than cash dividends. For instance, in 1992, about 96.23% of firms distributing dividends paid stock div-idends, while in 2000 only 11.25% paid stock dividends (Wei et al., 2004). The same study reported that onaverage, 53.5% of firms distributed cash dividends from 1992 to 2001. Table 1 provides information usingmore recent data. The percentage of firms paying only cash dividends fell from 51.91% in 2001 to 38.02%in 2006, while firms paying only stock dividends ranged from 4.91% in 2001 to 9.76% in 2006 with fluctuationsin between. Firms distributing both cash and stock dividends ranged from 7.72% to 13.94% during the sameperiod. Non-dividend payers rose from 31% in 2001 to 40.67% in 2006. Thus, our results show an inverse trendwhen compared to the 1995–2000 results of Wei et al. (2004). Fewer firms paid cash dividends over the periodof 2001–2006 than the previous period, which warrants investigation to shed light on this shift in dividendpolicies.
2.2. Institutional factors that affect dividend policy
There are a few institutional features that affect dividend policies. First, state shareholders seem to play adominant role in determining dividend policies. Most of the listed companies in China are state-owned and thegovernment has enormous discretion on dividend policy (Wei et al., 2004). Although the number of privately-owned listed companies has increased over time, most listed companies are still controlled by state sharehold-ers. Table 2 illustrates the ownership situation of listed firms in China from 2001 to 2006. For non-tradableshares, state ownership declined from 40.8% in 2001 to 28.8% in 2006. Management ownership (insideemployee ownership) decreased from 0.71% in 2001 to 0.1% in 2006. Institutional ownership changed from18.29% in 2001 to 19% in 2006.4 For tradable shares, public ownership increased from 35.95% in 2001 to45.88% in 2006. Foreign ownership (combination of B-shares and H-shares) decreased slightly from 3.06%in 2001 to 2.71% in 2006.
Second, the role of minority shareholders in corporate governance is limited in China (Jiang et al., 2010).The Chinese legal system offers few options for minority shareholders to take private enforcement against mis-conduct by large shareholders. The authority of regulators to enforce punitive action is also restricted. In addi-tion, as institutional investors, such as mutual funds, are at a primitive stage in this emerging market, it ismore difficult for a fund to influence corporate governance compared to its counterparts in the United States.
3 The source of stock dividends can be from capital reserves, surplus reserves and/or undistributed profits. Capital surplus refers tocapital accumulation due to the increase of net assets resulting from non-operating activities, such as premium on paid in capital, receipt ofdonations, government appropriations and foreign currency translation difference. Surplus reserve refers to the reserves setup from profitsannually in accordance with government regulations. Article 177 of the Chinese Company Law requires an amount of 10% of after-taxprofits to be provided annually to the surplus reserve.
4 As also suggested in Note 2 above, the figures should be interpreted within the context of the 2005 share structure reform launched bythe China Securities Regulatory Commission (CSRC, 2005).
202 K.C.K. Lam et al. / China Journal of Accounting Research 5 (2012) 199–216

The average ownership by all mutual funds was only 3.75% of total shares outstanding in 2004 (Jiang et al.,2010). Hence, it is more difficult for a fund to influence corporate governance compared to its counterparts inthe US.
Finally, controlling shareholders of public firms seem to prefer cash dividends to stock dividends in China,where most firms are carved out from state-owned enterprises (SOEs). As the government restrictively regu-lates both IPOs and seasoned equity financing, many firms and their holding companies are short of workingcapital. Moreover, state shares are not tradable in the market (Sami and Zhou, 2004). In such a setting, con-trolling shareholders, particularly in SOEs, may force listed firms to pay cash dividends to fulfill their capitalneeds (Lee and Xiao, 2004).
Table 1Number and percentage of China listed firms with cash and/or stock dividends. This table reports the number and percentage of firmspaying no dividends and those of firms paying cash (stock) dividends from 2001 to 2006. In China some firms pay stock dividends and cashdividends at the same time, some pay only stock dividends or only cash dividends, and others pay no dividends.
2001 2002 2003 2004 2005 2006
Firms paying only cash dividends
Number of firms 571 519 513 554 507 530Percentage of all listed firms (%) 51.91 45.41 42.12 41.75 37.78 38.02
Firms paying only stock dividends
Number of firms 54 55 55 55 50 136Percentage of all listed firms (%) 4.91 4.81 4.52 4.14 3.73 9.76
Firms paying both stock and cash dividends
Number of firms 134 95 94 185 134 161Percentage of all listed firms (%) 12.18 8.31 7.72 13.94 9.99 11.55
Non-dividend payers
Number of firms paying neither cash nor stock dividends 341 474 556 533 651 567Percentage of all listed firms (%) 31.00 41.47 45.65 40.17 48.51 40.67All listed firms 1100 1143 1218 1327 1342 1394
Table 2Average ownership structure of listed companies from 2001 to 2006 (%). This table reports descriptive statistics of the ownership structureof listed firms in China. Source: TEJ database.
2001 (%) 2002 (%) 2003 (%) 2004 (%) 2005 (%) 2006 (%)
Non-tradable shares
State-owned shares 40.81 40.46 38.50 35.90 34.18 28.75Inside employee shares 0.71 0.44 0.20 0.18 0.12 0.10Domestic institutional shares 11.36 11.34 12.71 14.48 14.83 16.03Placement institutional shares 6.93 6.83 6.88 6.64 6.06 2.96Other shares 0.13 0.37 0.82 1.92 1.74 2.18Foreign institutional shares 1.05 1.01 1.18 1.30 1.40 1.39Subtotal 60.99 60.45 60.29 60.42 58.33 51.41
Tradable shares
Public individual shares 35.95 36.49 36.79 36.85 38.88 45.88Foreign within China shares (B-shares) 2.39 2.30 2.15 2.01 2.05 1.92Foreign outside China shares (H-shares) 0.67 0.76 0.77 0.72 0.74 0.79Subtotal 39.01 39.55 39.71 39.58 41.67 48.59
Total 100.00 100.00 100.00 100.00 100.00 100.00
Of the above
Total foreign shares 4.11 4.07 4.10% 4.03 4.19 4.10Total institutional shares 18.29 18.17 19.59 21.12 20.89 18.99Average ownership by top 10 shareholders 61.50 61.95 61.31% 61.91 60.60 56.36
K.C.K. Lam et al. / China Journal of Accounting Research 5 (2012) 199–216 203

In addition to the approval from the shareholders’ general meeting (GTA, 2010), public companies mustmeet the following requirements5 in order to distribute stock dividends: (1) they must have recovered any priorlosses (if any), (2) the amount can be distributed only if there is a sufficient balance for the appropriation of thestatutory surplus reserve, including that related to the public welfare fund, (3) the statutory surplus reserveand capital reserve, after the distribution, must not be less than 50% of the capital stock account balance,and (4) the stock dividend must be offered to all registered common stockholders. As a result, stock dividenddistribution is not only limited to profitable companies it is also limited in its scale.
The accounting treatment for stock dividends also affects the popularity of stock dividends. Stock dividendsare accounted for in China by reclassifying the appropriate undistributed and reserve accounts to the capitalstock account based on the par value of the stock dividends issued (Lan, 2001, pages 11–13). This is differentfrom the prevailing practices in other countries (such as the US) where the transfer is based on the fair value ofthe stock dividends issued (Kieso et al., 2007, pages 745–746). The fact that the par value is usually lower thanits fair value explains why stock dividends are more prevalent in China than in the US.
3. Literature review and hypothesis development
3.1. Determinants of dividend payout policy
The literature on dividend policy provides three schools of theoretical models to explain corporate dividendbehavior. The first group of theories (full information models) argues that investors demand higher expectedreturns on shares of dividend-paying stocks as a result of the imposition of a tax liability on dividends (Millerand Scholes, 1978; DeAngelo and Masulis, 1980). The second group of theories (information asymmetry mod-els) is based on the market inefficiency hypothesis related to asymmetric information (Kale and Noe, 1990;John and Kalay, 1982; Jensen, 1986). The third group of theories (behavioral models) suggests that investorbehavior is substantially influenced by societal norms and attitudes (Shiller, 1984) and dividend payouts canbe viewed as the socioeconomic effect of corporate evolution (Frankfurter and Lane, 1992).
First, the literature has documented that tax factors affect the demand from investors to increase sharehold-ers’ pre-tax returns (Miller and Scholes, 1978; DeAngelo and Masulis, 1980). This suggests a negative relation-ship between tax rates and dividend payouts. However, a survey on the management of US companiesindicates that differential taxes were a consideration, but not a first-order concern in payout policy decisions(Brav et al., 2005). Their results suggest that the factors discussed below could be more important in a lowdividend tax environment.
Second, the literature also provides models based on the market inefficiency hypothesis related to asymmet-ric information, such as dividend signaling models (Kale and Noe, 1990). This is consistent with agency the-ory, which uses dividend policy to align the interests of shareholders and corporate managers (John andKalay, 1982). Many researchers believe that dividends can convey information about a firm’s prospects.One possibility is that dividends could simply convey information not previously known to the market (Millerand Rock, 1985), even if managers are not explicitly signaling private information. Alternatively, dividendscan be used explicitly as an expensive signal to alter market perceptions of future earnings prospects (e.g.,Bhattacharya, 1979; John and Williams, 1985). This line of literature has consistent findings that firms’ hes-itancy to cut dividends is related to signaling. The reason is that the market perceives that only firms with long-run and severe liquidity crises make dividends cut, and firms normally do not want to give the market such animpression. It would be extremely costly for bad firms to mimic good firms’ policy of not cutting dividends.Therefore, by not cutting its dividend, a good firm might be able to separate itself from bad competitors (Bravet al., 2005).
Third, the dividend literature has also developed clientele theory, which suggests that investor behavior issubstantially influenced by societal norms and attitudes (Shiller, 1984) and dividend payouts can be viewed asthe socioeconomic effect of corporate evolution. That is, the segregation of management and ownership makes
5 The requirements are based on the Provisional Regulations on the Administration of Stock Issuance and Trading (see GTA 2010, page11). Further to Note 3 above, the public welfare fund is part of the surplus reserve which is designed to be used for expenditure relating toemployees’ welfare (Chong and Wang, 2004).
204 K.C.K. Lam et al. / China Journal of Accounting Research 5 (2012) 199–216
it necessary to use dividend payouts to increase the attractiveness of equity issues. Even with the large tax dis-advantage of dividends, paying dividends is an important factor in attracting individual investors to ownshares (Brav et al., 2005). From management’s perspective, institutions attempt to influence dividend decisionsas much as they try to influence repurchase decisions. However, there are mixed results as to whether dividendpayments are a significant factor affecting institutions’ decisions (e.g., Allen et al., 2000; Brav et al., 2005).
Corporate ownership structure could be associated with dividend policy and practice in that dividends sig-nal the extent of conflicts between majority shareholders and minority shareholders (Jensen et al., 1992). Whileempirical studies have investigated the significant role of different ownership variables in determining dividendpolicies (Thomsen, 2005; Khan, 2006; Szilagyi and Renneboog, 2007, among others), the results are quitemixed. For instance, Szilagyi and Renneboog (2007) find a positive relationship between stakeholders’ own-ership and dividends for Dutch firms, while Thomsen (2005) and Khan (2006) find a negative relationship forUK firms. We attempt to shed more light on such issues using data from the emerging market of China.
3.2. Studies on dividend payout in china and hypothesis development
The dividend literature usually suggests that paying cash dividends mitigates the conflict of interest betweenmajority shareholders and minority shareholders (e.g., Faccio et al., 2001). However, recent studies in Chinaprovide the opposite evidence. For instance, Wei et al. (2004) analyze the effects of state and individual share-holders on dividend policy, and find a positive relationship between state ownership and cash dividends andbetween individual ownership and stock dividends. Moreover, the higher the state ownership, the higher thecash dividend rate. Similarly, Lee and Xiao (2004) find that firms with higher state ownership in China aremore likely to pay cash dividends, increase cash dividends subsequent to rights offerings and give up stocksubscription rights. As state shares in China can only be transferred with special approval by the government,this dividend practice has the same effect as the state’s transfer of a portion of non-tradable shares to othershareholders. In addition, Lee and Xiao (2004) find that the computed transfer price is about three timeshigher than that of a typical private placement officially approved by the government. The capital marketreacts negatively to the cash dividend announcements of state controlling firms but positively to those of otherfirms, suggesting that instead of alleviating agency problems, cash dividends might be used as a vehicle fortunneling in firms with the state as the controlling shareholder.
There are several reasons proposed in the literature suggesting stock dividends can play a different role thancash dividends in China. First, as argued by the traditional signaling theory, managers of public firms can usestock dividends to signal favorable insider information to the market (Grinblatt et al., 1984). Firms with betterprospects are more capable of signaling because the reduction in the balance of retained earnings resultingfrom stock dividend distributions will constrain their future cash dividend payments. However, firms withpoorer prospects find it more difficult to mimic this behavior as their undistributed profits cannot be replen-ished so easily. Although stock splits are as credible a signal as stock dividends, they are prohibited in China(Wei and Xiao, 2009). Thus, stock dividends are the only available signaling alternative. Second, stock divi-dend distribution restricts a firm’s ability to pay cash dividends in the future, indicating that stock dividendsare less likely to be used to tunnel cash to majority shareholders in the future. Third, as the demand for equityshares in China is strong due to the lack of other investment opportunities (Chen and Yuan, 2004), stock div-idend distribution can increase the share’s liquidity and its attractiveness to investors (Lakonishok and Lev,1987). Fourth, Chinese companies could raise more capital by paying stock dividends than paying cash div-idends before a rights issue (Wei and Xiao, 2009). Under the rules of the China Securities Regulatory Com-mission, the price used for rights issues should be based on the average share price during the period of twentydays prior to the disclosure of the prospectus. As stock dividend declaration often increases stock prices whilecash dividends often decrease stock prices, stock dividends can increase the money raised in a subsequentrights issue.
In sum, cash dividends and stock dividends play different roles in China. Cash dividends, coupled with non-subscription of shares in subsequent rights offerings, represent the return of cash to controlling shareholdersand such behavior is termed “tunneling” in the recent literature. Stock dividends, without entailing actual cashoutflow, cannot play such a tunneling role but can be used as a credible mechanism to convey insider infor-mation to investors.
K.C.K. Lam et al. / China Journal of Accounting Research 5 (2012) 199–216 205

Extant empirical evidence is consistent with the argument above. Chen et al. (2002) document that whenearnings surprise is corroborated by a stock dividend surprise of the same directional sign, the earnings signalis stronger. Chen et al. (2002) also find that changes in cash dividends have little incremental informationvalue. Cheng et al. (2006) conduct event studies on Chinese firms’ announcements of stock dividends and cashdividends. Their results indicate that cash dividends are preferred by non-tradable shareholders while stockdividends are preferred by individual investors. They also find that stock dividends are positively related toearnings and return on assets, supporting the signaling hypothesis of dividend policy. In a more recent paper,Cheng et al. (2007) examine dividend policies of underperforming firms in China and Hong Kong. They findthat poor performing Chinese firms with higher non-tradable shares pay out more cash dividends than thosewith a lower proportion of non-tradable shares.
Hence, the literature generally supports the two distinct roles played by cash and stock dividends in China.However, none of these studies have investigated whether firms with cross-listed shares and/or foreign own-ership use different dividend policies than other firms or how foreign ownership and cross-listing act as mod-erating factors for different types of dividends.
As indicated in the dividend literature, dividends play a signaling role. The fact that firms are listed overseascould make a significant difference in these firms’ dividend policies and practices compared to those that arenot. For instance, cross-listing in the U.S. allows “good” firms to separate themselves from “bad” firmsbecause disclosure requirements and legal liability makes cross-listing much more costly for “bad” firms(Fuerst, 1998). In addition, given that foreign investors are at an informational disadvantage in obtaininginformation about a local firm’s future prospects compared with domestic investors (Choe et al., 2005), anincrease in foreign ownership may lead to increased demand and pressure for increased disclosure by localfirms. For instance, Sami and Zhou (2004) find that the value relevance of accounting information in theB-share market of China (where foreigners invest) is generally higher than in the A-share market (wheredomestic investors trade). A-shares’ accounting information is prepared and audited for domestic investorsunder the domestic accounting standards, while B-shares’ information is prepared and audited for foreigninvestors under international accounting standards. Their results suggest that the presence of foreign owner-ship may help to improve the general information environment of public companies. Similarly, an increase inforeign ownership may lead to increased demand and pressure for improved corporate governance. Not sur-prisingly, foreign investors are shown to contribute to firm performance through shareholder activism andboard representation (Choi et al., 2007). Thus we would expect that the presence of foreign investors woulddeter the tunneling behavior of state shareholders and that foreign ownership would be negatively associatedwith cash dividends and positively associated with stock dividends. This is consistent with the signalinghypothesis of dividends in that the managers of public firms with foreign investors and cross-listings wouldhave different dividends policies than those without. Finally, foreign investors tend to prefer firms with moreinvestment opportunities. Hence, they might be more likely to prefer stock dividends to cash dividends (Linand Schiu, 2003).
Based upon the discussions above, we develop the following hypotheses for our study:Hypothesis on cross-listing and dividends:
Hypothesis 1. Firms with cross-listed shares are more likely to pay stock dividends and less likely to pay cashdividends.
Hypothesis on foreign ownership and dividends:
Hypothesis 2. Firms with foreign ownership are more likely to pay stock dividends and less likely to pay cashdividends.
In addition, the literature above indicates that cash dividends could be used by majority shareholders as atunneling tool, which could be predominant in emerging markets (e.g., Lee and Xiao, 2004; Cheng et al.,2006). If firms have controlling state shareholders, they are more likely to pay cash dividends and increase cashdividend payments soon after rights offerings to transfer more cash to state controlling shareholders. Cash div-idends are paid to a government agent, the State-owned Asset Management Office, which supervises the state
206 K.C.K. Lam et al. / China Journal of Accounting Research 5 (2012) 199–216

shares and collects cash dividends on behalf of the government. As state-held shares in China can only betransferred with special approval by the government, giving up stock subscription rights and using receiptsfrom rights offerings to pay cash dividends are similar to the transfer of non-tradable shares from majorityshareholders to minority shareholders, with a computed sale price higher than that of officially approved pri-vate placements (Lee and Xiao, 2004). Thus, state shareholders would be more likely to use cash dividends as avehicle of tunneling in firms with higher state ownership. As the privatization of state-owned enterprises simul-taneously involves a reduction in state-ownership and an increase in individual (public) ownership, we alsoexpect an opposite effect of individual ownership on dividend policy to that of state ownership. In otherwords, firms with more individual (public) ownership are less likely to pay cash dividends and more likelyto pay stock dividends.
We retest the hypotheses on the relationship between state and individual ownership and dividend policy asthe literature has documented an obvious trend that more and more firms are paying cash dividends instead ofstock dividends (Wei et al., 2004). In light of the change in the trend regarding stock dividends versus cashdividends, we examine whether the findings of early studies, such as Wei et al. (2004) and Lee and Xiao(2004) on state and/or individual ownership and dividends, still apply to more recent years or not. Thus,we test the following hypotheses.Hypothesis on state ownership and dividends:
Hypothesis 3. Firms with more state ownership are more likely to pay cash dividends and less likely to paystock dividends.
Hypothesis on individual (public) ownership and dividends:
Hypothesis 4. Firms with more individual ownership are less likely to pay cash dividends and more likely topay stock dividends.
4. Research design
4.1. Sample selection
In this paper, we examine the dividend policies of publicly traded firms in China during the period 2001–2006. Sample selection started with the entire population of firms issuing A-shares and/or B-shares that arelisted on the Shanghai Stock Exchange or Shenzhen Stock Exchange, as well as firms issuing H-shares onthe Stock Exchange of Hong Kong and those firms that are cross-listed in the US and/or other foreign mar-kets. The sample companies are selected on the basis of the following screening criteria: (1) Firms have beenlisted on the exchanges for at least a year before dividend announcements to exclude the effects of new list-ings, (2) Financial and insurance firms are excluded due to their different operations from other firms, (3)Firms that experience reorganizations during the sample period are excluded as the ownership andcorporate governance of these firms could experience great changes, and so could their performance. Thescreening procedures result in 7519 firm-year observations from 1712 companies, of which 908 companiesare listed on the Shanghai Stock Exchange and 804 on Shenzhen Stock Exchange. Among these 1712 com-panies, 33 firms are cross-listed on the Stock Exchange of Hong Kong, 27 in the United States, 5 in Londonand 1 in Singapore.
4.2. Models of dividend policy
As mentioned earlier, the literature has documented three schools of dividend policy theories to explain thedeterminants of corporate dividend behavior – (1) full information models, (2) models of information asym-metry and (3) behavioral models. Although these models have conflicting predictions on the effect of dividendpolicy on share returns, they provide a theoretical background for the determinants of dividend policies.Hence, a theoretical function of the determinants of corporate dividend policy is:
Dividends ¼ f ðtax factor; information asymmetry; agency costs; socioeconomic factors; cash flowÞ
K.C.K. Lam et al. / China Journal of Accounting Research 5 (2012) 199–216 207

The tax factor might not play a role in dividend payouts in China. Under the current Chinese tax system,cash dividend income is exempt from tax if the cash dividend income is less than the one-year saving depositrate declared by China’s central bank. If the cash dividend income is higher than the above-mentionedamount, a flat tax rate of 20% is charged on the excess amount. For stock dividends, since the gains on thestock dividends are not realized, there is no tax effect. Dividend yields of Chinese firms are generally lowerthan the declared saving rates which are around two to ten percent during the past decade (Cheng et al.,2009). As our study uses data from a single country and a period with no significant changes in tax policies,we exclude the tax factor from our model. The literature shows that firm’s ownership structure, firm size, firmdebt, specific risk (beta) and investment opportunities (firm growth) could affect information asymmetry riskand agency costs (e.g., Choi et al., 2009). Industry features, time trend and previous dividend payout recordcould form the socioeconomic factors of dividend policy (Faccio et al., 2001; Wei et al., 2004). For instance, afirms’ past dividend policy determines its current clientele of investors and clientele effects impede changingpolicy, which is consistent with the socio-economic view of dividend policy (Shiller, 1984). Performanceand the level of cash in the firm could affect cash flow and in turn dividend policy. Accordingly, we examinethe following dividend policy model:
CDPRiðSDPRiÞ ¼ a0 þ a1CROSSLISTiþ a2FOREIGNi þ a3STATEi þ a4PUBLICi þ a5SIZEi
þ a6DEBTi þ a7BETAi þ a8GROWi þ a9CASHi þ a10ROAi
þ a11LAGCDPRiðLAGSDPRiÞ þ a12þjRINDUSTRYj þ a13þjþkRYEARk þ ei ð1Þ
where CDPR = cash dividend payout ratio, calculated as cash dividends per share divided by earnings pershare; SDPR = stock dividend payout ratio, calculated as stock dividends per share divided by earnings pershare; CROSSLIST = 1 if the firm is cross-listed in Hong Kong, U.S., U.K. or Singapore, and 0 otherwise.FOREIGN = the percentage of equity shares owned by foreign shareholders at the fiscal year end; STA-TE = the percentage of equity shares owned by the government and its fully owned enterprises at the fiscalyear end; PUBLIC = the percentage of equity shares owned by public (individual) shareholders; SIZE = thelogarithm of book value of total assets at the fiscal year end; DEBT = the ratio of total liabilities to totalassets at the fiscal year end; BETA = a firm’s specific risk, estimated from a regression of share returnson market returns during the fiscal year; GROW = a firm’s market to book (M/B) ratio at fiscal yearend as the proxy for growth and investment opportunities; CASH = the logarithm of the total cash balanceat the fiscal year end; ROA = a firm’s return on assets for the fiscal year; LAGCDPR = cash dividend pay-out ratio in the previous fiscal year; LAGSDPR = stock dividend payout ratio in the previous fiscalyear;INDUSTRY = indicator variables for industries; YEAR = indicator variables controlling for year ef-fects; e = the error term.
The regression analysis is conducted as follows. First, we conduct a series of OLS and Tobit regressionsusing panel data. Furthermore, to mitigate the effects of outliers, we winsorize variables involving ratio cal-culations to their 1st and 99th percentile values. We also report the results of sensitivity analysis.
5. Empirical results
5.1. Univariate tests
Table 3 reports descriptive statistics for the variables in Model (1). Columns two through six report thestatistics for the overall sample. The following two columns show information on firms paying zero andnon-zero cash dividends, respectively. The last two columns provide information on firms paying zeroand non-zero stock dividends, respectively. Details of statistical significance are also provided. The resultsshow that on average firms with positive cash dividends have higher state ownership, lower individual (pub-lic) ownership, lower market to book ratios (GROW), higher cash balances, larger asset bases (SIZE),higher debt, higher ROA, higher possibility of being cross-listed and higher lagged cash dividends thanfirms paying no cash dividends. On the other hand, firms distributing stock dividends on average havelower foreign ownership, lower state ownership, and higher public ownership. They are also larger, havehigher debt, lower risk (BETA), higher market to book ratios (GROW), higher cash balances, higher
208 K.C.K. Lam et al. / China Journal of Accounting Research 5 (2012) 199–216

returns on assets, lower possibility of being cross-listed and higher lagged stock dividends. Contrary to ourexpectations, firms issuing cash dividends are more likely to be cross-listed and firms issuing stock divi-dends are less likely to be cross-listed. As univariate analysis examines the effect of each variable in isola-tion, the results should be interpreted with caution and further examined under multivariate analysis, whichis presented later.6
Table 4 reports the correlations between the variables. Based on Pearson correlations, cash dividend payoutratios (CDPR) are positively correlated with STATE (0.17), SIZE (0.16), CASH (0.26), ROA (0.29) and LAG-CDPR (0.21), and negatively correlated with PUBLIC (�0.10) and GROW (�0.11). Hence the univariate sta-tistics are consistent with the notion that firms with higher state ownership, lower public ownership, higheraccounting returns, higher cash balances, higher prior year cash dividends and lower growth opportunitiestend to have higher cash dividend payout rates. On the other hand, the Pearson correlations show that stockdividend payout rates (SDPR) are positively related to PUBLIC (0.09), CASH (0.04), ROA (0.04) andLAGSDPR (0.03), and negatively related to FOREIGN (�0.05), CROSSLIST (�0.04) and STATE(�0.05). Hence, firms with higher public ownership, more cash, higher profitability and higher prior year stockdividends tend to have higher stock dividends, while firms with higher STATE ownership tends to have lowerstock dividends. Again, these results should be interpreted with caution because the analysis is conducted oneach variable in isolation.
Explanatory variables with high correlations include those between ownership variables, such as PUB-LIC and FOREIGN (with a Pearson correlation coefficient of �0.45 and a Spearman coefficient of�0.40), FOREIGN and CROSSLIST (both Pearson and Spearman coefficients are 0.40), and PUBLICand STATE (with a Pearson correlation coefficient of �0.33 and a Spearman coefficient of �0.35). Otherhigh correlations between control variables are SIZE and CASH (both Pearson and Spearman coefficients
Table 3Descriptive statistics. CDPR = Cash dividends payout ratio, calculated as cash dividend per share paid in a year divided by earnings pershare; SDPR = Stock dividend rate, calculated as stock dividend per share distributed in a year divided by earnings per share;FOREIGN = the percentage of equity shares owned by foreign shareholders; CROSSLIST = 1 for firms cross-listed in stock exchangesoutside mainland China and 0 otherwise. STATE = the percentage of equity shares owned by the government; PUBLIC = percentage ofshares owned by the general public; SIZE = log10(total assets), DEBT = total liabilities to total assets ratio; BETA = estimate of beta ofthe firm; GROW = market to book ratio; CASH = log10(Cash balance); ROA = return on assets. LAGCDPR and LAGSDPR are lagged(one year) measures of cash and stock dividends, respectively. T-tests values are computed assuming unequal variances. ���, �� and �
represent significance at 0.01, 0.05 and 0.10 levels respectively.
Variables Overall Cash dividend Stock dividend
=0 >0 =0 >0N = 7519 N = 3523 N = 3996 N = 6391 N = 1128
Mean Median Std. dev. Min. Max. Mean Mean Mean Mean
CDPR 0.28 0.13 0.37 0.00 2.44 0.00 0.52��� 0.27 0.29SDPR 0.45 0.00 1.63 0.00 11.40 0.47 0.44 0.00 3.01���
FOREIGN 4.08 0.00 11.01 0.00 92.52 4.09 4.08 4.31 2.91���
CROSSLIST 0.03 0.00 0.16 0.00 1.00 0.02 0.04��� 0.03 0.01���
STATE 36.09 39.89 25.13 0.00 88.58 31.83 39.86��� 36.74 32.71���
PUBLIC 38.71 37.66 14.08 2.39 100.00 40.37 37.23��� 38.05 42.18���
SIZE 6.19 6.15 0.44 2.35 8.77 6.05 6.30��� 6.17 6.28���
DEBT 0.37 0.40 0.08 0.01 0.40 0.38 0.35��� 0.37 0.37BETA 0.81 0.98 0.54 �2.84 11.54 0.80 0.82 0.82 0.78��
GROW 3.08 2.38 2.81 �3.76 18.51 3.39 2.81��� 3.05 3.25���
CASH 5.24 5.31 0.62 0.90 7.36 4.97 5.48��� 5.21 5.40���
ROA 0.02 0.03 0.07 �0.30 0.24 �0.02 0.06��� 0.02 0.05���
LAGCDPR 0.21 0.00 0.46 0.00 2.44 0.12 0.29��� 0.21 0.22LAGSDPR 0.38 0.00 1.50 0.00 11.40 0.38 0.37 0.36 0.48��
6 The values reported in the cash dividend and stock dividend columns in Table 3 also include firms paying both cash and stockdividends. Such “joint paying” firms (795 firm-year observations) are less likely to be cross-listed, have lower foreign ownership, but arelarger, have bigger cash balances and higher ROA. Other differences are insignificant.
K.C.K. Lam et al. / China Journal of Accounting Research 5 (2012) 199–216 209

Tab
le4
Co
rrel
atio
nan
alys
is.C
DP
R=
Cas
hd
ivid
end
sp
ayo
ut
rati
o,
calc
ula
ted
asca
shd
ivid
end
per
shar
ep
aid
ina
year
div
ided
by
earn
ings
per
shar
e;S
DP
R=
Sto
ckd
ivid
end
rate
,cal
cula
ted
asst
ock
div
iden
dp
ersh
are
dis
trib
ute
din
aye
ard
ivid
edb
yea
rnin
gsp
ersh
are;
FO
RE
IGN
=th
ep
erce
nta
geo
feq
uit
ysh
ares
ow
ned
by
fore
ign
shar
eho
lder
s;C
RO
SS
LIS
T=
1fo
rfi
rms
cro
ss-l
iste
din
sto
ckex
chan
ges
ou
tsid
em
ain
lan
dC
hin
aan
d0
oth
erw
ise;
ST
AT
E=
the
per
cen
tage
of
equ
ity
shar
eso
wn
edb
yth
ego
vern
men
t;P
UB
LIC
=p
erce
nta
geo
fsh
ares
ow
ned
by
the
gen
eral
pu
bli
c;S
IZE
=lo
g10(
tota
las
sets
),D
EB
T=
tota
lli
abil
itie
sto
tota
las
sets
rati
o;
BE
TA
=es
tim
ate
of
bet
ao
fth
efi
rm;
GR
OW
=m
ark
etto
bo
ok
rati
o;
CA
SH
=lo
g10(
Cas
hb
alan
ce);
RO
A=
retu
rno
nas
sets
.L
AG
CD
PR
and
LA
GS
DP
Rar
ela
gged
(on
eye
ar)
mea
sure
so
fca
shan
dst
ock
div
iden
ds,
resp
ecti
vely
.T
-tes
tsva
lues
are
com
pu
ted
assu
min
gu
neq
ual
vari
ance
s.��� ,��
and�
rep
rese
nt
sign
ifica
nce
at0.
01,
0.05
and
0.10
leve
lsre
spec
tive
ly.
Th
eu
pp
erd
iago
nal
figu
res
are
Sp
earm
anco
rrel
atio
ns
and
the
low
erd
iago
nal
valu
esar
eP
ears
on
corr
elat
ion
s.
CD
PR
SD
PR
FO
RE
IGN
CR
OS
S-L
IST
ST
AT
EP
UB
LIC
SIZ
ED
EB
TB
ET
AG
RO
WC
AS
HR
OA
LA
GC
DP
RL
AG
SD
PR
CD
PR
1.00
0.08���
0.02�
0.04���
0.19����
0.14���
0.23���
0.03���
0.00
�0.
05���
0.35���
0.51���
0.35���
0.07���
SD
PR
0.00
1.00
�0.
05���
�0.
06���
�0.
05���
0.08���
0.09���
0.02��
�0.
05���
0.07���
0.12���
0.20���
0.08���
0.13���
FO
RE
IGN
�0.
01�
0.05���
1.00
0.40���
�0.
08����
0.40���
0.18���
0.01
0.00
�0.
010.
15���
0.01
0.02
�0.
03���
CR
OS
SL
IST
0.01
�0.
04��
0.40���
1.00
0.07����
0.24���
0.22���
0.06���
0.00
�0.
06���
0.19���
0.07���
0.05���
�0.
04���
ST
AT
E0.
17����
0.05����
0.08���
0.08���
1.00
�0.
35���
0.20���
0.07���
0.00
0.00
0.18���
0.10���
0.10���
�0.
02��
PU
BL
IC�
0.10���
0.09����
0.45���
�0.
28���
�0.
33���
1.00
�0.
04���
0.04���
0.03����
0.19����
0.08����
0.11����
0.01
0.07���
SIZ
E0.
16���
0.01
0.21���
0.31���
0.23����
0.09���
1.00
0.35����
0.03����
0.33���
0.74���
0.18���
0.26���
0.09���
DE
BT
0.01
0.01
0.02
0.07���
0.08����
0.01
0.30���
1.00
�0.
01�
0.11���
0.12���
0.01
0.07���
0.03���
BE
TA
0.01
�0.
010.
000.
000.
010.
03���
0.00
�0.
011.
000.
05���
0.00
�0.
05���
0.01
�0.
03��
GR
OW
�0.
11���
0.02
0.00
�0.
05���
�0.
04����
0.11����
0.27����
0.09����
0.01
1.00
�0.
21���
0.11����
0.21���
�0.
02C
AS
H0.
26���
0.04���
0.14���
0.20���
0.20����
0.08���
0.74���
0.10���
0.04����
0.19���
1.00
0.34���
0.25���
0.09���
RO
A0.
29���
0.04���
0.00
0.06���
0.12����
0.07���
0.28���
0.02��
0.02
�0.
03��
0.46���
1.00
0.27���
0.13���
LA
GC
DP
R0.
21����
0.00
0.00
0.04��
0.09����
0.02�
0.14���
0.05���
0.01
�0.
12���
0.15���
0.13���
1.00
0.17���
LA
GS
DP
R0.
020.
03����
0.03�
�0.
03��
�0.
02�
0.06����
0.02�
0.02
�0.
02�
0.03��
0.03��
0.01
0.03���
1.00
210 K.C.K. Lam et al. / China Journal of Accounting Research 5 (2012) 199–216

are 0.74), SIZE and DEBT (with a Pearson correlation coefficient of 0.30 and a Spearman coefficient of0.35), and CASH and ROA (with a Pearson correlation coefficient of 0.46 and a Spearman coefficient of0.34). Nonetheless, analysis based on variance inflation factors (VIFs) indicate that none of theexplanatory variables have VIF values larger than 10, alleviating the concern of severe multicollinearityproblems.
5.2. OLS and TOBIT regressions
We present the results of OLS regressions for both cash and stock dividends, respectively in Table 5.Consistent with our hypotheses, cash dividend payment varies positively with STATE ownership and neg-atively with FOREIGN ownership, PUBLIC ownership and CROSSLIST. These results are consistent withthe notion that firms with higher state ownership distribute more cash dividends and that they might evendo so to tunnel cash to major shareholders (state) in situations when cash dividend payments might not bethe best strategy for the firm. Interestingly, both foreign ownership and cross-listings have significant neg-ative effects on cash dividends, consistent with the expected moderating effect on tunneling activity. Asexpected, the results on PUBLIC (individual) ownership are the opposite of those for STATE ownership.For control variables, firms with higher cash balances and higher return on assets are more likely to payhigher cash dividends in order to signal their value. All of these results are consistent with the signalingtheory of dividend payments. Also, firms with lower growth rates (more mature firms) are more likelyto pay cash dividends, consistent with the notion that mature firms pay more dividends. In addition, cashdividend levels are positively and significantly related to lagged cash dividends in the previous fiscal year,
Table 5Regression analysis: determinants of cash and stock dividends the regression is based on 7519observations over 2001–2006 and includes all listed firms in China. The dependent variables are cashdividend payout ratio, calculated as cash dividend per share paid in a year divided by earnings per share,and stock dividend, calculated as stock dividend per share distributed in a year divided by earnings pershare. STATE is the percentage of equity shares owned by the government. FOREIGN is the percentageof equity shares owned by foreign shareholders; CROSSLIST = 1 for firms cross-listed in stockexchanges outside mainland China and 0 otherwise; PUBLIC is the percentage of equity shares ownedby public shareholders; SIZE = log10(total assets), DEBT = total liabilities to total assets ratio;BETA = estimate of beta of the firm; GROW = market to book ratio; CASH = log10(Cash balance);ROA = return on assets. LAGCDPR and LAGSDPR are lagged (one year) measures of cash and stockdividends, respectively. In each regression we also put in INDUSTRY, indicator variables for industriesand YEAR, indicator variables controlling for year effects. For simplicity of presentation the last twoitems are not shown here. ���, ��, � represent significance at 0.01, 0.05 and 0.10, respectively. Robuststandard errors are used to compute the t-statistics.
Cash dividend Stock dividend
INTERCEPT 0.2655��� �0.3998STATE 0.0010��� �0.0018��
FOREIGN �0.0010��� �0.0031CROSSLIST �0.0784��� �0.2134���
PUBLIC �0.0016��� 0.0072���
SIZE �0.0212 0.0194DEBT �0.5280��� 0.3081BETA 0.0114 �0.0722�
GROW �0.0111��� 0.0154���
CASH 0.0753��� 0.1199��
ROA 0.8220��� 0.7275��
LAGCDPR 0.2311���
LAGSDPR 0.0331��
Adj R-sq 0.2076 0.0218F-value 88.21��� 12.54���
K.C.K. Lam et al. / China Journal of Accounting Research 5 (2012) 199–216 211

which provides evidence of the clientele effect on dividends. Finally, firms with higher debt pay less cashdividends.
The results of OLS regressions on stock dividends imply that the determinants of stock dividends aredifferent from those of cash dividends. First, consistent with our hypotheses and in contrast to the findingson cash dividends, stock dividends are negatively associated with STATE ownership and positively associ-ated with PUBLIC ownership. Note that the coefficient on PUBLIC is now significantly positive, indicatingthat firms with higher individual ownership (free float) are more likely to pay more stock dividends, which isconsistent with the literature (Wei et al., 2004; Cheng et al., 2006). Because the coefficient on PUBLIC in thecash dividends model is significantly negative, it suggests that stock and cash dividends are probably perfectsubstitutes from the perspective of individual shareholders. Unlike cash dividends, stock dividends have nowealth redistribution effect. Hence, it is also natural that firms with higher state ownership distribute lessstock dividends. CROSSLIST is significantly negative here, which is not consistent with our hypothesison the effect of cross-listing on stock dividends. For control variables, firms with higher growth opportuni-ties (GROW), more cash (CASH), higher profitability (ROA) and lower risk (BETA) are more likely to paystock dividends. Firms with these attributes are more growth-oriented, hence these firms are trying to pre-serve their cash to take advantage of growth opportunities. In addition, stock dividend levels are positivelyand significantly related to those of the previous fiscal year, which again provides evidence of the clienteleeffect on dividends.
The results are robust even when Tobit analysis is used instead of OLS regressions. Table 6 reports theresults using TOBIT analysis. For cash dividends, except for a difference in the significance of the SIZE
Table 6Tobit analysis: determinants of cash and stock dividends. The regression is based on 7519observations over 2001–2006 and includes all listed firms in China. The dependent variablesare cash dividend payout ratio, calculated as cash dividend per share paid in a year dividedby earnings per share, and stock dividend, calculated as stock dividend per share distributedin a year divided by earnings per share. STATE is the percentage of equity shares owned bythe government. FOREIGN is the percentage of equity shares owned by foreignshareholders; CROSSLIST = 1 for firms cross-listed in stock exchanges outside mainlandChina and 0 otherwise; PUBLIC is the percentage of equity shares owned by publicshareholders; SIZE = log10(total assets), DEBT = total liabilities to total assets ratio;BETA = estimate of beta of the firm; GROW = market to book ratio; CASH = log10(Cashbalance); ROA = return on assets. LAGCDPR and LAGSDPR are lagged (one year)measures of cash and stock dividends, respectively. In each regression we also put inINDUSTRY, indicator variables for industries and YEAR, indicator variables controllingfor year effects. For simplicity of presentation the last two items are not shown here. ���, ��, �
represent significance at 0.01, 0.05 and 0.10, respectively.
Cash dividend Stock dividend
INTERCEPT �0.3261�� �21.301���
STATE 0.0009��� �0.0164���
FOREIGN �0.0024��� �0.0225CROSSLIST �0.1449��� �5.2975���
PUBLIC �0.0032��� 0.0530���
SIZE �0.1054��� 1.1708���
DEBT �0.4692��� 3.2992��
BETA 0.0336�� �0.4845��
GROW �0.0457��� 0.2024���
CASH 0.2715��� 0.9551���
ROA 3.9949��� 27.826���
LAGCDPR 0.3885���
LAGSDPR 0.1535��
Pseudo R-sq 0.1847 0.0145Log-likelihood �4754.44��� �5336.53���
212 K.C.K. Lam et al. / China Journal of Accounting Research 5 (2012) 199–216

variable, which is now significant, the qualitative results are the same as in Table 5. The results for stock div-idends are also consistent with those in Table 5.7
Table 7Regression analysis: determinants of cash and stock dividends to earnings per shareratio the regression is based on 7519 observations over 2001–2006 and includes alllisted firms in China. The dependent variables are cash dividend payout ratio,calculated as cash dividend per share paid in a year divided by earnings per share, andstock dividend, calculated as stock dividend per share distributed in a year divided byearnings per share. STATE is the percentage of equity shares owned by thegovernment. FOREIGN is the percentage of equity shares owned by foreignshareholders; CROSSLIST = 1 for firms cross-listed in stock exchanges outsidemainland China and 0 otherwise; PUBLIC is the percentage of equity shares ownedby public shareholders; SIZE = log10(total assets), DEBT = total liabilities to totalassets ratio; BETA = estimate of beta of the firm; GROW = market to book ratio;CASH = log10(Cash balance); ROA = return on assets. LAGCDPR and LAGSDPRare lagged (one year) measures of cash and stock dividends, respectively. In eachregression we also put in INDUSTRY, indicator variables for industries and YEAR,indicator variables controlling for year effects. For simplicity of presentation the lasttwo items are not shown here. ���, ��, � represent significance at 0.01, 0.05 and 0.10,respectively. Robust standard errors are used to compute the t-statistics.
Cash dividend Stock dividend
INTERCEPT 0.2488���� �0.4338STATE 0.0016��� 0.0017FOREIGN 0.0009 �0.0046CROSSLIST �0.0873�� �0.1691��
PUBLIC �0.0013��� 0.0101���
SIZE �0.0224 0.0648DEBT �0.5208��� 0.3103BETA 0.0118 �0.0723�
GROW �0.0109��� 0.0149���
CASH 0.0766��� 0.1199��
ROA 0.8142��� 0.7429���
LAGCDPR 0.2303���
LAGSDPR 0.0324�
STATE�FOREIGN �0.0001��� 0.0001STATE�CROSSLIST 0.0010 �0.0024STATE�PUBLIC �0.0000 �0.0001
Adj R-sq 0.2093 0.0224F-value 82.26��� 12.08���
7 We also would like to report some results which for conciseness are not provided in the tables. First, in Tables 5 and 6, we put bothFOREIGN and CROSSLIST in the regressions. One potential criticism is that these are overlapping measures. However, in the Chinesesetting, this is not true. The correlation between the variables in our sample is 0.40 which is not exceedingly large. FOREIGN capturesownership by foreign investors in the listed firms through strategic ownership or direct investment on both domestic and foreign markets,while CROSSLIST measures share percentage traded on foreign exchanges. Nonetheless, if we use only FOREIGN or CROSSLIST (butnot both) in the regression, they are still be negative and significant in the regression for cash dividends, insignificant for FOREIGN butmarginally significant for CROSSLIST in stock dividends. Second, we explore the effects of controlling for stock dividends (lagged andnon-lagged) in the cash dividend model and cash dividends (lagged and non-lagged) in the stock dividend model. We do not find anysignificant results for these additional controls, suggesting that cross effects among cash and stock dividends do not exist. Third, we explorethe possibility of using both stock and cash dividends versus stock dividends as a signal of future prospects. We use a logit regression forour analysis as it is difficult to find a basis to sum up both dividends. We find that firms paying both cash and stock dividends, whencompared with firms paying stock dividends only, tend to be larger, with higher ROA, higher market to book ratios and more cash.Nonetheless, they also have much lower state ownership or cross-listing, which are the typical features of cash dividend paying firms.Hence firms paying cash and stock dividends have the hybrid characteristics of firms paying cash dividends alone and firms paying stockdividends only. However, since one of our research focuses is to contrast the two types of dividends, our analysis concerning firms payingboth types of dividends is supplementary at best.
K.C.K. Lam et al. / China Journal of Accounting Research 5 (2012) 199–216 213

5.3. Sensitivity tests
In this section, we perform several sensitivity tests to verify the robustness of our results. First, as alterna-tive measures of dividend payout ratios, we use dividends per share (DPS) and dividends per share divided bynet sales per share. The results are qualitatively the same as those reported.
Second, to test the robustness of our results using ROA as a proxy for profitability, we use return on equity(ROE). Again, the results are qualitatively similar to those reported above.
Third, we test whether other shareholders mediate the effect of state ownership on dividend policies. Table 7reports these results. With the interaction terms between state ownership and other ownership variables addedin the cash dividend regression, FOREIGN is not significant but CROSSLIST is significantly negative. How-ever, the interaction effect STATE�FOREIGN is negative and significant at the 0.001 level, consistent with thenotion that foreign ownership (FOREIGN) in effect suppresses cash tunneling by state owners (STATE). Theresults are different for stock dividends. Here the interaction term STATE�FOREIGN is not significant, whichis expected as stock dividends have no cash effect. Our results are also consistent with a recent line of literaturethat argues that foreign ownership is useful in restraining controlling shareholders in their exploitation ofdomestic minority shareholders (Leuz and Oberholzer-Gee, 2006).
Finally, a common concern in using a panel dataset like ours is inference problems due to the correlation ofthe residuals across firms and across years, which may result in estimation bias (Fama and MacBeth, 1973). Toalleviate this concern, we re-perform our OLS analysis using the Fama-MacBeth approach. Our results (notpresented here) indicate that such a bias is not likely to affect our conclusions.8
6. Conclusions
In this paper, we investigate whether firms with different ownership characteristics have different dividendpolicies. As indicated in the dividend literature, dividends play a signaling role. Also, dividends could be usedby state-owned agents who are majority shareholders to tunnel money from state-controlled firms tothemselves (tunneling effect). Such a situation could especially be dominant in emerging markets.
8 We summarize here other sensitivity tests we have performed. First, we perform tests to study the effect of rights issues on both types ofdividends. We find that the rights issue variable is significantly positive for both stock and cash dividends, signifying the importance offuture financing in dividend decisions in China. Second, we examine the effect of ownership concentration. Our measure of concentrationis HOLD, which is defined as the percentage of shares owned by the top 10 shareholders. We find that HOLD is significantly positivelyrelated to cash dividends, signifying that cash dividends are more prevalent among concentrated firms, which is consistent with thetunneling story. In contrast, HOLD is significantly negatively related to stock dividends, consistent with the notion that stock dividendsare prevalent for low concentration firms. Third, we examine tunneling activities through intercorporate loans in China. Using otherreceivables to total assets (ORECTA) ratio, we find that the variable is significantly negative in the cash dividend regression. We interpretthis result as suggesting that cash dividends and intercorporate loans are substitutes for tunneling. We do not find a significant effect ofORECTA on stock dividends. Fourth, we decompose foreign shareholders into foreign individual and foreign institutional shareholders.We find that the negative effect of foreign ownership on cash dividends is driven by foreign individual shares and not by foreigninstitutional shares. When we exclude the foreign institutional shares from the definition of total foreign ownership, the negative effect offoreign ownership on cash dividends is even more significant. Fifth, we perform a test on the potential influence of the split share structurereform (2005–2007). As mentioned in Note 2, state shares were typically non-tradable during the period of our study, as they could only bebought and sold through private placement with special approval from the government. However, in 2005, the Chinese governmentlaunched a reform on split share structure by converting non-tradable shares (state and legal person shares) into tradable shares. Weperform the regressions separately for the two sub-periods - one with the data on or before 2004 and another after 2004. We find that thesignificance of the variables in the regressions does not vary much from the tabled results. Finally, an alternative explanation of our resultscould be that firms in different stages of their life cycle have different preferred dividend choices. Firms with high maturity (larger in sizeand with lower growth rates) are more likely to distribute cash dividends, while firms with lower maturity (smaller and higher growth) aremore likely to distribute stock dividends. To shed light on this issue, we group our observations into four different partitions: HA-HG,HA-LG, LA-HG and LA-LG, where HA is for firms with above mean SIZE, LA is for firms with SIZE at or below the mean value, HG isfor firms with above mean GROW and LG is for firms with GROW at or below the mean value. Based on these partitions, our variables ofinterest, FOREIGN and CROSSLIST have the expected signs in all four regression segments. CROSSLIST is significant for the large firmsegments. This is reasonable as larger firms are more likely to be cross-listed than smaller firms and thus they have more variation in thesesegments. FOREIGN, however, is highly significant in small firms with high growth rates. This is expected as smaller firms are less likely tobe cross-listed and the differentiating factor is more likely to be FOREIGN. The results are robust when we use median rather than meanvalues to differentiate between high and low observations.
214 K.C.K. Lam et al. / China Journal of Accounting Research 5 (2012) 199–216

Using firms from the emerging market of China, we examine whether the above effects exist in corporatedividend policy and practice. We find that both foreign ownership and cross-listing have significant negativeeffects on cash dividends, consistent with the notion of reduced tunneling activities for firms with the ability toraise capital outside of China. Consistent with the tunneling hypothesis, we find that firms with higher stateownership tend to pay higher cash dividends and lower stock dividends. In addition, firms with higher indi-vidual (public) ownership pay lower cash dividends and higher stock dividends.
These results have significant implications for researchers, investors, policy-makers and regulators. Ourresults indicate that foreign shareholders prefer low cash dividends, suggesting that foreign investors helpreduce tunneling activities in firms in emerging markets. Our results further suggest the benefits of fosteringforeign investors’ activities in public companies in emerging markets.
In addition, in contrast to prior literature, our results document an inverse trend with fewer firms payingcash dividends over the period 2001–2006 than the previous period, which helps to shed light on a time-seriesshift in dividend policies. These results suggest a dynamic approach is needed for researchers to investigatedividend payment policies.
Also, the results on the role of majority shareholders, such as state shareholders in the unique setting ofChina, can help us obtain a better understanding of the role of government ownership in the business world,as more governments in western countries have obtained and/or increased state ownership in business enter-prises during the recent economic crisis.
Finally, our results help investors obtain a comprehensive understanding of the different roles of variousshareholders in shaping corporate dividend policies. Further, our results show that growth opportunities, cashflow and profitability have similar effects on dividends in the emerging market of China as documented byprior literature (Alpa, 2005; Goergen et al., 2005), which helps investors determine their investment strategies.
References
Allen, F., Bernardo, A., Welch, I., 2000. A theory of dividends based on tax clientele. Journal of Finance 55, 2499–2536.Alpa, D., 2005. Corporate dividend policy: the views of British financial managers. Journal of Business Finance and Accounting 32 (7/8),
1625–1672.Bhattacharya, S., 1979. Imperfect information, dividend policy and “the bird in the hand” fallacy. Bell Journal of Economics 10, 259–270.Brav, A., Graham, J.R., Harvey, C.R., Michaely, R., 2005. Payout policy in the 21st century. Journal of Financial Economics 77 (3), 483–
527.Chen, D., Jian, M., Xu, M., 2009. Dividends for tunneling in a regulated economy: the case of China. Pacific-Basin Finance Journal 17,
209–223.Chen, G., Firth, M., Gao, N., 2002. The information content of concurrently announced earnings, cash dividends and stock dividends: an
investigation of the Chinese stock market. Journal of International Financial Management and Accounting 13 (2), 101–124.Chen, K., Yuan, H., 2004. Earnings management and capital resource allocation: evidence from China’s accounting-based regulation of
rights Issues. The Accounting Review 79, 645–665.Cheng, L., Fung, H., Leung, T., 2006. Why do Chinese investors prefer stock dividends to cash dividends? Working paper, University of
Missouri and Hong Kong Polytechnic University.Cheng, L., Fung, H., Leung, T., 2007. Why do poorly performing firms pay cash dividends? Evidence from mainland China and Hong
Kong, Working paper, University of Missouri and Hong Kong Polytechnic University.Cheng, L., Fung, H., Leung, T., 2009. Dividend preferences of tradable-share and non-tradable-share holders in Mainland China.
Accounting and Finance 49, 291–316.Choe, H., Kho, B.C., Stulz, R., 2005. Do domestic investors have an edge? The trading experience of foreign investors in Korea. Review of
Financial Studies 18, 795–829.Choi, J.J., Park, S., Yoo, S., 2007. The value of outside directors: Evidence from corporate governance reform in Korea. Journal of
Financial and Quantitative Analysis 42, 941–962.Choi, J., Sami, H., Zhou, H., 2009. Corporate ownership and bid-ask spread: Evidence on information asymmetry in Chinese capital
markets, Working paper, Temple University, Lehigh University and University of Texas Pan American.Chong, L.M., Wang, S., 2004. Understanding Chinese Financial Statements. Shanghai University of Finance and Economic Press,
Shanghai China.CSRC., 2005. Circular on issues relating to the pilot reform of listed companies split share structure, China Securities Regulatory
Commission, No.5.DeAngelo, H., Masulis, R.W., 1980. Leverage and dividend irrelevancy under corporate and personal taxation. The Journal of Finance 35,
453–464.Easterbrook, F.H., 1984. Two agency-cost explanations of dividends. The American Economic Review 74, 650–659.Faccio, M., Lang, L., Young, L., 2001. Dividends and expropriation. The American Economic Review 91 (1), 54–78.
K.C.K. Lam et al. / China Journal of Accounting Research 5 (2012) 199–216 215
Fama, E., Jensen, M., 1983. Separation of ownership and control. Journal of Law and Economics (June), : 301–325.Fama, E.F., MacBeth, J.D., 1973. Risk, return and equilibrium: Empirical tests. Journal of Political Economy 81, 607–636.Ferguson, M.J., Lam, K.C., Lee, G.M., 2002. Voluntary disclosure by state-owned enterprises listed on the stock exchange of Hong Kong.
Journal of International Financial Management and Accounting 13 (2), 125–142.Frankfurter, G.M., Lane, W.R., 1992. The rationality of dividends. International Review of Financial Analysis 1, 115–129.Fuerst, O., 1998. A theoretical analysis of the investor protection regulations argument for global listing of stocks. Working paper, Yale
School of Management.Goergen, M., Correia da Silva, L., Renneboog, L., 2005. When do German firms change their dividends?. Journal of Corporate Finance 11
375–399.Grinblatt, M., Masulis, R.W., Titman, S., 1984. The valuation effects of stock splits and stock dividends. Journal of Financial Economics
13, 461–490.GTA., 2010. China Listed Firms’ Cash and Stock Dividends Research Database. User Guide GTA Information Technology Company
Limited. Centre for China Financial Research of the University of Hong Kong.Jensen, M.C., 1986. Agency costs of free cash flow, corporate finance, and takeovers. The American Economic Review 76, 323–329.Jensen, M., Meckling, W., 1976. Theory of the firm: managerial behavior, agency costs, and ownership structure. Journal of Financial
Economics 3 (October), 305–360.Jensen, G.R., Solbreg, D.P., Zorn, T.S., 1992. Simultaneous determination of insider ownership, debt, and dividend Policies. Journal of
Financial and Quantitative Analysis 27 (2), 247–263.Jiang, G., Lee, C.M., Yue, H., 2010. Tunneling through intercorporate loans: the China experience. Journal of Financial Economics 98, 1–
20.John, K., Kalay, A., 1982. Costly contracting and optimal payout constraints. The Journal of Finance 37, 457–470.John, K., Williams, J., 1985. Dividends, dilution, and taxes: a signaling equilibrium. The Journal of Finance 40, 1053–1070.Kale, J.R., Noe, T.H., 1990. Dividends, uncertainty, and underwriting costs under asymmetric information. The Journal of Financial
Research 13, 265–277.Kieso, D.E., Weygandt, J., Warfield, T.D., 2007. Intermediate Accounting, 12 ed. Wiley, New Jersey.Khan, T.S., 2006. Company dividends and ownership structure: evidence from UK panel data. Economic Journal 116, 172–189.Lakonishok, J., Lev, B., 1987. Stock splits and stock dividends: why, who and when? Journal of Finance 47, 913–932.Lan, F.Y., 2001. On the Theory of Dividend Policy of Listed Companies in China. East China Normal University Press, China Shanghai,
ISBN 7-5617-2385-7 (in Chinese).La Porta, R., Lopez-de-Silanes, F., Shleifer, A., Vishny, R.W., 2000. Agency problems and dividend policies around the world. Journal of
Finance 55 (1), 1–33.Lee, J. and Xiao, X., 2004. Tunneling dividends. Working paper, Tulane University.Leuz, C., Oberholzer-Gee, F., 2006. Political relationships, global financing, and corporate transparency: evidence from Indonesia.
Journal of Financial Economics 81, 411–439.Lin, C.H., Schiu, C., 2003. Foreign ownership in the Taiwan stock market: an empirical analysis. Journal of Multinational Financial
Management 13 (1), 19–41.Mancinelli, L., Ozkan, A., 2006. Ownership structure and dividend policy: evidence from Italian firms. European Journal of Finance 12
(3), 265–282.Miller, M.H., Rock, K., 1985. Dividend policy under asymmetric information. Journal of Finance 40, 1031–1051.Miller, M.H., Scholes, M.S., 1978. Dividends and taxes. Journal of Financial Economics 6, 333–364.Milonas, T., Travlos, N., Xiao, J., Tan, C., 2006. The Ex-dividend day stock price behavior in the Chinese stock market. Pacific-Basin
Finance Journal 14 (2), 155–174.Rozeff, M.S., 1982. Growth, beta and agency costs as determinants of dividend payout ratios. The Journal of Financial Research 5, 249–
259.Sami, H., Zhou, H., 2004. A comparison of value relevance of accounting information in different segments of the Chinese stock market.
International Journal of Accounting, 403–427.Shiller, R.J., 1984. Stock prices and social dynamics. Brookings Papers on Economic Activity, 457–510.Szilagyi, P.G., Renneboog, L., 2007. How relevant is dividend policy under low shareholder protection? Working paper, University of
Cambridge and Tilburg University.Thomsen, S., 2005. Conflicts of interest or aligned incentives? Blockholder ownership, dividends and firm value in the US and the EU.
European Business Organization Law Review 6 (2), 201–226.Wei, G., Xiao, J., 2009. Equity ownership segregation, shareholder preferences and dividend policy in China. The British Accounting
Review 41, 169–183.Wei, G., Zhang, W., Xiao, J., 2004. Dividends payment and ownership structure in China. Advances in Financial Economics 9, 187–219.Wilkinson, B.R., Cahan, S.F., Jones, G., 2001. Strategies and dividends imputation: the effect of foreign and domestic ownership on
average effective tax rates. Journal of International Accounting, Auditing, and Taxation 10, 157–175.
216 K.C.K. Lam et al. / China Journal of Accounting Research 5 (2012) 199–216

Banking system reform, earnings quality and credit allocation
Xiuli Zhu a,b,⇑, Lianjun Li a, Yunkui Xue c
a Nanjing University of Finance and Economics, Chinab Shanghai Jiaotong University, Chinac Cheung Kong Graduate School of Business, China
A R T I C L E I N F O
Article history:
Received 4 January 2012Accepted 28 August 2012Available online 9 October 2012
JEL classification:
G3G32G38
Keywords:
Banking system reformOwnershipEarnings qualityCredit allocation
A B S T R A C T
This paper investigates credit allocation before and after the 2003 banking sys-tem reform in China. We find that relationships between earnings quality andnew short-term loans, long-term loans and total loans in listed companieschanged significantly after the banking system reform, especially in state-owned listed companies. Further investigation shows that due to the influenceof rent-seeking, banks have eased the earnings requirements of non-state-owned listed companies. These findings enhance our understanding of the eco-nomic consequences of the banking system reform and of credit discriminationunder the new regime.
� 2012 China Journal of Accounting Research. Founded by Sun Yat-senUniversity and City University of Hong Kong. Production and hosting by
Elsevier B.V. All rights reserved.
1. Introduction
Government intervention in the financial system to promote the development of the capital markets is oneof the distinguishing characteristics of China’s transitional economy. Theorists and practitioners have longheld that ownership is an important factor that determines China’s financial resource allocation and that there
1755-3091/$ - see front matter � 2012 China Journal of Accounting Research. Founded by Sun Yat-sen University and City University of
Hong Kong. Production and hosting by Elsevier B.V. All rights reserved.
http://dx.doi.org/10.1016/j.cjar.2012.08.001
⇑ Corresponding author at: Nanjing University of Finance and Economics, Wenyuan Road 3, Xianlin, Xixia District, Nanjing, China.E-mail address: [email protected] (Z. Xiuli).
Production and hosting by Elsevier
China Journal of Accounting Research 5 (2012) 217–229
Contents lists available at SciVerse ScienceDirect
China Journal of Accounting Research
journal homepage: www.elsevier .com/locate /c jar

is serious non-equilibrium credit rationing1 in China’s credit market with discrimination against non-state-owned enterprises (Brandt and Li, 2003; Cull and Xu, 2005; Sun et al., 2005). Relative to state-owned enter-prises, the financial resources obtained by non-state-owned enterprises do not support the value created or“ownership determinism” theory. However, Fang (2010) implies that the financial discrimination that non-state-owned enterprises suffer is more likely to be due to their own strategy decisions or “corporate decisions”
theory.However, due to the mandatory change in China’s financial market, commercial banks and borrowers have
long been active participants in the market and thus research on credit resource allocation should pay moreattention to the rent-seeking of banks that originates from their monopoly. Xue and Zhu (2010) find that thefinancial reform at the end of 2003 did not affect property rights arrangements, nor did it change banks’ fore-casts of soft budget constraints, as borrowers’ debt maturity choices depend on banks’ rent-seeking character-istics. This paper takes ownership into account and studies whether state-owned enterprises and non-state-owned enterprises had different credit sources during the process of institutional change, whether banks’rent-seeking affects the loan allocation structure and whether the banking system reform has promoted themarketization of credit resource allocation.
We investigate credit allocation efficiency before and after the 2003 banking system reform and find thatsince the banking system reform, the role of earnings quality has been enhanced in the credit market andthe relationships between earnings quality and new short-term loans, long-term loans and total loans havechanged significantly in listed companies, especially in state-owned listed companies. Further research impliesthat due to the influence of rent-seeking (Xue and Zhu, 2010), commercial banks have loosened the earningsrequirements of non-state-owned listed companies.
The remainder of this paper is organized as follows. Section 2 discusses the related literature and hypoth-eses. Section 3 covers the data, variables and descriptive analysis. Section 4 provides the empirical methodol-ogy and presents the empirical findings and robustness tests, and Section 5 concludes.
2. Related literature and hypotheses
2.1. Impact of soft budget constraints and banks’ rent-seeking on credit allocation
When legal systems are weak, government regulation and financial intervention may be external constraintsto running financial markets in emerging economies. Due to socialist governments’ “father complex” towardstate-owned enterprises (Kornai, 1980; Kornai et al., 2003) and government compensation for policy loss dur-ing transition periods (Lin et al., 1994/1999, 1997, 2004), governments tend to relax financial discipline andsoften budget constraints (Kornai, 1980). When state-owned commercial banks themselves benefit from softbudget constraints and expect the government to redeem them, they will inevitably weaken its oversight role.Further, the increased government-backed interest may result in bankruptcy, harm owners’ benefits and gen-erate enormous social costs (Akerlof and Romer, 1993). This in turn leads to more widespread soft budgetconstraints (Berglof and Roland, 1995). Gao and Schaffer (1998) find that in transition countries, soft budgetconstraints give unprofitable enterprises access to bank credit more easily, thus the resource allocation effi-ciency of the banking system is lower. Studies on China’s financial market show that ownership and politicalrelations are important in giving enterprises access to long-term loans, with state-owned enterprises receivingmore long-term loans at lower credit standards (Sun et al., 2005; Jiang and Li, 2006; Zhang et al., 2010).
Before the banking system reform, a dual soft budget constraints mechanism2 substituted for a creditorprotection mechanism, which to a certain extent reduced the commercial banks’ losses but caused state-owned
1 In contrast to non-equilibrium credit rationing, equilibrium credit rationing is due to information asymmetry or customer relationships(Jaffee and Russell, 1976; Williamson, 1986).
2 Soft budget constraints contain at least two subjects: the constrained object and the supporter (Kornai et al., 2003). Constrainedobjects are limited by their own resources. If they make a loss, then they will not survive without external aid. Supporters are controlled bygovernment and can transfer resources to aid troubled firms. After January 1, 1985, China’s commercial banks replaced fiscalappropriation and became supporters of soft budget constraints, whereas the Central Bank became the supporter of the commercial banksand an eventual lender to state-owned enterprises and banks, creating a dual soft budget constraint.
218 Z. Xiuli et al. / China Journal of Accounting Research 5 (2012) 217–229

commercial banks to neglect their credit risk control, which led to more serious soft budget constraints. Themixed property rights between state-owned commercial banks and state-owned listed enterprises induced somestate-owned enterprises to regard credit loans from state-owned commercial banks as “free capital.” Once theyobtained such loans, diversion and embezzlement were inevitable.3 At the same time, state-owned commercialbanks that had a monopoly over financial resources inevitably sought rent, which resulted in a large number of“relation-loans” or “corruption-loans” and eventually produced a large amount of non-performing loans thathad to be borne by the government. Negotiation between banks and enterprises led not only to “state-ownedenterprise escape,” but also to “non-state-owned enterprise escape.” In the long run, state-owned commercialbanks’ exclusive monopoly over financial resources caused serious corruption, which threatened China’s finan-cial stability (Xie and Lu, 2005).
2.2. Impact of the banking system reform on budget constraints
Before 2003, China’s financial market reform mainly served the development of the capital market and didnot display characteristics of independence and marketization. The dual soft budget constraint and rent-seek-ing behavior led state-owned commercial banks to the edge of “technical bankruptcy” (Xie and Lu, 2005). TheChinese government responded with a new round of financial reforms at the end of 2003 that involved thefollowing aspects. (1) Capital injection and financial restructuring – at the end of 2003 and beginning of2004, the Bank of China and the China Construction Bank received injections of US$22.5 billion andUS$45 billion, respectively, of foreign exchange reserves and sold US$278.7 billion of suspicious bad assetsto Xinda Assets Management Companies. On November 6, 2008, Central Huijin Investment injectedUS$19 billion into the Agriculture Bank of China. In April 2005, Central Huijin Investment injectedUS$15 billion into the China Industrial and Commercial Bank. By 2005, the proportion of non-performingloans of these banks had fallen to below 5% and their capital adequacy ratio had reached the 8% requiredby the Basel New Capital Accord (Basel II) of 2006. (2) Corporate governance system improvement – accord-ing to “Guidance on the Corporate Management of Joint-stock Commercial Banks” released by the People’sBank of China in June 2002, “Guidance on the Corporation Governance Reform and Supervision of Bank ofChina and China Construction Bank” released by the China Banking Regulatory Commission in 2004 and“Guidance on the Corporation Governance Reform and Supervision of Stated-owned Commercial Banks”
released in April 2006, the three banks set up a corporate governance structure and introduced internationalinvestment banks as strategic investors to optimize the shareholding structure. (3) Exchange listings – after aseries of capital injections, financial restructuring and the issuance of new shares, China Construction Banklisted on the Hong Kong Stock Exchange on October 27, 2005; the Bank of China listed on the Hong KongStock Exchange on June 1, 2006 and on the Shanghai Stock Exchange on July 5 of that year, and the ChinaIndustrial and Commercial Bank listed on both the Shanghai and Hong Kong Stock Exchanges on October27, 2006. The Agricultural Bank of China Co., Ltd. was established on January 16, 2009 and listed on theShanghai and Hong Kong Stock Exchanges on July 15 and 16 of that year, respectively. (4) Financial legalsystem construction – to ensure the smooth reform of the financial system, the sixth meeting of the NPCStanding Committee promulgated the “Law of the People’s Republic of China on the People’s Bank of China(Revised)”, the “Law of the People’s Republic of China on Commercial Banks (Revised)” and the “BankingSupervision Law of the People’s Republic of China.” The three laws were executed in early 2004. The People’sBank of China and the China Banking Regulatory Commission either individually or jointly issued nearly 60regulations and guidelines in 2004.
Wu and Bai (2009) find that the financial system reform at the end of 2003 significantly tightened budgetconstraints, but due to the mandatory nature of the reform the economic system retained automaticity duringthe reform period (Aoki and Okuno, 2005). Xue and Zhu (2010) note that the financial reform, bound by thecost–benefit balance of state-owned banks and enterprises, has not alleviated banking corruption.
3 There were widespread problems in the restructuring of state-owned enterprises and borrowers diverted and embezzled their debt in theweak legal environment, harming creditors’ interests.
Z. Xiuli et al. / China Journal of Accounting Research 5 (2012) 217–229 219

According to the foregoing analysis, before the reform there was a weak legal environment, soft budgetconstraints and banking corruption in China’s financial market. After the reform, the soft budget constraintswere eased, but the rent-seeking behavior of banks was not totally resolved. Thus, it is particularly importantto study the relationships between banking reform, banking corruption and credit discrimination. This paperfocuses on two aspects of these issues: the change in the relationship between ownership and access to loansafter the financial reform and the difference in total loans between state-owned enterprises and non-state-owned enterprises after the financial reform.
2.3. Impact of financial reform on the decisions of lenders and borrowers: Hypothesis 1
It has been proved that earnings quality has a significantly negative influence on the cost of capital (Franciset al., 2002, 2003, 2005; Chow, 2008). According to the foregoing analysis, the mandatory reform was trig-gered not only by government, but also by the urgent need for the development of the financial market at thisstage. In the long run, market-oriented resource allocation is not only needed by listed companies and com-mercial banks, but is also a fundamental way to improve the efficiency of resource allocation. After the reform,along with the improvement of the legal environment, the quality of accounting information became moreimportant to credit resource allocation. This is summarized as hypothesis 1.
H1. The banking reform enhanced the role of earnings quality in market-oriented credit resource allocation.
2.4. Impact of ownership on the effect of the banking reform: Hypothesis 2
Before the reform, state-owned enterprises did not have to pay rent because they were supported by softbudget constraints. Further, the controlling shareholders of state-owned enterprises and non-state-ownedenterprises had different residual claims on the firm and thus shareholders had no motive to pay rent. Man-agers of state-owned enterprises were essentially asset exploiters and had no efficient resources to pay rent. Inthis case, due to the impulse of investment and credit rationing restrictions, non-state-owned enterprisesbecome the main entities paying rent to the commercial banks. All other things being equal, non-state-ownedenterprises that were willing to pay the rent had easier access to credit.
According to this analysis, China’s financial market has two significant characteristics: soft budget con-straints and rent-seeking. Thus, if state-owned enterprises with lower earnings quality obtain more loans afterthe reform, this means that government aid mechanisms have had an effect, whereas if non-state-owned enter-prises with lower earnings quality obtain more loans then they must be paying rent. According to Xue andZhu (2010), the reform has not really changed the nature of ownership and state-owned enterprises and com-mercial banks have not changed their use of soft budget constraints. In the short run, there is still an institu-tional basis for rent-seeking by banks after the reform, as non-state-owned enterprises are still the mainentities that pay rent. All other things being equal, commercial banks will loosen the restriction on the earn-ings quality of non-state-owned enterprises. This is summarized as hypothesis 2.
H2. After the reform, commercial banks require lower earnings quality from non-state-owned enterprisesthan state-owned enterprises.
3. Sample, variables and descriptive analysis
3.1. Sample
Our data covers all A-share listed companies with financial data for the period 1998–2010.4 Financial dataand other annual data were obtained from the CSMAR and WIND databases. Data on non-state-owned
4 We calculate earnings quality using the direct cash flow statements method. Accurate accruals data in the statement of cash flows isonly available from 1998, so the initial year of our study is 1998.
220 Z. Xiuli et al. / China Journal of Accounting Research 5 (2012) 217–229
enterprises was sourced from the CCER database. We exclude all utilities and financial institutions and wins-orize the major variables at the 1% and 99% levels.
We investigate the impact of the financial reform on loan allocation to study whether the effect of owner-ship on loan allocation changes with an institutional change. Restricted by the measurement of earnings qual-ity, we choose listed companies in the period 2001–2003 before the reform, and divide the period of our studyof 2001–2009 at 2004 to obtain two stages, the pre-reform period from 2001 to 2003 and the post-reform per-iod from 2005 to 2009.
3.2. Variables
(1) Bank loans
We use new short-term loans (Dls), new long-term loans (Dll) and new total loans (Dlt) to measure loan allo-cations, where Dls equals the difference between firm i’s closing and initial short-term loan balances divided bytotal assets, Dll equals the difference between firm i’s closing and initial long-term loan balances added to long-term loans of a maturity of less than 1 year divided by total assets, and Dlt equals the sum of Dls and Dll.
(2) Earnings quality
We use the modified Dechow–Dichev (2002, hereafter DD) measure to capture the quality attribute of mainoperating profits. We calculate 2001–2009 accrual quality using the relevant accounting information for roll-ing 5-year windows during 1998–2010:
TCAi;t
AVASSETi;t¼ a0 þ a1
CFOBTi;t�1
AVASSETi;tþ a2
CFOBTi;t
AVASSETi;tþ a3
CFOBTi;tþ1
AVASSETi;tþ a4
DREVi;t
AVASSETi;t
þ a5
PPEi;t
AVASSETi;tþ ei;t
where TCAi,t: firm i’s total current accruals in year t = (MOPi,t � CFOBTi,t)5; CFOBTi,t: cash flow from oper-
ations adjusted by tax in year t = (CFOi,t � IncomeTaxReturns + IncomeTaxExpense); AVASSETi,t: firm i’saverage total assets in year t and t � 1; DREVi,t: firm i’s change in revenue between year t and t � 1; PPEi,t: firmi’s gross value of property, plant and equipment in year t; EQ: the negative standard deviation of firm i’s estimatedresiduals from (I) and EQ ¼ �rðei;tÞ (large (small) values of EQ corresponding to good (poor) earnings quality).
(3) External financing dependence
According to Rajan and Zingales (1998) and Xue and Zhu (2010), we modify external financing dependenceto measure a firm’s external financing requirements:
EXDEPit ¼CAPXit � CFOit�1
AVASSETit;
where CAPXit: firm i’s capital expenditure in year t, which is equal to the sum of new long-term investment, fixedassets, intangible assets and other long-term assets; and CFOit � 1: firm i’s lagged operating cash flow in year t.
(4) Ownership
According to previous research, companies with different ownership types have a different loan structure.We thus code state-owned enterprises as 0 and non-state-owned enterprises as 1.
5 The foreign literature calculates CFO as earnings before extraordinary items less total accruals. However, data on earnings beforeextraordinary items is not available before 2003 in China, so we use operating profit as a substitute and adjust operating cash flow to pre-tax CFO to be consistent with earnings.
Z. Xiuli et al. / China Journal of Accounting Research 5 (2012) 217–229 221
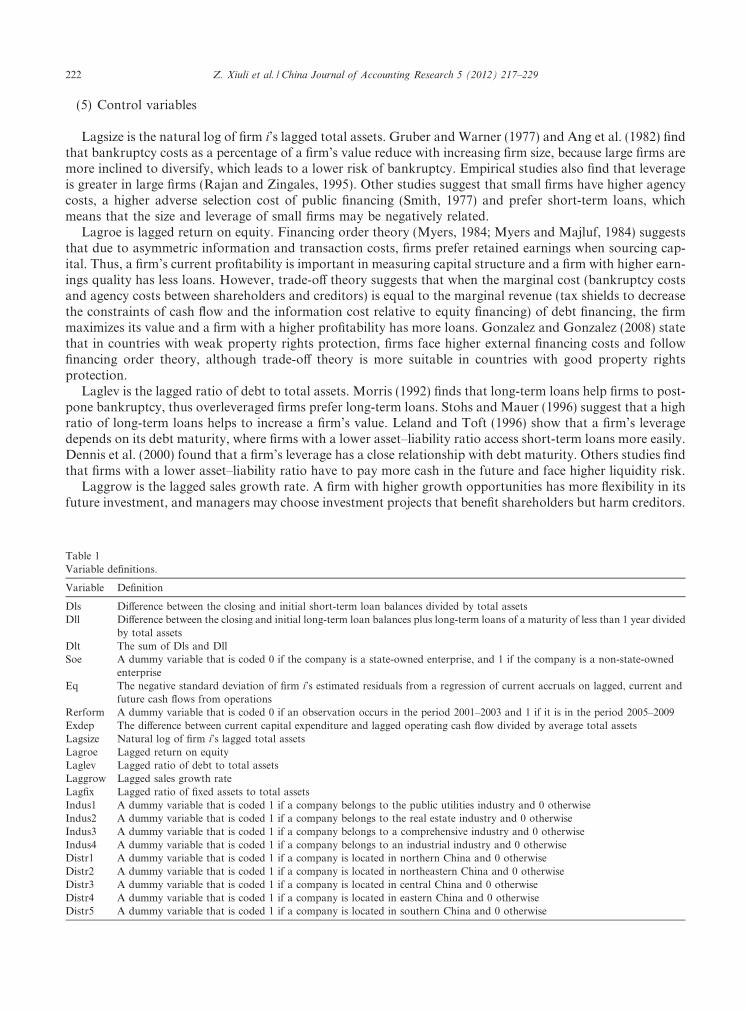
(5) Control variables
Lagsize is the natural log of firm i’s lagged total assets. Gruber and Warner (1977) and Ang et al. (1982) findthat bankruptcy costs as a percentage of a firm’s value reduce with increasing firm size, because large firms aremore inclined to diversify, which leads to a lower risk of bankruptcy. Empirical studies also find that leverageis greater in large firms (Rajan and Zingales, 1995). Other studies suggest that small firms have higher agencycosts, a higher adverse selection cost of public financing (Smith, 1977) and prefer short-term loans, whichmeans that the size and leverage of small firms may be negatively related.
Lagroe is lagged return on equity. Financing order theory (Myers, 1984; Myers and Majluf, 1984) suggeststhat due to asymmetric information and transaction costs, firms prefer retained earnings when sourcing cap-ital. Thus, a firm’s current profitability is important in measuring capital structure and a firm with higher earn-ings quality has less loans. However, trade-off theory suggests that when the marginal cost (bankruptcy costsand agency costs between shareholders and creditors) is equal to the marginal revenue (tax shields to decreasethe constraints of cash flow and the information cost relative to equity financing) of debt financing, the firmmaximizes its value and a firm with a higher profitability has more loans. Gonzalez and Gonzalez (2008) statethat in countries with weak property rights protection, firms face higher external financing costs and followfinancing order theory, although trade-off theory is more suitable in countries with good property rightsprotection.
Laglev is the lagged ratio of debt to total assets. Morris (1992) finds that long-term loans help firms to post-pone bankruptcy, thus overleveraged firms prefer long-term loans. Stohs and Mauer (1996) suggest that a highratio of long-term loans helps to increase a firm’s value. Leland and Toft (1996) show that a firm’s leveragedepends on its debt maturity, where firms with a lower asset–liability ratio access short-term loans more easily.Dennis et al. (2000) found that a firm’s leverage has a close relationship with debt maturity. Others studies findthat firms with a lower asset–liability ratio have to pay more cash in the future and face higher liquidity risk.
Laggrow is the lagged sales growth rate. A firm with higher growth opportunities has more flexibility in itsfuture investment, and managers may choose investment projects that benefit shareholders but harm creditors.
Table 1Variable definitions.
Variable Definition
Dls Difference between the closing and initial short-term loan balances divided by total assetsDll Difference between the closing and initial long-term loan balances plus long-term loans of a maturity of less than 1 year divided
by total assetsDlt The sum of Dls and DllSoe A dummy variable that is coded 0 if the company is a state-owned enterprise, and 1 if the company is a non-state-owned
enterpriseEq The negative standard deviation of firm i’s estimated residuals from a regression of current accruals on lagged, current and
future cash flows from operationsRerform A dummy variable that is coded 0 if an observation occurs in the period 2001–2003 and 1 if it is in the period 2005–2009Exdep The difference between current capital expenditure and lagged operating cash flow divided by average total assetsLagsize Natural log of firm i’s lagged total assetsLagroe Lagged return on equityLaglev Lagged ratio of debt to total assetsLaggrow Lagged sales growth rateLagfix Lagged ratio of fixed assets to total assetsIndus1 A dummy variable that is coded 1 if a company belongs to the public utilities industry and 0 otherwiseIndus2 A dummy variable that is coded 1 if a company belongs to the real estate industry and 0 otherwiseIndus3 A dummy variable that is coded 1 if a company belongs to a comprehensive industry and 0 otherwiseIndus4 A dummy variable that is coded 1 if a company belongs to an industrial industry and 0 otherwiseDistr1 A dummy variable that is coded 1 if a company is located in northern China and 0 otherwiseDistr2 A dummy variable that is coded 1 if a company is located in northeastern China and 0 otherwiseDistr3 A dummy variable that is coded 1 if a company is located in central China and 0 otherwiseDistr4 A dummy variable that is coded 1 if a company is located in eastern China and 0 otherwiseDistr5 A dummy variable that is coded 1 if a company is located in southern China and 0 otherwise
222 Z. Xiuli et al. / China Journal of Accounting Research 5 (2012) 217–229

Myers (1984) suggests that firms borrow short-term loans to reduce agency costs, thus short-term loans will bepositively related to growth and long-term loans will be negatively related to investment. However, Titmanand Wessels (1988) consider that growth is the added value of firm’s assets and cannot be collateral or createtax revenue.
Lagfix is the lagged ratio of fixed assets to total assets. Scott (1972) and Myers and Majluf (1984) suggestthat managers may benefit from selling collateral and the more managers can use collateral assets, the moreopportunistic their behavior. Jensen and Meckling (1976) and Myers (1977) suggest that in a firm with higherleverage, managers are more likely to invest in projects that may harm creditors. Collateral helps to restrictborrowers from investing in higher risk projects and manager’s non-pecuniary compensation demands maylead to a positive relationship between collateral and debt levels.
Table 2Descriptive statistics before and after financial reform.
Pre-reform Post-reform T-test Wilcoxon
Mean Median Mean Median
Dls 0.0199 0.0145 �0.0121 0.0000 �8.41 <.0001 �11.70 0.0000Dll 0.0196 0.0000 0.0211 0.0000 0.61 0.5429 0.09 0.9266Dlt 0.0395 0.0306 0.0092 0.0029 �6.03 <.0001 �9.60 0.0000Eq �0.0518 �0.0262 �0.0592 �0.0298 �2.85 0.0044 �2.54 0.0110Exdep �0.0249 �0.0258 �0.0363 �0.0413 �1.36 0.1732 �4.34 0.0000Lagsize 20.9218 20.8928 21.2871 21.3073 11.98 <.0001 13.02 0.0000Lagroe 0.0009 0.0641 0.0316 0.0533 0.38 0.7060 �0.93 0.3530Laglev 0.5054 0.4751 0.6803 0.5536 4.38 <.0001 12.20 0.0000Laggrow 0.0672 0.0410 0.0302 0.0559 �0.96 0.3374 2.83 0.0046Lagfix 0.3329 0.3121 0.3229 0.2965 �1.78 0.0748 �2.59 0.0097N 1735 1735 3382 3382
Table 3Descriptive statistics for state-owned and non-state-owned enterprises before and after the financial reform.
Non-state-owned State-owned T-test Wilcoxon
Mean Median Mean Median
Panel A: Descriptive statistics before the financial reform
Dls 0.0235 0.0643 0.0197 0.0228 �0.56 0.5746 �2.25 0.0248Dll 0.0248 0.0000 0.0194 0.0000 �1.35 0.1762 �0.21 0.8300Dlt 0.0483 0.0285 0.0391 0.0429 �1.17 0.2415 �2.59 0.0096Eq �0.0746 �0.0239 �0.0436 �0.0355 7.11 <.0001 7.49 0.0000Exdep �0.0265 �0.0263 �0.0229 �0.0234 0.40 0.6860 �0.42 0.6753Lagsize 20.4776 21.0083 21.0630 20.5215 12.52 <.0001 11.80 0.0000Lagroe �0.0461 0.0641 0.0271 0.0614 0.77 0.4419 1.12 0.2631Laglev 0.5549 0.4583 0.4797 0.5167 �3.80 0.0002 �4.99 0.0000Laggrow 0.0514 0.0453 0.0707 0.0268 1.42 0.1547 2.94 0.0033Lagfix 0.2983 0.3298 0.3489 0.2726 5.02 <.0001 5.01 0.0000N 448 1287
Panel B: Descriptive statistics after the financial reform
Dls �0.0387 �0.0005 �0.0005 0.0000 7.34 <.0001 6.97 <.0001Dll 0.0177 0.0000 0.0231 0.0000 1.48 0.1399 1.27 0.1016Dlt �0.0204 0.0000 0.0225 0.0101 5.98 <.0001 4.98 <.0001Eq �0.0866 �0.0358 �0.0476 �0.0245 11.15 <.0001 11.14 <.0001Exdep �0.0549 0.6839 �0.0268 0.5436 2.17 0.0302 �1.55 0.0603Lagsize 20.6747 20.9211 21.5328 21.4864 2.72 0.0065 19.44 <.0001Lagroe �0.0522 0.0588 0.0650 0.0575 21.03 <.0001 �2.97 0.0015Laglev 0.9746 0.5391 0.5683 0.5326 �0.93 0.3507 �9.14 <.0001Laggrow �0.0278 0.0590 0.0530 0.0692 6.29 <.0001 7.69 <.0001Lagfix 0.2765 0.2681 0.3468 0.3248 1.28 0.2012 9.12 <.0001N 957 2425
Z. Xiuli et al. / China Journal of Accounting Research 5 (2012) 217–229 223
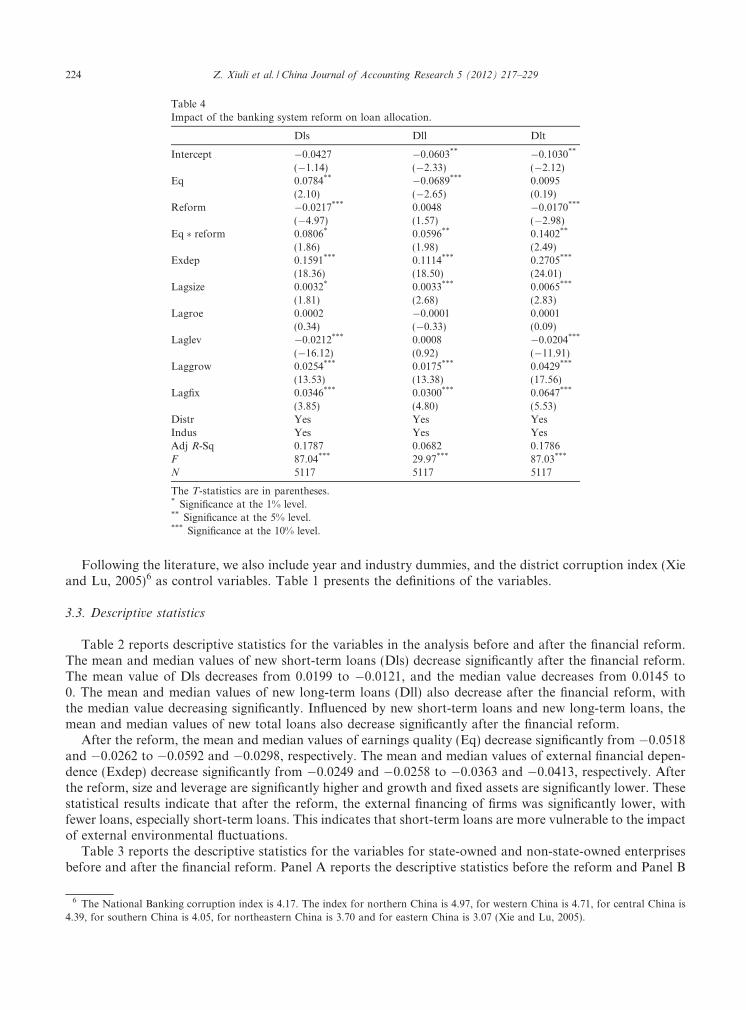
Following the literature, we also include year and industry dummies, and the district corruption index (Xieand Lu, 2005)6 as control variables. Table 1 presents the definitions of the variables.
3.3. Descriptive statistics
Table 2 reports descriptive statistics for the variables in the analysis before and after the financial reform.The mean and median values of new short-term loans (Dls) decrease significantly after the financial reform.The mean value of Dls decreases from 0.0199 to �0.0121, and the median value decreases from 0.0145 to0. The mean and median values of new long-term loans (Dll) also decrease after the financial reform, withthe median value decreasing significantly. Influenced by new short-term loans and new long-term loans, themean and median values of new total loans also decrease significantly after the financial reform.
After the reform, the mean and median values of earnings quality (Eq) decrease significantly from �0.0518and �0.0262 to �0.0592 and �0.0298, respectively. The mean and median values of external financial depen-dence (Exdep) decrease significantly from �0.0249 and �0.0258 to �0.0363 and �0.0413, respectively. Afterthe reform, size and leverage are significantly higher and growth and fixed assets are significantly lower. Thesestatistical results indicate that after the reform, the external financing of firms was significantly lower, withfewer loans, especially short-term loans. This indicates that short-term loans are more vulnerable to the impactof external environmental fluctuations.
Table 3 reports the descriptive statistics for the variables for state-owned and non-state-owned enterprisesbefore and after the financial reform. Panel A reports the descriptive statistics before the reform and Panel B
Table 4Impact of the banking system reform on loan allocation.
Dls Dll Dlt
Intercept �0.0427 �0.0603** �0.1030**
(�1.14) (�2.33) (�2.12)Eq 0.0784** �0.0689*** 0.0095
(2.10) (�2.65) (0.19)Reform �0.0217*** 0.0048 �0.0170***
(�4.97) (1.57) (�2.98)Eq � reform 0.0806* 0.0596** 0.1402**
(1.86) (1.98) (2.49)Exdep 0.1591*** 0.1114*** 0.2705***
(18.36) (18.50) (24.01)Lagsize 0.0032* 0.0033*** 0.0065***
(1.81) (2.68) (2.83)Lagroe 0.0002 �0.0001 0.0001
(0.34) (�0.33) (0.09)Laglev �0.0212*** 0.0008 �0.0204***
(�16.12) (0.92) (�11.91)Laggrow 0.0254*** 0.0175*** 0.0429***
(13.53) (13.38) (17.56)Lagfix 0.0346*** 0.0300*** 0.0647***
(3.85) (4.80) (5.53)Distr Yes Yes YesIndus Yes Yes YesAdj R-Sq 0.1787 0.0682 0.1786F 87.04*** 29.97*** 87.03***
N 5117 5117 5117
The T-statistics are in parentheses.* Significance at the 1% level.** Significance at the 5% level.*** Significance at the 10% level.
6 The National Banking corruption index is 4.17. The index for northern China is 4.97, for western China is 4.71, for central China is4.39, for southern China is 4.05, for northeastern China is 3.70 and for eastern China is 3.07 (Xie and Lu, 2005).
224 Z. Xiuli et al. / China Journal of Accounting Research 5 (2012) 217–229

reports the descriptive statistics after the reform. Before the reform, the mean and median values of new short-term loans (Dls) for state-owned enterprises are significantly lower than for non-state-owned enterprises. Thevalues of new long-term loans and new total loans for state-owned enterprises are also lower than that fornon-state-owned enterprises. This statistical result indicates that before the reform, short-term loans andlong-term loans were complementary. The mean and median values of earnings quality (Eq) of state-ownedenterprises are significantly higher than those of non-state-owned enterprises. There is an insignificant differ-ence in the external financial dependence (Exdep) of state-owned and non-state-owned enterprises.
Post-reform, the values of new short-term loans and new total loans of state-owned enterprises is signifi-cantly higher than that of non-state-owned enterprises. There is an insignificant difference in long-term loansbetween state-owned and non-state-owned enterprises, which means that soft budget constraints are still inforce after the reform. The mean and median values of earnings quality (Eq) of state-owned enterprises arestill significantly higher than those of non-state-owned enterprises. There is still an insignificant differencein the external financial dependence (Exdep) of state-owned and non-state-owned enterprises. This result indi-cates that the earnings quality of state-owned enterprises is significantly higher during 2001–2009 than that ofnon-state-owned enterprises, and thus the reform has significantly improved the short-term credit market.
4. Results
4.1. Impact of the banking system reform on loan allocation
We use model (1) to analyze the variance in the impact of earnings quality on loan allocation between state-owned enterprises and non-state-owned enterprises:
Table 5Impact of the banking system reform on loan allocation to state-owned enterprises.
Dls Dll Dlt
Intercept �0.0604* �0.0780*** �0.1384***
(�1.77) (�3.02) (�3.23)Eq 0.0438 �0.1109*** �0.0671
(1.06) (�3.53) (�1.29)Reform �0.0134*** 0.0057* �0.0077
(�3.41) (1.92) (�1.56)Eq � reform 0.1541*** 0.0701* 0.2242***
(3.23) (1.94) (3.75)Exdep 0.1267*** 0.1457*** 0.2724***
(13.62) (20.69) (23.37)Lagsize 0.0034** 0.0036*** 0.0070***
(2.10) (2.97) (3.47)Lagroe �0.0003 0.0013** 0.0011
(�0.37) (2.52) (1.22)Laglev �0.0111*** 0.0019 �0.0092***
(�5.37) (1.20) (�3.55)Laggrow 0.0238*** 0.0272*** 0.0510***
(11.70) (17.62) (19.98)Lagfix 0.0418*** 0.0454*** 0.0872***
(5.28) (7.59) (8.80)Distr Yes Yes YesIndus Yes Yes YesAdj R-Sq 0.1095 0.1164 0.1710F 36.22*** 38.87*** 60.12***
N 3712 3712 3712
The T-statistics are in parentheses.* Significance at the 1% level.** Significance at the 5% level.*** Significance at the 10% level.
Z. Xiuli et al. / China Journal of Accounting Research 5 (2012) 217–229 225

DlsðDll=DltÞ ¼ f ðEq;Reform;Eq �Reform;Exdep;Lagsize;Lagroe;Laglev;Laggrow;Lagfix;Distr; IndusÞð1Þ
Table 4 reports the results of model (1) testing the variance in the impact of earnings quality on loan allo-cation before and after the reform. We find that before the reform earnings quality has a significant positiveinfluence on new short-term loans and a significant negative influence on new long-term loans, which due tothe substitutability of soft budget constraints means that earnings quality has no significant influence on newtotal loans. After the reform, the strength of the positive relationship between earnings quality and loansincreases. The results in Table 4 indicate that the banking system reform has improved the efficiency of finan-cial resource allocation and that earnings quality has had an incremental influence on credit loans.
Table 5 reports the results of model (1) testing the impact of state-owned enterprises’ earnings quality onloan allocation before and after the reform. After the reform, the positive relationship between the earningsquality of state-owned enterprises and new short-term loans, new long-term loans and new total loans isenhanced. The results in Table 5 indicate that the banking system reform has improved credit allocationand tightened budget constraints.
Table 6 reports the results of model (1) testing the impact of the earnings quality of non-state-owned enter-prises on loan allocation before and after the reform. After the reform, the relationship between the earningsquality of non-state-owned enterprise and new short-term loans, new long-term loans and new total loans doesnot change significantly. Combined with the results in Table 5, the reform appears to have had a greaterimpact on state-owned enterprises than non-state-owned enterprises, which provides preliminary evidenceto verify Hypothesis 2.
Table 6Impact of the banking system reform on loan allocation to non-state-owned enterprises.
Dls Dll Dlt
Intercept 0.1428 0.0043 0.1471(1.34) (0.06) (1.04)
Eq 0.1624** �0.0228 0.1396(2.21) (�0.47) (1.43)
Reform �0.0401*** 0.0020 �0.0381**
(�3.36) (0.25) (�2.40)Eq � reform �0.0400 0.0434 0.0034
(�0.47) (0.77) (0.03)Exdep 0.3493*** 0.1434*** 0.4928***
(15.25) (9.45) (16.20)Lagsize �0.0044 0.0013 �0.0030
(�0.86) (0.40) (�0.45)Lagroe �0.0004 �0.0013* �0.0017
(�0.33) (�1.82) (�1.16)Laglev �0.0290*** �0.0019 �0.0308***
(�13.18) (�1.27) (�10.56)Laggrow �0.0063 �0.0028 �0.0090
(�1.35) (�0.91) (�1.47)Lagfix 0.0294 0.0000 0.0294
(1.13) (0.00) (0.85)Distr Yes Yes YesIndus Yes Yes YesAdj R-Sq 0.2810 0.0622 0.2527F 43.56*** 8.22*** 37.83***
N 1405 1405 1405
The T-statistics are in parentheses.* Significance at the 1% level.** Significance at the 5% level.*** Significance at the 10% level.
226 Z. Xiuli et al. / China Journal of Accounting Research 5 (2012) 217–229

4.2. Impact of ownership on the effect of the banking system reform
To further analyze the impact of the banking system reform on financial resource allocation, we include theSoe ownership variable (equal to 1 for non-state-owned enterprises) in our model:
DlsðDll=DltÞ ¼ f ðEq;Reform; Soe;Eq �Reform;Reform � Soe;Eq � Soe;Eq �Reform
� Soe;Exdep;Lagsize;Lagroe;Laglev;Laggrow;Lagfix;Distr; IndusÞ ð2Þ
Table 7 reports the impact of ownership on the effect of the banking system reform. When the ownershipvariable is included, the impact of the reform on credit resources becomes significantly negative and the post-reform impact of the interaction between earnings quality and ownership on short-term loans, long-term loansand total loans is �0.2, �0.0232, and �0.2233. This means that the effect of the banking system reform onearnings quality has been lower in non-state-owned enterprises than in state-owned enterprises. These resultsshow that commercial banks and non-state-owned enterprises have not reduced their rent-seeking since thereform.
The foregoing results are reported with White-adjusted standard errors. We also conducted several addi-tional tests. We repeated the tests using the Jones model (Jones, 1991), substituting earnings predictability
Table 7Impact of ownership on the effect of the banking system reform.
Dls Dll Dlt
Intercept �0.0320 �0.0773*** �0.1093**
(�0.82) (�2.84) (�2.15)Eq 0.0239 �0.0965** �0.0727
(0.44) (�2.55) (�1.03)Reform �0.0107** 0.0055 �0.0052
(�2.09) (1.55) (�0.78)Soe 0.0196** 0.0112** 0.0307***
(2.42) (1.99) (2.93)Eq � reform 0.1743*** 0.0647 0.2390***
(2.83) (1.51) (2.98)Reform � soe �0.0370*** �0.0048 �0.0418***
(�3.89) (�0.73) (�3.38)Eq � soe 0.1256* 0.0594 0.1850**
(1.75) (1.19) (1.99)Eq � reform � soe �0.2000** �0.0232 �0.2233**
(�2.57) (�0.43) (�2.20)Exdep 0.1576*** 0.1121*** 0.2697***
(18.18) (18.59) (23.92)Lagsize 0.0025 0.0039*** 0.0064***
(1.35) (3.08) (2.69)Lagroe 0.0002 �0.0001 0.0001
(0.39) (�0.34) (0.12)Laglev �0.0217 0.0010 �0.0206***
(�16.29) (1.13) (�11.92)Laggrow 0.0250*** 0.0176*** 0.0427***
(13.32) (13.48) (17.45)Lagfix 0.0321*** 0.0322*** 0.0643***
(3.54) (5.10) (5.44)Distr Yes Yes YesIndus Yes Yes YesAdj R-Sq 0.181 0.069 0.1799F 67.86*** 23.40*** 67.35***
N 5117 5117 5117
The T-statistics are in parentheses.* Significance at the 1% level.** Significance at the 5% level.*** Significance at the 10% level.
Z. Xiuli et al. / China Journal of Accounting Research 5 (2012) 217–229 227
(Lev, 1983; Ali and Zarowin, 1992; Francis et al., 2002) for earnings quality, using cash from borrowing fromthe cash-flow statement as total loans and using the sample year 2001 only. In addition, we repeated the testsusing Tobin’s Q to measure a firm’s growth opportunities, ROA to measure a firm’s profitability and the nat-ural logarithm of total sales to measure size. The results do not change in any of these additional tests and wedo not report them due to space limitations.
5. Conclusion
This paper investigates credit allocation before and after the 2003 banking system reform to analyze theinteractive influence of government, commercial banks, state-owned enterprises and non-state-owned enter-prises on credit allocation. We find that the banking system reform has enhanced the role of earnings qualityin the credit markets and eased the budget constraints of state-owned enterprises. Further analysis impliesthat, due to the influence of rent-seeking, banks have relaxed the earnings requirements of non-state-ownedlisted companies.
The practical implication of these findings is that improving credit allocation efficiency is not a matter of asimple policy choice, but is the result of institutional design. In the long run, further research is needed on thegame theory of government, commercial banks, state-owned enterprises and non-state-owned enterprises inlight of the stock-liquidity reform and the deeper financial system reform, with a focus on the influence of gov-ernment governance on credit allocation.
Acknowledgements
This paper has benefited greatly from the comments and suggestions of the Executive Editor and two anon-ymous referees. We are thankful to Professor Qiang Xinrong from Xiamen University for her comments andsuggestions at the 5th Symposium of China Journal of Accounting Research 2011. All remaining errors areour own. This paper was supported by the Jiangsu Province University Philosophy Social Science Fund Pro-ject entitled “Local Government Governance – Earnings Quality and Credit Allocation” (Grant No.:2011SJD630055).
References
Akerlof, George A., Romer, 1993. Looting: the economic underworld of bankruptcy for profit. Brookings Papers on Economic Activity98/2, 1–60.
Ali, A., Zarowin, P., 1992. The role of earnings levels in annual earnings–returns studies. Journal of Accounting Research 30, 286–296.Ang, J., Chua, J., McConnell, J., 1982. The administrative costs of corporate bankruptcy: a note. Journal of Finance 37 (March), 219–226.Aoki, Okuno, 2005. Comparative Institutional Analysis of the Economic System. Chinese Development Publisher (in Chinese).Berglof, Erik, Roland, Gerard, 1995. Soft budget constraints and credit crunches in financial transition. Journal of Japanese and
International Economies 9, 354–375.Brandt, L., Li, H., 2003. Bank discrimination in transition economics: ideology, information, or incentives? Journal of Comparative
Economics 31, 387–413.Chow, G.L., 2008. Earnings Quality and Cost of Capital. Ph.D. Thesis, Shanghai University of Finance (in Chinese).Cull, R., Xu, L., 2005. Institutions, ownership, and finance: the determinants of profit reinvestment among Chinese firms. Journal of
Financial Economics 77, 117–146.Dechow, P., Dichev, I., 2002. The quality of accruals and earnings: the role of accrual estimation errors. Accounting Review 77
(Supplement), 35–59.Dennis, S., Nandy, D., Sharpe, I.G., 2000. The determinants of contract terms in bank revolving credit agreements. Journal of Financial
and Quantitative Analysis 35, 87–110.Fang, J.X., 2010. Non SOEs: really facing banking lending discrimination? Management World 11, 123–131 (in Chinese).Francis, J., LaFond, R., Olsson, P., Schipper, K., 2002. The Market Pricing of Earnings Quality. Working Paper, Duke University,
University of Wisconsin and the FASB.Francis, J., LaFond, R., Olsson, P., Schipper, K., 2003. Earnings Quality and the Pricing Effects of Earnings Patterns. Working Paper,
Duke University, University of Wisconsin and the FASB.Francis, J., Khurana, K., Pereira, R., 2005. Disclosure incentives and effects on cost of capital around the world. Accounting Review 80,
1125–1162.Gao, S., Schaffer, M.E., 1998. Financial Discipline in the Enterprise Sector in Transition Countries: How Does China Compare? Center
for Economic Reform and Transition Discussion Paper: 98/1, Heriott-Watt University, Edinburgh.
228 Z. Xiuli et al. / China Journal of Accounting Research 5 (2012) 217–229
Gonzalez, Victor M., Gonzalez, Francisco, 2008. Influence of bank concentration and institutions on capital structure: new internationalevidence. Journal of Corporate Finance 4 (14), 363–375.
Gruber, M., Warner, J., 1977. Bankruptcy costs: some evidence. Journal of Finance 32, 337–347.Jaffee, Dwight M., Russell, Thomas, 1976. The imperfect information, uncertainty, and credit rationing. The Quarterly Journal of
Economics 90 (4), 651–666.Jensen, M.C., Meckling, W., 1976. Theory of the firm: managerial behavior, agency costs and capital structure. Journal of Financial
Economics 3, 305–360.Jiang, W., Li, B., 2006. Institutional environment, state ownership and lending discrimination. China Financial Research 11, 116–126 (in
Chinese).Jones, J., 1991. Earnings management during import relief investigations. Journal of Accounting Research 29, 193–228.Kornai, J., 1980. Economics of Shortage. Amsterdam, North Holland.Kornai, Janos, Maskin, Eric, Roland, Gerard, 2003. Understanding the soft budget constraints. Journal of Economic Literature XLI,
1095–1136.Leland, H.E., Toft, K.B., 1996. Optimal capital structure, endogenous bankruptcy, and the term structure of credit spreads. Journal of
Finance 51, 987–1019.Lev, B., 1983. Some economic determinants of the time-series properties of earnings. Journal of Accounting and Economics, 31–38.Lin, Y.F., Cai, F., Li, Z., 1997. Full information and Reform of SOEs. Shanghai People’s Publisher.Lin,Y.F., Cai, Li, Z., 1994/1999 . Chinese Miracle:Development strategy and economic reform. Shanghai People’s Publisher (1999 Revised
Edition).Lin, Y.F., Liu, M.X., Zhang, Q., 2004. Policy burden and enterprises’ soft budgetary binding: a case study from China. Management
World 8, 34–45 (in Chinese).Morris, J.R., 1992. Factors Affecting the Maturity Structure of Corporate Debt. Working Paper, University of Colorado at Denver.Myers, S., 1977. Determinants of corporate borrowing. Journal of Financial Economics 9, 147–176.Myers, S., 1984. The capital structure puzzle. Journal of Finance 39, 575–592.Myers, S., Majluf, N., 1984. Corporate financing and investment decisions when firms have information investors do not have. Journal of
Financial Economics 13, 187–221.Rajan, R.G., Zingales, L., 1995. What do we know about capital structure? Some evidence from international data. Journal of Finance 50
(5), 1421–1460.Rajan, R., Zingales, L., 1998. Financial dependence and growth. American Economic Review 88, 559–586.Scott, D., 1972. Evidence on the importance of financial structure. Financial Management 1, 45–50.Smith, C., 1977. Alternative methods for raising capital: rights versus underwritten offerings. Journal of Financial Economics 5, 273–307.Stohs, M.H., Mauer, D.C., 1996. The determinants of corporate debt maturity structure. Journal of Business 69, 279–312.Sun, Z., Liu, F.W., Li, Z.Q., 2005. Market development, government influence and corporate debt maturity structure. Economic Research
Journal 5, 52–63 (in Chinese).Titman, S., Wessels, R., 1988. The determinants of capital structure choice. Journal of Finance 43, 1–19.Williamson, Stephen D., 1986. Costly monitoring, financial intermediation, and equilibrium credit rationing. Journal of Monetary
Economics 18, 159–179.Wu, J., Bai, Y., 2009. The impact of China’s banking reform on the soft budget constraint of SOEs. China Financial Research 10, 180–
192.Xie, P., Lu, L., 2005. The Economic Analysis of Chinese Financial Corruption. Zhongxing Publisher.Xue, Y.K., Zhu, X.L., 2010. Institutional changes, earnings quality and debt contract empirical evidence from the Chinese banking system
reform. China Accounting and Finance Review 3, 57–106 (in Chinese).Zhang, M., Zhang, S., Sheng, H., Wang, C., 2010. Political connections and credit resource allocation efficiency. Management World 11,
143–153 (in Chinese).
Z. Xiuli et al. / China Journal of Accounting Research 5 (2012) 217–229 229


Internal corporate governance and the use of IPOover-financing: Evidence from China
Xin Xu a,⇑, Yun Xia b
a School of Accounting, Zhongnan University of Economics and Law, Chinab School of International Business, Jinan University, China
A R T I C L E I N F O
Article history:
Received 10 November 2011Accepted 29 August 2012Available online 29 September2012
JEL classification:
G10G31G38
Keywords:
Internal corporate governanceIPO over-financingOver-investmentNon-capital investment
A B S T R A C T
In this paper, we describe how Shenzhen A-share listed companies used fundsraised in over-financed IPOs during the 2006–2010 period. In exploring therelationship between internal corporate governance and the use of funds raisedin over-financed IPOs, we find that the use of such funds to engage in severeover-investment behavior is prevalent among listed companies. Reasonableinternal corporate governance mechanisms can effectively alleviate over-invest-ment problems listed companies encounter in using funds raised in over-financed IPOs. However, the same individual serving as both chairman andCEO leads to funds raised in over-financed IPOs being over-invested. More-over, executives driven by high levels of monetary compensation are morelikely to use funds raised in such IPOs to engage in over-investment. We findthat improving the balance of power between shareholders will help alleviatethe over-investment of excess IPO funds. In addition, the over-investmentproblem is less severe in state-controlled listed companies than in their non-state-controlled listed counterparts. This study provides policy recommenda-tions for Chinese securities regulators to ensure listed companies use fundsraised in over-financed IPOs both rationally and effectively.
� 2012 China Journal of Accounting Research. Founded by Sun Yat-senUniversity and City University of Hong Kong. Production and hosting by
Elsevier B.V. All rights reserved.
1755-3091/$ - see front matter � 2012 China Journal of Accounting Research. Founded by Sun Yat-sen University and City University of
Hong Kong. Production and hosting by Elsevier B.V. All rights reserved.
http://dx.doi.org/10.1016/j.cjar.2012.08.003
⇑ Corresponding author.E-mail address: [email protected] (X. Xu).
Production and hosting by Elsevier
China Journal of Accounting Research 5 (2012) 231–249
Contents lists available at SciVerse ScienceDirect
China Journal of Accounting Research
journal homepage: www.elsevier .com/locate /c jar

1. Introduction
Each year since its establishment in 1991, the Chinese capital market has hosted a considerable number ofnewly listed companies with over-financed IPOs, i.e. those where the amount of funds actually raised is greaterthan the size of the planned financing. As a phenomenon unique to China’s capital market, IPO over-financinghas become an important concern for the China Securities Regulatory Commission, China’s domestic finan-cial media and scholars alike. In addition, the frequent occurrence of over-financed IPOs in the newly estab-lished Growth Enterprises Market indicates that studying and resolving the IPO over-financing problem toenhance resource allocation efficiency in the Chinese capital market and maintain the healthy developmentof this new market is both important and urgent. Supervising and ensuring the rational use of funds listedcompanies raise in IPOs to protect the interests of general investors has recently become the focus of Chinesesecurities regulatory authorities.1 Existing research fails to provide a clear explanation of how listed companiesuse funds raised in over-financed IPOs after meeting their established financing needs, whether listed compa-nies misuse or waste such funds and whether they engage in over-investment and other types of behavioragainst the interests of investors when using the proceeds of over-subscribed IPOs. We consider these issuesimportant and address them in this paper.
The question of how to use funds raised in over-subscribed IPOs in a reasonable and effective manner notonly tests the business wisdom of listed company executives, but also examines their professional integrity. Weconsider that the use and investment of funds raised in over-financed IPOs among Chinese listed companiesprovide a natural setting for examining the relationship between internal corporate governance mechanismsand corporate investment decisions. It also provides a better environment for testing the effectiveness of inter-nal corporate governance. There are two main reasons for this. First, the use and investment of the fundsraised in over-financed IPOs more truly reflect the real motives of executives. The relevant provisions requirethat funds raised by a listed company through a public offering must be used for specific purposes in accor-dance with the applicable commitments in the prospectus.2 However, the use of excess funds raised in suchofferings is not subject to this rule. There is no commitment related to an established purpose and investmentplan for funds raised in excess of the IPO target, and no problem would arise even if the investments for whichsuch funds were used changed. Because excess funds raised in IPOs are essentially an extra source of financegiven to the company by its shareholders when the company goes public, shareholders do not immediatelyrequire cash dividends from such capital, which is akin to manna from heaven. Therefore, listed companiescan use this portion of additional funds as they wish. In addition, the huge amount of funds raised inover-financed IPOs also induces companies to engage in rapid investment and expansion. After meeting thefunding needs of the enterprise’s established investments, the listed company’s executives are more likely touse funds raised in an over-financed IPO to further their own interests because of agency problems. Hence,the use and investment of excess funds raised in over-financed IPOs are more reflective of the real motivesof executives. This provides us with a better opportunity to test the effect of internal corporate governance.
Second, analysis of the ways in which excess funds raised in over-financed IPOs are used may help us dis-tinguish between firms that engage in distinct forms of over-investment. The public financing of enterpriseinvestment projects is approved following rigorous discussion by the board of directors and at the sharehold-ers meeting. In addition, Chinese financings are currently managed through an examination and approval sys-tem. The use of project financing funds is subject to stringent scrutiny by the China Securities RegulatoryCommission (CSRC). Chinese enterprises are required to submit their prospectus to the issuance examinationcommittee of the CSRC during the listing process. Investment projects are the focus of scrutiny by the CSRCissuance examination committee. In accordance with relevant laws and regulations, such as the AdministrativeMeasures for Initial Public Offerings and Listings and the Interim Measures for the Administration of Initial
1 For example, the Shenzhen Stock Exchange issued the “Memorandum on information disclosure business in GEM No.1 – the use offunds raised in IPO over-financings” in 2009 in response to the frequent occurrence of IPO over-financing in the newly established GrowthEnterprises Market.
2 It is noteworthy that Chinese listed companies have frequently changed the investment projects to which they are committed andseriously undermined the interests of small shareholders when using money raised through public offerings (Wang et al., 2011; Zhang andZhai, 2005; Liu and Dai, 2004).
232 X. Xu, Y. Xia / China Journal of Accounting Research 5 (2012) 231–249

Public Offerings and Listings on the Growth Enterprises Market, funds raised should be used for the mainbusiness of the issuer and should be compatible with the issuer’s existing scale of production operations, finan-cial condition, level of technology and management capabilities, as well as being in line with laws, rules andregulations covering national industrial policy, investment management, environmental protection, land man-agement and other matters. If the funds raised are not used in compliance with the IPO conditions, the appli-cation of the company to go public will be rejected by the CSRC.3 Therefore, the IPO investment plan formedthrough the approval process should be relatively scientific and reasonable, and the size and purpose of IPOinvestment projects must comply with the requirements of appropriate regulations, as well as being closelyaligned to the company’s corporate investment and development needs over the next few years. However,if a listed company continues to use excess IPO funds to invest in projects outside the scope of the establishedinvestment plan, it is more likely to engage in over-investment, which will inevitably result in a decline in therate of return on investment, thus providing us with a good opportunity to explore whether internal gover-nance inhibits corporate over-investment.
We make a number of theoretical contributions to the literature in this paper. First, by targeting the IPOover-financing phenomenon unique to the emerging capital market of China, we explore agency problemsexperienced by listed companies using funds raised in over-financed IPOs. We find that most listed companiesengage in severe over-investment when using excess IPO funds. This finding complements and expands freecash flow theory in the corporate finance literature. Second, listed companies with good internal corporategovernance can effectively alleviate the over-investment problem, reduce over-investment in the use of fundsraised in over-financed IPOs, and improve the efficiency with which such funds are used. This conclusion notonly adds to our understanding of the role of corporate governance and expands our conception of the partplayed by corporate governance in emerging capital markets and improving investment efficiency, but alsoprovides a basis for corresponding policy recommendations for Chinese securities regulators to ensure listedcompanies use funds raised in over-financed IPOs in a rational manner. Third, we extend the line of researchexamining how listed companies use and invest funds raised through public offerings. Previous studies of thedomestic market in China show listed companies frequently change the investment projects to which they arecommitted and seriously undermine the interests of small shareholders in their use of money raised throughpublic offerings. This type of behavior also occurs in the use of funds raised in over-financed IPOs, suggestingthe use and investment of funds raised through public offerings must be closely governed.
The remainder of this paper is organized as follows. In Section 2, we outline our theoretical analysis anddevelop our hypotheses. Section 3 presents the research design and Section 4 provides the test results andempirical analysis. Additional checks are discussed in Section 5. Section 6 concludes the paper.
2. Theoretical analysis and hypotheses
The main function of the capital market is to optimize resource allocation and distribute funds among high-quality corporations requiring funds for development. However, the over-allocation of funds to good enter-prises will also result in a low level of resource allocation efficiency in the capital market. Consequently, theover-financing of an enterprise implies the reduction and disappearance of financing opportunities for otherenterprises that urgently need funding (Jiang and Li, 2010; Fang and Fang, 2010). The essence of the IPOover-financing phenomenon is the mismatch of resources in the Chinese capital market, reflecting its imper-fections and poor investment channels. It is impossible to completely eliminate the over-financing problemin the short term without establishing efficient investment channels in China. Therefore, establishing a soundinternal corporate governance mechanism is an effective way for listed companies to supervise and ensure therational and proper use of funds raised in over-financed IPOs.
We have not yet established a clear picture of how Chinese listed companies make use of the funds theyraise in over-financed IPOs or whether they act against the interests of investors in using such funds, whichis one focus of this study. Agency theory indicates that due to the separation of ownership and management,
3 For example, Shanghai Chaori Solar Energy Science & Technology Co., Ltd. and Beijing Fuxing Xiaocheng Electronic TechnologyStock Co., Ltd. both had their IPO applications rejected by the CSRC in recent years because their use of the funds raised did not complywith the IPO conditions.
X. Xu, Y. Xia / China Journal of Accounting Research 5 (2012) 231–249 233

managers of modern enterprises will deviate from the interests of shareholders and engage in self-serving prac-tices. Managers of enterprises with substantial free cash flows tend to become involved in activities contrary tothe interests of shareholders, such as awarding themselves perks, over-investment and empire building (Jensenand Meckling, 1976; Jensen, 1986). Jensen (1986) found that in the late 1970s and early 1980s, the excess-capacity US oil and tobacco industries became involved in over-investment due to agency problems, blindlyexpanding the scope of their business and affecting the interests of investors instead of returning surplus cashflows to them via cash dividends. Lamont (1997) and Ghose (2005) come to similar conclusions in later stud-ies. Focusing on US oil companies, they find the level of over-investment is directly related to the amount ofcash available to managers. Therefore, enterprises need a corresponding internal governance mechanism toalign the interests of managers and shareholders, to supervise and motivate managers and to reduce princi-pal-agent costs (Jensen and Meckling, 1976; Eisenhardt, 1988; Shleifer and Vishny, 1997).
We consider that given China’s status as an emerging economy, the IPO over-financing phenomenonunique to the Chinese capital market has some similarities to the free cash flow problem of Jensen (1986).4
Where basic financing needs are satisfied, listed companies with excess IPO funds provided by investors aremore likely to engage in over-investment and misuse or waste such funds because of agency problems, therebyresulting in the inefficient use of enterprise funds and damaging the interests of shareholders. Chinese listedcompanies that raise excess funds in IPOs currently provide a natural population for examining the relation-ship between internal corporate governance mechanisms and corporate investment decisions, and for testingthe effectiveness of internal corporate governance in a more rigorous fashion. The use and investment of fundsraised in over-financed IPOs more truly reflect the real motives of executives. Excess IPO funds are not subjectto any commitment related to an established purpose and investment plans, and no problem would arise evenif the projects in which such funds were invested changed. Therefore, listed companies can use this source ofadditional funds as they please. After meeting the funding needs of the enterprise’s established investments,the listed company’s executives are more likely to use IPO funds left over to further their own interests becauseof agency problems. In addition, the huge amount of funds raised in over-financed IPOs will also induce com-panies to engage rapidly in investment and expansion. A typical case is that of the company Beijing Lier High-Temperature Materials Co., Ltd. (002392)5 listed on the Shenzhen SME Board. In circumstances where theindustry was contracting and there were a lack of good investment opportunities, Beijing Lier misused thefunds it raised and embarked on a counter-cyclical expansion program in September 2010, blindly investingin a technology line that had been taken out of production and seriously damaging the interests of investorsas a result.
Jensen (1993) argues that managers generally have an impulse to over-invest because they can obtain moreprivate benefits by controlling more resources such as perks, which are often positively related to the size of thecompany, and that managers have the motivation to expand the scale of business investments. Jensen andMeckling (1976) considered that giving managers corresponding incentives to reduce their opportunisticbehavior can reduce agency conflicts to realize the maximization of enterprise value. Morck et al. (1988) findthat self-serving managers who hold fewer shares in the company will exacerbate conflicts of interest between
4 Although the IPO over-financing phenomenon unique to the Chinese capital market has some similarities to the free cash flow problemreferred to by Jensen, there are some major differences between them. First, excess funds raised in IPOs and free cash flows come fromdifferent sources. Free cash flows are generated by corporations which have survived for a long time and are the result of many years ofproduction and operation. However, this is not the case for excess funds raised in IPOs, as they are not generated by the corporation’sproduction and operating activities. Excess funds raised in an IPO are essentially an extra portion of capital given to the company by itsshareholders when the company goes public, and is akin to manna from heaven. Second, whether excess IPO funds and free cash flowsshould be paid back to shareholders through cash dividends involves different considerations for these two sources of funds. Excess IPOfunds are an extra portion of capital given to the company by its shareholders, who require no immediate cash dividends in return.However, this is not the case for free cash flow. Jensen (1986) argued that free cash flow should be returned to shareholders as soon aspossible in the form of cash dividends to reduce agency problems such as empire building, diversification and mergers and acquisitions.Third, while excess IPO funds are easily identified, this is not so for free cash flow. Although Jensen (1986) clearly defines free cash flow ascash flow in excess of that required to fund all projects that have positive net present values when discounted at the cost of capital, thisdefinition cannot be implemented in practice because outsiders have no way of knowing which of the enterprise’s investment projects havea positive NPV. Therefore, it is difficult to judge whether an enterprise has free cash flow, and if so, the amount of free cash flow. However,funds raised in over-financed IPOs are easy to recognize.
5 This information is sourced from www.wlstock.com (http://hudong.wlstock.com/StockBar/d7934732.aspx).
234 X. Xu, Y. Xia / China Journal of Accounting Research 5 (2012) 231–249

managers and outside shareholders. With higher managerial ownership, managers have a greater share ofresidual income, thus incentivizing them to focus on the long-term performance of the enterprise and exertinga convergence effect. Hall and Liebman (1998) point out in a study of US listed companies that in comparisonwith wages, bonuses and other forms of compensation, equity incentives are an effective incentive tool. There-fore, managerial ownership can reduce the conflict between the interests of shareholders and effectively reduceagency costs. Subsequent research has also shown that equity incentives can improve the efficiency of invest-ment, inhibit managers from engaging in myopic behavior (Balkin et al., 2000; Tang et al., 2011) and reduceover-investment (Broussard et al., 2004).
Studies based on China’s domestic market have found that managers of listed companies also have a ten-dency to over-invest and that this kind of over-investment leads to less efficient investments that damage firmvalue (Wei and Liu, 2007). Given the lack of financing constraints and securities market mechanisms in Chi-na’s capital market as the country goes through a period of economic transition, listed companies lack con-straints on their integrity (Liu and Dai, 2004). Moreover, information asymmetry in investment projectsexacerbates opportunistic behavior among managers and promotes their misuse of funds raised in over-financed IPOs to engage in over-investment. As yet, we lack a clear understanding of whether managersgranted stock option incentives use excess funds raised in IPOs in a reasonable and effective manner basedon the investment opportunities available. Therefore, we propose Hypothesis 1 as follows:
Hypothesis 1. The higher the proportion of equity incentives granted to executives, the greater the extent towhich they alleviate the over-investment of funds raised in over-financed IPOs.
Jensen and Murphy (1990) argue that a well-designed compensation contract is an important mechanismenabling the company to converge the interests of managers and shareholders. Enterprises motivate executivesin various ways. One of the methods most commonly adopted is monetary compensation contracts. Monetarycompensation contracts set out how much the enterprise may pay an executive during the contract period(Chen et al., 2010). Compensation contracts that do not incentivize managers to work hard and compensatethem for doing so are likely to cause opportunistic behavior among managers. In comparison with equityincentives, monetary rewards exert an incentive effect within a short period and tie compensation more closelyto the current efforts of managers.
Studies conducted to date are not unanimous on whether monetary compensation plays a role in inspiringthe managers of Chinese enterprises. Wei (2000) and Li (2000) find that monetary compensation paid to man-agers does not play an incentivizing role in China, showing the performance of Chinese listed companies is notpositively related to managers’ annual pay. However, the empirical evidence of Liu et al. (2003) and Zhanget al. (2003) shows that monetary rewards have an incentivizing effect to some degree, demonstrating firm per-formance has a significant positive relationship with monetary rewards paid to managers. However, the effectof managerial monetary compensation on over-investment among enterprises remains an untested empiricalquestion.
Xin et al. (2007) point out that managers who can obtain large private benefits from corporate investmentprojects are more likely to accept investment projects with a negative net present value and that setting mon-etary compensation too low will cause managers to engage in over-investment, thereby seriously damaging thewealth of shareholders. Executives with higher monetary rewards are likely to engage in myopic behaviorbecause they are insufficiently incentivized and have a greater likelihood of directly misusing excess fundsraised in IPOs to over-invest and obtain private benefits. Based on this discussion, we propose Hypothesis2 as follows:
Hypothesis 2. The greater the monetary rewards paid to executives, the more likely they use funds raised inover-financed IPOs to engage in over-investment.
Jensen (1993) argues that the function of the chairman is to run board meetings and oversee the process ofhiring, firing, evaluating and compensating the CEO. Clearly, the CEO cannot perform this function in iso-lation from their personal interest. Without the direction of an independent leader, it is much more difficultfor the board to perform its critical functions. Therefore, the corresponding internal control systems of theenterprise will be ineffective. Fama and Jensen (1983) and Jensen (1993) argue that the separation of the chair-
X. Xu, Y. Xia / China Journal of Accounting Research 5 (2012) 231–249 235

man and CEO roles allows the board to monitor the CEO more effectively, thus reducing agency costs,whereas having the CEO also serve as chairman of the board may result in higher agency costs. Based on thisdiscussion, we propose Hypothesis 3 as follows:
Hypothesis 3. CEO duality leads to the over-investment of funds raised in over-financed IPOs.
Cronqvist and Fahlenbrach (2009) find that the largest shareholder has an influence on investment, financ-ing, executive compensation and other company policies. Using a theoretical model, Shleifer and Vishny(1986) point out that the existence of large shareholders and concentrated ownership can reduce managers’opportunistic behavior, can partially solve the free-rider problem of small and medium-sized shareholders,and can alleviate agency conflicts between shareholders and managers. However, Shleifer and Vishny(1997) argue that most agency costs in some emerging countries come from conflicts of interest between con-trolling shareholders and small shareholders rather than from conflicts of interest between managers and dis-persed shareholders.
Based on their investigation of the phenomenon whereby Chinese listed companies frequently change theprojects to which money raised through public offerings is committed, Zhang and Zhai (2005) show that theprobability and degree of these changes is significantly negatively related to ownership concentration. Thismeans that large shareholders of listed companies in China determine how the interests of small shareholdersare served by controlling how funds raised are used. In addition, Chen and Chen (2005) find that the use ofIPO proceeds was influenced by the agency problems of large shareholders and that the largest shareholdercontrolled the proceeds of listed company IPOs. Therefore, governance mechanisms are needed to curb thebehavior of large shareholders and prevent them from acting against the interests of small shareholders.
The theoretical literature suggests that balanced ownership is an effective internal corporate governancemechanism and that ownership checks and balances can to some extent inhibit large shareholders from actingagainst the interests of small shareholders and improve firm performance (Shleifer and Vishny, 1986; La Portaet al., 1999). If the company has more than one large shareholder, the behavior of the largest shareholder canbe restricted and the interests of other shareholders can be upheld. Due to the improvement brought about bybalanced ownership, checks and balances between multiple large shareholders can limit the misappropriationof private benefits of control (Zhu and Wang, 2004; Tu and Liu, 2010) and increase the time and energy direc-ted toward the supervision of managers so they dare not over-invest. Based on the above theoretical predic-tions, mutual checks and balances among the largest shareholders to some extent influence the use andinvestment of funds raised in IPOs. However, empirical evidence pointing to whether such checks and balancesbetween large shareholders can inhibit the misuse of excess IPO funds to engage in over-investment is stilllacking. Based on this discussion, we propose Hypothesis 4 as follows:
Hypothesis 4. The more even the balance of power between shareholders, the greater the extent to which theyalleviate the over-investment of funds raised in over-financed IPOs.
3. Research design
3.1. Sample selection and data sources
Since 2005, the Chinese capital market has experienced the split-share structure reform, the implementationof an IPO inquiry system and the promulgation of provisions on the use of funds raised by listed companies.Given this background, we select as the sample for this study companies listed on the A-share section of theShenzhen Stock Exchange that launched over-financed IPOs in the 2006–2010 period. The first reason weconsider the Shenzhen market only is that only 31 companies listed on the Shanghai Stock Exchange hadover-subscribed IPOs in the same period and no specific disclosures on the use of excess funds raised by suchcompanies can be found. The second reason is that the listing rules and information disclosure system of theShenzhen Stock Exchange are stricter than those of its Shanghai counterpart and information disclosed on theuse of excess funds raised by Shenzhen listed companies is more complete. A total of 542 Shenzhen-listed com-panies launched over-financed IPOs in the 2006–2010 period, of which 170 did not make disclosures on theiruse of excess funds. After excluding missing data, we have a final sample comprising 372 firm-year
236 X. Xu, Y. Xia / China Journal of Accounting Research 5 (2012) 231–249

observations. Among these observations, 27, 30, 21, 56 and 238 are for each of the years from 2006 to 2010respectively. Financial and corporate governance data are obtained from the China Stock Market andAccounting Research (CSMAR) Database.
3.2. The use and investment of funds raised in over-financed IPOs
Data regarding the use and investment of funds raised in over-financed IPOs are drawn from “Assurancereports on the annual use and storage of raised funds”, “Independent opinions of independent directors on theplan to use excess funds raised”, “Announcements on the use of some of the funds raised in over-financedIPOs to repay bank loans and add liquidity” and other publicly available information. We manually collectdata on the use of funds raised in over-financed IPOs. Funds raised in over-financed IPOs are invested forpurposes including the following: add liquidity, set up subsidiaries, mergers and acquisitions, purchase plant,construct self-built buildings and plant, purchase land and real estate, purchase office space, pay back bankloans, investment in subsidiaries, investment projects and construction projects, capital increase, overseasinvestment, deposit in dedicated account, working capital related to the main business, advertising, marketingservices network construction, expansion of headquarters R&D center, investment in the main business andnot disclosed.
According to the relevant requirements of the “Memorandum on information disclosure business of GEMNo. 1 – the use of funds raised in over-financed IPOs” promulgated by the Shenzhen Stock Exchange: (1)funds raised in over-financed IPOs should be deposited in a dedicated account; (2) funds raised in over-financed IPOs should be used for the main business of the company and should not be used for securitiesinvestment, trust management, derivatives investment, venture capital or other high-risk investments, or toprovide financial assistance to others; (3) the amount of funds raised in an over-financed IPO to permanentlyadd liquidity and repay bank loans should not exceed 20% of the total amount of funds raised every12 months; and (4) the use of funds raised in an over-financed IPO to temporarily add liquidity is to beregarded as the same as using idle funds raised funds to temporarily add liquidity. Therefore, adding liquidity,paying back bank loans, making deposits in a dedicated account and other working capital accounts related tothe main business are classified as non-capital investments. That is, they constitute projects that only maintainvalue and cannot add value, while other projects are classified as capital investments.
3.3. Model specification and variable definitions
In this paper, we study the effect of executive ownership incentives, monetary compensation paid to exec-utives, CEO duality and the balance of power between shareholders on the over-investment of funds raised inover-financed IPOs. We follow prior literature in selecting the corresponding control variables. Based on dataon Chinese listed companies, Wei and Liu (2007) find that the better the firm performs and the stronger itsprofitability (EPS), the greater the possibility of over-investment. In addition, investment opportunities(Tobin’s q) have a far-reaching influence on the investment behavior of enterprises (Broussard et al., 2004;Richardson, 2006; Wei and Liu, 2007; Xin et al., 2007; Tang et al., 2010). Previous studies point out that cor-porate over-investment is related to ineffective corporate governance (Wei and Liu, 2007; Xin et al., 2007). Yuet al. (2010) and Qin (2010) further find that independent directors can play a supervisory role to a certainextent and that the higher the proportion of independent directors, the more the board can inhibit over-invest-ment. However, the empirical evidence of Luo et al. (2012), Tang et al. (2010) and Liu (2006) shows that Chi-nese independent directors do not yet play a significant role in the restraint of corporate over-investment.Although some studies point out that a reasonable board size is an assurance that the enterprise is highly effi-cient (Yermack, 1996), there is no unanimous conclusion on the relationship between board size and corporateover-investment in China. Qin (2010) finds that board size is significantly negatively correlated with over-investment. However, Luo et al. (2012) point out there is no clear relationship between them. Other studiesdemonstrate that in comparison with private enterprises, state-owned enterprises engage in more seriousover-investment (Yu et al., 2010; Qin, 2010; Luo et al., 2012). Therefore, we select as our control variablesthe investment opportunities of the firm (Tobin’s q), firm performance (EPS), nature of the controlling owner(Control), proportion of independent directors (Dirp), board size (Dirsize), year effects (Year) and industry
X. Xu, Y. Xia / China Journal of Accounting Research 5 (2012) 231–249 237

effects (Industry), and build the following model. The definitions of the main variables are presented inTable 1.
OItþ1 ¼ a0 þ a1Stockt þ a2Lpayt þ a3Dualt þ a4Dirpt þ a5Dirsizet þ a6Zt þ a7Epst þ a8Controlt
þXm
i¼1
a8þiYear þXn
i¼1
a8þmþiIndustry þ e
OF tþ1 ¼ a0 þ a1Stockt þ a2Lpayt þ a3Dualt þ a4Dirpt þ a5Dirsizet þ a6Zt þ a7Epst þ a8Controlt
þXm
i¼1
a8þiYear þXn
i¼1
a8þmþiIndustry þ e
The empirical logic we follow in this paper includes the following three steps: first, if the company usesexcess IPO funds for non-capital investment projects, its retention of idle funds means it is more likely to waitfor better investment opportunities in the future and participate in investment projects with an NPV greaterthan zero. It can maintain the value of the funds raised while holding them in custody and at least help alle-viate the agency problems it faces. Second, if the enterprise uses funds raised in an over-financed IPO for cap-ital investments, we need to undertake a specific analysis of whether such capital investments constitute over-investment. The key measure of over-investment is to investigate the investment purposes of the enterprise’scapital investments. We use investment opportunities to determine whether a capital investment representsover-investment. If the enterprise has good investment opportunities in comparison with those available inits industry and uses excess IPO funds to make investments that maintain and add value, such capital invest-ments do not constitute over-investment. In contrast, if the enterprise does not have good investment oppor-tunities relative to those in its industry and uses excess IPO funds to make investments, the capital investmentsrepresent over-investment increasing the agency costs of the enterprise. Third, we investigate what internalcorporate governance mechanisms are effective in suppressing over-investment in capital projects.
4. Empirical results
4.1. Descriptive statistics
Table 2 shows that the average proportion of sample companies that use funds raised in over-financed IPOsfor capital investments (RI) is 0.3631. In addition, the descriptive statistics in Table 3 indicate that the pro-portion of sample companies that use excess IPO funds to add liquidity, make deposits in dedicated accountsor participate in other non-capital investment projects is 46.49%, with the remaining 53.51% using such fundsfor capital investment projects. As much as 54.84% of all non-capital investment projects are used to addliquidity, with 44.89% being used to pay back bank loans. The largest category of capital investments is invest-ment projects and construction projects, accounting for 56.10%, followed by mergers and acquisitions(15.12%), setting up subsidiaries (11.68%) and investment in subsidiaries (10.67%). It should be noted that170 listed companies did not disclose any details of their investment of excess IPO funds.
We further analyze how Shenzhen A-share listed companies have used funds raised in over-financed IPOsby year. Table 4 reports the corresponding data. We find that the number of listed companies raising excessfunds in IPOs is small for the 2006–2008 period. Even listed companies that raised funds in over-financed IPOsused such funds to add liquidity and rarely made capital investments in any form. However, in 2009 and 2010,listed companies used excess IPO funds for various forms of capital investment, indicating agency problemsbecame increasingly serious in the Chinese capital market in those two years. In our view, the major reasonmay be that the Chinese government has since 2008 put 4 trillion yuan into the market to expand domesticdemand and stimulate economic growth. Thus, the over-investment problem is becoming more serious underthe influence of excess liquidity.
Table 5 shows that in comparison with state-owned enterprises, non-state-owned enterprises are more likelyto make capital investments. In addition, state-controlled listed companies tend to concentrate their capitalinvestments in investment projects and construction projects, mergers and acquisitions and setting up subsidi-aries, having no involvement in the other categories of capital investment. However, non-state-controlled
238 X. Xu, Y. Xia / China Journal of Accounting Research 5 (2012) 231–249

listed companies make capital investments in various forms. These results indicate that non-state-owned enter-prises are more likely to use funds raised in over-financed IPOs to make capital investments than their state-owned counterparts.
4.2. Univariate analysis
In accordance with the hypotheses stated above, we use Tobin’s q to measure investment opportunities andto divide the sample into two sub-groups. One sub-group consists of firms with a Tobin’s q greater than theindustry average, with the other sub-group comprising firms with a Tobin’s q less than the industry average.Our logic outlined above suggests that if a company uses funds raised in an over-financed IPO for projectswith good investment opportunities (Tobin’s q > industry average), it does not engage in over-investmentand alleviates the agency problems of the enterprise. Otherwise, it engages in over-investment and exacerbatesthe agency problems of the enterprise. Panel A of Table 6 shows that in capital investments (RI or RF), the
Table 1Definitions of variables.
Variable Symbol Definition
Dependentvariables
Capital investment RI Capital investment of funds raised in over-financed IPO of listed company/(capital investment of funds raised in over-financed IPO + non-capitalinvestment of funds raised in over-financed IPO)
OI Over-investment proportion of funds raised in over-financed IPO, that is,OI = capital investment of funds raised in over-financed IPO of listedcompany/(capital investment of funds raised in over-financed IPO + non-capital investment of funds raised in over-financed IPO) when Tobin’sq < industry average value or Ppa < industry average value
RF Capital investment of funds raised in over-financed IPO of listed company/total assets at year-end
OF Over-investment proportion of funds raised in over-financed IPO, that is,OF = capital investment of funds raised in over-financed IPO of listedcompany � 100/total assets at year-end when Tobin’s q < industry averagevalue or Ppa < industry average value
Return on long-term capital ROLC ROLC = (total profit + financial expenses)/long-term capital = 2 (totalprofit + financial expenses)/(long-term liabilities at beginning of year + long-term liabilities at year-end) + (equity at beginning of year + equity at year-end)
Explanatoryvariables
Equity incentives of executives Stock Stock ownership of executivesAmount of monetarycompensation paid toexecutives
Lpay Natural logarithm of maximum amount of top three executives’compensation
CEO duality Dual Dummy variable equal to 1 for CEO duality and 0 otherwiseBalance of power betweenshareholders
Z Ownership of largest shareholder/ownership of second largest shareholder
Controlvariables
Proportion of independentdirectors
Dirp Number of independent directors/number of members of the board ofdirectors
Board size Dirsize Total number of members of the board of directorsInvestment opportunities offirm
Tobin’sq
Tobin’s q = firm’s market value/firm’s replacement cost = (number oftradable shares � this year’s closing price + non-tradable shares � book valueof net assets per share + book value of liabilities)/total assets at year-end
Ppa Ppa = firm’s market value/total assets at year-endFirm performance EPS Earnings per share, EPS = Net profit/total number of ordinary shares at
year-endNature of controlling owner Control A dummy variable equal to 1 for a state-owned listed company, 0 otherwiseIndustry effects Industry First-level industry classification according to the CSRC industry standard;
after removing the finance industry, we define 12 dummy variables for whichthe benchmark is M representing the comprehensive industry
Year effects Year We define 4 dummy variables, for which the benchmark year is 2006
X. Xu, Y. Xia / China Journal of Accounting Research 5 (2012) 231–249 239

number of sample firms with good investment opportunities is 149 and the number of sample firms with poorinvestment opportunities is 223, almost double that of the former. In addition, the mean t-value for the goodinvestment opportunities group is significantly lower than that of the poor investment opportunities group(the mean differences are �9.98% and �3.89e�06, significant at the 1% level). The results show that enterprisesdo not use excess IPO funds for projects with good investment opportunities and that more such funds areused for projects with poor investment opportunities. This indicates that Chinese listed companies oftenengage in severe over-investment behavior when using funds raised in over-financed IPOs.
We also conduct parametric tests (t-tests) on the state-owned enterprise and non-state-owned enterprise sub-samples respectively. Panel B of Table 6 reports the corresponding data. In Panel B, when capital investmentsare measured by RI, we find no significant differences between state-owned enterprises and non-state-ownedenterprises. However, when capital investments are measured by RF, there are significant differences betweenstate-owned enterprises and their non-state-owned counterparts. The mean value for state-owned enterprises islower than that for non-state-owned enterprises (the mean difference is �4.83e�06, significant at the 1% level).This indicates that the over-investment problem is less severe among state-controlled listed companies thanamong non-state-controlled listed companies. Wang and Zhou (2006) and Wang (2008) demonstrate thatbecause of their greater social and public responsibilities, state-owned companies more effectively protect theinterests of investors and thus have better firm performance. We believe that because managers of state-ownedenterprises are often appointed by the Chinese government, they are subject to government oversight and inter-vention and thus may behave in a manner consistent with the interests of investors and superior to that of themanagers of other companies, thereby reducing agency costs (Li, 2009). Therefore, the over-investment prob-lem is less acute in state-controlled listed companies than in their non-state-controlled listed counterparts.
We also undertake further parametric tests (t-tests) of state-owned enterprises and non-state-owned enter-prises, respectively, according to their investment opportunities (Tobin’s q). The corresponding results areshown in Panels C and D of Table 6. The results reported in Panel C show that most state-owned enterprisesare more likely to engage in projects with good investment opportunities. Moreover, when capital investmentsare measured by RF in Panel C, the mean value of good investment opportunities is significantly lower thanthat of poor investment opportunities (the mean difference is �4.15e�06, significant at the 5% level). This
Table 2Descriptive statistics.
Variable Mean Median SD Min Max N
RI 0.3631 0.1303 0.4054 0.0000 1.0000 372RF 7.27e�06 7.63e�07 1.31e�05 0.0000 1.13e�04 372OIa 0.4126 0.3972 0.3923 0.0000 1.0000 223OFb 8.43e�06 3.01e�06 1.29e�05 0.0000 0.0001 223OIc 0.2809 0.0000 0.3735 0.0000 1.0000 200OFd 4.88e�06 0.0000 9.61e�06 0.0000 6.31e�05 200Dirsize 8.7263 9.0000 1.6230 3.0000 18.0000 369Dirp 0.3649 0.3333 0.0506 0.2500 0.6667 369Stock 0.3461 0.3425 0.3113 0.0000 0.9969 372Lpay 14.48525 14.4702 0.6594 12.7195 16.5883 372Z 4.1020 2.4371 4.7494 1.0000 34.6150 372Control 0.1243 0.0000 0.3304 0.0000 1.0000 372Eps 0.7666 0.6400 0.4884 0.1100 4.4200 372Ppa 1.6132 1.5636 0.3341 0.9554 3.5671 372
a The over-investment proportion of funds raised in an over-financed IPO, that is, OI = capital investment of funds raised inover-financed IPO of listed company/(capital investment of funds raised in over-financed IPO + non-capital investment of funds raised inover-financed IPO) when Tobin’s q < industry average value.
b The over-investment proportion of funds raised in an over-financed IPO, that is, OF = capital investment of funds raised inover-financed IPO of listed company * 100/total assets at year-end when Tobin’s q < industry average value.
c The over-investment proportion of funds raised in an over-financed IPO, that is, OI = capital investment of funds raised inover-financed IPO of listed company/(capital investment of funds raised in over-financed IPO + non-capital investment of funds raised inover-financed IPO) when Ppa < industry average value.
d The over-investment proportion of funds raised in an over-financed IPO, that is, OF = capital investment of funds raised inover-financed IPO of listed company * 100/total assets at year-end when Ppa < industry average value.
240 X. Xu, Y. Xia / China Journal of Accounting Research 5 (2012) 231–249
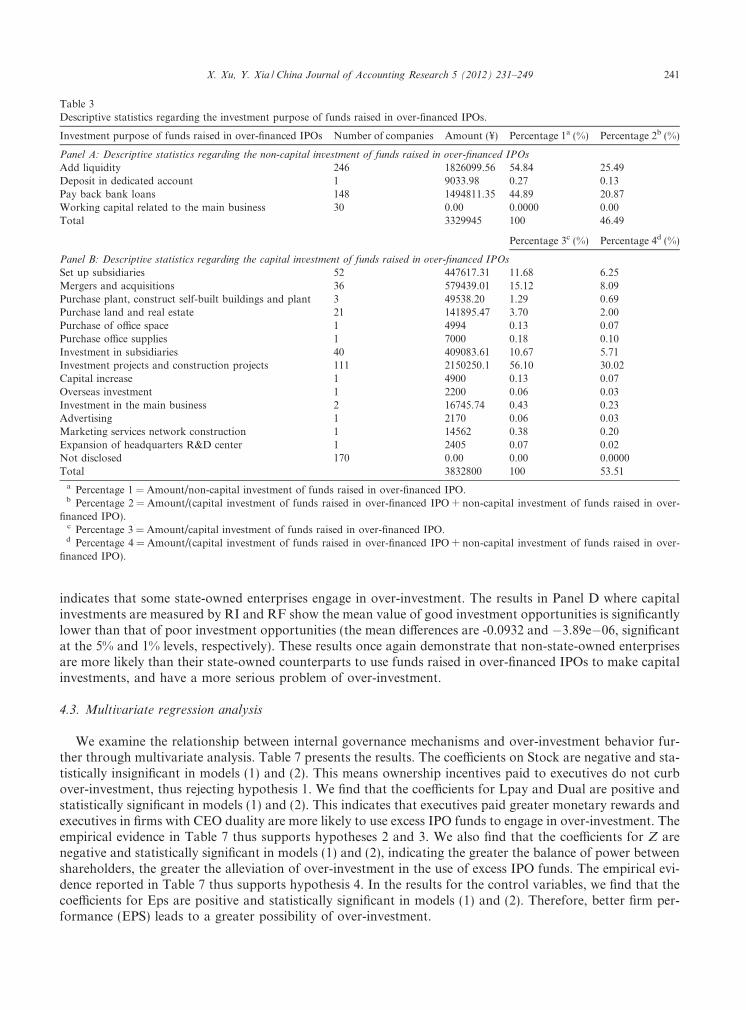
indicates that some state-owned enterprises engage in over-investment. The results in Panel D where capitalinvestments are measured by RI and RF show the mean value of good investment opportunities is significantlylower than that of poor investment opportunities (the mean differences are -0.0932 and �3.89e�06, significantat the 5% and 1% levels, respectively). These results once again demonstrate that non-state-owned enterprisesare more likely than their state-owned counterparts to use funds raised in over-financed IPOs to make capitalinvestments, and have a more serious problem of over-investment.
4.3. Multivariate regression analysis
We examine the relationship between internal governance mechanisms and over-investment behavior fur-ther through multivariate analysis. Table 7 presents the results. The coefficients on Stock are negative and sta-tistically insignificant in models (1) and (2). This means ownership incentives paid to executives do not curbover-investment, thus rejecting hypothesis 1. We find that the coefficients for Lpay and Dual are positive andstatistically significant in models (1) and (2). This indicates that executives paid greater monetary rewards andexecutives in firms with CEO duality are more likely to use excess IPO funds to engage in over-investment. Theempirical evidence in Table 7 thus supports hypotheses 2 and 3. We also find that the coefficients for Z arenegative and statistically significant in models (1) and (2), indicating the greater the balance of power betweenshareholders, the greater the alleviation of over-investment in the use of excess IPO funds. The empirical evi-dence reported in Table 7 thus supports hypothesis 4. In the results for the control variables, we find that thecoefficients for Eps are positive and statistically significant in models (1) and (2). Therefore, better firm per-formance (EPS) leads to a greater possibility of over-investment.
Table 3Descriptive statistics regarding the investment purpose of funds raised in over-financed IPOs.
Investment purpose of funds raised in over-financed IPOs Number of companies Amount (¥) Percentage 1a (%) Percentage 2b (%)
Panel A: Descriptive statistics regarding the non-capital investment of funds raised in over-financed IPOs
Add liquidity 246 1826099.56 54.84 25.49Deposit in dedicated account 1 9033.98 0.27 0.13Pay back bank loans 148 1494811.35 44.89 20.87Working capital related to the main business 30 0.00 0.0000 0.00Total 3329945 100 46.49
Percentage 3c (%) Percentage 4d (%)
Panel B: Descriptive statistics regarding the capital investment of funds raised in over-financed IPOs
Set up subsidiaries 52 447617.31 11.68 6.25Mergers and acquisitions 36 579439.01 15.12 8.09Purchase plant, construct self-built buildings and plant 3 49538.20 1.29 0.69Purchase land and real estate 21 141895.47 3.70 2.00Purchase of office space 1 4994 0.13 0.07Purchase office supplies 1 7000 0.18 0.10Investment in subsidiaries 40 409083.61 10.67 5.71Investment projects and construction projects 111 2150250.1 56.10 30.02Capital increase 1 4900 0.13 0.07Overseas investment 1 2200 0.06 0.03Investment in the main business 2 16745.74 0.43 0.23Advertising 1 2170 0.06 0.03Marketing services network construction 1 14562 0.38 0.20Expansion of headquarters R&D center 1 2405 0.07 0.02Not disclosed 170 0.00 0.00 0.0000Total 3832800 100 53.51
a Percentage 1 = Amount/non-capital investment of funds raised in over-financed IPO.b Percentage 2 = Amount/(capital investment of funds raised in over-financed IPO + non-capital investment of funds raised in over-
financed IPO).c Percentage 3 = Amount/capital investment of funds raised in over-financed IPO.d Percentage 4 = Amount/(capital investment of funds raised in over-financed IPO + non-capital investment of funds raised in over-
financed IPO).
X. Xu, Y. Xia / China Journal of Accounting Research 5 (2012) 231–249 241

Tab
le4
Des
crip
tive
stat
isti
csre
gard
ing
the
inve
stm
ent
pu
rpo
seo
ffu
nd
sra
ised
ino
ver-
fin
ance
dIP
Os
ann
ual
ly.
Inve
stm
ent
pu
rpo
seo
ffu
nd
sra
ised
ino
ver-
fin
ance
dIP
Os
2006
2007
2008
2009
2010
Am
ou
nt
(¥T
enth
ou
san
d)
Per
cen
tage
(%)
Am
ou
nt
(¥T
enth
ou
san
d)
Per
cen
tage
(%)
Am
ou
nt
(¥T
enth
ou
san
d)
Per
cen
tage
(%)
Am
ou
nt
(¥T
enth
ou
san
d)
Per
cen
tage
(%)
Am
ou
nt
(¥T
enth
ou
san
d)
Per
cen
tage
(%)
Ad
dli
qu
idit
y10
8574
.84
54.1
978
391.
4179
.67
5811
5.25
100
1724
19.1
017
.93
1408
598.
9623
.71
Dep
osi
tin
ded
icat
edac
cou
nt
00
00
00
00
9033
.98
0.15
21
Pay
bac
kb
ank
loan
s0
00
00
065
014.
216.
7614
2979
7.14
24.0
7W
ork
ing
cap
ital
rela
ted
toth
em
ain
bu
sin
ess
00
00
00
00
00
Set
up
sub
sid
iari
es0
020
000.
0020
.33
00
7900
28.
2134
8615
.35.
87M
erge
rsan
dac
qu
isit
ion
s61
896.
0030
.89
00
00
1353
01.4
314
.07
3822
41.5
86.
43
Pu
rch
ase
pla
nt,
con
stru
ctse
lf-b
uil
tb
uil
din
gsan
dp
lan
t
2987
8.20
14.9
20
00
015
160.
001.
5745
000.
08
Pu
rch
ase
lan
dan
dre
ales
tate
00
00
00
4250
0.85
4.42
9939
4.62
1.67
Pu
rch
ase
of
offi
cesp
ace
00
00
00
6501
4.21
6.75
4994
0.08
Pu
rch
ase
offi
cesu
pp
lies
00
00
00
3705
8.54
3.86
7000
.00
0.12
Inve
stm
ent
insu
bsi
dia
ries
00
00
00
3705
8.54
3.86
3711
25.0
76.
25
Inve
stm
ent
pro
ject
san
dco
nst
ruct
ion
pro
ject
s
00
00
00
3125
83.9
32.5
218
3766
6.18
30.9
3
Cap
ital
incr
ease
00
00
00
00
4900
0.08
Ove
rsea
sin
vest
men
t0
00
00
00
022
000.
04A
dve
rtis
ing
00
00
00
00
2170
0.04
Mar
ket
ing
serv
ices
net
wo
rkco
nst
ruct
ion
00
00
00
00
1456
20.
25
Exp
ansi
on
of
hea
dq
uar
ters
R&
Dce
nte
r
00
00
00
00
2405
.00
0.04
Inve
stm
ent
inth
em
ain
bu
sin
ess
00
00
00
4745
.735
0.5
1200
00.
19
No
td
iscl
ose
d0
00
00
00
00
0
242 X. Xu, Y. Xia / China Journal of Accounting Research 5 (2012) 231–249

We further investigate the influence of over-investment behavior among enterprises on future firm perfor-mance and report the results in Table 8. Over-investment (OI and OF) is significantly negatively related to thereturn on long-term capital, indicating the misuse of funds raised in over-financed IPOs significantly reducesthe company’s future investment yield, thus negatively affecting the firm’s performance in the future.
Table 5State-owned vs. non-state-owned enterprises: Descriptive statistics regarding the investment purpose of funds raised in over-financed IPOs.
Investment purpose of funds raised in over-financed IPOs
State-owned enterprises Non-state-owned enterprises
Amount (¥ Tenthousand)
Percentage(%)
Amount (¥ Tenthousand)
Percentage(%)
Add liquidity 251617.47 40.63 1566682.09 24.04Deposit in dedicated account 0 0 9033.98 0.14Pay back bank loans 57654.43 9.31 1431656.92 21.97Working capital related to the main business 0 0 0 0Set up subsidiaries 31031.00 5.01 415056.3 6.37Mergers and acquisitions 27670.00 4.47 550789.81 8.45Purchase plant, construct self-built buildings and
plant0 0 49538.20 0.76
Purchase land and real estate 7082.50 1.14 134812.97 2.07Purchase of office space 0 0 4994 0.08Purchase office supplies 0 0 7000 0.11Investment in subsidiaries 13481 2.18 395602.61 6.07Investment projects and construction projects 226019.48 36.50 1912706 29.35Capital increase 0 0 4900 0.08Overseas investment 0 0 2200 0.03Advertising 0 0 2170 0.03Marketing services network construction 0 0 14562 0.22Expansion of headquarters R&D center 0 0 2405.00 0.04Investment in the main business 4745.735 0.8 12000 0.18Not disclosed 0 0 0 0
Table 6Univariate analysis of capital investments.
Variable Mean (N) Mean difference test (t-value)
Tobin’s q > industry average Tobin’s q < industry average
Panel A: Full sample
RI 0.3231 (149) 0.4229 (223) �0.0998 (�2.3396***)RF 5.71e�06 (149) 9.60e�06 (223) �3.89e�06 (�2.8308***)
Mean (N)
State-owned enterprises Non-state-owned enterprises
Panel B: State-owned enterprises vs. non-state-owned enterprises
RI 0.3186 (46) 0.3686 (326) �0.0500 (�0.7806)RF 3.05e�06 (46) 7.88e�06 (326) �4.83e�06 (�2.3442***)
Mean (N)
Tobin’s q > industry average Tobin’s q < industry average
Panel C: State-owned enterprises
RI 0. 2573 (19) 0.4057 (27) �0.1484 (�1.1206)RF 1.34e�06 (19) 5.49e�06 (27) �4.15e�06 (�2.2927**)
Panel D: Non-state-owned enterprises
RI 0.3322 (130) 0. 4254 (196) �0.0932 (�2.0700**)RF 6.32e�06 (130) 1.02e�05 (196) �3.89e�06 (�2.5297***)
�Statistical significance at the 10% level for two-tailed tests.** Statistical significance at the 5% level for two-tailed tests.*** Statistical significance at the 1% level for two-tailed tests.
X. Xu, Y. Xia / China Journal of Accounting Research 5 (2012) 231–249 243

5. Robustness tests
5.1. Tests of corporate investment opportunities
We use the market to book value ratio (Ppa) as the proxy variable for corporate investment opportunitiesin conducting our robustness tests. We form a new sample of firms with a market to book value ratio higherthan the industry average (comprising 200 firm-year observations) to carry out parametric tests (t-tests). Thecorresponding results are shown in Tables 9–11. The results reported in Table 9 are consistent with those ofTable 6, indicating our earlier empirical results are robust. The results shown in Table 10 also remain consis-tent with those reported in Tables 7 and 11 results are consistent with the results of Table 8. Taken together,these results provide additional support for our hypotheses.
Table 7Regression results for internal corporate governance and the over-investment of funds raised in over-financed IPOs.
Variables Predicted sign OI (1) OF (2)
Coef. t-Value Coef. t-Value
Cons ? �0.164 �1.00 �2.45e�05 �1.45Stock � �1.18e�10 �1.42 �9.01e�06 �1.22Lpay + 0.058*** 4.14 3.33e�05*** 5.15Dual + 0.057** 2.53 1.09e�04** 2.38Dirp � �0.075 �0.69 �9.43e�03 �0.58Dirsize � �0.544 �0.82 �2.35e�04 �0.55Z � �0.004* �1.92 �2.45e�05*** �3.96Eps + 0.092*** 2.75 1.42e�04** 2.23Control � �0.399 �0.96 �2.24e�04 �0.78Year Yes YesIndustry Yes YesPseudo R2 0.0773 �0.0020N 222 222
We use clustering by years in the regression.* Statistical significance at the 10% level for two-tailed tests.** Statistical significance at the 5% level for two-tailed tests.*** Statistical significance at the 1% level for two-tailed tests.
Table 8Regression results for corporate over-investment and future return on investment.
Variables Predicted sign ROLC ROLC
Coef. t-Value Coef. t-Value
Cons ? 0.077 0.44 0.091 0.53OI � �0.001** �2.47OF � �571.09* �1.89Size + 0.005 0.63 0.005 0.57Lev + 0.032* 1.65 0.023 0.61Year Yes YesIndustry Yes YesF-statistics 2.03** 2.27***
Adj-R2 7.05% 8.57%N 222 222
We use OI and OF as proxy variables for over-investment when Tobin’s q < industry average.* Statistical significance at the 10% level for two-tailed tests.** Statistical significance at the 5% level for two-tailed tests.*** Statistical significance at the 1% level for two-tailed tests.
244 X. Xu, Y. Xia / China Journal of Accounting Research 5 (2012) 231–249

5.2. Tests of selection bias
If listed companies self-select in making disclosures on the use of funds raised in over-financed IPOs, themain regression results of this study may be subject to self-selection bias. Therefore, we also perform thefollowing robustness tests. We select as the sample Shenzhen A-share listed companies that launched over-financed IPOs in the 2006–2010 period. Since 2009, the Shenzhen Stock Exchange has required listed
Table 9Univariate analysis of capital investment (robustness tests).
Variable Mean (N) Mean difference test (t-value)
Ppa > industry average Ppa < industry average
Panel A: Full sample
RI 0.2964 (172) 0.4405 (200) �0.1441 (�3.4684***)RF 4.99e�06 (172) 9.92e�06 (200) �4.93e�06 (�3.6811***)
Mean (N)
State-owned enterprises Non-state-owned enterprises
Panel B: State-owned enterprises vs. non-state-owned enterprises
RI 0.3186 (46) 0.3686 (326) �0.0500 (�0.7806)RF 3.05e�06 (46) 7.88e�06 (326) �4.83e�06 (�2.3442***)
Mean (N)
Ppa > industry average Ppa < industry average
Panel C: State-owned enterprises
RI 0.2854 (17) 0.3753 (29) �0.0899 (�0.6593)RF 1.14e�06 (17) 6.31e�06 (29) �5.17e�06 (�2.8881***)
Panel D: Non-state-owned enterprises
RI 0.2983 (155) 0.4477 (171) �0.1494 (�3.4216***)RF 5.64e�06 (155) 1.03e�05 (171) �4.68e�06 (�3.1198***)
� Statistical significance at the 10% level for two-tailed tests.�� Statistical significance at the 5% level for two-tailed tests.*** Statistical significance at the 1% level for two-tailed tests.
Table 10Regression results for internal corporate governance and over-investment of funds raised in over-financed IPOs (robustness tests).
Variables Predicted sign OI (1) OF (2)
Coef. t-Value Coef. t-Value
Cons ? �1.482* �1.77 �5.64e�04 �0.23Stock � �4.85e�10 �0.75 �3.22e�14 �0.16Lpay + 0.106*** 4.19 2.83e�05* 1.91Dual + 0.061*** 5.30 5.72e�05*** 3.30Dirp � �1.025 �0.47 �3.71e�04 �0.83Dirsize � �0.200 �0.42 �2.36e�05 �0.62Z � �0.010*** �3.94 �1.23e�05** �2.45Eps + 0.254*** 6.34 8.43e�05*** 4.87Control �0.100 �0.45 �3.00e�04 �1.23Year Yes YesIndustry Yes YesPseudo R2 0.1360 �0.0024N 200 200
We use clustering by years in the regression.* Statistical significance at the 10% level for two-tailed tests.** Statistical significance at the 5% level for two-tailed tests.*** Statistical significance at the 1% level for two-tailed tests.
X. Xu, Y. Xia / China Journal of Accounting Research 5 (2012) 231–249 245
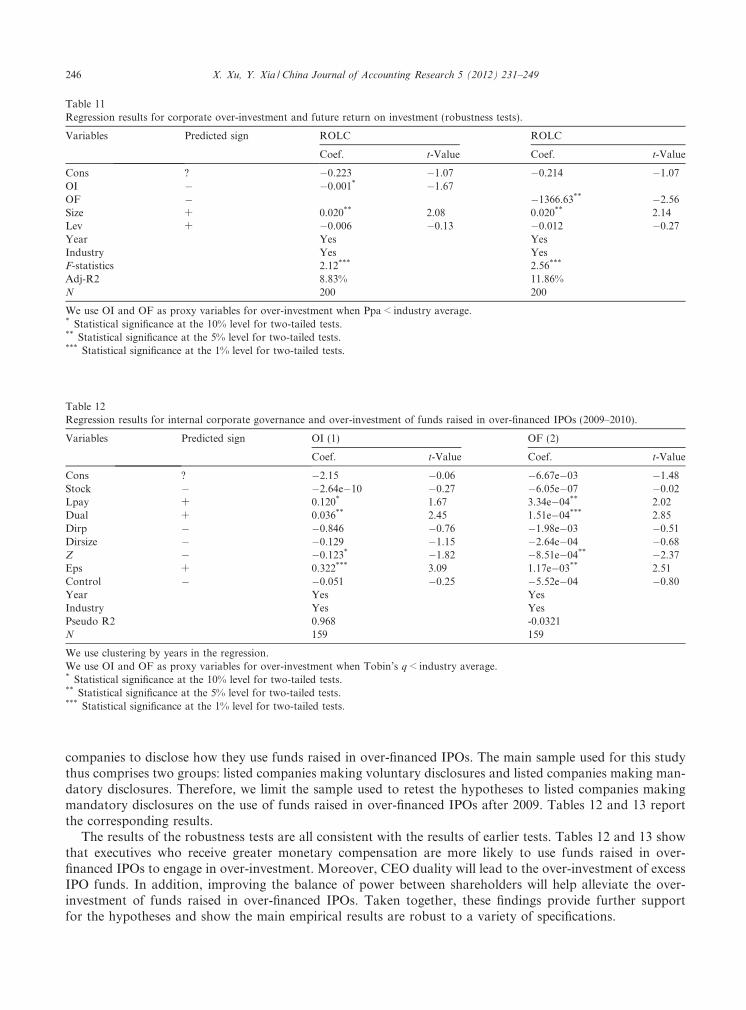
companies to disclose how they use funds raised in over-financed IPOs. The main sample used for this studythus comprises two groups: listed companies making voluntary disclosures and listed companies making man-datory disclosures. Therefore, we limit the sample used to retest the hypotheses to listed companies makingmandatory disclosures on the use of funds raised in over-financed IPOs after 2009. Tables 12 and 13 reportthe corresponding results.
The results of the robustness tests are all consistent with the results of earlier tests. Tables 12 and 13 showthat executives who receive greater monetary compensation are more likely to use funds raised in over-financed IPOs to engage in over-investment. Moreover, CEO duality will lead to the over-investment of excessIPO funds. In addition, improving the balance of power between shareholders will help alleviate the over-investment of funds raised in over-financed IPOs. Taken together, these findings provide further supportfor the hypotheses and show the main empirical results are robust to a variety of specifications.
Table 11Regression results for corporate over-investment and future return on investment (robustness tests).
Variables Predicted sign ROLC ROLC
Coef. t-Value Coef. t-Value
Cons ? �0.223 �1.07 �0.214 �1.07OI � �0.001* �1.67OF � �1366.63** �2.56Size + 0.020** 2.08 0.020** 2.14Lev + �0.006 �0.13 �0.012 �0.27Year Yes YesIndustry Yes YesF-statistics 2.12*** 2.56***
Adj-R2 8.83% 11.86%N 200 200
We use OI and OF as proxy variables for over-investment when Ppa < industry average.* Statistical significance at the 10% level for two-tailed tests.** Statistical significance at the 5% level for two-tailed tests.*** Statistical significance at the 1% level for two-tailed tests.
Table 12Regression results for internal corporate governance and over-investment of funds raised in over-financed IPOs (2009–2010).
Variables Predicted sign OI (1) OF (2)
Coef. t-Value Coef. t-Value
Cons ? �2.15 �0.06 �6.67e�03 �1.48Stock � �2.64e�10 �0.27 �6.05e�07 �0.02Lpay + 0.120* 1.67 3.34e�04** 2.02Dual + 0.036** 2.45 1.51e�04*** 2.85Dirp � �0.846 �0.76 �1.98e�03 �0.51Dirsize � �0.129 �1.15 �2.64e�04 �0.68Z � �0.123* �1.82 �8.51e�04** �2.37Eps + 0.322*** 3.09 1.17e�03** 2.51Control � �0.051 �0.25 �5.52e�04 �0.80Year Yes YesIndustry Yes YesPseudo R2 0.968 -0.0321N 159 159
We use clustering by years in the regression.We use OI and OF as proxy variables for over-investment when Tobin’s q < industry average.* Statistical significance at the 10% level for two-tailed tests.** Statistical significance at the 5% level for two-tailed tests.*** Statistical significance at the 1% level for two-tailed tests.
246 X. Xu, Y. Xia / China Journal of Accounting Research 5 (2012) 231–249

6. Conclusions and implications
As a phenomenon unique to China’s capital market, IPO over-financing has become an important concernfor the China Securities Regulatory Commission, China’s domestic financial media and scholars alike. Using asample of Shenzhen A-share listed companies that launched over-financed IPOs in the 2006–2010 period, weexplore the relationship between internal corporate governance and the use of funds raised in over-financedIPOs. The major findings are as follows.
First, due to agency problems, severe over-investment behavior is prevalent among listed companies thatraise excess funds in their IPOs. The major uses of funds raised in over-financed IPOs are construction pro-jects, mergers and acquisitions, and establishing and investing in subsidiary companies. In addition, over-investment behavior has a negative impact on the future performance of the enterprise and can significantlynegatively affect the long-term return on firm capital.
Second, internal corporate governance mechanisms can be effective in alleviating the over-investment offunds raised in over-financed IPOs of listed companies. Improving the balance of power between shareholderswill help alleviate the over-investment of funds raised in over-financed IPOs. However, CEO duality leads tothe over-investment of excess IPO funds. In addition, the greater the monetary rewards paid to executives, themore likely they will use funds raised in over-financed IPOs to engage in over-investment.
We also find that the over-investment problem encountered in the use of excess IPO funds is less commonamong state-controlled listed companies than it is among their non-state-controlled counterparts. When mak-ing capital investments, state-controlled listed companies tend to limit funding to construction projects, merg-ers and acquisitions, and establishing and investing in subsidiary companies. In contrast, non-state-controlledlisted companies participate in various forms of capital investment.
Our study raises a number of implications for researchers, managers and regulators. First, the GrowthEnterprises Market (GEM) complements and improves the existing Chinese capital market system. TheGEM helps accelerate the growth of innovative high-tech enterprises, adjust the structure of Chinese industry,transform and upgrade Chinese small and medium enterprises, and strengthen the international competitive-ness of Chinese firms. Although the IPO over-financing phenomenon currently seen in the GEM is the resultof market choice, this not only goes against the original purpose of setting up the GEM, but also poses a majorchallenge to the stable and healthy development of the Chinese capital market. Therefore, GEM systemsrequire further improvement, such as by regulating IPO pricing, reducing the IPO threshold and establishingan exit mechanism to raise the standard of supervision of the use of funds raised in over-financed IPOs.
Table 13Regression results for internal corporate governance and over-investment of funds raised in over-financed IPOs (2009–2010).
Variables Predicted sign OI (1) OF (2)
Coef. t-Value Coef. t-Value
Cons ? �2.845 �0.95 �1.77e�04 �1.36Stock � �1.84e�09 �0.57 �2.04e�13 �0.76Lpay + 0.083* 1.71 1.04e�04* 1.78Dual + 0.042** 2.25 5.32e�04* 1.74Dirp � �1.795 �0.43 �2.57e�03 �0.68Dirsize � �0.052 �0.29 �3.89e�06 �0.34Z � �0.034** �2.26 �8.22e�05** �1.87Eps + 0.184* 1.97 5.67e�04** 1.84Control �0.045 �0.90 �5.29e�03 �1.12Year Yes YesIndustry Yes YesPseudo R2 �0.0067 �0.0114N 161 161
We use clustering by years in the regression.We use OI and OF as proxy variables for over-investment when Ppa < industry average.��� Statistical significance at the 1% level for two-tailed tests.* Statistical significance at the 10% level for two-tailed tests.** Statistical significance at the 5% level for two-tailed tests.
X. Xu, Y. Xia / China Journal of Accounting Research 5 (2012) 231–249 247

Second, good internal corporate governance of listed companies can effectively alleviate the over-investmentproblem encountered in the use of excess IPO funds and improve the efficiency with which such funds are used.The corporate governance mechanisms of listed companies should thus be improved further to promote thesound operation of GEM companies. Third, this study highlights the need to take further steps to establishand improve China’s multi-level capital market system and widen the range of direct financing channels avail-able to enterprises, while continuing to broaden the investment channels open to residents and guiding thereasonable and orderly flow of funds.
Acknowledgements
The authors thank the anonymous referees and editor for their constructive suggestions. Any errors are thesole responsibility of the authors. We are grateful for support from the Fundamental Research Fund for theCentral Universities of the Chinese Ministry of Education (Grant Nos. 2012074 and 11JYB2014) and the Tal-ent Introduction Project of Zhongnan University of Economics and Law (Grant No. 31541111113). Thisstudy was supported by the Social Science Youth Fund of the Chinese Ministry of Education (Grant No.12YJC630241) and the Discipline Construction Special Fund of the Education Department of GuangdongProvince (Grant No. WYM11028).
References
Balkin, D.B., Markman, G.D., Gomez-Meijia, L.R., 2000. Is CEO pay in high-technology firms related to innovation? Academy ofManagement Journal 43 (6), 1118–1129.
Broussard, J.P., Buchenroth, S.A., Pilotte, E.A., 2004. CEO incentives, cash flow, and investment. Financial Management 33 (2), 51–70.Chen, W.B., Chen, X.Y., 2005. Large shareholders agency problem and the use of IPO proceeds. Nankai Business Review 3, 4–8 (in
Chinese).Chen, D.H., Liang, S.K., Jiang, D.Q., 2010. How marketization affects incentive contract costs and choices: perks and monetary
compensations. Accounting Research 11, 56–64 (in Chinese).Cronqvist, H., Fahlenbrach, R., 2009. Large shareholders and corporate policies. Review of Financial Studies 22 (10), 3941–3976.Eisenhardt, K.M., 1988. Agency-and institutional-theory explanations: the case of retail sales compensation. Academy of Management
Journal 31 (3), 488–511.Fama, E.F., Jensen, M.C., 1983. Separation of ownership and control. Journal of Law and Economics 26, 301–325.Fang, J.X., Fang, F., 2010. IPO market-oriented reform and the over financing. Securities Market Herald 12, 39–45 (in Chinese).Ghose, S., 2005. Corporate Governance and Over-investment by the US Oil Industry. Working Paper. SSRN.Hall, B.J., Liebman, J.B., 1998. Are CEOs really paid like bureaucrats? The Quarterly Journal of Economics 113 (3), 653–691.Jensen, M.C., 1986. Agency costs of free cash flow, corporate finance, and takeovers. American Economic Review 76, 323–329.Jensen, M.C., 1993. The modern industrial revolution, exit, and the failure of internal control systems. Journal of Finance 48, 831–880.Jensen, M.C., Meckling, W., 1976. Theory of the firm:managerial behavior, agency costs and capital structure. Journal of Financial
Economics 3 (4), 305–360.Jensen, M., Murphy, K., 1990. Performance compensation and top management incentives. Journal of Political Economy 98, 225–264.Jiang, X., Li, Q., 2010. Analysis of the over-financing phenomenon of the GEM. China Finance 2, 47–49 (in Chinese).La Porta, R., Lopez-de-Silanes, F., Shleifer, A., 1999. Corporate ownership around the world. Journal of Finance 54 (2), 471–517.Lamont, O., 1997. Cash flow and investment: evidence from internal capital markets. Journal of Finance 52, 83–109.Li, Z.Q., 2000. Incentive mechanism and firm performance: an empirical study based on listed companies. Accounting Research 11, 24–30
(in Chinese).Li, M.H., 2009. Ownership structure, corporate governance and agency cost of equity. Journal of Financial Research 2, 149–168 (in
Chinese).Liu, C.G., 2006. Corporate governance mechanisms, free cash flow and over-investment behavior among listed companies. Economic
Science 4, 50–58 (in Chinese).Liu, S.B., Dai, W.H., 2004. Research on change of committed investment project of listed company in China. Economic Research Journal
5, 88–97 (in Chinese).Liu, B., Liu, X., Li, S.X., Ho, S., 2003. An empirical study on the mutual effect between CEO’s pay and the firm’s performance.
Accounting Research 3, 35–39 (in Chinese).Luo, D.L., Ying, Q.W., Chang, L., 2012. The lines of credit, property and overinvestment: Evidences come from Chinese listed firms. The
Journal of World Economy 3, 48–67 (in Chinese).Morck, R., Shleifer, A., Vishny, R., 1988. Management ownership and market valuation: an empirical analysis. Journal of Financial
Economics 20, 293–315.Qin, J.Q., 2010. Strategy committee and overinvestment behavior of listed companies. Journal of Financial Research 6, 124–142 (in
Chinese).
248 X. Xu, Y. Xia / China Journal of Accounting Research 5 (2012) 231–249

Richardson, S., 2006. Over-investment of free cash flow. Review of Accounting Studies 11, 159–189.Shleifer, A., Vishny, R.W., 1986. Large shareholders and corporate control. Journal of Political Economy 94, 461–488.Shleifer, A., Vishny, R.W., 1997. A survey of corporate governance. Journal of Finance 52, 737–783.Tang, X.S., Zhou, X.S., Ma, R.J., 2010. Government intervention, GDP growth and local SOE overinvestment. Journal of Financial
Research 8, 33–48 (in Chinese).Tang, Q.Q., Xia, Y., Xu, X., 2011. The equity incentive of management and R&D investment: an endogenous perspective. China
Accounting Review 9 (1), 21–42 (in Chinese).Tu, G.Q., Liu, F., 2010. Activist shareholders’ character and surveillance effects. Management World 11, 132–142 (in Chinese).Wang, P., 2008. Investor protection, agency cost and corporate performance. Economic Research Journal 2, 68–82 (in Chinese).Wang, P., Zhou, L.A., 2006. Control right, ownership of large shareholder and corporate performance. Journal of Financial Research 2,
88–98 (in Chinese).Wang, M.B., Liu, S.S., Kong, D.M., 2011. Change of raised capital purpose, corporate governance, and firm performance. Studies of
International Finance 11, 75–86 (in Chinese).Wei, G., 2000. Incentives for top management and performance of listed companies. Economic Research Journal 3, 32–39 (in Chinese).Wei, M.H., Liu, J.H., 2007. Cash dividends, corporate governance and over-investment of SOEs. Management World 4, 88–95 (in
Chinese).Xin, Q.Q., Lin, B., Wang, Y.C., 2007. Government control, executive compensation and capital investment. Economic Research Journal
8, 110–122 (in Chinese).Yermack, D., 1996. Higher market valuation of companies with a small board of directors. Journal of Financial Economics 40, 185–211.Yu, H.H., Xu, L.B., Chen, B.Z., 2010. The control right of ultimate controlling shareholder and overinvestment of free cash flow.
Economic Research Journal 8, 103–114 (in Chinese).Zhang, W.G., Zhai, C.Y., 2005. On the motive of changing investment projects of raising money through public offering. Accounting
Research 10, 19–24 (in Chinese).Zhang, J.R., Zhao, J.W., Zhang, J., 2003. Empirical analysis on pertinence between senior management and listed company’s operation
performance. Accounting Research 9, 29–34 (in Chinese).Zhu, H.J., Wang, H., 2004. Can “check-and-balance of stock ownership” improve company’s control? A case study of struggle for the
controlling right of Hongzhi Science and Technology limited Company. Management World 10, 114–123 (in Chinese).
X. Xu, Y. Xia / China Journal of Accounting Research 5 (2012) 231–249 249


An empirical study of the effect of venture capital participationon the accounting information quality of IPO firms
Zhiying Hu ⇑, Weixing Cai, Jinjin Han, Rula Sa
DongLing School of Economics and Management, University of Science and Technology, China
A R T I C L E I N F O
Article history:
Received 30 December 2011Accepted 29 August 2012Available online 6 October 2012
JEL classification:
G32
Keywords:
Venture capitalEarnings managementIPOLock-up period
A B S T R A C T
Using a sample of IPO companies on the Shenzhen Small and Median Enter-prise Board and the ChiNext Stock Market between 2005 and 2009, this paperanalyzes the effect of venture capital participation on accounting informationquality. We find that venture capitalists have a significant effect on earningsmanagement, with reduced discretionary accruals before the expiration ofthe equity lock-up period and enhanced discretionary accruals after the expira-tion of the equity lock-up period. Our findings support the moral hazardhypothesis of venture capital, but not the certification/monitoring role of ven-ture capital in IPOs. In addition, we find that venture capital plays a moreimportant role in the earnings management of non-state-owned IPO compa-nies than of state-owned companies.
� 2012 China Journal of Accounting Research. Founded by Sun Yat-senUniversity and City University of Hong Kong. Production and hosting by
Elsevier B.V. All rights reserved.
1. Introduction
China’s venture capital market has recently witnessed tremendous development under the influence of cap-ital internationalization and with support from the government. Venture capital (VC) generally refers to med-ium- and long-term capital that is invested in unlisted enterprises and that gains investment returns through
1755-3091/$ - see front matter � 2012 China Journal of Accounting Research. Founded by Sun Yat-sen University and City University of
Hong Kong. Production and hosting by Elsevier B.V. All rights reserved.
http://dx.doi.org/10.1016/j.cjar.2012.08.004
⇑ Corresponding author.E-mail address: [email protected] (Z. Hu).
Production and hosting by Elsevier
China Journal of Accounting Research 5 (2012) 251–268
Contents lists available at SciVerse ScienceDirect
China Journal of Accounting Research
journal homepage: www.elsevier .com/locate /c jar

IPOs, mergers, acquisitions, liquidations and transferring the equity of portfolio firms.1 IPOs are the mostpopular exit strategy because they bring the highest returns on VC investments. Thus, venture capitalists(VCs) are the main participants in IPO activities and their behavior has a significant influence on the operationof the capital market. Accounting information is one of the major sources of information for the capital mar-ket. Higher accounting information quality makes the allocation of capital market resources more efficient andgives investors more protection. Therefore, to protect investors more effectively, the effect of the participationof VCs on the accounting information quality of IPO firms has received much attention.
Based on the framework of asymmetric information, Barry et al. (1990) and Sahlman (1990) proposed thecertification/monitoring hypothesis. Under this hypothesis, VCs as professional investors play a certificationrole in the identification of the portfolio firm’s intrinsic value. To reduce agency costs and increase the value ofportfolio firms, VCs as large shareholders will actively monitor the portfolio firms, including their accountinginformation quality. Compared to companies without VC support, the earnings quality of VC-backed IPOcompanies should be better. In contrast, Gompers (1996) and Lee and Wahal (2004) argue that the limitedlifetime and special organizational structure of IPO companies mean that VCs must pay attention to howto get back their original investment and receive high returns, so VCs are likely to participate in portfoliofirms’ IPO activities opportunistically and have moral hazard problems. This hypothesis implies that VCsmay collude with portfolio firms or exert pressure on management, using their own professional advantagesor social networks2 with underwriters and government, to help the management of IPO firms manage account-ing earnings before and during the IPO, thereby increasing the IPO price and increasing their investmentreturn following the IPO.
Institutional theory holds that the beliefs, goals and behavior of individuals and groups are influenced byvarious institutional environments (Scott, 1987, 1995). Particular institutional environments will inevitablylead to particular venture capital IPO behavior, including the effect on accounting information quality inIPO companies. Compared with the US market, China’s market has some special features. For example,the Chinese government provides considerable guidance and support for VCs to promote innovation. InSeptember 1985, the State Council officially approved the establishment of the New Technology VentureInvestment Company, China’s first franchised venture capital company. Since then, many VCs have beenestablished with the support of local governments, such as Beijing Venture Capital, Shanghai Venture Capital,Suzhou High-tech Investment Company and the Shenzhen High-tech Investment Company (Chen et al.,2011). However, the development of VCs in the US market is guided by market forces. Meanwhile, China’sstock market is a newly emerging market with a short history and relatively weak investor protection. Thus, toencourage long-term shareholding by VCs and reduce the negative effects of equity selling immediately afteran IPO, the China Security Regulation Committee (CSRC) mandated a lock-up period regulation, whichstates that VCs are not allowed to sell their equity until at least 12 months after the IPO. In contrast, VCsin the US market can sell their equity immediately after the IPO.
Most extant studies in this area are based on the mature Anglo-American market environment. Althoughsome research focuses on emerging Asian markets, few studies discuss China’s market specifically. In thisstudy, we use medium and small IPO firms in China from 2005 to 2009 as our sample, to study the partici-pation of VCs on VC portfolio firms’ earnings management 1 year pre-IPO, in the IPO year and 1 yearpost-IPO, thus allowing a comprehensive analysis of the effect of VCs on accounting information qualitybefore and after the expiration of the lock-up period. After controlling for the sample self-selection endoge-neity problem, we find that the participation of VCs affects the earnings management of IPO firms. Earningsmanagement is lower before the expiration of the lock-up period and higher after the lock-up period expires.The empirical evidence thus supports the moral hazard hypothesis. Furthermore, due to financing bottlenecksand the poor corporate governance of non-state-owned enterprises, the participation of VCs has a greatereffect on the extent of earnings management for non-state-owned enterprises before and after the expirationof the lock-up period.
1 In fact, VC refers to investment in the early stages of an enterprise. However, due to the short history of the venture capital market,many VCs not only perform early-stage investment, but also pre-IPO investment. As it is hard to discriminate between them, we includeboth types of VC in this study.
2 According to Chemmanur and Loutskina (2007), VCs often maintain close relationships with underwriters.
252 Z. Hu et al. / China Journal of Accounting Research 5 (2012) 251–268

The remainder of this paper proceeds as follows. Section 2 reviews the related literature, analyzes the insti-tutional background in China and develops the hypotheses. Section 3 describes the research design and intro-duces the data and variables. Section 4 presents the empirical results. Section 5 concludes the paper.
2. Literature review and research hypotheses
There are two hypotheses on the effect of VCs’ participation in their portfolio companies’ IPOs: certifica-tion/monitoring hypothesis and moral hazard hypothesis. These two hypotheses have different implicationsfor the effects of VC participation on the accounting information quality of IPO companies. Most studiesuse earnings management as a proxy for accounting information quality, which refers to the behavior ofincreasing accounting earnings in the current period by means of accounting accruals and real transactionarrangements. Lower earnings management means higher accounting information quality.
In the US market, VCs are allowed to sell the shares of portfolio companies immediately after their IPOand an IPO is the first opportunity for a private firm to raise equity from dispersed investors. Therefore, mostof the studies based on the US market focus on the effect of VC participation on accounting information qual-ity in the pre-IPO and IPO process. The certification/monitoring hypothesis predicts that to reduce agencycosts and establish their professional investor reputation, VCs should be actively involved in corporate gov-ernance, including monitoring and motivating portfolio firms’ managers, which at the same time reduces theconflict of interest between inside and outside investors (Baker and Gompers, 2003). This also means that VCsshould monitor accounting information quality, which is an important part of corporate governance. There issome evidence to support this view. For example, Ball and Shivakumar (2005) find that information disclosurein the IPO process is highly regulated. Although earnings management and less conservative information dis-closure increase pre-IPO, this is reversed after the IPO, bringing serious economic consequences if discoveredby the market. Thus, to meet stock market requirements, private companies in the United Kingdom tend toreport more conservative accounting information several years prior to their IPO. The companies backed byVC are influenced more by this force, because VC backing increases the predictability of listing compared withnon-VC-backed firms. Therefore, in the process of going public, VC-backed firms disclose losses as early aspossible to satisfy the future requirement of timely disclosure of information, which results in more conserva-tive accounting information and less earnings management. Gioielli et al. (2008) compare the pre-IPO andIPO discretionary accruals of VC-backed firms with those of non-VC-backed firms and find that the earningsmanagement of VC-backed firms is less than that of non-VC-backed firms. Hochberg (2003), Morsfield andTan (2006) and Katz (2009) report similar findings. Moreover, VC-backed firms also have lower discretionaryaccruals after IPO (Gioielli et al., 2008) and a lower likelihood of financial restatements (Agrawal and Cooper,2009). Accounting information quality also increases with the participation of more reputable and older VCs(Agrawal and Cooper, 2009).
However, as an IPO is the first time a private firm can raise equity from public investors, it also magnifiesthe VC’s investment value, which exacerbates the moral hazard problem. To ensure a higher IPO price andobtain higher returns on the sale of their equity during and after IPOs, VCs will help portfolio firms to manageearnings, which leads to lower accounting information quality and further increases conflicts between insiderstakeholders and outsider investors. This view is also supported by a number of studies. For example,Darrough and Rangan (2005) find that VC-backed firms reduce R&D expenditures during the IPO year toensure higher accounting earnings. In addition to R&D expenditure arrangements, discretionary accruals havealso been used as a measure of earnings management. Using reverse leveraged buyouts as their sample, Chouet al. (2006) find sample firms manage earnings by discretionary accruals in the IPO year. Furthermore,Wongsunwai (2007) documents that only the highest-quality VCs inhibit earnings management by meansof discretionary accruals, real transaction arrangements and financial restatements in IPOs. At the same time,as VCs usually occupy seats on their portfolio firms’ boards, are involved in their management and get theinformation they need directly, they lack the incentive to monitor the quality of accounting information.Hence, earnings management is not necessarily lower in VC-backed IPO companies and as the value of theVC’s stakeholding increases, the information content of accounting earnings declines further (Cohen andLangberg, 2006).
Z. Hu et al. / China Journal of Accounting Research 5 (2012) 251–268 253

The institutional environment has an influence on the behavior of economic entities. China’s institutionalenvironment has some special features as follows. First, under the influence of China’s traditional culture, VCsgive more help to portfolio firms in the establishment of social relations than in the provision of value-addedservices. Hu and Bu (2012) show that companies backed by VCs with political connections are more likely tohave successful IPOs than companies backed by VCs with no political connections and only a few VCs helpportfolio firms to form strategic alliances with VCs’ parent companies or other companies. These factorsincrease VCs’ moral hazard in earnings management during IPO. Second, as mentioned above, most VC com-panies in China are owned by the government. Government-backed VCs are thus influenced by their publicfunctions, which reduces the incentive for VCs to monitor their portfolio firms as active shareholders. Atthe same time, VC companies in China are often organized as limited liability corporations, which incur moreagency costs than partnerships, thus further reducing monitoring efficiency. Additionally, China’s capital mar-ket is an emerging market without a long history. Although the regulatory systems are being improved, thereare still some problems with the market mechanism and support systems, which result in low investor protec-tion and further exacerbate the moral hazard problem of VCs.
As the supply of venture capital cannot satisfy the current market demand in China, the reputation effectcannot reduce the moral hazard of VCs in the current environment. At the same time, the rapid changes in theregulatory systems of emerging capital markets mean reduced safety for market participants. Therefore, torealize their investment returns as early as possible, VCs will shorten the equity duration before the IPOand sell their equity as soon as possible after the expiration of the lock-up period. If the pre-IPO durationis not long enough, it is hard for VCs to establish a relationship with the portfolio firm and to be involvedin its operations and management during the IPO (Cao, 2009). However, our results show that in about41% of portfolio firms, the lead VCs hold equity for less than 2 years pre-IPO and in about 10% of casesfor less than 1 year. For example, Huijin Lifang and Jinshi Investment were the two venture capital firms thatsupported Shenzhou Taiyue. The duration of both companies’ pre-IPO equity holding was 165 days. Further-more, selling equity immediately after the IPO can be a convincing interpretation of the opportunism of VCparticipation in the IPO. We find that almost 21% of VC-backed firms incur equity selling immediately afterthe expiration of the lock-up period. For example, Tongzhou Electronics held its IPO on June 27, 2006, butincurred equity selling by Dachen Venture, its VC investor, on June 27, 2007 – the exact date that the lock-upperiod expired. The same thing happened with Western Material: on the first day after the expiration of thelock-up period, its VC, Shenzhen Innovation Investment, cashed in some of its equity.
The governance role played by the media in China’s capital market has been well documented (Li and Shen,2010; Yu et al., 2010). The publicity given to the success stories of VC-backed entrepreneurs encourages moreentrepreneurs to seek help from venture capitalists. Entrepreneurs will favor VCs with better reputations.Accordingly, VCs have an incentive to provide value-added services to portfolio firms to establish their pro-fessional reputation. Furthermore, some foreign-owned VCs use their previous investment experience to mon-itor the portfolio firms before and after the IPO, so that they can play a certification/monitoring role.
The above two forces will have opposite effects on the participation of VCs in an IPO, and will also havedifferent effects on the accounting information quality of IPO companies. As the above analysis shows, thelock-up period in China’s market means that VCs sell their equity after the expiration of the lock-up period,thus the key processes in the effect of VC participation on accounting information quality include the IPO andthe expiration of the lock-up period. The pattern of portfolio firms’ IPO earnings management changesaccordingly.
If certification/monitoring is dominant, VCs will not only inhibit earnings management before and duringthe IPO to enhance accounting information quality and reduce the conflict between inside and outside inves-tors, but they will also certify and monitor the portfolio IPO firms and inhibit the earnings managementinduced by the insider trading of management and other non-controlling stakeholders after the expirationof the lock-up period. However, if moral hazard is dominant, VCs will inevitably pay less attention to theIPO process, because the relevance of the relationship between the IPO price and the VC’s investment returndecreases during the lock-up period, and focus more on equity selling after the expiration of the lock-up per-iod. Due to the interaction between accounting earnings in consecutive periods, VCs will treat the IPO and theexpiration of the lock-up period as a whole and design a dynamic earnings management strategy. In order toreverse accounting earnings in the year in which the lock-up period expires, the earnings management of
254 Z. Hu et al. / China Journal of Accounting Research 5 (2012) 251–268
VC-backed companies before the expiration of the lock-up period will not be higher than that of non-VC-backed firms. Because VCs in China’s market tend to select firms with high growth and excellent financial per-formance (Bruton and Ahlstrom, 2003), the appropriate reduction in accounting earnings before and duringthe IPO will not have a significant effect on IPO pricing. Meanwhile, improvements in the IPO regulatory sys-tem have increased the cost of earnings management (Xu and Chen, 2009). Thus, the earnings management ofVC-backed firms before the lock-up period expires will be even lower than that of non-VC-backed firms.Based on the above analysis, we propose our first hypotheses.
Hypothesis 1. The participation of VCs will influence earnings management before and after the expiration ofthe lock-up period.
Hypothesis 1a. The participation of VCs will reduce earnings management before the expiration of the lock-up period (i.e., 1 year before the IPO and the IPO year itself) and the year in which the lock-up period expires(i.e., 1 year after the IPO).
Hypothesis 1b. The participation of VCs will increase earnings management in the year of the lock-up periodexpiration (i.e., 1 year after the IPO) and reduce earnings management before the expiration of the lock-upperiod (i.e., 1 year before the IPO and the year of the IPO itself).
In China, state-owned enterprises have a natural relationship with banks, which gives them advantages inaccessing bank loans. In a survey of rural commercial banks in Jiangsu and Zhejiang provinces, Brandt and Li(2003) show that banks treat enterprises with different types of ownership differently when awarding bankloans, indicating “financial discrimination.” Fang (2010) compares state-owned industrial enterprises and for-eign-funded industrial enterprises, and further documents the existence of “financial discrimination” in theprocess of allocating bank loans. The result of financial discrimination is that non-state-owned enterprisesin need of funding find it more difficult to obtain bank loans, thus increasing the demand for funds. Underthis circumstance, VCs that can provide development funds to non-state-owned enterprises will have strongerbargaining power in their negotiations with them. Meanwhile, Chemmanur and Loutskina (2007) find thatVCs help to market their portfolio firms to analysts, investment banks and institutional investors. We believethat non-state-owned enterprises with fewer political connections have a stronger need for the marketingpower of VCs during the IPO process, thus further increasing the bargaining power of VCs. Therefore,VCs will have a more significant influence on the corporate governance, operations and financial behaviorof non-state-owned enterprises than on state-owned enterprises.
According to Hao et al. (2011), during the 30 years since China’s reform and opening-up, state-ownedenterprises have experienced the decentralization reform, contracting reform, joint-stock pilot, and modernenterprise system reform. They have developed into new state-owned enterprises with “clear property rights,well-defined power and responsibility, separation of political function and business operation, scientific man-agement.” The governance structure of state-owned enterprises has further improved, especially since theestablishment of the State-owned Assets Supervision and Administration Commission in 2003. Using enter-prises in Shandong Province from 2002 to 2009 as their sample, they show that the total governance efficiency3
of state-owned enterprises, with the exception of enterprises wholly owned by the state, is better than that ofnon-state-owned enterprises and foreign enterprises. Gao and Cai (2011) also find the financial governance ofstate-owned listed companies to be significantly better than that of non-state-owned listed companies. There-fore, we argue that the more robust system in new state-owned enterprises inhibits the negative effect of VCparticipation on enterprises under the new regulatory environment. This leads to our second hypothesis.
Hypothesis 2. VC participation has a greater effect on earnings management before and after the lock-upperiod for non-state-owned enterprises than for state-owned enterprises.
3 In their paper, total enterprise governance efficiency is measured as the sum of operational efficiency aimed at making profits andfunctional efficiency for the purpose of maximizing social welfare.
Z. Hu et al. / China Journal of Accounting Research 5 (2012) 251–268 255

3. Research design
3.1. Sample selection
As the lock-up period for most VCs is 1 year according to the CSRC, we select 1 year after IPO as the yearof the expiration of the lock-up period (referred to as the post-IPO year). Because accruals in the year beforeIPO and the IPO year provide a valid test of earnings management (Teoh et al., 1998; Ball and Shivakumar,2008), we use discretionary accruals in these 2 years as our measure of accounting information quality beforethe expiration of the lock-up period. We use a sample of 323 companies that held their IPO on the ShenzhenSmall and Medium Enterprises Board (SME Board) and the Growth Enterprise Market (GEM) between 2005and 2009. We delete IPO firms with the two-digit SIC code C2 because there are fewer than 10, making it hardto get an appropriate estimation of discretionary accruals. We also delete one other company with missingfinancial data. Finally, we have a sample size of 320 companies in each firm year. We obtain detailed VC databy checking the information from the CV-source with the prospectus, obtain financial data from the Winddatabase, prospectus and annual reports, and the rankings of underwriters and auditors from the website
Table 1Sample selection.
2005 2006 2007 2008 2009 Total
Panel A: Sample selection
IPO companies 11 56 101 65 90 323Less: data missing 0 0 1 0 0 1SIC code C2 0 0 0 2 0 2Final sample 11 56 100 63 90 320
VC-backed Non-VC-backed Total VC-backed (%)
Panel B: VC-backing
2005 2 9 11 18.182006 13 43 56 23.212007 28 72 100 28.002008 19 44 63 30.162009 50 40 90 55.56
Total 112 208 320 35.00VC-backed % Non-VC-backed % Total %
Panel C: Industry distribution
A – Agriculture, forestry, animalhusbandry and fishery
2 1.79 5 2.40 7 2.19
B – Mining 1 0.89 2 0.96 3 0.94C0 – Food and beverage 3 2.68 7 3.37 10 3.13C1 – Textiles, clothing, fur 1 0.89 13 6.25 14 4.38C3 – Papermaking, printing 3 2.68 10 4.81 13 4.06C4 – Oil, chemical, rubber, plastic 6 5.36 30 14.42 36 11.25C5 – Electronics 16 14.29 15 7.21 31 9.69C6 – Metal and non-metal 11 9.82 20 9.62 31 9.69C7 – Machinery, equipment, instruments 32 28.57 35 16.83 67 20.94C8 – Pharmaceutical, bio-products 5 4.46 10 4.81 15 4.69C9 – Other manufacturing 2 1.79 8 3.85 10 3.13D – Electric, gas, water production and supply 0 0.00 2 0.96 2 0.63E – Architecture 2 1.79 6 2.88 8 2.50F – Transportation, warehousing 1 0.89 2 0.96 3 0.94G – Information technology 20 17.86 17 8.17 37 11.56H – Wholesale and retail trade 2 1.79 7 3.37 9 2.81J – Real estate 1 0.89 5 2.40 6 1.88K – Social services 4 3.57 10 4.81 14 4.38L – Communication and culture 0 0.00 3 1.44 3 0.94M – Comprehensive 0 0.00 1 0.48 1 0.31
Total 112 100 208 100 320 100
256 Z. Hu et al. / China Journal of Accounting Research 5 (2012) 251–268

of the industry committee. Panel A of Table 1 reports the sample selection process, Panel B shows theVC-backing frequency and Panel C shows the industry distribution.
Panel A of Table 1 shows that the stock market boom in 2007 led to 101 IPOs in that year, which was thehighest number during the five consecutive sample years. The second highest was 90 IPOs in 2009, the yearthat China launched GEM. Panel B reports the descriptive results for the number of sample firms that receivedVC-backing. It seems that VCs participated actively in the capital market, with one third of IPOs backed byVCs. The percentage of firms backed by VCs increased throughout the period, reaching 55.56% in 2009.According to Panel C, VCs give more support to the electronics industry, the machinery, equipment andinstrument industry, and the information technology industry. The percentages of VC-backed sample firmsin these three industries are 16%, 28.57% and 17.86% respectively, and the proportions in the overall sampleare 9.69%, 20.94% and 11.56%.
3.2. Research design
According to Katz (2009), we use the following model to test the effect of VC participation on the earningsmanagement of IPO firms:
DAt ¼ a0 þ a1VCt þ a2Sizet þ a3Growtht þ a4Leveraget þ a5Qratiot þ a6Age
þa7ind adj cashþ a8D AuditQualityt þ a9D UnderwriterQualityt þ et:
In Model (1), the dependent variable DAt represents the discretionary accruals of IPO firms in year t. We use across-sectional modified Jones model to calculate DAt. To obtain DAt, we first use the listed companies in thesame industry as each IPO sample firm to estimate the parameters in the following equation:
ACCt
At�1
¼ b1
1
At�1
þ b2
DREV t � DRECt
At�1
þ b3
PPEt
At�1
;
where ACCt = NIt � CFOt, ACCt is total accruals in year t, NIt is total income in year t, CFOt is net cash flowfrom operations; At�1 is total assets in year t � 1; DREVt is change in sales between year t and year t � 1;DRECt represents the change in account receivables from t – 1 to t; PPEt is total fixed assets in year t; andet is the residual. We then insert the estimated coefficients b1, b2 and b3 into the following equation, to obtainthe non-discretionary accruals (NDAt) of sample firms in year t:
NDAt=At�1 ¼ b1ð1=At�1Þ þ b2½ðDREV t � DRECtÞ=At�1� þ b3ðPPEt=At�1Þ:Next, we calculate the total accruals of sample firms in year t: ACCt = NIt � CFOt.Finally, we obtain the discretionary accruals (DAt) of sample firms in year t using the following equation:
DAt=At�1 ¼ et ¼ ACCt=At�1 � NDAt=At�1:
The dummy variable VC is the key variable. If a sample firm is supported by VC, VC equals 1, otherwise 0.In this model, if the pre-IPO year and the IPO year regression results show that the coefficient a1 is signifi-cantly negative or not significant and the coefficient a1 in the post-IPO year is significantly positive, thenVCs’ moral hazard is dominant. On the contrary, if the a1 coefficients in the three regressions are all signifi-cantly negative, the VCs’ certification/monitoring role is dominant.
Because financial performance is a key factor in IPO decisions and whether a company can get supportfrom a VC is determined by its financial performance, performance-matched discretionary accruals can con-trol for the systematic difference between the performance of VC-backed and non-VC-backed IPO firms.Thus, performance-matched discretionary accruals are more relevant in this study. We also calculate perfor-mance-matched discretionary accruals (Kothari et al., 2005) to measure earnings management, in accordancewith Morsfield and Tan (2006). Performance-matched discretionary accruals are calculated as follows: first, weobtain the ROA of each listed company for each year from 2005 to 2009; and second, we match each samplefirm with a non-IPO firm with the same one-digit SIC4 code and that has the closest ROA to the sample firm.
4 For each sample firm in industries with the SIC code C, we select an ROA-matched firm from the sample firms with the same two-digitSIC.
Z. Hu et al. / China Journal of Accounting Research 5 (2012) 251–268 257

We then calculate the performance-matched discretionary accruals as the difference between the discretionaryaccruals of each IPO firm and the discretionary accruals of the matched firm.
In addition, we control for a number of factors that may affect earnings management, including the size ofthe IPO company, growth, financial leverage, quick ratio, cash flow performance, ownership and the reputa-tions of the IPO auditors and the underwriter. Our reasoning is as follows. First, because firms with highgrowth may lack cash, accruals and discretionary accruals in these firms may be larger. Second, firms withhigher financial leverage receive more monitoring from debtors, so their earnings management will be lower.Third, the quick ratio represents short-term financial flexibility; firms with more financial flexibility may havemore cash and lower accruals, and this will further influence their discretionary accruals. Fourth, given thatnet income is constant, the adequacy of cash flow directly affects the level of accruals, thus affecting the level ofdiscretionary accruals. Fifth, accounting information quality will be better if the company is audited by morereputable auditors, and the underwriter’s reputation may influence the choice of auditor. Seventh, differentownership may also affect earnings management, as documented in previous studies. Finally, firm size canproxy for a firm’s resources to influence accounting earnings.
We recognize that Model (1) does not control for the endogeneity problem arising from sample self-selec-tion, because a VC’s choice to invest in a certain firm may not be random. The control variables in Model (1)cannot reflect this tendency. Therefore, even when earnings management has no relationship with VC partic-ipation, the regression result may still show that VC participation has a significant effect on earnings manage-ment, and vice versa.
For example, we assume the following equation:
Y ¼ b � X þ d � C þ e;
where Y represents earnings management, C is a dummy variable that equals 1 for listed companies that re-ceive VC support and 0 otherwise, and X is a proxy for all other factors that may influence earnings manage-ment. Because the decision of a VC is based on a number of factors, we use a related model to reflect thisdecision:
C� ¼ c � W þ t;
where C� is an unobserved latent variable. The decision we observe is C = 1, if C�> 0, otherwise C = 0.If this sample self-selection problem exists, the coefficient d we estimate by OLS will not measure the effect
of the participation of VCs appropriately. In empirical studies, this self-selection problem can be solved byusing a treatment effect model (Greene, 2003).
We use a self-selection model to control for this potential endogeneity problem. Specifically, the participa-tion of VCs may be affected by sales per share, net assets per share, total assets per share and other financialfactors of portfolio firms (Morsfied and Tan, 2005). It may also be influenced by industry factors, as VCs tendto invest in firms in high-tech industries (Lee and Wahal, 2004). Therefore, we use a dummy variable to cap-ture whether the sample firms are in a high-tech industry. Finally, according to Lerner (1995), VCs tend toinvest in firms close to their geographical location to reduce their costs. Because VCs in China are concen-trated in Beijing, Guangdong, Jiangsu and Zhejiang, a dummy variable is used to proxy for whether thesample firms are registered in such provinces. We regress VC on the above five variables to estimate theself-selection model.
Table 2 shows the definitions of the variables used in this paper.
4. Empirical results
4.1. The participation of VCs in earnings management of IPO firms
Table 3 shows the descriptive statistics for the independent and control variables. In summary, both discre-tionary accruals estimated by a cross-sectional modified Jones model and performance-matched discretionaryaccruals in the pre-IPO, IPO and post-IPO years tend to increase at first and then decline. They peak in theIPO year and are higher in the post-IPO year than in the year before the IPO. Discretionary accruals estimatedby a cross-sectional modified Jones model are positive in all three consecutive years, significant at the 5%, 1%
258 Z. Hu et al. / China Journal of Accounting Research 5 (2012) 251–268
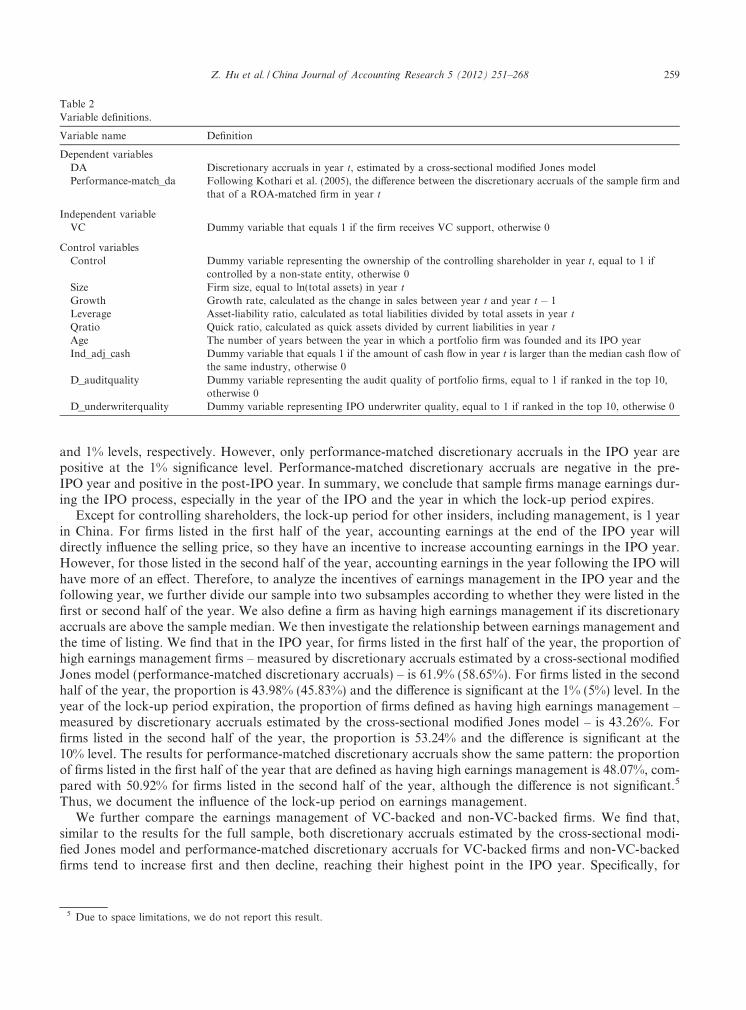
and 1% levels, respectively. However, only performance-matched discretionary accruals in the IPO year arepositive at the 1% significance level. Performance-matched discretionary accruals are negative in the pre-IPO year and positive in the post-IPO year. In summary, we conclude that sample firms manage earnings dur-ing the IPO process, especially in the year of the IPO and the year in which the lock-up period expires.
Except for controlling shareholders, the lock-up period for other insiders, including management, is 1 yearin China. For firms listed in the first half of the year, accounting earnings at the end of the IPO year willdirectly influence the selling price, so they have an incentive to increase accounting earnings in the IPO year.However, for those listed in the second half of the year, accounting earnings in the year following the IPO willhave more of an effect. Therefore, to analyze the incentives of earnings management in the IPO year and thefollowing year, we further divide our sample into two subsamples according to whether they were listed in thefirst or second half of the year. We also define a firm as having high earnings management if its discretionaryaccruals are above the sample median. We then investigate the relationship between earnings management andthe time of listing. We find that in the IPO year, for firms listed in the first half of the year, the proportion ofhigh earnings management firms – measured by discretionary accruals estimated by a cross-sectional modifiedJones model (performance-matched discretionary accruals) – is 61.9% (58.65%). For firms listed in the secondhalf of the year, the proportion is 43.98% (45.83%) and the difference is significant at the 1% (5%) level. In theyear of the lock-up period expiration, the proportion of firms defined as having high earnings management –measured by discretionary accruals estimated by the cross-sectional modified Jones model – is 43.26%. Forfirms listed in the second half of the year, the proportion is 53.24% and the difference is significant at the10% level. The results for performance-matched discretionary accruals show the same pattern: the proportionof firms listed in the first half of the year that are defined as having high earnings management is 48.07%, com-pared with 50.92% for firms listed in the second half of the year, although the difference is not significant.5
Thus, we document the influence of the lock-up period on earnings management.We further compare the earnings management of VC-backed and non-VC-backed firms. We find that,
similar to the results for the full sample, both discretionary accruals estimated by the cross-sectional modi-fied Jones model and performance-matched discretionary accruals for VC-backed firms and non-VC-backedfirms tend to increase first and then decline, reaching their highest point in the IPO year. Specifically, for
Table 2Variable definitions.
Variable name Definition
Dependent variablesDA Discretionary accruals in year t, estimated by a cross-sectional modified Jones modelPerformance-match_da Following Kothari et al. (2005), the difference between the discretionary accruals of the sample firm and
that of a ROA-matched firm in year t
Independent variableVC Dummy variable that equals 1 if the firm receives VC support, otherwise 0
Control variablesControl Dummy variable representing the ownership of the controlling shareholder in year t, equal to 1 if
controlled by a non-state entity, otherwise 0Size Firm size, equal to ln(total assets) in year t
Growth Growth rate, calculated as the change in sales between year t and year t � 1Leverage Asset-liability ratio, calculated as total liabilities divided by total assets in year t
Qratio Quick ratio, calculated as quick assets divided by current liabilities in year t
Age The number of years between the year in which a portfolio firm was founded and its IPO yearInd_adj_cash Dummy variable that equals 1 if the amount of cash flow in year t is larger than the median cash flow of
the same industry, otherwise 0D_auditquality Dummy variable representing the audit quality of portfolio firms, equal to 1 if ranked in the top 10,
otherwise 0D_underwriterquality Dummy variable representing IPO underwriter quality, equal to 1 if ranked in the top 10, otherwise 0
5 Due to space limitations, we do not report this result.
Z. Hu et al. / China Journal of Accounting Research 5 (2012) 251–268 259

discretionary accruals estimated by a cross-sectional modified Jones model, the earnings management ofVC-backed firms is significantly positive in both the IPO year and the post-IPO year, and is higher in thepost-IPO year (the year of the lock-up period) than in the pre-IPO year. Although the earnings managementof non-VC-backed firms is significantly positive in all three consecutive years, it is lower in the post-IPO yearthan in the pre-IPO year. The earnings management pattern of VC-backed firms is also similar for perfor-mance-matched discretionary accruals. It is significantly positive in the IPO year, not significantly negativein the pre-IPO year and positive in post-IPO year. The pattern of earnings management of non-VC-backedfirms is slightly different. It is significantly positive in the IPO year and not significantly negative in thepre-IPO or the post-IPO year. In summary, the results of the discretionary accruals estimated by a cross-sectional modified Jones model and performance-matched discretionary accruals show that earnings
Table 3The effect of VCs on portfolio firms. This table presents the results for the effect of VC participation on portfolio firms. DA is thediscretionary accruals in the pre-IPO year, the IPO year and the post-IPO year, estimated by a cross-sectional modified Jones model;performance-match_da represents the difference between the discretionary accruals of the sample firm and that of a ROA-matched firm inthe pre-IPO year, the IPO year, and the post-IPO year, according to Kothari et al. (2005); Size is the ln(assets) in year t; Growth is the rateof sales growth, calculated as the change in sales between year t and t � 1; Leverage is the assets–liability ratio, defined as total liability/total assets; Qratio is the quick ratio, defined as quick assets/current liabilities; Age is calculated as the number of years from the foundingof a portfolio firm to its IPO year; Ind-adj_cash is a dummy variable that equals 1 if the amount of cash flow in year t is larger than themedian cash flow of the same industry, otherwise 0; D_Auditquality is a dummy variable representing the audit quality of portfolio firms;it equals 1 if ranked in the top 10, otherwise 0; D_underwriterquality is a dummy variable representing IPO underwriter quality; it equals 1if ranked in the top 10, otherwise 0.
Year Total sample (320) VC-backed (112) Non-VC-backed (208) Difference
Mean S.D. Mean S.D. Mean S.D. (t-value)
DA (t-value) �1 0.019** (2.418) 0.139 0.013 (0.867) 0.164 0.022** (2.529) 0.123 �0.50 0.063*** (7.234) 0.155 0.053*** (3.943) 0.143 0.067*** (6.061) 0.161 �0.7791 0.020*** (2.995) 0.12 0.023 *** (3.357) 0.073 0.019* (1.911) 0.139 0.34
Performance-match_da (t-value)
�1 �0.013 (�1.359) 0.17 �0.020 (�1.075) 0.201 �0.009 (�0.848) 0.151 �0.578
0 0.048*** (4.846) 0.171 0.043*** (2.648) 0.176 0.050*** (4.057) 0.178 �0.031 0.001 (0.057) 0.302 0.010 (1.092) 0.099 �0.005 (�0.401) 0.171 0.851
Size �1 19.950 0.773 19.778 0.6708 20.043 0.81 �2.951***
0 20.648 0.670 20.616 0.623 20.666 0.694 �0.6261 20.808 0.705 20.768 0.677 20.83 0.721 �0.743
Growth �1 0.319 0.331 0.370 0.405 0.292 0.281 2.017 **
0 0.279 0.425 0.296 0.544 0.27 0.345 0.5351 0.253 0.355 0.268 0.274 0.245 0.393 0.548
Leverage �1 0.519 0.156 0.484 0.152 0.538 0.154 �3.001***
0 0.314 0.176 0.273 0.161 0.336 0.18 �3.100***
1 0.341 0.18 0.305 0.168 0.361 0.184 �2.689***
Qratio �1 1.143 0.88 1.411 1.126 0.999 0.673 4.090***
0 4.096 5.831 5.132 6.036 3.539 5.654 2.347**
1 3.217 4.962 4.159 6.591 2.710 3.730 2.511**
Ind_adj_cash �1 0.275 0.447 0.259 0.44 0.284 0.452 �0.4710 0.272 0.446 0.259 0.44 0.279 0.45 �0.3811 0.281 0.45 0.227 0.421 0.309 0.463 �1.546
Age 0 3.139 0.336 3.078 0.364 3.172 0.316 �2.407**
D_audit_quality 0 0.253 0.436 0.188 0.392 0.289 0.454 �1.987**
D_underwriter_quality 0 0.459 0.499 0.545 0.500 0.414 0.494 2.257**
Note:* 10% Significance level.
** 5% Significance level.*** 1% Significance level.
260 Z. Hu et al. / China Journal of Accounting Research 5 (2012) 251–268
management is lower in VC-backed than non-VC-backed firms before the expiration of the lock-up period,but the earnings management of VC-backed firms reverses after the expiration of the lock-up period. Theearnings management of VC-backed firms is higher than that of non-VC-backed firms in the year the lock-up period expires, although not significantly.
The size of VC-backed firms is smaller in all 3 years. The difference is significant at the 1% level in the pre-IPO year, but not significant in the other 2 years. The growth rate of VC-backed firms is higher in all 3 years,especially in the pre-IPO year, at the 5% significance level. Meanwhile, VC-backed firms are younger at the 5%significance level. This finding is in accordance with the Grandstanding hypothesis proposed by Gompers(1996), which suggests that to signal their IPO performance, younger VCs tend to take younger portfolio firmsto IPO. VC-backed firms also have more reputable underwriters. The reputations of VC-backed firms arehigher than those of non-backed firms at the 5% significance level, in accordance with the findings ofChemmanur and Loutskina (2007). This implies that VCs help portfolio firms with IPO marketing in China’smarket. However, the reputations of their auditors are lower than those of non-VC-backed firms, because VCstend to choose lower quality auditors for the convenience of earnings management.
Finally, due to the support of VCs, the IPO firms backed by VCs have higher financial flexibility, moreshort-term and long-term solvency, significantly lower financial leverage in the pre-IPO and the IPO year,and a higher quick ratio in all 3 years, significant at the 1%, 1% and 5% levels respectively, and less adequateoperational cash flow.
4.2. Regression results
The regression results for Hypothesis 1, reported in Table 4, show that for all 3 years, VC has no significanteffect on earnings management as measured by discretionary accruals (estimated by a cross-sectional modifiedJones model) and performance-matched discretionary accruals, without controlling for the sample self-selec-tion problem. The regression coefficients of discretionary accruals estimated by a cross-sectional modifiedJones model (performance-matched discretionary accruals) on VC, a1, are �0.014 (�0.009) and �0.014(�0.007) in the pre-IPO and the IPO year, respectively, and 0.012 (0.024) in the post-IPO year. All of theseare non-significant, after controlling for sample firms’ characteristics and underwriter and auditor reputation.However, if we consider the pattern over the 3 years, we can conjecture that VCs in China’s market tend toinfluence the management of portfolio firms by lowering earnings management before the expiration of thelock-up period. By reversing accounting earnings in the post-IPO year, they will realize higher investmentreturns when they cash in their equity at the end of the lock-up period. Thus, moral hazard plays a moreimportant role than the certification/monitoring role.
The fifth to seventh and tenth to thirteenth column report the second-stage regression results of the treat-ment effect model, controlling for the sample self-selection problem. Due to space limitations, we do not reportthe first-stage probit regression results. In general, the overall LR chi2 of the regressions are 49.8, 50.33 and49.56 for the 3 years, respectively. They are all significant below the 1% level and the Pseudo R2 are 12.23%,12.36% and 12.17% respectively. In all three probit regressions, the dummy variables – high-tech and geo-graphical location – are significantly positive below the 5% level.
After controlling for the sample self-selection problem, the significance of the overall equation improves. Inparticular, in the regression for the post-IPO year, with performance-matched discretionary accruals as thedependent variable, the overall significance of the equation changes from insignificant to significant at the10% level. The second-stage results show that VC participation affects the earnings management patternbefore and after the expiration of the lock-up period. In the regression of discretionary accruals estimatedusing a cross-sectional modified Jones model, the regression coefficients a1 remain insignificantly negativein the pre-IPO year and the IPO year, whereas the a1 coefficient is 0.102 in the year the lock-up period expiresand is significant at the 5% level. In the regression with performance-matched discretionary accruals as thedependent variable, the regression coefficient a1 in the pre-IPO year is �0.136, significant at the 5% level.In the IPO year, the earnings management of VC-backed companies is still less than that of non-VC-backedfirms. However, the difference is not significant, due to the increased earnings management by the firms listedin the first half of the year to boost accounting earnings after the expiration of the lock-up period. In the yearthe lock-up period expires, the participation of VCs has a significant effect on the earnings management of
Z. Hu et al. / China Journal of Accounting Research 5 (2012) 251–268 261

Tab
le4
Th
eeff
ect
of
the
par
tici
pat
ion
of
VC
so
nea
rnin
gsm
anag
emen
t.T
his
tab
lere
po
rts
the
regr
essi
on
resu
lts
for
VC
par
tici
pat
ion
on
the
earn
ings
man
agem
ent
of
IPO
firm
sin
the
pre
-IP
Oye
ar,t
he
IPO
year
and
the
po
st-I
PO
year
.DA
isth
ed
iscr
etio
nar
yac
cru
als
inth
ep
re-I
PO
,th
eIP
O,a
nd
the
po
st-I
PO
year
,est
imat
edb
ya
cro
ss-s
ecti
on
alm
od
ified
Jon
esm
od
el;
Per
form
ance
-mat
ch_d
are
pre
sen
tsth
ed
iffer
ence
bet
wee
nth
ed
iscr
etio
nar
yac
cru
als
of
the
sam
ple
firm
and
that
of
aR
OA
-mat
ched
firm
inth
ep
re-I
PO
year
,th
eIP
Oye
ar,
and
po
st-
IPO
year
,ac
cord
ing
toK
oth
ari
etal
.(2
005)
;C
on
tro
lis
ad
um
my
vari
able
rep
rese
nti
ng
the
ow
ner
ship
of
con
tro
llin
gsh
areh
old
ers
inye
art,
wh
ich
equ
als
1if
con
tro
lled
by
an
on
-st
ate
enti
ty;
Siz
eis
the
ln(a
sset
s)in
year
t;G
row
this
the
rate
of
sale
sgr
ow
th,
calc
ula
ted
asth
ech
ange
insa
les
bet
wee
nye
art
and
year
t�
1;L
ever
age
isth
eas
sets
-lia
bil
ity
rati
o,
defi
ned
asto
tal
liab
ilit
y/to
tal
asse
ts;
Qra
tio
isq
uic
kra
tio
,d
efin
edas
qu
ick
asse
ts/c
urr
ent
liab
ilit
ies;
Age
isca
lcu
late
das
the
nu
mb
ero
fye
ars
fro
mth
efo
un
din
go
fp
ort
foli
ofi
rms
toth
eir
IPO
year
;In
d-a
dj_
cash
isa
du
mm
yva
riab
le,
wh
ich
equ
als
1if
the
amo
un
to
fca
shfl
ow
inye
art
isla
rger
than
the
med
ian
cash
flo
wo
fth
esa
me
ind
ust
ry,
oth
erw
ise
0;D
_Au
dit
qu
alit
yis
ad
um
my
vari
able
rep
rese
nti
ng
the
aud
itq
ual
ity
of
po
rtfo
lio
firm
s,w
hic
heq
ual
s1
ifra
nk
edin
the
top
10,o
ther
wis
e0;
D_u
nd
erw
rite
rqu
alit
yis
ad
um
my
vari
able
rep
rese
nti
ng
IPO
un
der
wri
ter
qu
alit
y,w
hic
heq
ual
s1
ifra
nk
edin
the
top
10,
oth
erw
ise
0.
DA
DA
(co
ntr
oll
ing
for
self
-sel
ecti
on
)P
erfo
rman
ce-m
atch
_da
Per
form
ance
-mat
ch_d
a(c
on
tro
llin
gfo
rse
lf-s
elec
tio
n)
Pre
-IP
Oye
arIP
Oye
arP
ost
-IP
Oye
arP
re-
IPO
year
IPO
year
Po
st-I
PO
year
Pre
-IP
Oye
arIP
Oye
arP
ost
-IP
Oye
arP
re-I
PO
year
IPO
year
Po
st-I
PO
year
VC
(t-v
alu
e/z-
valu
e)�
.014
�.0
140.
012
�0.
065
�0.
067
0.10
2**
�.0
09�
.007
.024
�0.
136*
*�
0.09
10.
086*
(�0.
89)
(�0.
82)
(0.8
5)(�
1.42
)(�
1.34
)(2
.35)
(�0.
49)
(�0.
39)
(1.3
5)(�
2.28
)(�
1.52
)(1
.69)
Co
ntr
ol
(t-v
alu
e/z-
valu
e).0
16.0
38*
0.04
1**
0.03
00.
045*
*0.
037*
*.0
15.0
15.0
280.
001
0.02
60.
028
(0.9
)(1
.94)
(2.4
8)(1
.58)
(2.1
9)(2
.13)
(�0.
68)
(0.6
7)(1
.36)
(0.0
3)(1
.10)
(1.3
0)
Siz
e(t
-val
ue/
z-va
lue)
.039
***
.042
***
0.01
60.
036*
**
0.04
2***
0.01
2.0
38**
.050
***
.019
0.03
5**
0.05
2***
0.01
5(2
.78)
(2.9
8)(1
.46)
(2.6
6)(2
.91)
(1.1
1)(2
.23)
(2.9
5)(1
.42)
(2.0
8)(2
.98)
(1.0
9)
Gro
wth
(t-v
alu
e/z-
valu
e).0
37�
.003
�0.
065*
**
0.01
0�
0.00
5�
0.07
1***
.039
�.0
25�
.055
**
0.02
0�
0.02
9�
0.06
1**
(1.6
2)(�
0.17
)(�
3.40
)(0
.45)
(�0.
30)
(�3.
74)
(1.3
6)(�
1.08
)(�
2.29
)(0
.70)
(�1.
27)
(�2.
52)
Lev
erag
e(t
-val
ue/
z-va
lue)
�.1
76**
�.0
020.
009
�0.
174*
*�
0.00
90.
030
�.0
70�
.034
.023
�0.
087
0.04
90.
037
(�2.
13)
(�0.
04)
(0.1
8)(�
2.09
)(�
0.14
)(0
.57)
(�0.
69)
(�0.
44)
(0.3
6)(�
0.83
)(�
0.61
)(0
.56)
Qra
tio
(t-v
alu
e/z-
valu
e)�
.002
�.0
03*�
0.00
10.
0001
�0.
002*�
0.00
1.0
10�
.004
*�
.001
0.01
6�
0.00
3*�
0.00
1(�
0.19
)(�
1.92
)(�
0.46
)(0
.00)
(�1.
74)
(�0.
86)
(0.6
6)(�
1.96
)(�
0.27
)(1
.08)
(�1.
68)
(�0.
48)
Age
(t-v
alu
e/z-
valu
e).0
13.0
240.
029
0.00
20.
022
0.03
3.0
68**
.009
.026
0.05
7*0.
006
0.02
9(0
.55)
(0.9
7)(1
.39)
(0.1
0)(0
.92)
(1.6
0)(2
.34)
(0.3
1)(1
.00)
(1.9
5)(0
.22)
(1.1
1)
262 Z. Hu et al. / China Journal of Accounting Research 5 (2012) 251–268

Ind
_ad
j_ca
sh(t
-val
ue/
z-va
lue)
�.1
16***
�.1
51***
0.01
4�
0.11
9***�
0.15
5***
0.00
9�
.132
***
�.1
40***
.016
�0.
133*
**�
0.14
9***
0.01
2(�
6.37
)(�
7,89
)(1
.01)
(�6.
63)
(�8.
11)
(0.6
2)(�
5.90
)(�
6.09
)(0
.87)
(�6.
02)
(�6.
51)
(0.6
9)
D_A
ud
itq
ual
ity
(t-v
alu
e/z-
valu
e)�
.033
*�
.024
�0.
006
�0.
031*
�0.
018�
0.00
8�
.032
�.0
19�
.006
�0.
025
�0.
016�
0.01
0(�
1.95
7)(�
1.31
)(�
0.40
)(�
1.84
)(�
0.98
)(�
0.56
)(�
1.52
)(�
0.90
)(�
0.34
)(�
1.19
)(�
0.73
)(�
0.52
)
D_u
nd
erw
rite
rqu
alit
y(t
-val
ue/
z-va
lue)
�.0
05.0
15�
0.02
6*�
0.00
50.
013
0.02
2*�
.015
.033
*�
.036
*�
0.01
60.
028
�0.
035*
*
(�0.
38)
(0.9
8)(�
1.89
)(�
0.35
)(0
.82)
(�1.
69)
(�08
2)(1
.73)
(�2.
1)(�
0.88
)(1
.48)
(�2.
04)
Co
nst
ant
(t-v
alu
e/z-
valu
e)�
.683
***
�.8
55***�
0.41
7*�
0.59
3**
�0.
837*
*�
0.38
9�
.915
***
�.9
62***�
.503
�0.
790*
*�
0.96
6***�
0.44
7(�
2.61
)(�
2.90
)(�
1.79
)(�
2.29
)(�
2.81
)(�
1.64
)(�
2.85
)(�
273)
(�1.
72)
(�2.
43)
(�2.
70)
(�1.
50)
N32
032
032
032
032
032
032
032
032
032
032
032
0
F(W
ald
chi2
)4.
92***
8.29
***
2.33
**
53.5
187
.31
28.4
4.93
***
4.93
***
1.44
55.1
555
.12
16.6
1
Ad
just
R2
(Pro
b>
chi2
)10
.95%
18.6
0%3.
72%
0.00
00.
000
0.00
210
.96%
10.9
6%1.
37%
0.00
00.
000
0.08
3
No
te:
*10
%S
ign
ifica
nce
leve
l.**
5%S
ign
ifica
nce
leve
l.***
1%S
ign
ifica
nce
leve
l.
Z. Hu et al. / China Journal of Accounting Research 5 (2012) 251–268 263

portfolio firms, with the earnings management of VC-backed firms higher than that of non-VC-backed firmsat the 10% significance level.
In addition, unreported results show that the ROA (industry-median-adjusted ROA) of VC-backed firms inthe pre-IPO year is 14.2% (11.2%), which is significantly higher than that of non-VC-backed firms – 11.9%(9%) – at the 1% (1%) level. In Table 3, we find that the growth rate of VC-backed firms in the pre-IPO yearis 37%, compared with 29.2% for non-VC-backed firms. Therefore, reducing earnings management in the pre-IPO year will not have a significant effect on IPO pricing. If we consider the earnings management from thepre-IPO year to the post-IPO year together, we can infer that the participation of VCs reduces earnings man-agement before the expiration of the lock-up period to reverse accounting earnings in the year the lock-upperiod expires. For this reason, under our current background, the imperfect market system means thatVCs participating in IPOs have no incentive to monitor portfolio firms, their participation is more for spec-ulative purposes. They collude with the management of portfolio firms or put pressure on the management tolower discretionary accruals before the expiration of the lock-up period in return for the reverse in accountingearnings once the lock-up period expires, which ultimately has a negative effect on the market. Thus, ourempirical results support the moral hazard hypothesis.
The regression results also show that the earnings management of non-state-owned enterprises is higherthan that of state-owned enterprises during the three consecutive years. In particular, in the regression modelwith discretionary accruals estimated by the cross-sectional modified Jones model as the dependent variable,the coefficients for VC in the IPO year and the post-IPO year are 0.045 and 0.037 respectively, both significantat the 5% level. This implies that the governance of state-owned enterprises is better than that of non-state-owned enterprises, in accordance with Gao and Cai (2011). In addition, larger firms have more resourcesto manage earnings, so they tend to have higher earnings management. The regression coefficients for discre-tionary accruals estimated by the cross-sectional modified Jones model (performance-matched discretionaryaccruals) on firm size in the pre-IPO and the IPO year are 0.036 (0.035) and 0.042 (0.052), significant atthe 1% (5%) and 1% (1%) levels. Firms with lower growth rates have more incentive to increase growth bymeans of earnings management, which is more obvious in the year the lock-up period expires. The regressioncoefficients for discretionary accruals estimated by the cross-sectional modified Jones model (performance-matched discretionary accruals) on growth are �0.071 (�0.061) respectively, significant at the 1% (5%) level.Furthermore, older firms of lower quality (Xue, 2002) tend to have higher earnings management. The regres-sion coefficient for performance-matched discretionary accruals on age is 0.057, significant at the 10% level inthe pre-IPO year. Meanwhile, firms with lower financial leverage receive less monitoring from debtors, whichleads to higher earnings management. The regression coefficient for discretionary accruals estimated by thecross-sectional modified Jones model on financial leverage is �0.174, significant at the 5% level in the pre-IPO year. As predicted, firms with worse operational cash flow tend to have higher earnings management.Finally, auditors and underwriters do not inhibit earnings management.
Because VCs increase earnings in the year the lock-up period expires to obtain higher equity selling prices,high earnings management inevitably leads to more frequent equity selling. To test this direct result of earn-ings management, we analyze equity selling by VCs in the post-IPO year. The results show that 54 firms incurequity selling by VCs in the post-IPO year, accounting for 62.92% of the sample firms with lock-up periods of1 year. Among them, 18 firms (22.32%) incur equity selling on the day of the expiration of the lock-up period.Thus, the moral hazard hypothesis is further supported.
To investigate whether there is a different effect of VC participation on earnings management for firms withdifferent ownership, we divide the total sample into state-owned and non-state-owned subsamples. The resultsbefore controlling for sample self-selection show that in general, the participation of VCs has no significanteffect on earnings management.6 Specifically, when the dependent variable is discretionary accruals estimatedby the cross-sectional modified Jones model, the regression results for both state-owned and non-state-ownedfirms tend to be similar. In the pre-IPO and the IPO year, the participation of VCs has a negative relationshipwith earnings management, but the relationship turns positive in the post-IPO year, although not significantly.However, in the performance-matched discretionary accruals regression, the participation of VCs has a
6 Because of space limitations, we do not report this result.
264 Z. Hu et al. / China Journal of Accounting Research 5 (2012) 251–268

Tab
le5
Th
eeff
ect
of
the
par
tici
pat
ion
of
VC
so
nea
rnin
gsm
anag
emen
t:su
bsa
mp
lere
gres
sio
ns.
Th
ista
ble
rep
ort
sth
ere
gres
sio
nre
sult
sfo
rV
Cp
arti
cip
atio
no
nth
eea
rnin
gsm
anag
emen
to
fst
ated
-ow
ned
and
no
n-s
tate
-ow
ned
IPO
firm
sin
the
pre
-IP
Oye
ar,
the
IPO
year
,an
dth
ep
ost
-IP
Oye
ar.
DA
isth
ed
iscr
etio
nar
yac
cru
als
inth
ep
re-I
PO
,th
eIP
O,
and
the
po
st-I
PO
year
,es
tim
ated
by
acr
oss
-se
ctio
nal
mo
difi
edJo
nes
mo
del
;P
erfo
rman
ce-m
atch
_da
rep
rese
nts
the
diff
eren
ceb
etw
een
the
dis
cret
ion
ary
accr
ual
so
fth
esa
mp
lefi
rman
dth
ato
fa
RO
A-m
atch
edfi
rmin
the
pre
-IP
O,
the
IPO
,an
dth
ep
ost
-IP
Oye
ar,
acco
rdin
gto
Ko
thar
iet
al.
(200
5);
Siz
eis
the
ln(a
sset
s)in
year
t;G
row
this
the
rate
of
sale
sgr
ow
th,
calc
ula
ted
asth
ech
ange
insa
les
bet
wee
nye
art
and
year
t�
1;L
ever
age
isth
eas
sets
–lia
bil
ity
rati
o,
defi
ned
asto
tal
liab
ilit
y/to
tal
asse
ts;
Qra
tio
isth
eq
uic
kra
tio
,d
efin
edas
qu
ick
asse
ts/c
urr
ent
liab
ilit
ies;
Age
isca
lcu
late
das
the
nu
mb
ero
fye
ars
fro
mth
efo
un
din
go
fp
ort
foli
ofi
rms
toth
eir
IPO
year
;In
d-a
dj_
cash
isa
du
mm
yva
riab
le,
wh
ich
equ
als
1if
the
amo
un
to
fca
shfl
ow
inye
art
isla
rger
than
the
med
ian
cash
flo
wo
fth
esa
me
ind
ust
ry,
1,o
ther
wis
e0;
D_A
ud
itq
ual
ity
isa
du
mm
yva
riab
lere
pre
sen
tin
gth
eau
dit
qu
alit
yo
fp
ort
foli
ofi
rms,
wh
ich
equ
als
1if
ran
ked
inth
eto
p10
,o
ther
wis
e0;
D_u
nd
erw
rite
rqu
alit
yis
ad
um
my
vari
able
rep
rese
nti
ng
IPO
un
der
wri
ter
qu
alit
y,w
hic
heq
ual
s1
ifra
nk
edin
the
top
10,
oth
erw
ise
0.
DA
Per
form
ance
-mat
ch_d
a
1ye
arb
efo
reIP
OIP
Oye
ar1
year
afte
rIP
O1
year
bef
ore
IPO
IPO
year
1ye
araf
ter
IPO
Sta
te-
ow
ned
No
n-s
tate
-o
wn
edS
tate
-o
wn
edN
on
-sta
te-
ow
ned
Sta
te-
ow
ned
No
n-s
tate
-o
wn
edS
tate
-o
wn
edN
on
-sta
te-
ow
ned
Sta
te-
ow
ned
No
n-s
tate
-o
wn
edS
tate
-o
wn
edN
on
-sta
te-
ow
ned
VC
(z-v
alu
e)�
0.04
6�
0.07
4�
0.01
5�
0.07
10.
019
0.13
1**
�0.
076
�0.
155*
*0.
058
�0.
062
�0.
0003
0.13
3**
(�1.
15)
(�1.
30)
(�0.
41)
(�1.
12)
(0.4
1)(2
.44)
(�1.
14)
(�2.
17)
(1.2
4)(�
0.85
)(�
0.01
)(2
.03)
Siz
e(z
-val
ue)
0.02
10.
042*
*0.
030*
0.04
7***
�0.
001
0.02
10.
028
0.04
1**
0.02
20.
051*
*0.
042*
0.02
0(1
.33)
(2.3
9)(1
.83)
(2.6
4)(�
0.08
)(1
.56)
(1.1
1)(1
.96)
(1.1
3)(2
.48)
(1.8
1)(1
.17)
Gro
wth
(z-v
alu
e)0.
110*
**
0.01
3�
0.01
90.
001
�0.
008
�0.
08***
0.12
***
0.00
6�
0.00
3�
0.02
40�
0.05
7�
0.05
8**
(3.9
7)(0
.47)
(�0.
79)
(0.0
8)(�
0.18
)(�
3.60
)(2
.64)
(0.1
8)(�
0.10
)(�
0.91
)(�
1.07
)(�
2.17
)
Lev
erag
e(z
-val
ue)
�0.
140
�0.
212*
0.00
90.
021
�0.
027
0.03
60.
003
�0.
125
�0.
005
�0.
060
�0.
064
0.05
0(�
1.58
)(�
1.89
)(0
.13)
(�0.
24)
(�0.
30)
(0.5
4)(0
.03)
(�0.
92)
(�0.
06)
(�0.
58)
(�0.
62)
(0.5
9)
Qra
tio
(z-v
alu
e)0.
028
�0.
008
�0.
009
�0.
004*
�0.
001
�0.
001
0.03
70.
011
�0.
001
�0.
005*
�0.
620
�0.
001
(1.6
1)(�
0.52
)(�
1.28
)(�
1.66
)(�
0.46
)(�
0.96
)(1
.39)
(0.6
3)(�
1.16
)(�
1.76
)(�
0.00
)(�
0.66
)
Age
(z-v
alu
e)0.
015
0.00
1�
0.03
60.
043
0.01
90.
042*
0.08
4*0.
047
0.07
0*0.
009
0.78
00.
038
(0.4
9)(0
.02)
(�1.
09)
(1.4
9)(0
.49)
(1.7
7)(1
.68)
(1.3
8)(1
.71)
(0.2
9)(0
.03)
(0.2
3)
Ind
_ad
j_ca
sh(z
-val
ue)
�0.
069*
**�
0.13
7***
�0.
123*
**�
0.16
7***
�0.
069*
*0.
001
�0.
106
�0.
143*
**
�0.
072*
**�
0.13
4***
�0.
74***
0.01
2(�
3.52
)(5
.96)
(�5.
61)
(�7.
05)
(�2.
39)
(0.0
2)(�
3.47
)(�
5.24
)(�
2.67
)(�
4.90
)(�
0.11
)(0
.55)
D_a
ud
itq
ual
ity
(z-v
alu
e)�
0.03
4�
0.03
10.
032
�0.
038*
0.00
7�
0.02
00.
011
�0.
033
0.03
1�
0.03
60.
036
�0.
029
(�1.
52)
(�1.
46)
(1.4
0)(�
1.73
)(0
.26)
(�1.
12)
(0.3
2)(�
1.34
)(1
.08)
(�1.
40)
(1.1
1)(�
1.27
)
D_u
nd
erw
rite
rqu
alit
y(z
-va
lue)
�0.
010
0.00
10.
019
0.00
9�
0.01
4�
0.02
6*�
0.01
4�
0.01
10.
049*
*0.
021
�0.
010
�0.
041*
*
(�0.
57)
(0.0
3)(1
.03)
(0.4
7)(�
0.63
)(�
1.68
)(�
0.51
)(�
0.50
)(2
.12)
(0.9
5)(�
0.41
)(�
2.02
)
Co
nst
ant
�0.
421
�0.
633*
�0.
432
�0.
948*
**
0.01
0�
0.57
0**
�0.
859*
�0.
838*
*�
0.71
3*�
0.94
1**
�0.
940*
*�
0.55
8
(z-v
alu
e)(�
1.34
)(�
1.97
)(�
1.33
)(�
2.59
)(0
.02)
(�2.
01)
(�1.
71)
(�2.
16)
(�1.
80)
(�2.
23)
(�1.
96)
(�1.
56)
N74
246
7424
674
246
7424
674
246
7424
6
Wal
dch
i238
.45
41.2
937
.32
72.4
511
.43
26.1
027
.12
42.0
519
.10
37.8
117
.89
16.9
7
Pro
b>
chi2
0.00
00.
000
0.00
00.
000
0.24
70.
002
0.00
10.
000
0.02
40.
000
0.03
70.
049
No
te:
*10
%S
ign
ifica
nce
leve
l.**
5%S
ign
ifica
nce
leve
l.***
1%S
ign
ifica
nce
leve
l.
Z. Hu et al. / China Journal of Accounting Research 5 (2012) 251–268 265

positive influence on the earnings management of state-owned enterprises in the three consecutive years. Fornon-state-owned enterprises, VC participation has a negative effect on earnings management in the pre-IPOyear, but a positive influence in the other 2 years.
Table 5 shows the second-stage regression results after controlling for sample self-selection. Due to spacelimitations, we do not report the first-stage probit regression results. The overall LR chi2 of the three regres-sions on the state-owned sample are 26.81, 29.45 and 26.32 respectively, all significant below the 1% level. ThePseudo R2 are 30%, 32.96% and 29.46% respectively. The dummy variables – high-tech and geographical loca-tion – are significantly positive below the 1% level in the regressions for each of the 3 years. For non-state-owned enterprises, the overall LR chi2 for the three regressions are 34.85, 35.49 and 35.36 respectively,all below the 1% level. The Pseudo R2 are 10.79%, 10.99% and 10.94% respectively. The dummy variables –high-tech and geographical location – are also significantly positive in the regressions for all 3 years andsignificant below the 1%, 1% and 10% levels.
According to Table 5, in the state-owned sample, the participation of VCs has a weak effect on earningsmanagement in all 3 years. None of the regression coefficients for earnings management on VC a1 are signif-icant. In the regression of discretionary accruals estimated by the cross-sectional modified Jones model, itseems that VC participation weakly reduces earnings management in the pre-IPO and the IPO year, withthe gap between VC-backed and non-VC-backed firms narrowing. In the post-IPO year, the earningsmanagement of VC-backed firms is higher than that of non-VC-backed firms. For the regression of perfor-mance-matched discretionary accruals, none of the regression coefficients for earnings management on VCa1 are significant. VC participation weakly reduces earnings management in the pre-IPO and the post-IPOyears, and increases it in the IPO year.
For non-state-owned enterprises, VC participation significantly influences earnings management in thepost-IPO year. In the pre-IPO year, VC participation reduces performance-matched discretionary accrualsat the 5% significance level and also reduces discretionary accruals estimated by the cross-sectional modifiedJones model. Although insignificant, the regression coefficients for discretionary accruals estimated by thecross-sectional modified Jones model (performance-matched discretionary accruals) on VC a1 are �0.155(�0.074). In the IPO year, the reduction in earnings management as a result of VC participation is furtherweakened. The regression coefficients for discretionary accruals estimated by the cross-sectional modifiedJones model (performance-matched discretionary accruals) on VC a1 are �0.071 (�0.062), both not signifi-cant. However, in the post-IPO year, the participation of VCs increases the earnings management of portfoliofirms and the regression coefficients for discretionary accruals estimated by the cross-sectional modified Jonesmodel (performance-matched discretionary accruals) on VC a1 are 0.131 (0.133), significant at the 5% (5%)level. Combined with the discussion on Hypothesis 1, we believe that the participation of VCs in non-state-owned enterprises, compared with state-owned enterprises, has more effect on earnings management beforeand after the expiration of the lock-up period. Therefore, Hypothesis 2 is also supported.
We also conduct the following robustness tests: first, we use the Jones model to estimate earnings manage-ment; second, we measure firm size by sales; and third, we use growth in net income as a proxy for the growthof IPO firms. The results are consistent with those reported.
5. Conclusions
We use a sample of IPO firms in the SME Board and GEM between 2005 and 2009, and establish a two-stage treatment effect model to control for the sample self-selection problem. We investigate the participationof VCs in the earnings management of portfolio firms in the year before IPO, the IPO year and the year afterIPO. We reach the following conclusions.
(1) To increase accounting earnings in the year in which the lock-up period expires, the participation of VCslowers earnings management, especially in the pre-IPO year, and increases earnings management in thepost-IPO year.
(2) Compared with state-owned IPO companies, the participation of VCs has more effect on earnings man-agement before and after the expiration of the lock-up period in non-state-owned enterprises. In the sub-sample of state-owned enterprises, VC participation has no significant effect on earnings management
266 Z. Hu et al. / China Journal of Accounting Research 5 (2012) 251–268

from the pre-IPO year to the post-IPO year. However, for non-state-owned enterprises, the participationof VCs significantly reduces earnings management in the pre-IPO year. This results in a significant rever-sal in discretionary accruals estimated by the cross-sectional modified Jones model and performance-matched discretionary accruals in the year of the expiration of lock-up period.
Thus, we provide a comprehensive investigation of the effect of the participation of VCs on the accountinginformation quality of IPO firms before and after the expiration of the lock-up period. We reach the conclu-sion that under China’s current institutional background, the involvement of VCs in IPO firms reflects a moralhazard role rather than a certification/monitoring role. This conclusion is important for the decision makingof investors and policymakers. First, due to self-interest, the participation of VCs is more for speculative pur-poses. They collude with the management of portfolio companies or put pressure on the portfolio firms’ man-agement using their own professional advantages and social networks, to reduce earnings management beforethe expiration of the lock-up period and to reverse accounting earnings after the expiration of the lock-up per-iod. Investors, therefore, should not blindly follow the behavior of VCs. Second, to increase the incentive ofVCs to positively monitor their portfolio firms, regulators should not only strengthen the supervision of VCsand establish appropriate punishment mechanisms to regulate their speculative behavior, but should alsoestablish guidance and motivation systems to increase VCs’ motivation to obtain investment returns by pro-viding R&D support, help with sales and purchase channels, management improvements and other value-added services. Finally, government should improve the financing environment of non-state-owned enterprisesand establish appropriate mechanisms to solve the problem of financing bottlenecks in non-state-owned enter-prises so that the negative effects of venture capitalists’ involvement in non-state-owned enterprises can bereduced.
As this paper does not test the effect of reputation and other characteristics of VCs on the accounting infor-mation quality of IPO firms, this would be an interesting future research direction.
Acknowledgment
This study was supported by the project “The Role of Private Equity in the GEM IPO” (No. FRF-TP-12-122A) funded by the Fundamental Research Funds for the Central Universities.
References
Agrawal, A., Cooper, T., 2009. Accounting Scandals in IPO Firms: Do Underwriters and VCs Help? Culverhouse College of Business,University of Alabama. Working Paper.
Baker, M., Gompers, P., 2003. The determinants of board structure at the initial public offering. Journal of Law and Economics 46, 569–598.
Ball, R., Shivakumar, L., 2005. Earnings quality in UK private firms: comparative loss recognition timeliness. Journal of Accounting andEconomics 39, 83–128.
Ball, R., Shivakumar, L., 2008. Earnings quality at initial public offerings. Journal of Accounting and Economics 45, 324–349.Barry, C., Muscarella, C., Peavy, J., Vetsuypens, M., 1990. The role of venture capital in the creation of public companies: evidence from
the going-public process. Journal of Financial Economics 27, 447–472.Brandt, L., Li, H.B., 2003. Bank discrimination in transition economies: ideology, information or incentives? Journal of Comparative
Economics 31, 387–413.Bruton, G.D., Ahlstrom, D., 2003. An institutional view of china’s venture capital industry: explaining the difference between China and
the West. Journal of Business Venturing 18, 233–259.Cao, J.X., 2009. Are Buyout Sponsors Market Timers in RLBO? Singapore Management University. Working Paper.Cohen, D.A., Langberg, N., 2006. Venture Capital Financing and the Informativeness of Earnings. SSRN Working Paper.Chemmanur, T.J., Loutskina, E., 2007. The Role of Venture Capital Backing in Initial Public Offerings: Certification. Screening or Market
Power. SSRN Working paper.Chou, D., Gombola, M., Liu, F., 2006. Earnings management and stock performance of reverse leveraged buyouts. Journal of Financial
and Quantitative Analysis 41, 407–438.Darrough, M., Rangan, S.P., 2005. Do insiders manipulate earnings when they sell their shares in an initial public offering? Journal of
Accounting Research 43, 1–33.Hochberg, Y.V., 2003. Venture Capital and Corporate Governance in the Newly Public Firm. AFA 2004 San Diego Meetings.Gioielli, S.O., Carvalho, D., Antonio, G., 2008. The Dynamics of Earnings Management in IPOs and the Role of Venture Capital.
Fundacao Getulio Vargas School of Business. Working Paper.
Z. Hu et al. / China Journal of Accounting Research 5 (2012) 251–268 267

Gompers, P., 1996. Grandstanding in the venture capital industry. Journal of Financial Economics 42, 133–156.Greene, W.H., 2003. Econometric Analysis. Prentice Hall Business Publishing, Upper Saddle River, NJ.Kothari, S.P., Leone, A.J., Wasley, C.E., 2005. Performance matched discretionary accrual measures. Journal of Accounting and
Economics 39, 163–197.Katz, S.P., 2009. Earnings quality and ownership structure: the role of private equity sponsors. Accounting Review 84, 621–658.Lee, P.M., Wahal, S., 2004. Grandstanding, certification and the underpricing of venture capital backed IPOs. Journal of Financial
Economics 73, 375–407.Lerner, J., 1995. Venture capitalists and the oversight of private firms. Journal of Finance 50, 301–318.Morsfield, S.G., Tan, C.E.L., 2006. Do venture capitalists influence the decision to manage earnings in initial public offerings? Accounting
Review 81, 1119–1150.Sahlman, W.A., 1990. The structure and governance of venture-capital organizations. Journal of Financial Economics 27, 473–521.Scott, W.R., 1987. The adolescence of institutional theory. Administrative Science Quarterly 32, 493–511.Scott, W.R., 1995. Institutions and Organizations. Sage Publications, Thousand Oaks, CA.Teoh, S.H., Welch, I., Wong, T.J., 1998. Earnings management and the long-run performance of initial public offerings. Journal of
Finance 53, 1935–1974.Wongsunwai, W., 2007. Does Venture Capitalist Quality Affect Corporate Governance? Stanford Graduate School of Business. Working
Paper.Chen, G., Yu, X., Kou, X., 2011. The participation of VCs on the IPO discount of enterprises in China: a comparison of different markets.
Economic Research Journal 5, 74–85.Fang, J., 2010. Are non-state-owned listed company discriminated in bank loan? Management World 11, 123–131.Gao, M., Cai, W., 2011. Report on the Financial Governance Index of Listed Companies in China. Economic Science Press, BJ.Hao, S., Tao, H., Tian, J., 2011. A comparison study of the state-owned enterprises of different ownership structures: take Shandong
province as example. China Industrial Economic Journal 9, 130–139.Hu, Z., Bu, Y., 2012. The Effect of Political Connection of Venture Capital on the Possibility of Successful IPO. University of Science and
Technology of Beijing. Working Paper.Li, P., Shen, Y., 2010. The governance effect of media: evidence from China. Economic Research Journal 4, 14–27.Xu, H., Chen, C., 2009. Accounting earnings quality, IPO pricing and long-term performance: evidence from the IPO after IPO reform.
Management World 8, 25–38.Xue, S., 2002. How are the stock prices of loss listed companies determined? China Accounting and Financial Research 4, 100–115.Yu, Z., Tian, G., Qi, B., Zhang, H., 2010. The corporate governance mechanism of media focus based on the view of earnings
management. Management World 9, 127–140.
268 Z. Hu et al. / China Journal of Accounting Research 5 (2012) 251–268