aim higher! newyork · · 2010-03-03performance indicators to aim higher! ... question in the...
TRANSCRIPT


AIM Higher!
NewYork Mathematics
Standards Correlation UpdateReview

Copyright © 2005 by Great Source Education Group, a division of Houghton Mifflin Company.All rights reserved.
Great Source®, AIM Higher®, and More than just teaching to the test® are registered trademarks ofHoughton Mifflin Company.
First Edition
Printed in the United States of America
1 2 3 4 5 6 7 8 9 10 10 09 08 07 06 05
International Standard Book Number: 1-58171-696-6
Editorial
Diane Perkins CastroMark Roop-Kharasch
Design & Production
Paige Larkin
Consultant
Jeri Lawless

Table of Contents iii
A Note to the Teacher . . . . . . . . . . . . . . . . . . . . . . . . . . . . . . . . . . . . . . . 1
Grade 3
Correlations of New York State Mathematics Performance Indicators to AIM Higher! Lessons . . . . . . . . . . . . . . . . . 2
Correlations of AIM Higher! Lessons to New York State Mathematics Performance Indicators . . . . . . . . . . . . . 5
Correlations of AIM Higher! Test Questions toNew York State Mathematics Performance Indicators . . . . . . . . . . . . . 7
Grade 4
Correlations of New York State Mathematics Performance Indicators to AIM Higher! Lessons . . . . . . . . . . . . . . . . . 9
Correlations of AIM Higher! Lessons to New York State Mathematics Performance Indicators . . . . . . . . . . . . 13
Correlations of AIM Higher! Test Questions toNew York State Mathematics Performance Indicators . . . . . . . . . . . . 15
Grade 5
Correlations of New York State Mathematics Performance Indicators to AIM Higher! Lessons . . . . . . . . . . . . . . . . 17
Correlations of AIM Higher! Lessons to New York State Mathematics Performance Indicators . . . . . . . . . . . . 22
Correlations of AIM Higher! Test Questions toNew York State Mathematics Performance Indicators . . . . . . . . . . . . 24
Grade 6
Correlations of New York State Mathematics Performance Indicators to AIM Higher! Lessons . . . . . . . . . . . . . . . . 26
Correlations of AIM Higher! Lessons to New York State Mathematics Performance Indicators . . . . . . . . . . . . 31
Correlations of AIM Higher! Test Questions toNew York State Mathematics Performance Indicators . . . . . . . . . . . . 33
CONTENTS

iv AIM Higher! New York Mathematics Review
Grade 7
Correlations of New York State Mathematics Performance Indicators to AIM Higher! Lessons . . . . . . . . . . . . . . . . 35
Correlations of AIM Higher! Lessons to New York State Mathematics Performance Indicators . . . . . . . . . . . . 40
Correlations of AIM Higher! Test Questions toNew York State Mathematics Performance Indicators . . . . . . . . . . . . 42
Grade 8
Correlations of New York State Mathematics Performance Indicators to AIM Higher! Lessons . . . . . . . . . . . . . . . . 44
Correlations of AIM Higher! Lessons to New York State Mathematics Performance Indicators . . . . . . . . . . . . 48
Correlations of AIM Higher! Test Questions toNew York State Mathematics Performance Indicators . . . . . . . . . . . . 50

1
In July of 1996, the New York State Board ofRegents approved the statewide Learning Stan-dards in seven subject areas, including mathe-
matics. The NYS Mathematics Core Curriculumwas designed around seven key ideas: MathematicalReasoning, Number and Numeration, Operations,Modeling and Multiple Representation, Measure-ment, Uncertainty, and Patterns/Functions. Theaccompanying Performance Indicators specifiedwhat students should know and be able to do at each grade-level block: PK–K, 1–2, 3–4, 5–6, 7–8,and Commencement. State tests were given at theelementary, intermediate, and commencement levelsto assess how well New York students were meetingthese expectations.
In response to No Child Left Behind and theurgent need to bring students up to higher levels ofmathematical competency, the state has completelyrevamped its mathematics standard. Rather thanbeing organized into seven Key Ideas, the mathexpectations are divided into Content Strands andProcess Strands, each with its own PerformanceIndicators. The content strands (Number Sense andOperations, Algebra, Geometry, Measurement, andStatistics and Probability) describe the specific skillsthat students should learn at each level. The processstrands (Problem Solving, Reasoning and Proof,Communication, Connections, and Representation)show how the content knowledge can be integratedand applied. These new content and process strandsalign very closely with the recommendations of theNational Council of Teachers of Mathematics(Principles and Standards for School Mathematics,NCTM, 2000).
First published in 2004, the AIM Higher! NewYork Mathematics Review series for grades 3–8 hasextensive correlations to the New York Key Ideas(the standard at that time), but the content andpedagogy of the lessons are aligned with theNCTM standards. This means that the books in theAIM Higher! series already match the new mathstandards for New York State very closely.
Specific correlations of the AIM Higher! series tothe Content Strands of the new state standards formathematics are provided in this booklet. For eachgrade level, there are three sets of correlations: 1) thelessons that treat each Performance Indicator, 2) thePerformance Indicators addressed in each lesson,and 3) the Performance Indicators assessed by eachquestion in the Pretest and Posttest.
Unlike the old Key Ideas, which were organizedby grade band (3–4, 5–6, etc.), the new standards aregrade-specific; each individual grade (PK–8) has itsown set of Performance Indicators. This new systemspecifies what is to be taught at each level andclarifies the progression of skills to be introduced.
The AIM Higher! books follow the sequence ofboth the NCTM standards and the revised New Yorkstandards. However, some lessons cover topics thatpreviously were included in the corresponding gradeband but are not assessed in that particular gradenow. As explained in the note that accompanies thecorrelations charts, these lessons can be used forenrichment, for more advanced students, and/or toprepare for the following year. Or you may choose toskip those lessons entirely. Consider them a freebonus—just another opportunity to do much morethan just teaching to the test!
A NOTE TO THE TEACHER
Notes: Occasionally, lessons or questions will deal with concepts and skills that students should have mastered inan earlier grade. In that case, the lessons or questions are correlated to Performance Indicators for the previousgrade. Use this material for review, as necessary. Keep in mind that students may be tested on skills they havelearned in earlier grades.
Virtually all of mathematics involves problem solving in some sense, so correlations to the Problem Solving strandare given only when a lesson or a question focuses specifically on problem-solving strategies.

Performance Indicator Lessons
Students will understand numbers, multiple ways of representing numbers, relationships among numbers,and number systems.
Number Systems3.N.1 Skip count by 25’s, 50’s, 100’s to 1,000 3.1
3.N.2 Read and write whole numbers to 1,000 2.1, 2.2
3.N.3 Compare and order numbers to 1,000 2.1, 2.2
3.N.4 Understand the place value structure of the base ten number system:10 ones = 1 ten10 tens = 1 hundred10 hundreds = 1 thousand 2.1
3.N.5 Use a variety of strategies to compose and decompose three-digit numbers 2.3–2.5
3.N.6 Use and explain the commutative property of addition and multiplication 2.3
3.N.7 Use 1 as the identity element for multiplication 2.6
3.N.8 Use the zero property of multiplication 2.6
3.N.9 Understand and use the associative property of addition 2.3
3.N.10 Develop an understanding of fractions as part of a whole unit and as parts of a collection 2.11
3.N.11 Use manipulatives, visual models, and illustrations to name and represent unit fractions (1/2, 1/3, 1/4, 1/5, 1/6, and 1/10) as part of a whole or a set of objects 2.11
3.N.12 Understand and recognize the meaning of numerator and denominator in the symbolic form of a fraction 2.11
3.N.13 Recognize fractional numbers as equal parts of a whole 2.11
3.N.14 Explore equivalent fractions (1/2, 1/3, 1/4) 2.11
3.N.15 Compare and order unit fractions (1/2, 1/3, 1/4) and find their approximate locations on a number line 2.11
Number Theory3.N.16 Identify odd and even numbers 2.8
3.N.17 Develop an understanding of the properties of odd/even numbers as a result of addition or subtraction 2.3, 2.8
Students will understand meanings of operations and procedures, and how they relate to one another.
Operations3.N.18 Use a variety of strategies to add and subtract 3-digit numbers (with and without
regrouping) 2.4, 2.5
3.N.19 Develop fluency with single-digit multiplication facts 2.7
3.N.20 Use a variety of strategies to solve multiplication problems with factors up to 12 × 12 2.6, 2.7, 3.4
NUMBER SENSE AND OPERATIONS STRAND
continued
2 AIM Higher! New York Mathematics Review
CORRELATIONS OF NEW YORK STATE MATHEMATICSPERFORMANCE INDICATORS TO AIM HIGHER! LESSONS: GRADE 3

3.N.21 Use the area model, tables, patterns, arrays, and doubling to provide meaning for multiplication 2.6, 3.4, 5.4
3.N.22 Demonstrate fluency and apply single-digit division facts 2.8
3.N.23 Use tables, patterns, halving, and manipulatives to provide meaning for division 2.8, 3.4
3.N.24 Develop strategies for selecting the appropriate computational and operational method in problem solving situations 1.2
Students will compute accurately and make reasonable estimates.
Estimation3.N.25 Estimate numbers up to 500 2.9, 2.10
3.N.26 Recognize real world situations in which an estimate (rounding) is more appropriate 2.9, 2.10, 6.6
3.N.27 Check reasonableness of an answer by using estimation 2.9, 2.10
NUMBER SENSE AND OPERATIONS STRAND, cont.
Performance Indicator Lessons
Students will perform algebraic procedures accurately.
Equations and Inequalities3.A.1 Use the symbols <, >, = (with and without the use of a number line) to compare
whole numbers and unit fractions (1/2, 1/3, 1/4, 1/5, 1/6, and 1/10) 2.1, 2.11
Students will recognize, use, and represent algebraically patterns, relations, and functions.
Patterns, Relations, and Functions3.A.2 Describe and extend numeric (+, −) and geometric patterns 3.1, 3.2
ALGEBRA STRAND
Performance Indicator Lessons
Students will use visualization and spatial reasoning to analyze characteristics and properties of geometric shapes.
Shapes3.G.1 Define and use correct terminology when referring to shapes (circle, triangle, square,
rectangle, rhombus, trapezoid, and hexagon) 4.1, 4.2
3.G.2 Identify congruent and similar figures 4.1, 4.4, 4.5
3.G.3 Name, describe, compare, and sort three-dimensional shapes: cube, cylinder, sphere,prism, and cone 4.1, 4.3
3.G.4 Identify the faces on a three-dimensional shape as two-dimensional shapes 4.1, 4.3
Students will apply transformations and symmetry to analyze problem solving situations.
Transformational Geometry3.G.5 Identify and construct lines of symmetry 4.5
GEOMETRY STRAND
Correlation Charts 3
GRADE 3
continued

Performance Indicator Lessons
Students will determine what can be measured and how, using appropriate methods and formulas.
Units of Measurement3.M.1 Select tools and units (customary) appropriate for the length measured 5.1, 6.6
3.M.2 Use a ruler/yardstick to measure to the nearest standard unit (whole and 1/2 inches,whole feet, and whole yards) 5.1, 5.3
3.M.3 Measure objects, using ounces and pounds 5.7
3.M.4 Recognize capacity as an attribute that can be measured 5.6
3.M.5 Compare capacities (e.g., Which contains more? Which contains less?) 5.6
3.M.6 Measure capacity, using cups, pints, quarts, and gallons 5.6
Students will use units to give meaning to measurements.
Units3.M.7 Count and represent combined coins and dollars, using currency symbols ($0.00) 5.10
3.M.8 Relate unit fractions to the face of the clock:Whole = 60 minutes; 1/2 = 30 minutes; 1/4 = 15 minutes 5.8
Students will develop strategies for estimating measurements.
Estimation3.M.9 Tell time to the minute, using digital and analog clocks 5.8
3.M.10 Select and use standard (customary) and non-standard units to estimate measurements 5.1, 5.2, 6.6
MEASUREMENT STRAND
Performance Indicator Lessons
Students will collect, organize, display, and analyze data.
Collection of Data3.S.1 Formulate questions about themselves and their surroundings 6.1, 6.2, 6.3
3.S.2 Collect data using observation and surveys, and record appropriately 3.3
Organization and Display of Data3.S.3 Construct a frequency table to represent a collection of data 3.3
3.S.4 Identify the parts of pictographs and bar graphs 6.1, 6.2
3.S.5 Display data in pictographs and bar graphs 6.1, 6.2
3.S.6 State the relationships between pictographs and bar graphs 6.1, 6.2
Analysis of Data3.S.7 Read and interpret data in bar graphs and pictographs 6.1, 6.2
Students will make predictions that are based upon data analysis.
Predictions from Data3.S.8 Formulate conclusions and make predictions from graphs 6.1, 6.2, 6.3
STATISTICS AND PROBABILITY STRAND
4 AIM Higher! New York Mathematics Review
GRADE 3

CORRELATIONS OF AIM HIGHER! LESSONS TONEW YORK STATE MATHEMATICS PERFORMANCE INDICATORS
Lesson Performance Indicators
1.1 Word Problems Problem Solving
1.2 Strategies for Solving Problems Problem Solving, 3.N.24
1.3 Words with Special Math Meanings Problem Solving
2.1 Place Value 3.N.1–N.4, 3.A.1
2.2 Comparing and Ordering Numbers 3.N.2, 3.N.3
2.3 The Meaning of Addition and Subtraction 3.N.5, 3.N.6, 3.N.9, 3.N.17
2.4 Adding Whole Numbers 3.N.5, 3.N.18
2.5 Subtracting Whole Numbers 3.N.6, 3.N.18
2.6 The Meaning of Multiplication 3.N.7, 3.N.8, 3.N.20, 3.N.21
2.7 Multiplying Whole Numbers 3.N.19, 3.N.20
2.8 The Meaning of Division 3.N.16, 3.N.17, 3.N.22, 3.N.23
2.9 Rounding Whole Numbers 3.N.25, 3.N.26, 3.N.27
2.10 Estimating Sums and Differences 3.N.25, 3.N.26, 3.N.27
2.11 Fractions 3.N.10–3.N.15, 3.A.1
3.1 Identifying Patterns 3.A.2
3.2 Patterns with Paired Numbers 3.A.2
3.3 Change over Time 3.S.2, 3.S.3
3.4 Solving Number Sentences 3.N.20, 3.N.21
4.1 Basic Geometric Figures 3.G.1–3.G.4
4.2 Two-Dimensional Shapes 3.G.1
4.3 Three-Dimensional Shapes 3.G.3, 3.G.4
4.4 Congruent Shapes 3.G.2
4.5 Symmetry 3.G.5
4.6 Plotting Points *See note.
4.7 Transforming Shapes 2.G.5
5.1 Measuring Length: Customary Units 3.M.1, 3.M.2, 3.M.10
5.2 Measuring Length: Metric Units *See note.
5.3 Measuring Perimeter 3.M.2
5.4 Measuring Area 3.N.21
5.5 Measuring Volume *See note.
Correlation Charts 5
GRADE 3: PERFORMANCE INDICATORS ADDRESSED
*Optional: The concepts and skills in this lesson are not assessed in grade 3. This material may be used for enrichment, to challenge more advanced students, and/or as preparation for grade 4.
continued

6 AIM Higher! New York Mathematics Review
*Optional: The concepts and skills in this lesson are not assessed in grade 3. This material may be used for enrichment, to challenge more advanced students, and/or as preparation for grade 4.
Lesson Performance Indicators
5.6 Measuring Capacity 3.M.4–3.M.6
5.7 Measuring Mass and Weight 3.M.3
5.8 Measuring Time 3.M.8, 3.M.9
5.9 Measuring Temperature *See note.
5.10 Counting Money 3.M.7
6.1 Organizing Data: Bar Graphs 3.S.4–3.S.8
6.2 Organizing Data: Pictographs 3.S.4–3.S.8
6.3 Organizing Data: Line Graphs *See note.
6.4 Range, Median, and Mode *See note.
6.5 Probability *See note.
6.6 Uncertainty 3.N.26, 3.M.1, 3.M.10
GRADE 3: PERFORMANCE INDICATORS ADDRESSED
CORRELATIONS OF AIM HIGHER! LESSONS TONEW YORK STATE MATHEMATICS PERFORMANCE INDICATORS (CONT.)

Correlation Charts 7
CORRELATIONS OF AIM HIGHER! TEST QUESTIONS TONEW YORK STATE MATHEMATICS PERFORMANCE INDICATORS
This question corresponds to thison the Pretest Performance Indicator:
Session 1
1 Problem Solving, 3.N.24
2 3.N.10–N.12
3 3.N.20
4 3.G.4
5 3.N.3
6 5.G.12
7 3.M.1, 3.M.2
8 3.S.8
9 3.M.10
10 3.G.2
11 3.N.3
12 3.S.7
13 2.G.5
14 3.N.4
15 3.S.7
16 3.N.24
17 3.N.15
18 3.N.11
19 3.M.1, 3.M.10
20 5.G.12
21 3.A.1
22 3.N.24
23 3.A.2
24 3.N.19, 3.N.20, 3.N.22, 3.N.23
25 3.G.2
This question corresponds to thison the Pretest Performance Indicator:
26 3.N.11
27 3.M.9
28 3.N.22, 3.S.7, 3.S.8
29 3.S.8
30 3.M.7
Session 2
31 3.G.4
32 3.N.22, 3.N.24
33 3.M.10
34 3.N.22
35 3.N.20, 3.N.24
36 3.A.2
37 3.G.1
38 3.N.25, 3.N.26
39 3.N.20, 3.A.2
Session 3
40 3.N.24
41 3.N.20
42 3.M.1, 3.M.2
43 3.A.2
44 3.N.18, 3.N.25
45 3.N.23
46 3.N.20, 3.N.24
47 3.N.11, 3.N.24
48 3.G.12, 5.G.12
GRADE 3: PRETEST

8 AIM Higher! New York Mathematics Review
This question corresponds to thison the Pretest Performance Indicator:
Session 1
1 3.G.5
2 3.N.19
3 3.N.24
4 3.G.4
5 3.S.8
6 3.A.2
7 3.N.22
8 3.M.3
9 3.N.18
10 3.A.2
11 3.N.11
12 2.G.5
13 3.M.7
14 3.M.1
15 3.N.3
16 3.S.7, 3.S.8
17 3.A.2
18 3.S.7, 3.S.8
19 3.N.22
20 3.N.18, 3.N.24
21 5.G.12
22 3.G.2
23 3.N.3, 3.A.1
24 3.M.3
25 2.G.5
This question corresponds to thison the Posttest Performance Indicator:
26 3.N.22
27 3.S.7, 3.S.8
28 3.N.11
29 3.M.10
30 3.S.7, 3.S.8
Session 2
31 3.G.5
32 3.N.27
33 3.M.1, 3.M.2
34 3.N.11
35 3.N.4, 3.N.5
36 3.N.24
37 3.N.11, 3.N.15, 3.A.1
38 3.A.2, 3.S.2, 3.S.8
39 3.S.2
Session 3
40 3.N.9
41 3.N.25
42 3.G.5
43 3.N.22, 3.N.24
44 3.M.7
45 3.S.8
46 3.N.19, 3.N.22, 3.N.24
47 3.N.20, 3.N.24, 3.M.2
48 3.N.24, 3.M.6
GRADE 3: POSTTEST
CORRELATIONS OF AIM HIGHER! TEST QUESTIONS TONEW YORK STATE MATHEMATICS PERFORMANCE INDICATORS

Correlation Charts 9
Performance Indicator Lessons
Students will understand numbers, multiple ways of representing numbers, relationships among numbers,and number systems.
Number Systems4.N.1 Skip count by 1,000’s 2.1
4.N.2 Read and write whole numbers to 10,000 2.1
4.N.3 Compare and order numbers to 10,000 2.1
4.N.4 Understand the place value structure of the base ten number system:10 ones = 1 ten10 tens = 1 hundred10 hundreds = 1 thousand10 thousands = 1 ten thousand 2.1
4.N.5 Recognize equivalent representations for numbers up to four digits and generate them by decomposing and composing numbers 2.1
4.N.6 Understand, use, and explain the associative property of multiplication 2.4
4.N.7 Develop an understanding of fractions as locations on number lines and as divisions of whole numbers 2.11, 2.13
4.N.8 Recognize and generate equivalent fractions (halves, fourths, thirds, fifths, sixths, and tenths) using manipulatives, visual models, and illustrations 2.11–2.13
4.N.9 Use concrete materials and visual models to compare and order unit fractions or fractions with the same denominator (with and without the use of a number line) 2.11
4.N.10 Develop an understanding of decimals as part of a whole 2.8
4.N.11 Read and write decimals to hundredths, using money as a context 2.10
4.N.12 Use concrete materials and visual models to compare and order decimals (less than 1) to the hundredths place in the context of money 2.10
Number Theory4.N.13 Develop an understanding of the properties of odd/even numbers as a result of
multiplication 3.1
Students will understand meanings of operations and procedures, and how they relate to one another.
Operations4.N.14 Use a variety of strategies to add and subtract numbers up to 10,000 2.2, 2.3
4.N.15 Select appropriate computational and operational methods to solve problems 1.2
4.N.16 Understand various meanings of multiplication and division 2.4, 3.4
4.N.17 Use multiplication and division as inverse operations to solve problems 2.5–2.7
4.N.18 Use a variety of strategies to multiply two-digit numbers by one-digit numbers (with and without regrouping) 2.5
NUMBER SENSE AND OPERATIONS STRAND
CORRELATIONS OF NEW YORK STATE MATHEMATICSPERFORMANCE INDICATORS TO AIM HIGHER! LESSONS: GRADE 4
continued

10 AIM Higher! New York Mathematics Review
GRADE 4
4.N.19 Use a variety of strategies to multiply two-digit numbers by two-digit numbers (with and without regrouping) 2.5, 3.1
4.N.20 Develop fluency in multiplying and dividing multiples of 10 and 100 up to 1,000 3.1
4.N.21 Use a variety of strategies to divide two-digit dividends by one-digit divisors (with and without remainders) 2.6, 2.7
4.N.22 Interpret the meaning of remainders 2.7
4.N.23 Add and subtract proper fractions with common denominators 2.11, 2.12
4.N.24 Express decimals as an equivalent form of fractions to tenths and hundredths 2.8, 2.13
4.N.25 Add and subtract decimals to tenths and hundredths using a hundreds chart 2.9, 2.10
Students will compute accurately and make reasonable estimates.
Estimation4.N.26 Round numbers less than 1,000 to the nearest tens and hundreds 2.14, 2.15, 6.5
4.N.27 Check reasonableness of an answer by using estimation 2.14, 2.15
NUMBER SENSE AND OPERATIONS STRAND, cont.
Performance Indicator Lessons
Students will represent and analyze algebraically a wide variety of problem solving situations.
Variables and Expressions4.A.1 Evaluate and express relationships using open sentences with one operation 2.2–2.4, 2.6
Students will perform algebraic procedures accurately.
Equations and Inequalities4.A.2 Use the symbols <, >, =, and ≠ (with and without the use of a number line) to compare
whole numbers and unit fractions and decimals (up to hundredths) 2.8
4.A.3 Find the value or values that will make an open sentence true, if it contains < or > 2.2–2.4, 2.6
Students will recognize, use, and represent algebraically patterns, relations, and functions.
Patterns, Relations, and Functions4.A.4 Describe, extend, and make generalizations about numeric (+, −, ×, ÷) and geometric
patterns 3.1–3.3
4.A.5 Analyze a pattern or a whole-number function and state the rule, given a table or an input/output box 3.2, 3.3
ALGEBRA STRAND
continued

Correlation Charts 11
GRADE 4
continued
Performance Indicator Lessons
Students will determine what can be measured and how, using appropriate methods and formulas.
Units of Measurement4.M.1 Select tools and units (customary and metric) appropriate for the length being measured 5.1
4.M.2 Use a ruler to measure to the nearest standard unit (whole, 1/2 and 1/4 inches, whole feet, whole yards, whole centimeters, and whole meters) 5.1, 6.5
4.M.3 Know and understand equivalent standard units of length: 12 inches = 1 foot;3 feet = 1 yard 5.1
4.M.4 Select tools and units appropriate to the mass of the object being measured (grams and kilograms) 5.6
4.M.5 Measure mass, using grams 5.6
4.M.6 Select tools and units appropriate to the capacity being measured (milliliters and liters) 5.5
4.M.7 Measure capacity, using milliliters and liters 5.5
Students will use units to give meaning to measurements.
Units4.M.8 Make change, using combined coins and dollar amounts 2.10
4.M.9 Calculate elapsed time in hours and half hours, not crossing a.m./p.m. 5.8
4.M.10 Calculate elapsed time in days and weeks, using a calendar 5.8
MEASUREMENT STRAND
Performance Indicator Lessons
Students will use visualization and spatial reasoning to analyze characteristics and properties of geometric shapes.
Shapes4.G.1 Identify and name polygons, recognizing that their names are related to the number of
sides and angles (triangle, quadrilateral, pentagon, hexagon, and octagon) 4.1–4.3
4.G.2 Identify points and line segments when drawing a plane figure 4.1
4.G.3 Find perimeter of polygons by adding sides 5.2
4.G.4 Find the area of a rectangle by counting the number of squares needed to cover the rectangle 5.3
4.G.5 Define and identify vertices, faces, and edges of three-dimensional shapes 4.1, 4.4
Students will identify and justify geometric relationships, formally and informally.
Geometric Relationships4.G.6 Draw and identify intersecting, perpendicular, and parallel lines 4.1
4.G.7 Identify points and rays when drawing angles 4.1
4.G.8 Classify angles as acute, obtuse, right, and straight 4.1, 4.2
GEOMETRY STRAND

12 AIM Higher! New York Mathematics Review
GRADE 4
Performance Indicator Lessons
Students will collect, organize, display, and analyze data.
Collection of Data4.S.1 Design investigations to address a question from given data 6.1
4.S.2 Collect data using observations, surveys, and experiments and record appropriately 6.1
Organization and Display of Data4.S.3 Represent data using tables, bar graphs, and pictographs 6.1
Analysis of Data4.S.4 Read and interpret line graphs 6.2
Students will make predictions that are based upon data analysis.
Predictions from Data4.S.5 Develop and make predictions that are based on data 6.1, 6.2, 6.4
4.S.6 Formulate conclusions and make predictions from graphs 6.1, 6.2
STATISTICS AND PROBABILITY STRAND

Correlation Charts 13
CORRELATIONS OF AIM HIGHER! LESSONS TONEW YORK STATE MATHEMATICS PERFORMANCE INDICATORS
Lesson Performance Indicators
1.1 Reasoning about Word Problems Problem Solving
1.2 Problem-Solving Strategies Problem Solving, 4.N.15
1.3 Understanding Mathematical Language Problem Solving
2.1 Place Value 4.N.2–4.N.5
2.2 Adding Whole Numbers 4.N.14, 4.A.1, 4.A.3
2.3 Subtracting Whole Numbers 4.N.14, 4.A.1, 4.A.2
2.4 The Meaning of Multiplication 4.N.6, 4.N.16, 4.A.1, 4.A.3
2.5 Multiplying Whole Numbers 4.N.17, 4.N.18, 4.N.19
2.6 The Meaning of Division 4.N.17, 4.N.21, 4.A.1, 4.A.3
2.7 Dividing Whole Numbers 4.N.17, 4.N.21, 4.N.22
2.8 Decimal Place Value 4.N.10, 4.N.24, 4.A.3
2.9 Adding and Subtracting Decimals 4.N.25
2.10 Decimals and Money 4.N.11, 4.N.12, 4.N.25, 4.M.8
2.11 Fractions and Mixed Numbers 4.N.7–4.N.9, 4.N.23
2.12 Operations with Fractions 4.N.8, 4.N.23
2.13 Uses of Fractions 4.N.7, 4.N.8, 4.N.24
2.14 Estimating Sums and Differences 4.N.14, 4.N.26, 4.N.27
2.15 Estimating Products and Quotients 4.N.21, 4.N.26, 4.N.27
3.1 Multiplication Patterns 4.N.13, 4.N.19, 4.N.20, 4.A.4
3.2 Ordered Pairs 4.A.4, 4.A.5
3.3 Sequences 4.A.4, 4.A.5
3.4 Variables, Properties, and Equations 4.N.16
4.1 The Building Blocks of Shapes 4.G.1, 4.G.2, 4.G.6–4.G.8
4.2 Two-Dimensional Shapes: Basic Forms 4.G.1, 4.G.8
4.3 Two-Dimensional Shapes: Other Polygons 4.G.1
4.4 Three-Dimensional Shapes 4.G.5
4.5 Transformations *See note.
4.6 Congruent and Similar Shapes 3.G.2
4.7 Symmetry 3.G.5
GRADE 4 PERFORMANCE INDICATORS ADDRESSED
*Optional: The concepts and skills in this lesson are not assessed in grade 4. This material may be used for enrichment, to challenge more advanced students, and/or as preparation for grade 5.
continued

14 AIM Higher! New York Mathematics Review
Lesson Performance Indicators
5.1 Measuring Length 4.M.1, 4.M.2, 4.M.3
5.2 Measuring Perimeter 4.G.3
5.3 Measuring Area 4.G.4
5.4 Measuring Volume *See note.
5.5 Measuring Capacity 4.M.6, 4.M.7
5.6 Measuring Weight and Mass 4.M.4, 4.M.5
5.7 Measuring Circles and Angles *See note.
5.8 Measuring Time 4.M.9, 4.M.10
5.9 Measuring Temperature *See note.
6.1 Organizing Data: Bar Graphs 4.S.1–4.S.3, 4.S.5, 4.S.6
6.2 Organizing Data: Line Graphs 4.S.4–4.S.6
6.3 Range, Median, Mode, and Mean *See note.
6.4 Probability *See note.
6.5 Uncertainty 4.N.26, 4.M.2
GRADE 4 PERFORMANCE INDICATORS ADDRESSED
CORRELATIONS OF AIM HIGHER! LESSONS TONEW YORK STATE MATHEMATICS PERFORMANCE INDICATORS (CONT.)
*Optional: The concepts and skills in this lesson are not assessed in grade 4. This material may be used for enrichment, to challenge more advanced students, and/or as preparation for grade 5.

Correlation Charts 15
CORRELATIONS OF AIM HIGHER! TEST QUESTIONS TONEW YORK STATE MATHEMATICS PERFORMANCE INDICATORS
This question corresponds to thison the Pretest Performance Indicator:
Session 1
1 4.N.14
2 4.N.18
3 4.A.3
4 2.G.5
5 4.M.9
6 4.M.1
7 4.N.12
8 4.M.8
9 4.N.26
10 5.S.6, 5.S.7
11 4.A.4
12 4.N.7
13 4.G.1
14 4.A.1
15 4.N.4
16 4.G.4
17 4.S.5, 4.S.6
18 4.M.2
19 5.N.11
20 4.N.8
21 4.G.4
22 4.A.1
23 4.N.14
24 4.M.3
25 4.S.6
This question corresponds to thison the Pretest Performance Indicator:
26 4.N.7
27 5.S.6, 5.S.7
28 4.N.13, 4.N.15
29 4.M.8
30 4.N.18
Session 2
31 4.N.15
32 4.G.1
33 4.N.1, 4.N.2, 4.G.3
34 4.N.21
35 4.M.9
36 Problem Solving
37 4.S.5
38 4.S.3
39 4.G.4
Session 3
40 4.A.1
41 5.S.3
42 3.G.5
43 4.A.1
44 4.N.8, 5.N.11
45 2.G.5, 5.G.12
46 5.N.12
47 4.M.9
48 4.A.5
GRADE 4: PRETEST

16 AIM Higher! New York Mathematics Review
This question corresponds to thison the Pretest Performance Indicator:
Session 1
1 4.N.21
2 4.M.2
3 4.N.26
4 4.S.4
5 4.N.18
6 4.A.4
7 2.G.5
8 4.A.1
9 4.N.18
10 4.G.4
11 4.S.6
12 5.S.6, 5.S.7
13 4.N.18
14 4.M.9
15 4.N.4
16 Problem Solving
17 4.G.3
18 4.N.26
19 4.A.4
20 5.S.6, 5.S.7
21 4.N.9
22 4.N.8, 4.N.18
23 4.N.8
24 4.A.1
25 Problem Solving
This question corresponds to thison the Posttest Performance Indicator:
26 4.N.9, 4.N.12
27 5.S.6, 5.S.7
28 4.N.26, 4.S.5, 4.S.6
29 4.N.7–4.N.9
30 4.N.9
Session 2
31 3.G.5
32 4.N.14, 4.N.15
33 4.A.5
34 4.N.14, 4.N.15
35 4.G.3
36 4.N.15
37 4.N.14, 4.N.15
38 4.S.1, 4.S.3, 4.S.5, 4.S.6
39 4.G.4
Session 3
40 4.N.14, 4.N.15
41 4.S.5, 4.S.6
42 4.A.1
43 4.N.14, 4.N.15, 4.N.18
44 4.N.26, 4.N.27
45
46 4.S.3
47 4.N.7–4.N.9
48 4.A.4, 4.A.5
GRADE 4: POSTTEST
CORRELATIONS OF AIM HIGHER! TEST QUESTIONS TONEW YORK STATE MATHEMATICS PERFORMANCE INDICATORS

Performance Indicator Lessons
Students will understand numbers, multiple ways of representing numbers, relationships among numbers and number systems.
Number Systems5.N.1 Read and write whole numbers to millions 2.1
5.N.2 Compare and order numbers to millions 2.1, 2.3
5.N.3 Understand the place value structure of the base ten number system 2.210 ones = 1 ten10 tens = 1 hundred10 hundreds = 1 thousand10 thousands = 1 ten thousand10 ten thousands = 1 hundred thousand10 hundred thousands = 1 million
5.N.4 Create equivalent fractions, given a fraction 2.14
5.N.5 Compare and order fractions including unlike denominators (with and without the use of a number line) Note: Commonly used fractions such as those that might be indicated on ruler, measuring cup, etc. 2.12
5.N.6 Understand the concept of ratio 2.11, 4.5
5.N.7 Express ratios in different forms 2.11, 4.5
5.N.8 Read, write, and order decimals to thousandths 2.7, 2.8
5.N.9 Compare fractions using <, >, or = 2.12
5.N.10 Compare decimals using <, >, or = 2.7, 2.8
5.N.11 Understand that percent means part of 100, and write percents as fractions and decimals 2.11
Number Theory5.N.12 Recognize that some numbers are only divisible by one and themselves (prime) and
others have multiple divisors (composite) 2.6
5.N.13 Calculate multiples of a whole number and the least common multiple of two numbers 2.6
5.N.14 Identify the factors of a given number 2.14
5.N.15 Find the common factors and the greatest common factor of two numbers 2.14
Students will understand meanings of operations and procedures, and how they relate to one another.
Operations5.N.16 Use a variety of strategies to multiply three-digit by three-digit numbers
Note: Multiplication by anything greater than a three-digit multiplier/multiplicand should be done using technology. 2.10
5.N.17 Use a variety of strategies to divide three-digit numbers by one- and two-digit numbers Note: Division by anything greater than a two-digit divisor should be done using technology. 2.5
CORRELATIONS OF NEW YORK STATE MATHEMATICSPERFORMANCE INDICATORS TO AIM HIGHER! LESSONS: GRADE 5
NUMBER SENSE AND OPERATIONS STRAND
continued
Correlation Charts 17

Performance Indicator Lessons5.N.18 Evaluate an arithmetic expression using order of operations including multiplication,
division, addition, subtraction and parentheses 3.1
5.N.19 Simplify fractions to lowest terms 2.16
5.N.20 Convert improper fractions to mixed numbers, and mixed numbers to improper fractions 2.12
5.N.21 Use a variety of strategies to add and subtract fractions with like denominators 2.15
5.N.22 Add and subtract mixed numbers with like denominators 2.15
5.N.23 Use a variety of strategies to add, subtract, multiply, and divide decimals to thousandths 2.9, 2.10
Students will compute accurately and make reasonable estimates.
Estimation5.N.24 Round numbers to the nearest hundredth and up to 10,000 2.18
5.N.25 Estimate sums and differences of fractions with like denominators 2.19
5.N.26 Estimate sums, differences, products, and quotients of decimals 2.19
5.N.27 Justify the reasonableness of answers using estimation 2.19
NUMBER SENSE AND OPERATIONS STRAND, cont.
Performance Indicator Lessons
Students will represent and analyze algebraically a wide variety of problem solving situations.
Variables and Expressions5.A.1 Define and use appropriate terminology when referring to constants, variables, and
algebraic expressions 3.3, 3.4
5.A.2 Translate simple verbal expressions into algebraic expressions 3.3, 3.4
Students will perform algebraic procedures accurately.
Variables and Expressions5.A.3 Substitute assigned values into variable expressions and evaluate using order of operations 2.4
Equations and Inequalities5.A.4 Solve simple one-step equations using basic whole-number facts 2.4
5.A.5 Solve and explain simple one-step equations using inverse operations involving whole numbers 2.4
5.A.6 Evaluate the perimeter formula for given input values 5.3
Students will recognize, use, and represent algebraically patterns, relations, and functions.
Patterns, Functions, and Relations5.A.7 Create and explain patterns and algebraic relationships (e.g., 2, 4, 6, 8. . .) algebraically:
2n (doubling) 3.2
5.A.8 Create algebraic or geometric patterns using concrete objects or visual drawings (e.g.,rotate and shade geometric shapes) 3.2
ALGEBRA STRAND
18 AIM Higher! New York Mathematics Review
GRADE 5
continued

Correlation Charts 19
GRADE 5
Performance Indicator Lessons
Students will use visualization and spatial reasoning to analyze characteristics and properties of geometric shapes.
Shapes5.G.1 Calculate the perimeter of regular and irregular polygons 5.3
Students will identify and justify geometric relationships, formally and informally.
Geometric Relationships5.G.2 Identify pairs of similar triangles 4.5
5.G.3 Identify the ratio of corresponding sides of similar triangles 4.5
5.G.4 Classify quadrilaterals by properties of their angles and sides 4.2
5.G.5 Know that the sum of the interior angles of a quadrilateral is 360 degrees 4.2
5.G.6 Classify triangles by properties of their angles and sides 4.2
5.G.7 Know that the sum of the interior angles of a triangle is 180 degrees 4.2
5.G.8 Find a missing angle when given two angles of a triangle 4.2
5.G.9 Identify pairs of congruent triangles 4.5
5.G.10 Identify corresponding parts of congruent triangles 4.5
Students will apply transformations and symmetry to analyze problem solving situations.
Transformational Geometry5.G.11 Identify and draw lines of symmetry of basic geometric shapes 4.6
Students will apply coordinate geometry to analyze problem solving situations.
Coordinate Geometry5.G.12 Identify and plot points in the first quadrant 4.6
5.G.13 Plot points to form basic geometric shapes (identify and classify) 4.6
5.G.14 Calculate perimeter of basic geometric shapes drawn on a coordinate plane (rectangles andshapes composed of rectangles having sides with integer lengths and parallel to the axes) 5.3
GEOMETRY STRAND
continued

20 AIM Higher! New York Mathematics Review
GRADE 5
Performance Indicator Lessons
Students will determine what can be measured and how, using appropriate methods and formulas.
Units of Measurement5.M.1 Use a ruler to measure to the nearest inch, 1/2, 1/4, and 1/8 inch 5.2
5.M.2 Identify customary equivalent units of length 5.2
5.M.3 Measure to the nearest centimeter 5.2
5.M.4 Identify equivalent metric units of length 5.2
5.M.5 Convert measurement within a given system 5.2
Tools and Methods5.M.6 Determine the tool and technique to measure with an appropriate level of precision:
lengths and angles 4.1
Students will use units to give meaning to measurements.
Units5.M.7 Calculate elapsed time in hours and minutes 5.9, 5.10
5.M.8 Measure and draw angles using a protractor 4.1
Students will develop strategies for estimating measurements.
Estimation5.M.9 Determine personal references for customary units of length (e.g., your pace is
approximately 3 feet, your height is approximately 5 feet, etc.) 5.1, 5.2
5.M.10 Determine personal references for metric units of length 5.1, 5.2
5.M.11 Justify the reasonableness of estimates 2.19
MEASUREMENT STRAND
continued

Correlation Charts 21
GRADE 5
Performance Indicator Lessons
Students will collect, organize, display, and analyze data.
Collection of Data5.S.1 Collect and record data from a variety of sources (e.g., newspapers, magazines, polls,
charts, and surveys) 6.1
Organization and Display of Data5.S.2 Display data in a line graph to show an increase or decrease over time 6.3
Analysis of Data5.S.3 Calculate the mean for a given set of data and use to describe a set of data 6.4
Students will make predictions that are based upon data analysis.
Predictions from Data5.S.4 Formulate conclusions and make predictions from graphs 2.3
Students will understand and apply concepts of probability.
Probability5.S.5 List the possible outcomes for a single-event experiment 6.5, 6.8
5.S.6 Record experiment results using fractions/ratios 6.6, 6.8
5.S.7 Create a sample space and determine the probability of a single event, given a simple experiment (e.g., rolling a number cube) 6.7, 6.8
STATISTICS AND PROBABILITY STRAND

Lesson Performance Indicators
1.1 Reasoning about Word Problems Problem Solving
1.2 Problem-Solving Strategies Problem Solving
1.3 Understanding Mathematical Language Problem Solving
2.1 Digits and Place Value 5.N.1, 5.N.2
2.2 Powers of 10 and Expanded Notation 5.N.3
2.3 Number Lines and Ordering Integers 5.N.2
2.4 Basic Operations with Integers 5.A.3–5
2.5 Divisibility Rules 5.N.17
2.6 Prime and Composite Numbers 5.N.12, 5.N.13
2.7 Place Values Less Than One 5.N.8, 5.N.10
2.8 Number Lines and Ordering Decimal Numbers 5.N.8, 5.N.10
2.9 Addition and Subtraction of Decimals 5.N.23, 5.M.8
2.10 Multiplication and Division of Decimals 5.N.23
2.11 Percents 5.N.6, 5.N.7, 5.N.11
2.12 Fractions and Mixed Numbers 5.N.5, 5.N.9, 5.N.20
2.13 Multiplying and Dividing Fractions *See note.
2.14 Simplifying Fractions/Equivalent Fractions 5.N.4, 5.N.14, 5.N.15
2.15 Adding and Subtracting Fractions with Like Denominators 5.N.21, 5.N.22
2.16 Least Common Denominators 5.N.19
2.17 Adding and Subtracting Fractionswith Unlike Denominators *See note.
2.18 Rounding 5.N.18
2.19 Estimation 5.M.11
3.1 Processing Order 5.A.7, 5.A.8
3.2 Recognizing Patterns 5.A.1, 5.A.2
3.3 Variables and Equations 5.A.1, 5.A.2
3.4 Algebraic Equations in Word Problems 5.A.1, 5.A.2
22 AIM Higher! New York Mathematics Review
CORRELATIONS OF AIM HIGHER! LESSONSTO NEW YORK STATE MATHEMATICS PERFORMANCE INDICATORS
GRADE 5 PERFORMANCE INDICATORS ADDRESSED
*Optional: The concepts and skills in this lesson are not assessed in grade 5. This material may be used for enrichment, to challenge more advanced students, and/or as preparation for grade 6.
continued

Correlation Charts 23
CORRELATIONS OF AIM HIGHER! LESSONSTO NEW YORK STATE MATHEMATICS PERFORMANCE INDICATORS (CONT.)
Lesson Performance Indicators
4.1 The Building Blocks of Shapes 5.G.1–10
4.2 Two-Dimensional Shapes: Basic Forms 5.G.4–8
4.3 Two-Dimensional Shapes: Other Polygons 4.G.1
4.4 Three-Dimensional Shapes 4.G.5
4.5 Transformations 5.N.6, 5.N.7, 5.G.2, 5.G.3, 5.G.9, 5.G.10
4.6 Graphing 5.G.11–13
5.1 Estimation and Nonstandard Measurement of Length 5.M.1, 5.M.9, 5.M.10
5.2 Measuring Length 5.M.2, 5.M.3, 5.M.9, 5.M.10
5.3 Measuring Perimeter and Circumference 5.A.6, 5.G.1, 5.G.14
5.4 Measuring Area: Rectangles 4.G.4
5.5 Measuring Volume: Rectangular Prisms *See note.
5.6 Measuring Weight 3.M.3
5.7 Measuring Mass 4.M.4, 4.M.5
5.8 Measuring Capacity 4.M.6, 4.M.7
5.9 Measuring Time 5.M.7
5.10 Measuring Elapsed Time 5.M.7
5.11 Measuring Temperature *See note.
6.1 Displaying Data: Bar Graphs and Histograms 5.S.1
6.2 Displaying Data: Circle Graphs *See note.
6.3 Displaying Data: Line Graphs and Venn Diagrams 5.S.2
6.4 Statistical Measures and Stem-and-Leaf Plots 5.S.3
6.5 Finding Outcomes 5.S.5
6.6 Probability and Prediction 5.S.6
6.7 Predicting from a Sample 5.S.7
6.8 Uncertainty 5.S.5–7
GRADE 5 PERFORMANCE INDICATORS ADDRESSED
*Optional: The concepts and skills in this lesson are not assessed in grade 5. This material may be used for enrichment, to challenge more advanced students, and/or as preparation for grade 6.

24 AIM Higher! New York Mathematics Review
CORRELATIONS OF AIM HIGHER! TEST QUESTIONS TONEW YORK STATE MATHEMATICS PERFORMANCE INDICATORS
This question corresponds to this This question corresponds to thison the Pretest Performance Indicator: on the Pretest Performance Indicator:
Session 1, Part 1 25 5.N.17
1 5.N.1, 5.N.3 26 4.G.4, 5.G.1
2 5.M.2 27 5.S.1, 5.S.4
3 5.G.2
4 5.A.1, 5.A.2 Session 1, Part 2
5 2.G.5 28 5.G.12, 5.G.13
6 5.A.4 29 5.G.6, 5.G.7
7 5.M.6 30 5.A.7
8 5.S.1 31 5.N.23
9 5.S.7 32 5.A.4
10 5.A.4 33 5.N.1
11 5.N.5, 5.N.9 34 5.N.24, 5.N.27
12 5.N.21 35 5.N.6, 5.S.4
13 5.N.4, 5.N.21, 5.N.22 36 4.G.4
14 5.A.1, 5.N.18
15 5.N.11 Session 2
16 5.A.2 37 5.A.4, 5.A.5
17 5.N.3, 5.N.23 38 2.G.5
18 5.N.3 39 5.N.4
19 2.G.5 40 5.N.27
20 5.N.12 41 5.N.1
21 5.S.3 42 5.G.13
22 5.A.2 43 5.M.5
23 5.N.23 44 5.G.4, 5.G.6
24 5.N.19 45 5.N.9, 5.N.10, 5.N.12,5.N.14, 5.N.15
GRADE 5: PRETEST

Correlation Charts 25
This question corresponds to this This question corresponds to thison the Posttest Performance Indicator: on the Posttest Performance Indicator:
Session 1, Part 1 25 5.A.4
1 5.N.24, 5.N.27 26 5.S.2
2 5.N.2 27 5.S.1
3 5.G.9
4 5.N.13, 5.A.6 Session 1, Part 2
5 5.N.6, 5.N.7 28 5.G.12
6 5.S.4 29 5.N.6
7 5.N.7 30 5.A.7
8 5.A.1, 5.A.2 31 5.N.23
9 5.S.7 32 5.A.4
10 5.A.3 33 5.N.6, 5.N.7, 5.N.11
11 5.S.3 34 5.S.5
12 5.M.6 35 5.A.4
13 5.N.5, 5.N.7, 5.N.9 36 5.S.1, 5.N.11
14 2.G.5
15 5.N.24 Session 2
16 5.N.5 37 5.G.4
17 5.A.2 38 5.A.4
18 5.A.2 39 5.S.3
19 5.M.7 40 5.A.2
20 5.S.1 41 5.N.12
21 5.G.2, 5.G.3, 5.G.9 42 5.A.4
22 5.N.12 43 5.M.5
23 5.G.12 44 Problem Solving, 5.N.7,5.S.7
24 5.A.4 45 5.G.12, 5.S.2, 5.N.2
GRADE 5: POSTTEST
CORRELATIONS OF AIM HIGHER! TEST QUESTIONS TONEW YORK STATE MATHEMATICS PERFORMANCE INDICATORS

26 AIM Higher! New York Mathematics Review
Performance Indicator Lessons
Students will understand numbers, multiple ways of representing numbers, relationships among numbers, and number systems.
Number Systems6.N.1 Read and write whole numbers to trillions 2.1
6.N.2 Define and identify the commutative and associative properties of addition and multiplication 2.2
6.N.3 Define and identify the distributive property of multiplication over addition 2.2
6.N.4 Define and identify the identity and inverse properties of addition and multiplication 2.2
6.N.5 Define and identify the zero property of multiplication 2.2
6.N.6 Understand the concept of rate
6.N.7 Express equivalent ratios as a proportion 2.17
6.N.8 Distinguish the difference between rate and ratio 5.2
6.N.9 Solve proportions using equivalent fractions 5.2
6.N.10 Verify the proportionality using the product of the means equals the product of the extremes 5.2
6.N.11 Read, write, and identify percents of a whole (0% to 100%) 2.17
6.N.12 Solve percent problems involving percent, rate, and base 2.18
6.N.13 Define absolute value and determine the absolute value of rational numbers (including positive and negative) 2.4, 2.5
6.N.14 Locate rational numbers on a number line (including positive and negative) 2.4, 2.5
6.N.15 Order rational numbers (including positive and negative) 2.4, 2.5
Students will understand meanings of operations and procedures, and how they relate to one another.
Operations6.N.16 Add and subtract fractions with unlike denominators 2.9, 2.10,
2.12
6.N.17 Multiply and divide fractions with unlike denominators 2.9, 2.10,2.13
6.N.18 Add, subtract, multiply, and divide mixed numbers with unlike denominators 2.11, 2.13
6.N.19 Identify the multiplicative inverse (reciprocal) of a number 2.13
6.N.20 Represent fractions as terminating or repeating decimals 2.14–2.16
6.N.21 Find multiple representations of rational numbers (fractions, decimals, and percents 0 to 100) 2.14
CORRELATIONS OF NEW YORK STATE MATHEMATICSPERFORMANCE INDICATORS TO AIM HIGHER! LESSONS: GRADE 6
NUMBER SENSE AND OPERATIONS STRAND
continued

Correlation Charts 27
GRADE 6
Performance Indicator Lessons6.N.22 Evaluate numerical expressions using order of operations (may include exponents of
two and three) 2.7
6.N.23 Represent repeated multiplication in exponential form 2.6
6.N.24 Represent exponential form as repeated multiplication 2.6
6.N.25 Evaluate expressions having exponents where the power is an exponent of one, two,or three 2.6
Students will compute accurately and make reasonable estimates.
Estimation 6.N.26 Estimate a percent of quantity (0% to 100%) 2.17, 2.18
6.N.27 Justify the reasonableness of answers using estimation (including rounding) 2.3, 6.9
NUMBER SENSE AND OPERATIONS STRAND, cont.
Performance Indicator Lessons
Students will represent and analyze algebraically a wide variety of problem solving situations.
Variables and Expressions6.A.1 Translate two-step verbal expressions into algebraic expressions 3.1, 3.3
Students will perform algebraic procedures accurately.
Variables and Expressions6.A.2 Use substitution to evaluate algebraic expressions (may include exponents of one,
two, and three) 2.6, 3.1, 3.3
Equations and Inequalities6.A.3 Translate two-step verbal sentences into algebraic equations 3.2
6.A.4 Solve and explain two-step equations involving whole numbers using inverse operations 3.2
6.A.5 Solve simple proportions within context 2.14, 2.16
6.A.6 Evaluate formulas for given input values (circumference, area, volume, distance,temperature, interest, etc.) 5.5
ALGEBRA STRAND
continued

28 AIM Higher! New York Mathematics Review
GRADE 6
Performance Indicator Lessons
Students will use visualization and spatial reasoning to analyze characteristics and properties of geometric shapes.
Shapes6.G.1 Calculate the length of corresponding sides of similar triangles, using proportional
reasoning 4.1–4.3, 5.2
6.G.2 Determine the area of triangles and quadrilaterals (squares, rectangles, rhombi, and trapezoids) and develop formulas 4.1–4.3, 5.4
6.G.3 Use a variety of strategies to find the area of regular and irregular polygons 4.1–4.3, 5.4
6.G.4 Determine the volume of rectangular prisms by counting cubes and develop the formula 4.4, 5.6
6.G.5 Identify radius, diameter, chords and central angles of a circle 5.5
6.G.6 Understand the relationship between the diameter and radius of a circle 5.5
6.G.7 Determine the area and circumference of a circle, using the appropriate formula 5.5
6.G.8 Calculate the area of a sector of a circle, given the measure of a central angle and the radius of the circle 5.5
6.G.9 Understand the relationship between the circumference and the diameter of a circle 5.5
Students will apply coordinate geometry to analyze problem solving situations.
Coordinate Geometry 6.G.10 Identify and plot points in all four quadrants 4.5
6.G.11 Calculate the area of basic polygons drawn on a coordinate plane (rectangles and shapes composed of rectangles having sides with integer lengths) 4.5
GEOMETRY STRAND
continued

Correlation Charts 29
GRADE 6
Performance Indicator Lessons
Students will determine what can be measured and how, using appropriate methods and formulas.
Units of Measurement6.M.1 Measure capacity and calculate volume of a rectangular prism 5.6
6.M.2 Identify customary units of capacity (cups, pints, quarts, and gallons) 5.1
6.M.3 Identify equivalent customary units of capacity (cups to pints, pints to quarts, and quarts to gallons) 5.1
6.M.4 Identify metric units of capacity (liter and milliliter) 5.1
6.M.5 Identify equivalent metric units of capacity (milliliter to liter and liter to milliliter) 5.1
Tools and Methods6.M.6 Determine the tool and technique to measure with an appropriate level of
precision: capacity 5.1
Students will develop strategies for estimating measurements.
Estimation6.M.7 Estimate volume, area, and circumference (see figures identified in geometry strand) 4.1–4.4, 5.4–5.6
6.M.8 Justify the reasonableness of estimates 5.1
6.M.9 Determine personal references for capacity 5.1
MEASUREMENT STRAND
continued

30 AIM Higher! New York Mathematics Review
GRADE 6
Performance Indicator Lessons
Students will collect, organize, display, and analyze data.
Collection of Data6.S.1 Develop the concept of sampling when collecting data from a population and decide
the best method to collect data for a particular question 6.1–6.5
Organization and Display of Data6.S.2 Record data in a frequency table 6.6
6.S.3 Construct Venn diagrams to sort data 6.8
6.S.4 Determine and justify the most appropriate graph to display a given set of data (pictograph, bar graph, line graph, histogram, or circle graph) 6.1–6.5
Analysis of Data6.S.5 Determine the mean, mode and median for a given set of data 6.6
6.S.6 Determine the range for a given set of data 6.6
6.S.7 Read and interpret graphs 6.1–6.5
Students will make predictions that are based upon data analysis.
Predictions from Data6.S.8 Justify predictions made from data 6.1–6.5
Students will understand and apply concepts of probability.
Probability6.S.9 List possible outcomes for compound events 6.7
6.S.10 Determine the probability of dependent events 6.7, 6.9
6.S.11 Determine the number of possible outcomes for a compound event by using the fundamental counting principle and use this to determine the probabilities of events when the outcomes have equal probability 6.7, 6.9
STATISTICS AND PROBABILITY STRAND

Correlation Charts 31
Lesson Performance Indicators
1.1 Reasoning about Word Problems Problem Solving
1.2 Problem-Solving Strategies Problem Solving
1.3 Understanding Mathematical Language Problem Solving
2.1 Place Value 6.N.1
2.2 Operating with Whole Numbers 6.N.2–6.N.5
2.3 Estimating with Whole Numbers 6.N.27
2.4 Integers 6.N.13–6.N.15
2.5 Adding and Subtracting Integers 6.N.13–6.N.15
2.6 Exponents 6.N.23–6.N.25
2.7 The Order of Operations 6.N.22
2.8 Prime Numbers 5.N.12
2.9 Finding the Greatest Common Factor 6.N.16
2.10 Finding the Least Common Multiple 6.N.16
2.11 Fractions and Mixed Numbers 6.N.18
2.12 Adding and Subtracting Fractions 6.N.16
2.13 Multiplying and Dividing Fractions 6.N.17–6.N.19
2.14 Decimal Place Value 6.N.20, 6.N.21
2.15 Adding and Subtracting Decimals 6.N.20, 6.A.5
2.16 Multiplying and Dividing Decimals 6.N.20, 6.A.5
2.17 Percent 6.N.11, 6.N.26
2.18 Solving Percent Problems 6.N.12, 6.N.26
3.1 Variables and Expressions 6.N.23–6.N.25, 6.A.1, 6.A.2
3.2 Solving Equations 6.A.3, 6.A.4
3.3 Patterns 6.A.1, 6.A.2
4.1 Plane Geometry 6.G.1, 6.G.2, 6.M.7
4.2 Polygons 6.G.1, 6.G.2, 6.M.7
4.3 Triangles and Quadrilaterals 6.G.1, 6.G.2, 6.M.7
4.4 Three-Dimensional Shapes 6.G.4, 6.M.7
CORRELATIONS OF AIM HIGHER! LESSONSTO NEW YORK STATE MATHEMATICS PERFORMANCE INDICATORS
GRADE 6 PERFORMANCE INDICATORS ADDRESSED
continued
32 AIM Higher! New York Mathematics Review
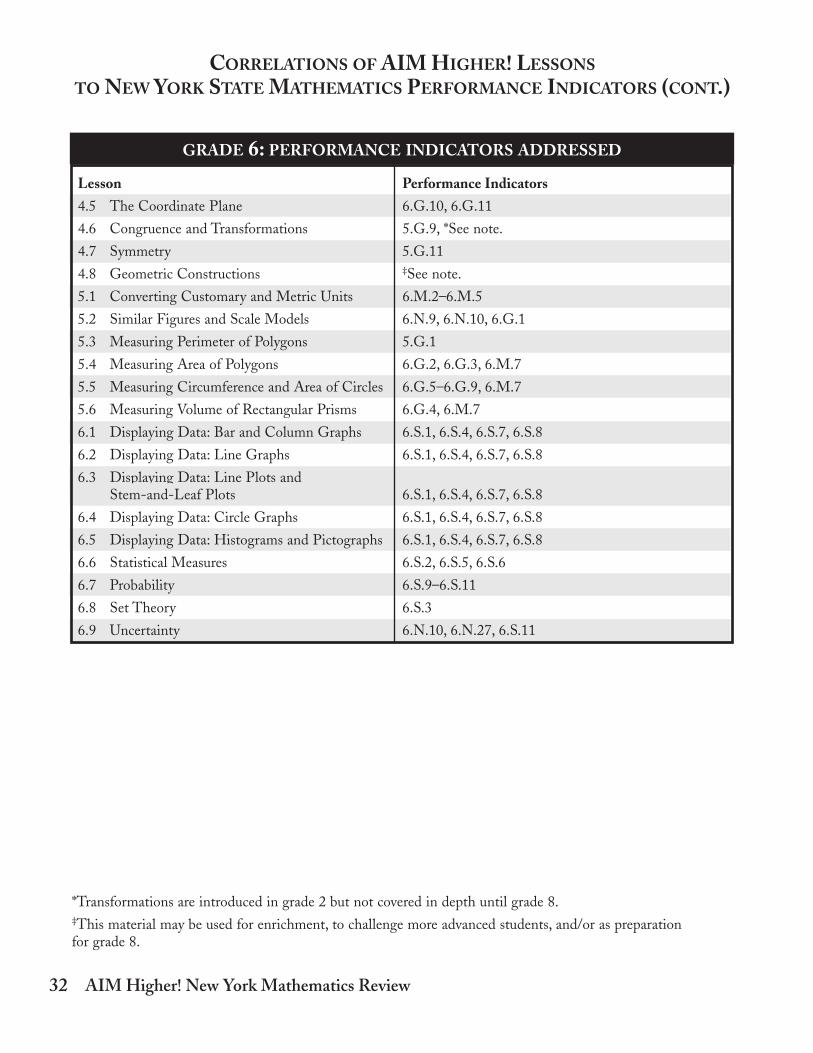
*Transformations are introduced in grade 2 but not covered in depth until grade 8.‡This material may be used for enrichment, to challenge more advanced students, and/or as preparationfor grade 8.
Lesson Performance Indicators
4.5 The Coordinate Plane 6.G.10, 6.G.11
4.6 Congruence and Transformations 5.G.9, *See note.
4.7 Symmetry 5.G.11
4.8 Geometric Constructions ‡See note.
5.1 Converting Customary and Metric Units 6.M.2–6.M.5
5.2 Similar Figures and Scale Models 6.N.9, 6.N.10, 6.G.1
5.3 Measuring Perimeter of Polygons 5.G.1
5.4 Measuring Area of Polygons 6.G.2, 6.G.3, 6.M.7
5.5 Measuring Circumference and Area of Circles 6.G.5–6.G.9, 6.M.7
5.6 Measuring Volume of Rectangular Prisms 6.G.4, 6.M.7
6.1 Displaying Data: Bar and Column Graphs 6.S.1, 6.S.4, 6.S.7, 6.S.8
6.2 Displaying Data: Line Graphs 6.S.1, 6.S.4, 6.S.7, 6.S.8
6.3 Displaying Data: Line Plots and Stem-and-Leaf Plots 6.S.1, 6.S.4, 6.S.7, 6.S.8
6.4 Displaying Data: Circle Graphs 6.S.1, 6.S.4, 6.S.7, 6.S.8
6.5 Displaying Data: Histograms and Pictographs 6.S.1, 6.S.4, 6.S.7, 6.S.8
6.6 Statistical Measures 6.S.2, 6.S.5, 6.S.6
6.7 Probability 6.S.9–6.S.11
6.8 Set Theory 6.S.3
6.9 Uncertainty 6.N.10, 6.N.27, 6.S.11
GRADE 6: PERFORMANCE INDICATORS ADDRESSED
CORRELATIONS OF AIM HIGHER! LESSONSTO NEW YORK STATE MATHEMATICS PERFORMANCE INDICATORS (CONT.)
Correlation Charts 33
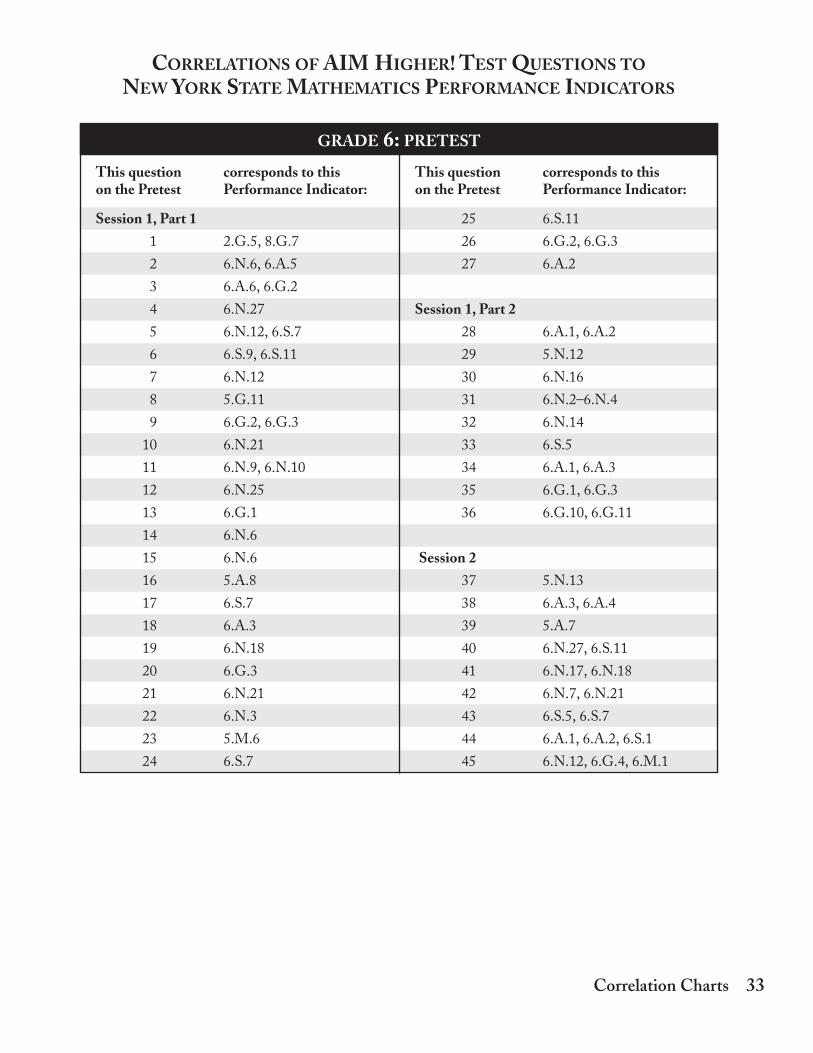
This question corresponds to thison the Pretest Performance Indicator:
Session 1, Part 1
1 2.G.5, 8.G.7
2 6.N.6, 6.A.5
3 6.A.6, 6.G.2
4 6.N.27
5 6.N.12, 6.S.7
6 6.S.9, 6.S.11
7 6.N.12
8 5.G.11
9 6.G.2, 6.G.3
10 6.N.21
11 6.N.9, 6.N.10
12 6.N.25
13 6.G.1
14 6.N.6
15 6.N.6
16 5.A.8
17 6.S.7
18 6.A.3
19 6.N.18
20 6.G.3
21 6.N.21
22 6.N.3
23 5.M.6
24 6.S.7
This question corresponds to thison the Pretest Performance Indicator:
25 6.S.11
26 6.G.2, 6.G.3
27 6.A.2
Session 1, Part 2
28 6.A.1, 6.A.2
29 5.N.12
30 6.N.16
31 6.N.2–6.N.4
32 6.N.14
33 6.S.5
34 6.A.1, 6.A.3
35 6.G.1, 6.G.3
36 6.G.10, 6.G.11
Session 2
37 5.N.13
38 6.A.3, 6.A.4
39 5.A.7
40 6.N.27, 6.S.11
41 6.N.17, 6.N.18
42 6.N.7, 6.N.21
43 6.S.5, 6.S.7
44 6.A.1, 6.A.2, 6.S.1
45 6.N.12, 6.G.4, 6.M.1
CORRELATIONS OF AIM HIGHER! TEST QUESTIONS TONEW YORK STATE MATHEMATICS PERFORMANCE INDICATORS
GRADE 6: PRETEST

34 AIM Higher! New York Mathematics Review
This question corresponds to thison the Posttest Performance Indicator:
Session 1, Part 1
1 2.G.5, 8.G.7
2 6.G.8
3 6.N.3
4 6.S.5
5 6.N.27
6 6.A.1, 6.A.2
7 6.N.21, 6.N.25
8 6.N.11, 6.N.12
9 6.N.25
10 6.A.1, 6.A.2
11 6.S.11
12 5.G.6
13 6.G.9
14 6.N.12, 6.S.7
15 Problem Solving
16 6.N.18, 6.N.19
17 6.N.27
18 6.S.11
19 6.N.7, 6.N.12
20 5.G.11
21 6.S.4
22 6.S.7
23 6.N.12, 6.N.26
24 5.A.7
This question corresponds to thison the Posttest Performance Indicator:
25 2.G.5, 8.G.7
26 6.A.2, 6.N.14
27 6.N.27, 6.G.3
Session 1, Part 2
28 5.G.4
29 6.A.2
30 6.S.8
31 6.A.5
32 5.M.7
33 6.A.5
34 6.G.2
35 6.S.5, 6.S.6
36 6.G.2, 6.G.3
Session 2
37 6.N.9, 6.G.1
38 6.G.10
39 6.N.6, 6.N.9
40 6.A.2
41 6.A.3, 6.A.4
42 6.S.7
43 5.G.1
44 6.G.2, 6.G.3
45 6.S.9, 6.S.11
GRADE 6: POSTTEST
CORRELATIONS OF AIM HIGHER! TEST QUESTIONS TONEW YORK STATE MATHEMATICS PERFORMANCE INDICATORS

Performance Indicator Lessons
Students will understand numbers, multiple ways of representing numbers, relationships among numbers, and number systems.
Number Systems7.N.1 Distinguish between the various subsets of real numbers (counting/natural numbers,
whole numbers, integers, rational numbers, and irrational numbers) 2.1–2.9
7.N.2 Recognize the difference between rational and irrational numbers (e.g., explore different approximations of π) 2.9
7.N.3 Place rational and irrational numbers (approximations) on a number line and justify the placement of the numbers 2.9
7.N.4 Develop the laws of exponents for multiplication and division 2.7
7.N.5 Write numbers in scientific notation 2.7
7.N.6 Translate numbers from scientific notation into standard form 2.7
7.N.7 Compare numbers written in scientific notation 2.7
Number Theory7.N.8 Find the common factors and greatest common factor of two or more numbers 2.1
7.N.9 Determine multiples and least common multiple of two or more numbers 2.1
7.N.10 Determine the prime factorization of a given number and write in exponential form 2.1
Students will understand meanings of operations and procedures, and how they relate to one another.
Operations7.N.11 Simplify expressions using order of operations Note: Expressions may include absolute
value and/or integral exponents greater than 0. 2.10
7.N.12 Add, subtract, multiply, and divide integers 2.2
7.N.13 Add and subtract two integers (with and without the use of a number line) 2.2
7.N.14 Develop a conceptual understanding of negative and zero exponents with a base of ten and relate to fractions and decimals (e.g., 10−2 = .01 = 1/100) 2.7
7.N.15 Recognize and state the value of the square root of a perfect square (up to 225) 2.8
7.N.16 Determine the square root of non-perfect squares using a calculator 2.8
7.N.17 Classify irrational numbers as non-repeating/non-terminating decimals 2.9
Students will compute accurately and make reasonable estimates.
Estimation7.N.18 Identify the two consecutive whole numbers between which the square root of a non-
perfect square whole number less than 225 lies (with and without the use of a number line) 2.8
7.N.19 Justify the reasonableness of answers using estimation 2.13
CORRELATIONS OF NEW YORK STATE MATHEMATICSPERFORMANCE INDICATORS TO AIM HIGHER! LESSONS: GRADE 7
NUMBER SENSE AND OPERATIONS STRAND
Correlation Charts 35
continued

36 AIM Higher! New York Mathematics Review
GRADE 7
Performance Indicator Lessons
Students will represent and analyze algebraically a wide variety of problem solving situations.
Variables and Expressions 7.A.1 Translate two-step verbal expressions into algebraic expressions 2.2
Students will perform algebraic procedures accurately.
Variables and Expressions 7.A.2 Add and subtract monomials with exponents of one 2.2, 2.7
7.A.3 Identify a polynomial as an algebraic expression containing one or more terms 2.10
Equations and Inequalities7.A.4 Solve multi-step equations by combining like terms, using the distributive property, or
moving variables to one side of the equation 2.10, 3.2, 3.4
7.A.5 Solve one-step inequalities (positive coefficients only) (See 7.G.10) 3.2
7.A.6 Evaluate formulas for given input values (surface area, rate, and density problems) 5.2–5.4
Students will recognize, use, and represent algebraically patterns, relations, and functions.
Patterns, Relations, and Functions7.A.7 Draw the graphic representation of a pattern from an equation or from a table of data 3.3
7.A.8 Create algebraic patterns using charts/tables, graphs, equations, and expressions 3.3
7.A.9 Build a pattern to develop a rule for determining the sum of the interior angles of polygons 3.1
7.A.10 Write an equation to represent a function from a table of values 3.1
ALGEBRA STRAND
continued

Correlation Charts 37
GRADE 7
Performance Indicator Lessons
Students will use visualization and spatial reasoning to analyze characteristics and properties of geometric shapes.
Shapes7.G.1 Calculate the radius or diameter, given the circumference or area of a circle 4.1, 5.2
7.G.2 Calculate the volume of prisms and cylinders, using a given formula and a calculator 4.3
7.G.3 Identify the two-dimensional shapes that make up the faces and bases of three-dimensional shapes (prisms, cylinders, cones, and pyramids) 4.1–4.3
7.G.4 Determine the surface area of prisms and cylinders, using a calculator and a variety of methods 5.3, 5.4
Students will identify and justify geometric relationships, formally and informally.
Geometric Relationships7.G.5 Identify the right angle, hypotenuse, and legs of a right triangle 4.10
7.G.6 Explore the relationship between the lengths of the three sides of a right triangle to develop the Pythagorean Theorem 4.10
7.G.7 Find a missing angle when given angles of a quadrilateral 4.10
7.G.8 Use the Pythagorean Theorem to determine the unknown length of a side of a right triangle 4.10
7.G.9 Determine whether a given triangle is a right triangle by applying the Pythagorean Theorem and using a calculator 4.10
Students will apply coordinate geometry to analyze problem solving situations.
Coordinate Geometry7.G.10 Graph the solution set of an inequality (positive coefficients only) on a number line
(See 7.A.5) 3.2
GEOMETRY STRAND
continued

38 AIM Higher! New York Mathematics Review
GRADE 7
Performance Indicator Lessons
Students will determine what can be measured and how, using appropriate methods and formulas.
Units of Measurement7.M.1 Calculate distance using a map scale 5.6
7.M.2 Convert capacities and volumes within a given system 5.1, 5.5
7.M.3 Identify customary and metric units of mass 5.1
7.M.4 Convert mass within a given system 5.1
7.M.5 Calculate unit price using proportions 2.11
7.M.6 Compare unit prices 2.11
7.M.7 Convert money between different currencies with the use of an exchange rate table and a calculator 5.1
7.M.8 Draw central angles in a given circle using a protractor (circle graphs) 4.9
Tools and Methods7.M.9 Determine the tool and technique to measure with an appropriate level of
precision: mass 4.9
Students will develop strategies for estimating measurements.
Estimation7.M.10 Identify the relationships between relative error and magnitude when dealing with
large numbers (e.g., money, population) 6.7
7.M.11 Estimate surface area 5.2–5.4
7.M.12 Determine personal references for customary/metric units of mass 5.2
7.M.13 Justify the reasonableness of the mass of an object 5.1
MEASUREMENT STRAND
continued

Correlation Charts 39
GRADE 7
Performance Indicator Lessons
Students will collect, organize, display, and analyze data.
Collection of Data7.S.1 Identify and collect data using a variety of methods 6.1
Organization and Display of Data7.S.2 Display data in a circle graph 6.3
7.S.3 Convert raw data into double bar graphs and double line graphs 6.1
Analysis of Data7.S.4 Calculate the range for a given set of data 6.6
7.S.5 Select the appropriate measure of central tendency 6.6
7.S.6 Read and interpret data represented graphically (pictograph, bar graph, histogram,line graph, double line/bar graphs or circle graph). 6.1–6.5
Students will make predictions that are based upon data analysis.
Predictions from Data7.S.7 Identify and explain misleading statistics and graphs. 6.1–6.5
Students will understand and apply concepts of probability.
Probability7.S.8 Interpret data to provide the basis for predictions and to establish experimental
probabilities 6.7–6.9
7.S.9 Determine the validity of sampling methods to predict outcomes 6.7–6.9
7.S.10 Predict the outcome of an experiment 6.7–6.9
7.S.11 Design and conduct an experiment to test predictions 6.7
7.S.12 Compare actual results to predicted results 6.7–6.9
STATISTICS AND PROBABILITY STRAND
40 AIM Higher! New York Mathematics Review
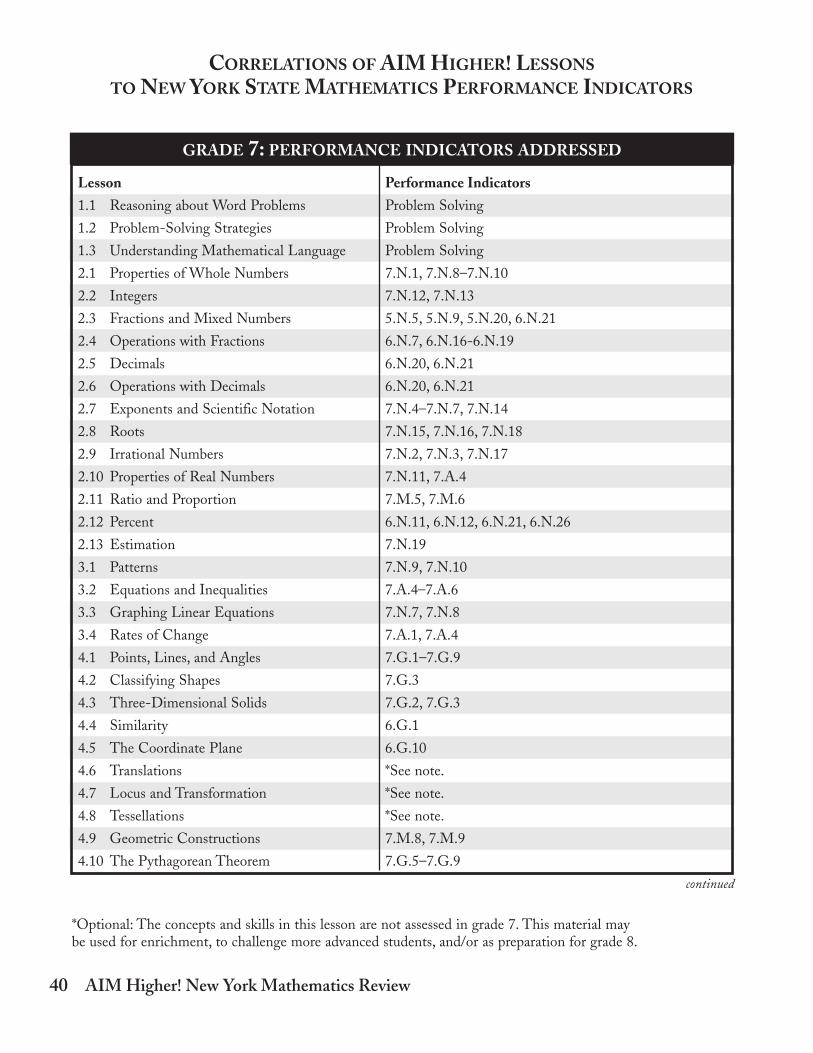
Lesson Performance Indicators
1.1 Reasoning about Word Problems Problem Solving
1.2 Problem-Solving Strategies Problem Solving
1.3 Understanding Mathematical Language Problem Solving
2.1 Properties of Whole Numbers 7.N.1, 7.N.8–7.N.10
2.2 Integers 7.N.12, 7.N.13
2.3 Fractions and Mixed Numbers 5.N.5, 5.N.9, 5.N.20, 6.N.21
2.4 Operations with Fractions 6.N.7, 6.N.16-6.N.19
2.5 Decimals 6.N.20, 6.N.21
2.6 Operations with Decimals 6.N.20, 6.N.21
2.7 Exponents and Scientific Notation 7.N.4–7.N.7, 7.N.14
2.8 Roots 7.N.15, 7.N.16, 7.N.18
2.9 Irrational Numbers 7.N.2, 7.N.3, 7.N.17
2.10 Properties of Real Numbers 7.N.11, 7.A.4
2.11 Ratio and Proportion 7.M.5, 7.M.6
2.12 Percent 6.N.11, 6.N.12, 6.N.21, 6.N.26
2.13 Estimation 7.N.19
3.1 Patterns 7.N.9, 7.N.10
3.2 Equations and Inequalities 7.A.4–7.A.6
3.3 Graphing Linear Equations 7.N.7, 7.N.8
3.4 Rates of Change 7.A.1, 7.A.4
4.1 Points, Lines, and Angles 7.G.1–7.G.9
4.2 Classifying Shapes 7.G.3
4.3 Three-Dimensional Solids 7.G.2, 7.G.3
4.4 Similarity 6.G.1
4.5 The Coordinate Plane 6.G.10
4.6 Translations *See note.
4.7 Locus and Transformation *See note.
4.8 Tessellations *See note.
4.9 Geometric Constructions 7.M.8, 7.M.9
4.10 The Pythagorean Theorem 7.G.5–7.G.9
CORRELATIONS OF AIM HIGHER! LESSONSTO NEW YORK STATE MATHEMATICS PERFORMANCE INDICATORS
GRADE 7: PERFORMANCE INDICATORS ADDRESSED
*Optional: The concepts and skills in this lesson are not assessed in grade 7. This material may be used for enrichment, to challenge more advanced students, and/or as preparation for grade 8.
continued

Correlation Charts 41
CORRELATIONS OF AIM HIGHER! LESSONSTO NEW YORK STATE MATHEMATICS PERFORMANCE INDICATORS (CONT.)
Lesson Performance Indicators
5.1 Systems of Measurement 7.M.2–7.M.4
5.2 Measuring Perimeter and Circumference 7.G.1
5.3 Measuring Area 7.G.4, 7.M.11
5.4 Measuring Surface Area of Rectangular Prisms 7.G.4, 7.M.11
5.5 Measuring Volume 7.M.2
5.6 Scale Drawings 7.M.1, 7.R.9
6.1 Bar Graphs 7.S.1, 7.S.3, 7.S.6, 7.S.7
6.2 Line Graphs 7.S.1, 7.S.6
6.3 Circle Graphs 7.S.3, 7.S.6
6.4 Other Graphs 7.S.6, 7.S.7
6.5 Graphing Relationships 7.S.6, 7.S.7
6.6 Basic Statistical Measures 7.S.4, 7.S.5
6.7 Counting Strategies 7.S.8–7.S.12
6.8 Probability 7.S.8–7.S.10, 7.S.12
6.9 Uncertainty 7.S.8–7.S.10, 7.S.12
GRADE 7: PERFORMANCE INDICATORS ADDRESSED
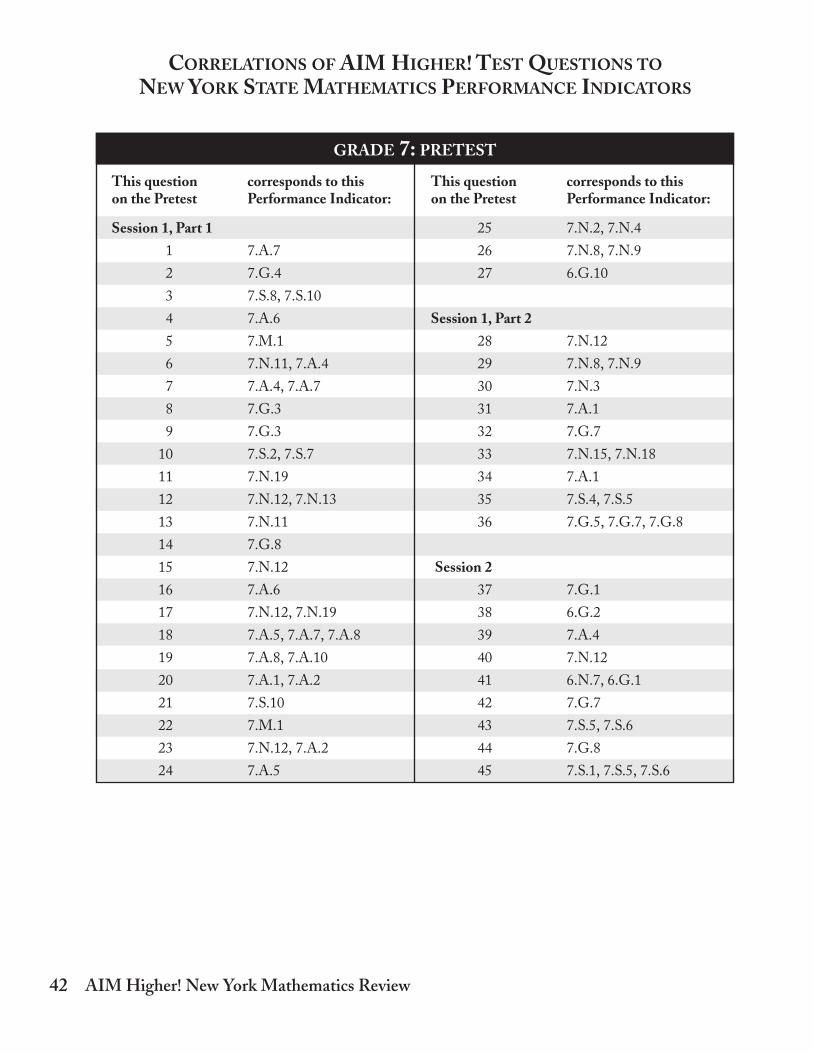
42 AIM Higher! New York Mathematics Review
This question corresponds to thison the Pretest Performance Indicator:
Session 1, Part 1
1 7.A.7
2 7.G.4
3 7.S.8, 7.S.10
4 7.A.6
5 7.M.1
6 7.N.11, 7.A.4
7 7.A.4, 7.A.7
8 7.G.3
9 7.G.3
10 7.S.2, 7.S.7
11 7.N.19
12 7.N.12, 7.N.13
13 7.N.11
14 7.G.8
15 7.N.12
16 7.A.6
17 7.N.12, 7.N.19
18 7.A.5, 7.A.7, 7.A.8
19 7.A.8, 7.A.10
20 7.A.1, 7.A.2
21 7.S.10
22 7.M.1
23 7.N.12, 7.A.2
24 7.A.5
This question corresponds to thison the Pretest Performance Indicator:
25 7.N.2, 7.N.4
26 7.N.8, 7.N.9
27 6.G.10
Session 1, Part 2
28 7.N.12
29 7.N.8, 7.N.9
30 7.N.3
31 7.A.1
32 7.G.7
33 7.N.15, 7.N.18
34 7.A.1
35 7.S.4, 7.S.5
36 7.G.5, 7.G.7, 7.G.8
Session 2
37 7.G.1
38 6.G.2
39 7.A.4
40 7.N.12
41 6.N.7, 6.G.1
42 7.G.7
43 7.S.5, 7.S.6
44 7.G.8
45 7.S.1, 7.S.5, 7.S.6
CORRELATIONS OF AIM HIGHER! TEST QUESTIONS TONEW YORK STATE MATHEMATICS PERFORMANCE INDICATORS
GRADE 7: PRETEST

Correlation Charts 43
This question corresponds to thison the Posttest Performance Indicator:
Session 1, Part 1
1 7.N.19, 7.M.11
2 7.S.8, 7.S.10
3 7.S.2, 7.S.6
4 7.S.10
5 7.N.19
6 6.G.10
7 7.N.5
8 6.N.18
9 7.N.3, 7.N.12
10 7.N.12
11 7.A.1
12 7.G.1
13 7.A.9
14 7.S.5
15 7.N.8, 7.N.9
16 7.G.7
17 5.G.4
18 7.N.19
19 7.A.6
20 7.A.4
21 7.N.12
22 7.S.5
23 6.G.10
24 7.A.4
This question corresponds to thison the Posttest Performance Indicator:
25 7.N.12
26 7.M.1
27 6.G.10
Session 1, Part 2
28 6.G.2
29 7.N.9
30 7.S.5
31 7.G.4
32 6.N.11, 7.N.12
33 7.A.5
34 7.A.1
35 5.N.12, 7.N.4, 7.N.8
36 7.N.12, 7.G.7
Session 2
37 7.S.2, 7.S.6
38 7.N.12, 7.A.9
39 7.N.8, 7.N.9
40 7.M.1
41 7.S.8, 7.S.10
42 7.M.1
43 7.S.6
44 7.G.7
45 6.G.2, 7.M.11, 7.S.10
GRADE 7: POSTTEST
CORRELATIONS OF AIM HIGHER! TEST QUESTIONS TONEW YORK STATE MATHEMATICS PERFORMANCE INDICATORS

44 AIM Higher! New York Mathematics Review
Performance Indicator Lessons
Students will understand meanings of operations and procedures, and how they relate to one another.
Operations8.N.1 Develop and apply the laws of exponents for multiplication and division 2.1, 2.3, 2.4,
2.8, 2.9
8.N.2 Evaluate expressions with integral exponents 2.2, 2.8, 2.9
8.N.3 Read, write, and identify percents less than 1% and greater than 100% 2.5–2.7
8.N.4 Apply percents to: 2.5–2.7TaxPercent increase/decreaseSimple interestSale priceCommissionInterest ratesGratuities
Students will compute accurately and make reasonable estimates.
Estimation8.N.5 Estimate a percent of quantity, given an application 2.5–2.7, 2.11
8.N.6 Justify the reasonableness of answers using estimation 2.11
CORRELATIONS OF NEW YORK STATE MATHEMATICSPERFORMANCE INDICATORS TO AIM HIGHER! LESSONS: GRADE 8
NUMBER SENSE AND OPERATIONS STRAND
Performance Indicator Lessons
Students will represent and analyze algebraically a wide variety of problem solving situations.
Variables and Expressions8.A.1 Translate verbal sentences into algebraic inequalities 3.1, 3.2, 3.5
8.A.2 Write verbal expressions that match given mathematical expressions 3.1, 3.2
8.A.3 Describe a situation involving relationships that matches a given graph 3.1, 3.2
8.A.4 Create a graph given a description or an expression for a situation involving a linear or nonlinear relationship 3.7, 3.8
8.A.5 Use physical models to perform operations with polynomials 3.3
ALGEBRA STRAND
continued

Correlation Charts 45
GRADE 8
Performance Indicator Lessons
Students will perform algebraic procedures accurately.
Variables and Expressions8.A.6 Multiply and divide monomials 3.3, 3.4
8.A.7 Add and subtract polynomials (integer coefficients) 3.3, 3.4
8.A.8 Multiply a binomial by a monomial or a binomial (integer coefficients) 3.1–3.5
8.A.9 Divide a polynomial by a monomial (integer coefficients) Note: The degree of the denominator is less than or equal to the degree of the numerator for all variables. 3.1–3.5
8.A.10 Factor algebraic expressions using the GCF 3.2
8.A.11 Factor a trinomial in the form ax2 + bx + c ; a = 1 and c having no more than three sets of factors 3.2
Equations and Inequalities8.A.12 Apply algebra to determine the measure of angles formed by or contained in parallel
lines cut by a transversal and by intersecting lines 4.1
8.A.13 Solve multi-step inequalities and graph the solution set on a number line 3.6
8.A.14 Solve linear inequalities by combining like terms, using the distributive property, or moving variables to one side of the inequality (include multiplication or division of inequalities by a negative number) 3.1, 3.3, 3.5
Students will recognize, use, and represent algebraically patterns, relations, and functions.
Patterns, Relations, and Functions8.A.15 Understand that numerical information can be represented in multiple ways: 3.6, 3.9,
arithmetically, algebraically, and graphically 6.1–6.5
8.A.16 Find a set of ordered pairs to satisfy a given linear numerical pattern (expressed algebraically); then plot the ordered pairs and draw the line 3.6–3.9
8.A.17 Define and use correct terminology when referring to function (domain and range) 3.6
8.A.18 Determine if a relation is a function 3.6
8.A.19 Interpret multiple representations using equation, table of values, and graph 3.9, 3.11,6.1–6.5
ALGEBRA STRAND, cont.
continued

46 AIM Higher! New York Mathematics Review
GRADE 8
Performance Indicator Lessons
Students will use visualization and spatial reasoning to analyze characteristics and properties of geometric shapes.
Contructions8.G.0 Construct the following using a straight edge and compass:
Segment congruent to a segment Angle congruent to an anglePerpendicular bisectorAngle bisector 4.4
Students will identify and justify geometric relationships, formally and informally.
Geometric Relationships8.G.1 Identify pairs of vertical angles as congruent 4.1, 4.2
8.G.2 Identify pairs of supplementary and complementary angles 4.1, 4.2
8.G.3 Calculate the missing angle in a supplementary or complementary pair 4.1, 4.2
8.G.4 Determine angle pair relationships when given two parallel lines cut by a transversal 4.1, 4.2
8.G.5 Calculate the missing angle measurements when given two parallel lines cut by a transversal 4.1, 4.2, 4.7
8.G.6 Calculate the missing angle measurements when given two intersecting lines and 4.1, 4.2, 4.6,an angle 4.7
Students will apply transformations and symmetry to analyze problem solving situations.
Transformational Geometry8.G.7 Describe and identify transformations in the plane, using proper function notation
(rotations, reflections, translations, and dilations) 4.5
8.G.8 Draw the image of a figure under rotations of 90 and 180 degrees 4.5
8.G.9 Draw the image of a figure under a reflection over a given line 4.5
8.G.10 Draw the image of a figure under a translation 4.5
8.G.11 Draw the image of a figure under a dilation 4.5
8.G.12 Identify the properties preserved and not preserved under a reflection, rotation,translation, and dilation 4.5
GEOMETRY STRAND
continued

Students will apply coordinate geometry to analyze problem solving situations.
Coordinate Geometry8.G.13 Determine the slope of a line from a graph and explain the meaning of slope as a
constant rate of change 3.9
8.G.14 Determine the y-intercept of a line from a graph and be able to explain the y-intercept 3.9
8.G.15 Graph a line using a table of values 3.9
8.G.16 Determine the equation of a line given the slope and the y-intercept 3.9
8.G.17 Graph a line from an equation in slope-intercept form (y = mx + b) 3.9
8.G.18 Solve systems of equations graphically (only linear, integral solutions, y = mx + b format,no vertical/horizontal lines) 3.10, 3.11
8.G.19 Graph the solution set of an inequality on a number line 3.10
8.G.20 Distinguish between linear and nonlinear equations ax2 + bx + c ; a = 1 (only graphically) 3.11
8.G.21 Recognize the characteristics of quadratics in tables, graphs, equations, and situations 3.11
GEOMETRY STRAND, cont.
Correlation Charts 47
GRADE 8
Performance Indicator Lessons
Students will determine what can be measured and how, using appropriate methods and formulas.
Units of Measurement8.M.1 Solve equations/proportions to convert to equivalent measurements within metric and
customary measurement systems. Note: Also allow Fahrenheit to Celsius and vice versa. 5.1–5.3, 5.9
MEASUREMENT STRAND
Note: The eighth-grade standards end with the first Performance Indicator of the Measurement Strand.There is no Statistics and Probability Strand.

48 AIM Higher! New York Mathematics Review
Lesson Performance Indicators
1.1 Reasoning about Word Problems Problem Solving
1.2 Problem-Solving Strategies Problem Solving
1.3 Understanding Mathematical Language Problem Solving
2.1 Discovering Numbers 8.N.1–8.N.4
2.2 Ways to Express Numbers 8.N.1–8.N.4
2.3 Prime and Composite Numbers 5.N.12–5.N.15
2.4 Properties and Identities 8.N.1
2.5 Performing Operations 8.N.3, 8.N.4
2.6 Operations with Fractions, Ratios, and Proportions 8.N.3, 8.N.4
2.7 Operations with Decimals and Percents 8.N.3–8.N.5
2.8 Operations with Exponents and Radicals 8.N.1, 8.N.2
2.9 Operations with Scientific Notation 8.N.1, 8.N.2
2.10 Operations with Absolute Value 6.N.13
2.11 Forming Estimates 8.N.5, 8.N.6
3.1 Variables, Expressions, and Equations 8.A.1–8.A.3, 8.A.8, 8.A.9, 8.A.14
3.2 Simplifying Algebraic Expressions 8.A.1–8.A.3, 8.A.8, 8.A.9, 8.A.11
3.3 Solving Equations with One Variable 8.A.6, 8.A.7, 8.A.8, 8.A.9, 8.A.14
3.4 Solving Equations with Two Variables 8.A.6, 8.A.7
3.5 Solving Inequalities 8.A.1, 8.A.14
3.6 Sets, Relations, Functions, and Sequences 8.A.13, 8.A.15, 8.A.16
3.7 Positive, Negative, and Mixed Ordered Pairs 8.A.4, 8.A.16
3.8 Graphing Linear Equations 8.A.4, 8.A.16
3.9 Interpreting Graphs 8.A.15, 8.A.16, 8.A.19
3.10 Graphing Inequalities 8.A.20, 8.A.21
3.11 Linear, Quadratic, and Exponential Growth 8.A.20, 8.A.22, 8.A.23
4.1 Points, Lines, and Angles 8.A.12, 8.G.1–8.G.6
4.2 Two- and Three-Dimensional Shapes 8.G.1–8.G.6
4.3 Circles 7.G.1, 7.M.8
4.4 Geometric Constructions 8.G.18
4.5 Symmetry, Transformations, and Tessellations 8.G.7–8.G.12
4.6 The Pythagorean Theorem 8.G.6
4.7 Right Triangle Trigonometry 8.A.12, 8.G.5, 8.G.6
CORRELATIONS OF AIM HIGHER! LESSONSTO NEW YORK STATE MATHEMATICS PERFORMANCE INDICATORS
GRADE 8: PERFORMANCE INDICATORS ADDRESSED
continued

Correlation Charts 49
CORRELATIONS OF AIM HIGHER! LESSONSTO NEW YORK STATE MATHEMATICS PERFORMANCE INDICATORS (CONT.)
*Optional: The concepts and skills in this lesson are not assessed in grade 8. This material may be used for enrichment, to challenge more advanced students, and/or as preparation for high school.
Lesson Performance Indicators
5.1 Estimating Measurements 8.M.1
5.2 Precision, Accuracy, and Significant Digits 8.M.1
5.3 Converting Customary and Metric Units 8.M.1
5.4 Measuring Length, Perimeter, and Circumference 7.G.1
5.5 Measuring Area 6.G.2, 6.G.7
5.6 Measuring Volume and Capacity 7.G.2, 7.M.2
5.7 Measuring Surface Area 7.G.4, 7.M.11
5.8 Effects of Changing Dimensions 6.A.6, 7.G.1, 7.G.2, 7.G.4
5.9 Measuring Weight, Mass, and Density 8.M.1
5.10 Measuring Rate and Velocity 6.N.6, 7.A.6
6.1 Data Collection: Sampling 7.S.1
6.2 Displaying Data: Simple Graphs 7.S.2, 7.S.3, 7.S.6
6.3 Displaying Data: Line Graphs and Scatter Plots 7.S.3, 7.S.6
6.4 Displaying Data: Histograms and Related Graphs 7.S.6
6.5 Central Tendencies and Box-and-Whisker Plots 7.S.4, 7.S.5
6.6 Introduction to Probability and Odds 7.S.7–7.S.12
6.7 Counting Strategies *See note.
6.8 Uncertainty and Misuse of Statistics 7.S.7
GRADE 8: PERFORMANCE INDICATORS ADDRESSED

50 AIM Higher! New York Mathematics Review
This question corresponds to thison the Pretest Performance Indicator:
Session 1, Part 1
1 5.A.8
2 8.A.14
3 8.A.2
4 8.N.1
5 7.G.1
6 5.A.8
7 8.N.3
8 8.G.6
9 7.S.1
10 8.A.14
11 8.A.1
12 8.G.3
13 8.M.1
14 8.A.1
15 8.A.2
16 8.N.5
17 8.N.4
18 8.M.1
19 8.A.1, 8.A.2
20 7.A.6, 7.G.4
21 8.N.2
22 8.N.1
23 8.M.1
24 8.G.16
This question corresponds to thison the Pretest Performance Indicator:
25 8.G.7
26 8.A.1
27 8.A.8
Session 1, Part 2
28 8.A.9
29 8.N.6
30 8.A.19
31 8.N.4
32 8.A.1, 8.A.14
33 8.N.4
34 8.G.6
35 7.S.5
36 8.A.16
Session 2
37 7.G.1
38 8.A.2
39 8.M.1
40 6.G.2, 7.G.1
41 6.G.2, 7.G.8
42 8.N.4
43 7.S.10, 8.N.4
44 8.A.1
45 8.G.15
CORRELATIONS OF AIM HIGHER! TEST QUESTIONS TONEW YORK STATE MATHEMATICS PERFORMANCE INDICATORS
GRADE 8: PRETEST

Correlation Charts 51
This question corresponds to thison the Posttest Performance Indicator:
Session 1, Part 1
1 8.G.7
2 8.A.2
3 6.G.2
4 8.M.1
5 8.G.17
6 Problem Solving
7 Problem, Solving, 8.A.19
8 8.A.6
9 8.G.3
10 7.S.1, 7.S.9
11 8.G.3
12 8.N.6
13 8.N.1, 8.N.2
14 7.S.10
15 7.M.1
16 8.A.6
17 7.G.1
18 8.N.4
19 8.A.14
20 7.S.1
21 8.N.5, 8.A.19
22 7.N.2
23 7.N.2
24 8.N.6
This question corresponds to thison the Posttest Performance Indicator:
25 8.N.4
26 7.A.8
27 8.M.1
Session 1, Part 2
28 8.A.4
29 7.G.1
30 7.S.5
31 8.M.1
32 8.A.14
33 6.A.6, 6.M.1
34 7.A.6, 7.G.4
35 8.G.6
36 8.A.7
Session 2
37 6.A.6, 6.G.2
38 8.M.1
39 5.G.11, 7.G.8
40 7.S.1, 7.S.3, 7.S.6
41 8.N.4
42 7.S.8, 7.S.10
43 8.G.16, 8.G.17
44 6.G.7, 7.G.1
45 8.A.12, 8.G.3
GRADE 8: POSTTEST
CORRELATIONS OF AIM HIGHER! TEST QUESTIONS TONEW YORK STATE MATHEMATICS PERFORMANCE INDICATORS


716966